Tracking Geographies
Looking at data in different resolutions can help us better understand the connections between health and the places where we live, work, and play. Resolution is the detail with which a map depicts the location and shape of geographic features, boundaries, and areas. The Tracking Network allows you visualize data in many different resolutions, and is working towards getting even more localized, finer resolution data for health and environmental data.
Data by Geo-Political Boundaries
Data by geo-political boundaries is the most common way to view data on the Tracking Network. You may be able to look at larger or coarser resolution data (national or state), or finer resolution data (county or census tract), depending on the data set. Finer resolution data can help us identify trends in neighborhoods and can pinpoint areas of concern for a health or environmental issue.
This map shows the same data measure, but at different geographic resolutions. The left is an example of a national by state geographic resolution and the right is national by county geographic resolution. Looking at data at different resolutions help identify where there may be differences between locations.
Data by Population-Based Geographies
Some data sets have too few cases to show on a map at finer resolution geo-political geographies. This could be because there are only a few cases reported for that area, or that it is a rare health condition (such as childhood cancer). If there is a small number of case counts, data is suppressed or hidden at the geo-political boundary level, such as county level, to protect the privacy of individuals affected by these conditions. This is especially true in counties and census tracts with low populations.
To visualize these data sets in a meaningful way, the Tracking Network has developed population-based geographies. This can be done by combining census tracts or counties to meet a minimum population threshold to display the data. Population-based geographies are useful to see trends based on populations for many environmental, community, and health data, especially in areas where there are high or low populations in counties.
The Tracking Network has different population-based geographies:
- State by 5,000 Population
- State by 20,000 Population
The left is an example of a state by county geographic resolution for Colorado, and the right is an example of a state by 20,000 population geographic resolution for Colorado. For areas that are rural, counties are combined to reach the population minimum of 20,000 people. For areas that are urban, like Denver, smaller areas are created by combining census tracts to reach the population minimum of 20,000 people.
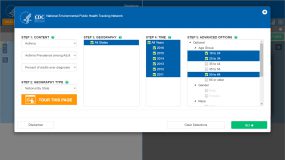
Explore available data on CDC’s Data Explorer using population-based geographies:
-
- Populations and Vulnerability
- Demographics
- Health Status
- Socioeconomic Status
- Cancer
- Incidence of Breast Cancer
- Incidence of Colorectal Cancer
- Incidence of Lung and Bronchus Cancers
- Incidence of Melanoma
- Incidence of Non-Hodgkin’s Lymphoma
- Incidence of Prostate Cancer
- Populations and Vulnerability
For more information on how the Tracking Program created the population-based geographies, see the Resources section.
Current Projects and Partnerships in Tracking Geographies
Cancer Registries
CDC’s Tracking Program is currently working with The National Program of Cancer Registries (NPCR) to create indicators for cancer prevalence that will utilize the Tracking Program’s population-based geographies.
Special Geographies Developed by Recipients
CDC’s Tracking Program provides funding to state and local health departments to develop local tracking networks. Tracking Program grant recipients in Arizona, New Jerseyexternal icon, New York City, and Utah have developed different geographies to better understand environmental and health data in their jurisdictions.
Hospitalization & Emergency Department Data
Tracking Program grant recipients submit hospitalization and emergency department data for different health concerns for display on CDC’s Tracking Network. CDC is working to display asthma and heart attack data using population-based geographies.
- Developing a surveillance system of sub-county data: Finding suitable population thresholds for geographic aggregationsexternal icon. Spatial and Spatio-temporal Epidemiology. June 2020.
- Lessons Learned From the Environmental Public Health Tracking Sub-County Data Pilot Projectexternal icon. Journal of Public Health Practice and Management. September/October 2019.
- If you’d like to use the population-based geographies for your own activities and research, please visit the EPHTN Subcounty Githubexternal icon