Drought

Data on drought duration and severity in the United States can be used to better understand the connection between drought, other environmental conditions, and health effects. Although many factors influence how drought will affect a community, drought trend data and other related indicators can be used to prepare for and prevent potential health risks.
We Track That
The Tracking Network includes data on drought duration and severity from the United States Drought Monitorexternal icon (USDM) and the Standardized Precipitation Evapotranspiration Indexexternal icon (SPEI) to track drought trends in the United States. Although many factors influence how drought will affect a community, drought trend data and other related indicators can be used to prepare for and prevent potential health risks.
Types of Data
The drought measures on the Tracking Network can be used to examine local, state, regional, and national trends in drought at the county level. Looking at trends can help us learn more about the relationship between drought-related environmental exposures and health outcomes, and is important for community planning purposes, allocating drought relief, and for other drought discussions.
The Tracking Network provides historical drought data from both the SPEI and the USDM. The SPEI and USDM drought measures are calculated using different methodologies, and both can be used to monitor trends over time.
Counties Currently Experiencing Drought: Data is reported weekly and reflects whether 50% or more of a county was in moderate drought or greater for the latest week.
Maximum Number of Consecutive Weeks a County was in Drought by Year: SPEI data is available by year from 1980-present; and USDM data is available by year from 2000-present. For both the SPEI and USDM methodologies, the data can be stratified by categorial drought severity or cumulative drought severity.
Total Number of Weeks a County Was in Drought (Cumulative): SPEI data is available from 1980-present; and USDM data is available from 2000-present. The values are a cumulative total of weeks a county was in drought for the entire period of record. For both the SPEI and USDM methodologies, the data can be stratified by categorial drought severity or cumulative drought severity.
Total Number of Weeks a County Was in Drought by Year: SPEI data is available by year from 1980-present; and USDM data is available by year from 2000-present. For both the SPEI and USDM methodologies, the data can be stratified by categorial drought severity or cumulative drought severity.
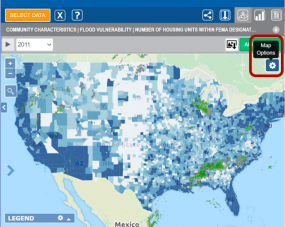
Add layers to any map.
Click on the gear icon to select layers: surface smoke, current radar, transportation noise, active Atlantic cyclones. Try it!