Precipitation & Flooding

Floods are one of the deadliest of all weather-related hazards in the United States.
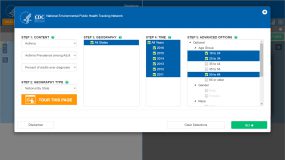
We Track That
We partner with the Climate and Health Program to host data from several sources to track extreme precipitation and flooding in the United States. These data can help communities prepare for and respond to weather-related events.
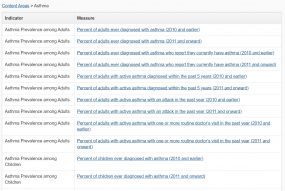
Types of Data
The Tracking Network provides data about extreme precipitation and the vulnerabilities that increase risk for health effects related to those extreme weather events.
Historical Precipitation
This indicator provides the number of extreme precipitation days and the monthly estimates of precipitation by county and census tract for every state except Alaska and Hawaii.
Precipitation & Flooding Projections
This indicator shows modeled precipitation data on projected extreme precipitation days and projected maximum precipitation during an extreme event. The projected data result from comparing projected values for different time periods (early 21st century, mid-21st century, and late 21st century) to historical data from 1976-2005. Data are available nationwide at the county level.
Vulnerability & Preparedness: Precipitation & Flooding
This indicator provides county-level estimates on the total area and percentage of total areas within a flood hazard zone, as well as the number of residents and housing units per county in a 100-year flood zone. The data use flood hazard risk areas defined by the Federal Emergency Management Agency (FEMA) and the Environmental Protection Agency (EPA).
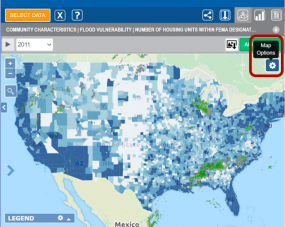
Add layers to any map.
Click on the gear icon to select layers: surface smoke, current radar, transportation noise, active Atlantic cyclones. Try it!
Data in Action
Tracking precipitation and flooding in a standard way over time can help us
- determine trends over time and place,
- evaluate extreme weather events at the national level, while allowing for comparisons across states,
- better understand the possible health effects and risks to specific groups of people,
- identify conditions that make people vulnerable during extreme weather events, and
- design interventions and communication efforts for at-risk populations.