* No cases of anthrax; eastern equine encephalitis non-neuroinvasive virus disease; poliomyelitis, paralytic; poliovirus infection, nonparalytic; Powassan virus non-neuroinvasive virus disease; severe acute respiratory syndrome-associated coronavirus disease; smallpox; western equine encephalitis virus disease, neuroinvasive and non-neuroinvasive; yellow fever; and viral hemorrhagic fevers were reported in the United States during 2012. Data on chronic hepatitis B and hepatitis C virus infection (past or present) are not included because they are undergoing data quality review.
Persons using assistive technology might not be able to fully access information in this file. For assistance, please send e-mail to: mmwrq@cdc.gov. Type 508 Accommodation and the title of the report in the subject line of e-mail.
Summary of Notifiable Diseases — United States, 2012
Please note: An erratum has been published for this article. To view the erratum, please click here.
Preface
The Summary of Notifiable Diseases — United States, 2012 contains the official statistics, in tabular and graphic form, for the reported occurrence of nationally notifiable infectious diseases in the United States for 2012. Unless otherwise noted, the data are final totals for 2012 reported as of June 30, 2013. These statistics are collected and compiled from reports sent by state health departments and territories to the National Notifiable Diseases Surveillance System (NNDSS), which is operated by CDC in collaboration with the Council of State and Territorial Epidemiologists (CSTE). The Summary is available at http://www.cdc.gov/mmwr/mmwr_nd/index.html. This site also includes Summary publications from previous years.
The Highlights section presents noteworthy epidemiologic and prevention information for 2012 for selected diseases and additional information to aid in the interpretation of surveillance and disease-trend data. Part 1 contains tables showing incidence data for the nationally notifiable infectious diseases reported during 2012.* The tables provide the number of cases reported to CDC for 2012 and the distribution of cases by month, geographic location, and patients' demographic characteristics (e.g., age, sex, race, and ethnicity). Part 2 contains graphs and maps that depict summary data for selected notifiable infectious diseases described in tabular form in Part 1. Part 3 contains tables that list the number of cases of notifiable diseases reported to CDC since 1981. This section also includes a table enumerating deaths associated with specified notifiable diseases reported to CDC's National Center for Health Statistics (NCHS) during 2004–2010. The Selected Reading section presents general and disease-specific references for notifiable infectious diseases. These references provide additional information on surveillance and epidemiologic concerns, diagnostic concerns, and disease-control activities.
Comments and suggestions from readers are welcome. To increase the usefulness of future editions, comments regarding the current report and descriptions of how information is or could be used are invited. Comments should be sent to the Data Operations Team at soib@cdc.gov.
Background
The infectious diseases designated as notifiable at the national level during 2012 are listed in this section. A notifiable disease is one for which regular, frequent, and timely information regarding individual cases is considered necessary for the prevention and control of the disease. A brief history of the reporting of nationally notifiable infectious diseases in the United States is available at http://www.cdc.gov/lyme/. In 1961, CDC assumed responsibility for the collection and publication of data on nationally notifiable diseases. NNDSS is neither a single surveillance system nor a method of reporting. Rather, it is a 'system of systems', which is coordinated at the national level across disease-specific programs in order to optimize data compilation, analysis, and dissemination of notifiable disease data.
Case notifications about nationally notifiable diseases are sent to CDC voluntarily without personal identifiers by state and selected local health departments. Data about nationally notifiable diseases are obtained through reportable disease surveillance. Health-care providers, hospitals, laboratories, and other public health reporters are required by legislation, regulation, or rules to report cases about reportable diseases and conditions to local, county, state, or territorial public health authorities. Case-reporting of reportable diseases at the local level protects the public's health by ensuring the proper identification and follow-up of cases. Public health workers ensure that persons who are already ill receive appropriate treatment; trace contacts who need vaccines, treatment, quarantine, or education; investigate and halt outbreaks; eliminate environmental hazards; and close premises where spread has occurred. Surveillance of notifiable conditions helps public health authorities monitor the effect of notifiable conditions, measure disease trends, assess the effectiveness of control and prevention measures, identify populations or geographic areas at high risk, allocate resources appropriately, formulate prevention strategies, and develop public health policies. Monitoring surveillance data enables public health authorities to detect sudden changes in disease occurrence and distribution, identify changes in agents and host factors, and detect changes in health-care practices.
The list of nationally notifiable infectious diseases is revised periodically. A disease might be added to the list as a new pathogen emerges, or a disease might be deleted as its incidence declines. Public health officials at state health departments and CDC collaborate in determining which diseases should be nationally notifiable. CSTE, with input from CDC, makes recommendations annually for additions and deletions. Although disease reporting is mandated by legislation or regulation at the state and local levels, state reporting to CDC is voluntary. Reporting completeness of notifiable diseases is highly variable and related to the condition or disease being reported (1). The list of diseases considered reportable varies by reporting jurisdiction and year. The list of notifiable diseases (the diseases or conditions that state and local health departments send to CDC) also might vary by year. Current and historic national public health surveillance case definitions used for classifying and enumerating cases consistently at the national level across reporting jurisdictions are available at http://wwwn.cdc.gov/nndss/script/casedefDefault.aspx.
Infectious Diseases Designated as Notifiable at the National Level During 2012*
Anthrax
Arboviral diseases, neuroinvasive and nonneuroinvasive
California serogroup viruses
Eastern equine encephalitis virus
Powassan virus
St. Louis encephalitis virus
West Nile virus
Western equine encephalitis virus
Babesiosis
Botulism
foodborne
infant
other (wound and unspecified)
Brucellosis
Chancroid
Chlamydia trachomatis infection
Cholera
toxigenic Vibrio cholerae 01 or 0139
Coccidioidomycosis
Cryptosporidiosis†
Cyclosporiasis
Dengue virus infections
Dengue fever
Dengue hemorrhagic fever
Dengue shock syndrome
Diphtheria
Ehrlichiosis/Anaplasmosis
Ehrlichia chaffeensis
Ehrlichia ewingii
Anaplasma phagocytophilum
Undetermined human ehrlichiosis/anaplasmosis
Giardiasis
Gonorrhea
Haemophilus influenzae, invasive disease
Hansen disease (leprosy)
Hantavirus pulmonary syndrome
Hemolytic uremic syndrome, post-diarrheal
Hepatitis, viral
Hepatitis A, acute†
Hepatitis B, acute†
Hepatitis B virus, perinatal infection
Hepatitis B, chronic†
Hepatitis C, acute†
Hepatitis C, past or present†
Human Immunodeficiency Virus (HIV) infection diagnosis§
Influenza-associated pediatric mortality
Invasive pneumococcal disease
Legionellosis
Listeriosis
Lyme disease
Malaria
Measles
Meningococcal disease
Mumps†
Novel influenza A virus infections
Pertussis
Plague
Poliomyelitis, paralytic
Poliovirus infection, nonparalytic
Psittacosis
Q fever
Acute
Chronic
Rabies
Animal
Human
Rubella
Rubella, congenital syndrome
Salmonellosis†
Severe acute respiratory syndrome-associated coronavirus (SARS-CoV) disease
Shiga toxin-producing Escherichia coli (STEC)
Shigellosis†
Smallpox
Spotted fever rickettsiosis
Streptococcal toxic-shock syndrome
Syphilis
Syphilis, congenital
Tetanus
Toxic-shock syndrome (other than streptococcal)
Trichinellosis
Tuberculosis
Tularemia
Typhoid fever
Vancomycin-intermediate Staphylococcus aureus (VISA) infection
Vancomycin-resistant Staphylococcus aureus (VRSA) infection
Varicella (morbidity)
Varicella (mortality)
Vibriosis†
any species of the family Vibrionaceae, other than toxigenic Vibrio cholerae 01 or 0139
Viral Hemorrhagic Fever
Crimean-Congo Hemorrhagic fever virus
Ebola virus
Lassa virus
Lujo virus
Marburg virus
New World Arenaviruses (Guanarito, Lujo, Machupo, Junin, and Sabia viruses)
Yellow fever
* This list reflects position statements approved in 2011 by the Council of State and Territorial Epidemiologists (CSTE) for national surveillance, which were implemented in January 2012. No additions or deletions of diseases or conditions were made to the list of nationally notifiable infectious diseases. National surveillance case definitions for these diseases and conditions are available at http://wwwn.cdc.gov/nndss/.
† The year 2012 reflects a modified surveillance case definition for this condition, per approved 2011 CSTE position statements.
§ AIDS has been reclassified as HIV stage III.
Data Sources
Provisional data concerning the reported occurrence of nationally notifiable infectious diseases are published weekly in MMWR. After each reporting year, staff in state health departments finalize reports of cases for that year with local or county health departments and reconcile the data with reports previously sent to CDC throughout the year. These data are compiled in final form in the Summary.
Notifiable disease reports are the authoritative and archival counts of cases. They are approved by the appropriate chief epidemiologist from each submitting state or territory before being published in the Summary. Data published in MMWR Surveillance Summaries or other surveillance reports produced by CDC programs might differ from data reported in the annual Summary because of differences in the timing of reports, the source of the data, or surveillance methodology.
Data in the Summary were derived primarily from reports transmitted to CDC from health departments in the 50 states, five territories, New York City, and the District of Columbia. Data were reported for MMWR weeks 1–52, which correspond to the period for the week ending January 7, 2012 through the week ending December 29, 2012. More information regarding infectious notifiable diseases, including national surveillance case definitions, is available at http://wwwn.cdc.gov/nndss. Policies for reporting notifiable disease cases can vary by disease or reporting jurisdiction. The case-status categories used to determine which cases reported to NNDSS are published by disease or condition and are listed in the print criteria column of the 2012 NNDSS event code list (Exhibit).
The print criteria for NNDSS are as follows: for a report of a nationally notifiable disease to print in MMWR, the reporting state or territory must have designated the disease reportable in their state or territory for the year corresponding to the year of report to CDC. After the criterion is met, the disease-specific criteria listed in the Exhibit are applied. When the above-listed table indicates that all reports will be earmarked for printing, this means that cases designated with unknown or suspect case confirmation status will print just as probable and confirmed cases will print. Because CSTE position statements are not customarily finalized until July of each year, the NNDSS data for the newly added conditions are not usually available from all reporting jurisdictions until January of the year following the approval of the CSTE position statement.
Final data for certain diseases are derived from the surveillance records of the CDC programs listed below. Requests for further information regarding these data should be directed to the appropriate program.
Office of Public Health Scientific Services
National Center for Health Statistics (NCHS)
Office of Vital and Health Statistics Systems (deaths from selected notifiable diseases)
Office of Infectious Diseases
National Center for HIV/AIDS, Viral Hepatitis, STD and TB Prevention
Division of HIV/AIDS Prevention (AIDS and HIV infection), Division of Viral Hepatitis, Division of STD Prevention (chancroid; Chlamydia trachomatis, genital infection; gonorrhea; and syphilis), Division of Tuberculosis Elimination (tuberculosis)
National Center for Immunization and Respiratory Diseases
Influenza Division (influenza-associated pediatric mortality, initial detections of novel influenza A virus infections)
Division of Viral Diseases, (poliomyelitis, varicella [morbidity and mortality], and SARS-CoV)
National Center for Emerging and Zoonotic Infectious Diseases
Division of Vector-Borne Diseases (arboviral diseases)
Division of Viral and Rickettsial Diseases (animal rabies)
NCHS postcensal estimates of the resident population of the United States for July 1, 2011–July 1, 2012, by year, county, single-year of age (range: 0 to ≥85 years), bridged-race, (white, black or African American, American Indian or Alaska Native, Asian or Pacific Islander), Hispanic origin (not Hispanic or Latino, Hispanic or Latino), and sex (Vintage 2011), prepared under a collaborative arrangement with the U.S. Census Bureau. Population estimates for states are available at http://www.cdc.gov/nchs/nvss/bridged_race/data_documentation.htm#vintage2011 as of June 13, 2013.
Population estimates for territories are 2012 estimates from the U.S. Census Bureau. The choice of population denominators for incidence reported in MMWR is based on 1) the availability of census population data at the time of preparation for publication and 2) the desire for consistent use of the same population data to compute incidence reported by different CDC programs. Incidence in the Summary is calculated as the number of reported cases for each disease or condition divided by either the U.S. resident population for the specified demographic population or the total U.S. resident population, multiplied by 100,000. When a nationally notifiable disease is associated with a specific age restriction, the same age restriction is applied to the population in the denominator of the incidence calculation. In addition, population data from states in which the disease or condition was not reportable or was not available are excluded from incidence calculations. Unless otherwise stated, disease totals for the United States do not include data for American Samoa, Guam, Puerto Rico, the Commonwealth of the Northern Mariana Islands, or the U.S. Virgin Islands.
Interpreting Data
Incidence data in the Summary are presented by the date of report to CDC as determined by the MMWR week and year assigned by the state or territorial health department, except for the domestic arboviral diseases, which are presented by date of diagnosis. Data are reported by the jurisdiction of the person's "usual residence" at the time of disease onset (http://wwwn.cdc.gov/nndss/document/11-SI-04.pdf). For certain nationally notifiable infectious diseases, surveillance data are reported independently to different CDC programs. For this reason, surveillance data reported by other CDC programs might vary from data reported in the Summary because of differences in 1) the date used to aggregate data (e.g., date of report or date of disease occurrence); 2) the timing of reports; 3) the source of the data; 4) surveillance case definitions; and 5) policies regarding case jurisdiction (i.e., which jurisdiction should submit the case notification to CDC).
Data reported in the Summary are useful for analyzing disease trends and determining relative disease numbers. However, reporting practices affect how these data should be interpreted. Disease reporting is likely incomplete, and completeness might vary depending on the disease and reporting state. The degree of completeness of data reporting might be influenced by the diagnostic facilities available, control measures in effect, public awareness of a specific disease, and the resources and priorities of state and local officials responsible for disease control and public health surveillance. Finally, factors such as changes in methods for public health surveillance, introduction of new diagnostic tests, or discovery of new disease entities can cause changes in disease reporting that are independent of the actual incidence of disease.
Public health surveillance data are published for selected racial/ethnic populations because these variables can be risk markers for certain notifiable diseases. Race and ethnicity data also can be used to highlight populations for focused prevention programs. However, caution must be used when drawing conclusions from reported race and ethnicity data. Different racial/ethnic populations might have different patterns of access to health care, potentially resulting in data that are not representative of actual disease incidence among specific racial/ethnic populations. Surveillance data reported to NNDSS are in either individual case-specific form or summary form (i.e., aggregated data for a group of cases). Summary data often lack demographic information (e.g., race); therefore, the demographic-specific rates presented in the Summary might be underestimated.
In addition, not all race and ethnicity data are collected or reported uniformly for all diseases, the standards for race and ethnicity have changed over time, and the transition in implementation to the newest race and ethnicity standard has taken varying amounts of time for different CDC surveillance systems. For example, in 1990, the National Electronic Telecommunications System for Surveillance (NETSS) was established to facilitate data collection and submission of case-specific data to CDC's National Notifiable Diseases Surveillance System, except for selected diseases. In 1990, NETSS implemented the 1977 Office of Management and Budget (OMB) standard for race and ethnicity, in which race and ethnicity were collected in one variable. Other surveillance programs implemented two variables for collection of race and ethnicity data. The 1997 OMB race and ethnicity standard, which requires collection of multiple races per person using multiple race variables, should have been implemented by federal programs beginning January 1, 2003. In 2003, the CDC Tuberculosis and HIV/AIDS programs were able to update their surveillance information systems to implement 1997 OMB standards. In 2005, the Sexually Transmitted Diseases Management Information System also was updated to implement the 1997 OMB standards. However, other diseases reported to the NNDSS using NETSS were undergoing a major change in the manner in which data were collected and reported to CDC. This change is caused by the transition from NETSS to the National Electronic Disease Surveillance System (NEDSS), which implemented the newer 1997 OMB standard for race and ethnicity. However, the transition from NETSS to NEDSS was slower than originally expected relative to reporting data to CDC using NEDSS; thus, some data are currently reported to CDC using NETSS formats, even if the data in the reporting jurisdictions are collected using NEDSS. Until the transition to NEDSS is complete, race and ethnicity data collected or reported to NETSS using different race and ethnicity standards will need to be converted to one standard. The data are now converted to the 1977 OMB standard originally implemented in NETSS. Although the recommended standard for classifying a person's race or ethnicity is based on self-reporting, this procedure might not always be followed.
Transition in NNDSS Data Collection and Reporting
Before 1990, data were reported to CDC as cumulative counts rather than as individual case reports. In 1990, using NETSS, states began electronically capturing and reporting individual cases to CDC without personal identifiers. In 2001, CDC launched NEDSS, now a component of the Public Health Information Network, to promote the use of data and information system standards that advance the development of efficient, integrated, and interoperable surveillance information systems at the local, state, and federal levels. One of the objectives of NEDSS is to improve the accuracy, completeness, and timeliness of disease reporting at the local, state, and national levels. One of the objectives of NEDSS is to improve the accurracy, completeness, and timeliness of disease reporting at the local, atate, and national levels. A major feature of NEDSS is the ability to capture data already in electronic form (e.g., electronic laboratory results, which are needed for case confirmation) rather than enter these data manually as in NETSS. Certain public health surveillance information systems are NEDSS-compatible. In 2001, CDC initiated development of the first NEDSS-compatible system, which is referred to as the NEDSS Base System (NBS). The first state went into production with the NBS in 2003. Since the development of the NBS, states and vendors have developed several other NEDSS compatible systems.
A total of 57 health departments (50 state health departments, 2 city health departments [New York City and Washington DC] and 5 territorial health departments) send CDC notifiable disease data for inclusion in this report. As of October 2012, all 50 state health departments use NEDSS-compatible public health surveillance information systems: 32 (64%) use state- or vendor-developed systems and 18 (36%) use the CDC-developed NBS. In addition, New York City uses a vendor-developed system and Washington DC uses both the NBS and a vendor-developed system. Lastly, as of October 2012, all five territorial health departments were not using NEDSS–compatible systems. Additional information concerning NEDSS is available at http://wwwn.cdc.gov/nndss/script/nedss.aspx.
Method for Identifying Which Nationally Notifiable Infectious Diseases Are Reportable
States and jurisdictions are sovereign entities. Reportable conditions are determined by laws and regulations of each state and jurisdiction. It is possible that some conditions deemed nationally notifiable might not be reportable in certain states or jurisdictions. Only data from reporting jurisdictions which made the nationally notifiable condition reportable are included in the tables of this report. This ensures the data displayed in this report are from population-based surveillance efforts, and are generally comparable across jurisdictions. When a nationally notifiable disease is not reportable in a reporting jurisdiction, an "N" indicator for "not reportable" is inserted in the table for the specified reporting jurisdiction and year. Determining which nationally notifiable infectious diseases are reportable in NNDSS reporting jurisdictions was decided by asking them to update previously analyzed results of the 2010 CSTE State Reportable Conditions Assessment (SRCA) individually, because the 2012 SRCA results were not available at the time this report was prepared. The 2010 assessment solicited information from each NNDSS reporting jurisdiction (all 50 U.S. states, the District of Columbia, New York City, and five U.S. territories) regarding which public health conditions were reportable for >6 months in 2010 by clinicians, laboratories, hospitals, or "other" public health reporters, as mandated by law or regulation. Additional background information about the SRCA has been published previously (2).
Revised International Health Regulations
In May 2005, the World Health Assembly adopted revised International Health regulations (IHR) (3) that went into effect in the United States on July 18, 2007. This international legal instrument governs the role of the World Health Organization (WHO) and its member countries, including the United States, in identifying, responding to, and sharing information about Public Health Emergencies of International Concern (PHEIC). A PHEIC is an extraordinary event that 1) constitutes a public health risk to other countries through international spread of disease, and 2) potentially requires a coordinated international response. All WHO member states are required to notify WHO of a potential PHEIC. WHO makes the final determination about the existence of a PHEIC.
IHR are designed to prevent and protect against the international spread of diseases while minimizing the effect on world travel and trade. Countries that have adopted these rules have a much broader responsibility to detect, respond to, and report public health emergencies that potentially require a coordinated international response in addition to taking preventive measures. IHR will help countries work together to identify, respond to, and share information about PHEIC.
The revised IHR reflects a conceptual shift from a predefined disease list to a framework of reporting and responding to events on the basis of an assessment of public health criteria, including seriousness, unexpectedness, and international travel and trade implications. A PHEIC is an event that falls within those criteria (further defined in a decision algorithm in Annex 2 of the revised IHR). Four conditions always constitute a PHEIC and do not require the use of the IHR decision instrument in Annex 2: severe acute respiratory syndrome (SARS), smallpox, poliomyelitis caused by wild-type poliovirus, and human influenza caused by a new subtype. Any other event requires the use of the decision algorithm to determine if it is a potential PHEIC. Examples of events that require the use of the decision instrument include, but are not limited to, cholera, pneumonic plague, yellow fever, West Nile fever, viral hemorrhagic fevers, and meningococcal disease. Other biologic, chemical, or radiologic events might fit the decision algorithm and also must be reported to WHO.
Health-care providers in the United States are required to report diseases, conditions, or outbreaks as determined by local, state, or territorial law and regulation, and as outlined in each state's list of reportable conditions. All health-care providers should work with their local, state, and territorial health agencies to identify and report events that might constitute a potential PHEIC occurring in their location. U.S. State and Territorial Departments of Health have agreed to report information about a potential PHEIC to the most relevant federal agency responsible for the event. In the case of human disease, the U.S. State or Territorial Departments of Health will notify CDC rapidly through existing formal and informal reporting mechanisms (4). CDC will further analyze the event based on the decision algorithm in Annex 2 of the IHR and notify the U.S. Department of Health and Human Services (DHHS) Secretary's Operations Center (SOC), as appropriate.
DHHS has the lead role in carrying out the IHR, in cooperation with multiple federal departments and agencies. DHHS SOC is the central body for the United States responsible for reporting potential events to WHO. The United States has 48 hours to assess the risk of the reported event. If authorities determine that a potential PHEIC exists, the WHO member country has 24 hours to report the event to WHO.
An IHR decision algorithm in Annex 2 has been developed to help countries determine whether an event should be reported. If any two of the following four questions can be answered in the affirmative, then a determination should be made that a potential PHEIC exists and WHO should be notified:
- Is the public health impact of the event serious?
- Is the event unusual or unexpected?
- Is there a significant risk of international spread?
- Is there a significant risk of international travel or trade restrictions?
Additional information concerning IHR is available at http://www.who.int/csr/ihr/en and http://www.cdc.gov/globalhealth/ihregulations.htm. At its annual meeting in June 2007, CSTE approved a position statement to support the implementation of IHR in the United States (4). CSTE also approved a position statement in support of the 2005 IHR adding initial detections of novel influenza A virus infections to the list of nationally notifiable diseases reportable to NNDSS, beginning in January 2007 (5).
- Doyle TJ, Glynn MK, Groseclose LS. Completeness of notifiable infectious disease reporting in the United States: an analytical literature review. Am J Epidemiol 2002;155:866–74.
- Jajosky R, Rey A, Park M, et al. Findings from the Council of State and Territorial Epidemiologists' 2008 assessment of state reportable and nationally notifiable conditions in the United States and considerations for the future. Public Health Manag Pract 2011;17:255–64.
- World Health Organization. Third report of Committee A. Annex 2. Geneva, Switzerland: World Health Organization; 2005. Available at http://whqlibdoc.who.int/publications/2008/9789241580410_eng.pdf.
- Council of State and Territorial Epidemiologists. Events that may constitute a public health emergency of international concern. Position statement 07-ID-06. Available at http://c.ymcdn.com/sites/www.cste.org/resource/resmgr/PS/07-ID-06.pdf.
- Council of State and Territorial Epidemiologists. Council of State and Territorial Epidemiologists position statement; 2007. National reporting for initial detections of novel influenza A viruses. Available at http://c.ymcdn.com/sites/www.cste.org/resource/resmgr/PS/07-ID-01.pdf.
|
EXHIBIT. Print criteria for conditions reported to the National Notifiable Diseases Surveillance System, 2012 |
||
|---|---|---|
|
Code |
Notifiable Condition |
Print Criteria*,†,§ |
|
11090 |
Anaplasma phagocytophilum |
Confirmed and probable; unknown from California (CA) |
|
10350 |
Anthrax |
Confirmed and probable; unknown from CA |
|
12010 |
Babesiosis |
Confirmed and probable; unknown from CA |
|
10530 |
Botulism, foodborne |
Confirmed; unknown from CA |
|
10540 |
Botulism, infant |
Confirmed |
|
10550 |
Botulism, other (includes wound) |
Confirmed; unknown from CA |
|
10548 |
Botulism, other (unspecified) |
Confirmed; unknown from CA |
|
10549 |
Botulism, wound |
Confirmed; unknown from CA |
|
10020 |
Brucellosis |
Confirmed and probable; unknown from CA |
|
10054 |
California serogroup viruses, neuroinvasive disease |
Data for publication received from ArboNET |
|
10061 |
California serogroup viruses, nonneuroinvasive disease |
Data for publication received from ArboNET |
|
10273 |
Chancroid |
All reports printed |
|
10274 |
Chlamydia trachomatis infection |
All reports printed |
|
10470 |
Cholera (toxigenic Vibrio cholerae O1 or O139) |
Confirmed; unknown from CA verified as confirmed |
|
11900 |
Coccidioidomycosis |
Confirmed; unknown from CA |
|
11580 |
Cryptosporidiosis |
Confirmed and probable; unknown from CA |
|
11575 |
Cyclosporiasis |
Confirmed and probable; unknown from CA |
|
10680 |
Dengue fever (DF) |
Confirmed and probable |
|
10685 |
Dengue hemorrhagic fever (DHF) |
Confirmed and probable |
|
10040 |
Diphtheria |
Confirmed, probable, and unknown |
|
10053 |
Eastern equine encephalitis virus, neuroinvasive disease |
Data for publication received from ArboNET |
|
10062 |
Eastern equine encephalitis virus, nonneuroinvasive disease |
Data for publication received from ArboNET |
|
11088 |
Ehrlichia chaffeensis |
Confirmed and probable; unknown from CA |
|
11089 |
Ehrlichia ewingii |
Confirmed and probable; unknown from CA |
|
11091 |
Ehrlichiosis/Anaplasmosis, undetermined |
Confirmed and probable; unknown from CA |
|
11570 |
Giardiasis |
Confirmed and probable; unknown from CA |
|
10280 |
Gonorrhea |
All reports printed |
|
10590 |
Haemophilus influenzae, invasive disease |
Confirmed, probable, and unknown |
|
10380 |
Hansen disease (leprosy) |
Confirmed; unknown from CA |
|
11590 |
Hantavirus pulmonary syndrome |
Confirmed and unknown from CA |
|
11550 |
Hemolytic uremic syndrome, postdiarrheal |
Confirmed, probable, and unknown from CA |
|
10110 |
Hepatitis A, acute |
Confirmed |
|
10100 |
Hepatitis B, acute |
Confirmed |
|
10104 |
Hepatitis B perinatal infection |
Confirmed |
|
10101 |
Hepatitis C, acute |
Confirmed |
|
11061 |
Influenza-associated pediatric mortality |
Confirmed |
|
10490 |
Legionellosis |
Confirmed; unknown from CA |
|
10640 |
Listeriosis |
Confirmed; unknown from CA |
|
11080 |
Lyme disease |
Confirmed |
|
10130 |
Malaria |
Confirmed; unknown from CA |
|
10140 |
Measles (rubeola), total |
Confirmed and unknown |
|
10150 |
Meningococcal disease (Neisseria meningitidis) |
Confirmed |
|
10180 |
Mumps |
Confirmed, probable, and unknown |
|
EXHIBIT. (Continued) Print criteria for conditions reported to the National Notifiable Diseases Surveillance System, 2012 |
||
|---|---|---|
|
Code |
Notifiable Condition |
Print Criteria*,†,§ |
|
10317 |
Neurosyphilis |
All reports printed |
|
11062 |
Novel influenza A virus infections, initial detections of |
Confirmed, unknown CA, verified confirmed |
|
10190 |
Pertussis |
Confirmed, probable, and unknown |
|
10440 |
Plague |
All reports printed |
|
10410 |
Poliomyelitis, paralytic |
Confirmed |
|
10405 |
Poliovirus infection, nonparalytic |
Confirmed |
|
10057 |
Powassan virus, neuroinvasive disease |
Data for publication received from ArboNET |
|
10063 |
Powassan virus, nonneuroinvasive disease |
Data for publication received from ArboNET |
|
10450 |
Psittacosis (Ornithosis) |
Confirmed and probable; unknown from CA |
|
10257 |
Q fever, acute |
Confirmed and probable; unknown from CA |
|
10258 |
Q fever, chronic |
Confirmed and probable; unknown from CA |
|
10340 |
Rabies, animal |
Confirmed and unknown from CA |
|
10460 |
Rabies, human |
Confirmed; unknown from CA verified as confirmed |
|
10200 |
Rubella |
Confirmed and unknown |
|
10370 |
Rubella, congenital syndrome |
Confirmed, probable, and unknown |
|
11000 |
Salmonellosis |
Confirmed and probable; unknown from CA |
|
10575 |
Severe acute respiratory syndrome-associated coronavirus (SARS-CoV) disease |
Confirmed and probable |
|
11563 |
Shiga toxin-producing Escherichia coli (STEC) |
Confirmed, probable, unknown from CA |
|
11010 |
Shigellosis |
Confirmed and probable; unknown from CA |
|
11800 |
Smallpox |
Confirmed and probable |
|
10250 |
Spotted fever rickettsiosis |
Confirmed, probable, and unknown |
|
10051 |
St. Louis encephalitis virus, neuroinvasive disease |
Data for publication received from ArboNET |
|
10064 |
St. Louis encephalitis virus, nonneuroinvasive disease |
Data for publication received from ArboNET |
|
11700 |
Streptococcal toxic-shock syndrome |
Confirmed and probable; unknown from CA |
|
11723 |
Streptococcus pneumoniae, invasive disease (IPD) (all ages) |
Confirmed; unknown from CA |
|
10316 |
Syphilis, congenital |
All reports printed |
|
10313 |
Syphilis, early latent |
All reports printed |
|
10314 |
Syphilis, late latent |
All reports printed |
|
10318 |
Syphilis, late with clinical manifestations other than neurosyphilis |
All reports printed |
|
10311 |
Syphilis, primary |
All reports printed |
|
10312 |
Syphilis, secondary |
All reports printed |
|
10310 |
Syphilis, total primary and secondary |
All reports printed |
|
10315 |
Syphilis, unknown latent |
All reports printed |
|
10210 |
Tetanus |
All reports printed |
|
10520 |
Toxic-shock syndrome (staphylococcal) |
Confirmed and probable; unknown from CA |
|
10270 |
Trichinellosis |
Confirmed; unknown from CA |
|
10220 |
Tuberculosis |
Print criteria determined by the CDC tuberculosis program |
|
10230 |
Tularemia |
Confirmed and probable; unknown from CA |
|
10240 |
Typhoid fever (caused by Salmonella typhi) |
Confirmed and probable; unknown from CA |
|
11663 |
Vancomycin-intermediate Staphylococcus aureus (VISA) |
Confirmed; unknown from CA verified as confirmed |
|
11665 |
Vancomycin-resistant Staphylococcus aureus (VRSA) |
Confirmed; unknown from CA verified as confirmed |
|
10030 |
Varicella (Chickenpox) |
Confirmed and probable |
|
EXHIBIT. (Continued) Print criteria for conditions reported to the National Notifiable Diseases Surveillance System, 2011 |
||
|---|---|---|
|
Code |
Notifiable Condition |
Print Criteria*,†,§ |
|
11545 |
Vibriosis |
Confirmed, probable, and unknown from CA |
|
11647 |
Viral hemorrhagic fever |
Confirmed |
|
10056 |
West Nile virus, neuroinvasive disease |
Data for publication received from ArboNET |
|
10049 |
West Nile virus, nonneuroinvasive disease |
Data for publication received from ArboNET |
|
10052 |
Western equine encephalitis virus, neuroinvasive disease |
Data for publication received from ArboNET |
|
10065 |
Western equine encephalitis virus, nonneuroinvasive disease |
Data for publication received from ArboNET |
|
10660 |
Yellow fever |
Data for publication received from ArboNET |
|
Abbreviations: ArboNET = Software for Arboviral Surveillance and Case Management; CDC = Centers for Disease Control and Prevention; CSTE = Council of State and Territorial Epidemiologists; CA = California; IPD = invasive pneumococcal disease; VPD = vaccine-preventable disease. * An unknown case classification status is used when a reporting jurisdiction sends aggregate counts of cases or when the surveillance information system of a reporting jurisdiction does not capture case classification data. In both situations, cases are verified to meet the case classification (e.g., confirmed, probable, and suspected) specified in the print criteria. † Print criteria for the National Notifiable Diseases Surveillance System (NNDSS): for a case report of a nationally notifiable disease to print in the MMWR, the reporting state or territory must have designated the disease reportable in their state or territory for the year corresponding to the year of report to CDC. After this criterion is met, the disease-specific criteria listed in the Exhibit are applied. When the above-listed table indicates that all reports will be earmarked for printing, this means that cases designated with unknown or suspect case confirmation status will print just as probable and confirmed cases will print. Because CSTE position statements customarily are not finalized until July of each year, the NNDSS data for the newly added conditions usually are not available from all reporting jurisdictions until January of the year following the approval of the CSTE position statement. § Based on case classification status. |
||
Highlights for 2012
Below are summary highlights for certain national notifiable diseases. Highlights are intended to assist in the interpretation of major occurrences that affect disease incidence or surveillance trends (e.g., outbreaks, vaccine licensure, or policy changes).
Anthrax
Naturally occurring outbreaks of anthrax occur every year among U.S. wildlife and livestock populations. In 2012, anthrax outbreaks were reported in states that routinely experience such outbreaks including Texas, North Dakota, and Nevada; however, livestock outbreaks occurred in 2012 in Mississippi, Oregon, and Colorado, where anthrax outbreaks had not been reported in livestock for 20 years or more. These outbreaks were associated with potential cutaneous exposures in persons handling and disposing of affected livestock and collecting diagnostic specimens. Although no human infections resulted, these exposures reflect the importance of timely recognition of anthrax in susceptible animals and the use of appropriate protective measures to prevent human exposures.
Domestic Arboviral Disease, Neuroinvasive and Nonneuroinvasive
During 2012, a large multistate outbreak of West Nile virus (WNV) disease occurred, and more cases were reported nationally than in any year since 2003 (1). A total of 5,674 WNV disease cases were reported, including 2,873 cases of neuroinvasive disease (e.g., meningitis, encephalitis, and acute flaccid paralysis) and 286 deaths. WNV disease cases were reported from 48 states (including the first reported from Maine), the District of Columbia, and Puerto Rico. However, approximately half of the WNV neuroinvasive disease cases were reported from just four states: California, Illinois, Louisiana, and Texas. Despite an increased incidence of neuroinvasive disease in 2012, national surveillance data showed no evidence of changes in epidemiology or increased disease severity compared with the previous 8 years (2).
After WNV, the next most commonly reported cause of neuroinvasive arboviral disease was La Crosse virus, followed by Eastern equine encephalitis virus, Powassan virus, and St. Louis encephalitis virus. The 15 Eastern equine encephalitis disease cases were the largest reported since 2005, and included the first ever reported from Vermont. Eastern equine encephalitis virus disease, although rare, remained the most severe domestic arboviral disease, with a 33% case fatality rate.
- CDC. West Nile virus disease and other arboviral diseases—United States, 2012. MMWR 2013;62:513–7.
- Lindsey NP, Staples JE, Delorey MJ, Fischer M. Lack of evidence of increased West Nile virus disease severity in the United States in 2012. Am J Trop Med Hyg 2014;90:163–8.
Babesiosis
Babesiosis, a tickborne disease, is caused by protozoan parasites of the genus Babesia that infect red blood cells. Babesia infection can range from asymptomatic to life threatening. Clinical manifestations might include fever, chills, other nonspecific influenza-like symptoms, and hemolytic anemia. Babesia parasites usually are tickborne, but they also are transmissible via blood transfusion or congenitally (1). In recent years, reports of tickborne and transfusion-associated cases have increased in number and geographic distribution (1).
During 2012, a total of 911 unique cases were reported among residents of 14 of the 22 states where babesiosis surveillance was conducted; 871 (96%) cases were reported among residents of seven states (Connecticut, Massachusetts, Minnesota, New Jersey, New York, Rhode Island, and Wisconsin). The median age of patients was 62 years (range: age <1–98 years); 572 (63%) were male, 308 (34%) were female, and the sex was unknown for 31 (3%). Among the patients for whom data were available, 459 (72%) of 638 had symptom onset dates during June–August.
- Herwaldt BL, Linden JV, Bosserman E, et al. Transfusion-associated babesiosis in the United States: a description of cases. Ann Intern Med 2011;155:509–19.
Botulism
Botulism is a severe paralytic illness caused by toxins produced by Clostridium botulinum. Exposure to toxin can occur by ingestion (foodborne botulism), in situ production from C. botulinum colonization of either a wound (wound botulism) or the gastrointestinal tract (infant botulism and adult intestinal colonization botulism), or overdose of botulinum toxin used for cosmetic or therapeutic purposes (1). Instances of reported botulism from all of these exposure routes were reported in 2012, with infant botulism remaining the most frequently observed transmission category. During 2012, two outbreaks (events with two or more cases) of foodborne botulism (four cases and eight cases) occurred in an Arizona prison. These cases were associated with consumption of pruno, an illicit alcoholic brew. Additionally, an outbreak (two cases) was associated with home-canned spaghetti and meat, and another (three cases) with home-canned beets.
All states maintain 24-hour telephone services for reporting of botulism and other public health emergencies. Health-care providers should report suspected botulism cases immediately to their state health departments. CDC maintains intensive surveillance for cases of botulism in the United States and provides consultation and antitoxin for suspected cases. State health departments can reach the CDC botulism duty officer on call 24 hours a day, 7 days a week, via the CDC Emergency Operations Center (telephone: 770–488–7100).
- Sobel J. Botulism. Clin Infect Dis 2005;41:1167–73.
Brucellosis
The number of brucellosis cases reported in 2012 increased by 44%, from 79 cases in 2011 to 114 cases in 2012. Although cases reported from Arizona, California, Florida, Illinois, North Carolina, and Texas accounted for almost three quarters (73.7%) of the reported cases, the number of reported cases from Florida in 2012 was more than doubled that reported in 2011. Health-care providers and health departments are encouraged to continue reporting cases to CDC. In an effort to remind laboratories working with the Brucella spp. of exposure risks associated with specimen handling and manipulation, the Bacterial Special Pathogens Branch (BSPB) has recently updated laboratory exposure risk assessment and PEP guidelines (1), which are now available at http://www.cdc.gov/brucellosis/laboratories/risk-level.html.
Recommendations for safe laboratory practices when handling Brucella spp. can be found at http://www.cdc.gov/brucellosis/laboratories/safety.html. BSPB is available for assistance with evaluating risk occurring after laboratory exposures, and can be contacted via e-mail (bspb@cdc.gov), or by telephone (404–639–1711).
- Traxler RM, Guerra MA, Morrow MG, et al. Review of brucellosis cases from laboratory exposures in the United States in 2008 to 2011 and improved strategies for disease prevention. J Clin Microbiol 2013;51:3132–6.
Chlamydia
In 2012, more than 1.4 million cases of Chlamydia trachomatis infections were reported; the largest number of cases ever reported to CDC for any condition (1). This case count corresponds to a rate of 456.7 cases per 100,000 population, an increase of only 0.7% compared with the rate in 2011, the smallest annual increase since nationwide reporting for chlamydia began. The rate among women aged 15–19 years decreased 5.6% from 3,485.2 cases per 100,000 females in 2011 to 3,291.5 cases per 100,000 women in 2012. Similarly, chlamydia rates for men aged 15–19 years decreased 5.1% from 816.3 cases per 100,000 males in 2011 to 774.8 cases per 100,000 males in 2012. This is the first time that chlamydia rates among persons aged 15–19 years have decreased since 2000. Because chlamydial infections are usually asymptomatic, reported case rates are affected by screening coverage. Decreases in reported cases might reflect reduced screening or changes in morbidity.
- CDC. Sexually transmitted disease surveillance 2012. Atlanta, GA: US Department of Health and Human Services; 2014.
Cholera
Cholera continues to be rare in the United States and is most often acquired during travel in countries where toxigenic Vibrio cholerae O1 or O139 is circulating (1). Since epidemic cholera emerged in Haiti in October 2010, associated cases have been reported in the United States in travelers who have recently arrived from Hispaniola (2). Of the 17 cholera infections reported in the United States in 2012, a total of 16 were travel-associated; 12 patients had arrived recently from Hispaniola (nine from Haiti and three from the Dominican Republic) and four from other cholera-affected countries. Cholera remains a global threat to health, particularly in areas with poor access to improved water and sanitation, such as Haiti and sub-Saharan Africa (3,4).
- Steinberg EB, Greene KD, Bopp CA, et al. Cholera in the United States, 1995–2000: trends at the end of the twentieth century. J Infect Dis 2001;184:799–802.
- Newton AE, Heiman KE, Schmitz A, et al. Cholera in United States associated with epidemic in Hispaniola. Emerg Infect Dis 2011;17:2166–8.
- Tappero JW, Tauxe RV. Lessons learned during public health response to cholera epidemic in Haiti and the Dominican Republic. Emerg Infect Dis 2011;17:2087–93.
- Mintz ED, Guerrant RL. A lion in our village—the unconscionable tragedy of cholera in Africa. N Engl J Med 2009;360:1060–3.
Coccidioidomycosis
Coccidioidomycosis is a fungal infection caused by inhalation of airborne Coccidioides spp. spores that are present in the arid soil of California, other parts of the southwestern United States, and parts of Central and South America. After a substantial overall increase during 1998–2011 (1), the incidence of reported coccidioidomycosis decreased by approximately 22% during 2012. The decrease was similar in Arizona and California, the two states that report the most cases. Incidence decreased among all age groups, although rates remained highest among persons aged ≥60 years. Since 2009, the majority of cases have occurred among women in Arizona, whereas the majority of cases have occurred among men elsewhere in the United States.
The reasons for the recent decrease are not known but might be related to changes in the environment, changes in the at-risk population, or changes in testing practices. The majority of laboratories in endemic areas perform testing using an enzyme immunoassay, the specificity of which is controversial (2). Despite the decrease in reported cases in 2012, the morbidity of this disease in Arizona and California remains considerable (3). Coccidioidomycosis is currently the second most commonly reported infectious condition in Arizona (12,920) and the fifth in California (4,431). More than 25,000 coccidioidomycosis-associated hospitalizations occurred in California during 2000–2011, totaling more than $2 billion in hospital charges (4). Physicians, particularly in areas where the disease is endemic, should continue to maintain a high suspicion for acute coccidioidomycosis, especially among patients with an influenza-like illness or pneumonia who live in or have visited areas in which the disease is endemic.
- CDC. Increase in reported coccidioidomycosis—United States, 1998–2011. MMWR 2013;62:217–21.
- Kuberski T, Herrig J, Pappagianis D. False-positive IgM serology in coccidioidomycosis. J Clin Microbiol 2010;48:2047–9.
- Hector RF, Rutherford GW, Tsang CA, et al. The public health impact of coccidioidomycosis in Arizona and California. Int J Environ Res Public Health 2011;8:1150–73.
- Sondermeyer G, Lee L, Gilliss D, Tabnak F, Vugia D. Coccidioidomycosis-associated hospitalizations, California, USA, 2000–2011. Emerg Infect Dis 2013;19:1590–7.
Congenital Rubella Syndrome
Infection with rubella virus during pregnancy, generally during the first trimester, can result in congenital rubella syndrome (CRS) in the infant. The devastating manifestations of CRS can include deafness, cataracts, cardiac defects, mental retardation, and death (1). With the elimination of rubella from the United States, congenital rubella syndrome is rare in this country (2). However, rubella still circulates outside the Western hemisphere, especially in regions where rubella vaccination programs are not well developed (3). In 2012, three infants were born in the United States with CRS. All three mothers had been in Africa early during their pregnancies (4).
- Plotkin SA, Reef SE. Rubella vaccine. In: Plotkin SA, Orenstein WA, Offit PA, eds. Vaccines. 5th ed. Philadelphia, PA: Elsevier, 2008:735–71.
- CDC. Elimination of rubella and congenital rubella syndrome—United States, 1969–2004. MMWR 2005;54:279–82.
- World Health Organization. Immunization surveillance, assessment and monitoring. Geneva, Switzerland: World Health Organization; 2014. Available at http://www.who.int/entity/immunization_monitoring/data/year_vaccine_introduction.xls.
- CDC. Three cases of CRS in the post-elimination era, Alabama, Illinois, and Maryland, 2012. MMWR 2013;62:226–9.
Cryptosporidiosis
Cryptosporidiosis is a nationally notifiable gastrointestinal illness caused by the extremely chlorine-tolerant protozoa of the genus Cryptosporidium. Cryptosporidium is transmitted by the fecal-oral route with the ingestion of Cryptosporidium oocysts through the consumption of fecally contaminated food or water or through direct person-to-person or animal-to-person contact.
Although cryptosporidiosis affects persons in all age groups, cases are reported most frequently in children aged 1–4 years (1). A substantial increase in transmission of Cryptosporidium in children occurs during summer through early fall, coinciding with increased use of recreational water, which is a known risk factor for cryptosporidiosis. Cryptosporidium has emerged as the leading cause of reported recreational water-associated outbreaks (2). Transmission through recreational water is facilitated by the substantial number of Cryptosporidium oocysts that can be shed in a single bowel movement (3), the extended time that oocysts can be shed (4), the low infectious dose (5), and the extreme tolerance of Cryptosporidium oocysts to chlorine (6).
To reduce the number of cryptosporidiosis cases associated with recreational water, enhanced public health prevention measures are needed. In the United States, pool codes are reviewed and approved by state or local public health officials; no federal agency regulates the design, construction, and operation of public treated recreational water venues (e.g., pools). This lack of uniform national standards has been identified as a barrier to the prevention and control of outbreaks associated with treated recreational water. To provide support to state and local health departments, CDC is sponsoring development of the Model Aquatic Health Code (MAHC) (http://www.cdc.gov/mahc). MAHC is a collaborative effort between local, state, and federal public health agencies and the aquatics sector to develop a data-driven, knowledge-based resource for state and local jurisdictions reviewing and updating their existing pool codes to optimally prevent and control recreational water-associated illness, including cryptosporidiosis. The first official edition of MAHC will be available in the summer of 2014.
The systematic collection and molecular characterization of Cryptosporidium isolates would further the understanding of U.S. cryptosporidiosis epidemiology by revealing transmission patterns and potential risk factors (7). Such an effort would require phasing out the practice of preserving stool specimens with formalin, which decreases the ability to perform molecular amplification methods.
- CDC. Cryptosporidiosis surveillance—United States, 2009–2010. MMWR 2012;61:(No. SS-5).
- CDC. Surveillance for waterborne disease outbreaks and other health events associated with recreational water—United States, 2007–2008. MMWR 2011;60:(No. SS-12).
- Goodgame RW, Genta RM, White AC, Chappell CL. Intensity of infection in AIDS-associated cryptosporidiosis. J Infect Dis 1993;167:704–9.
- Jokipii L, Jokipii AM. Timing of symptoms and oocyst excretion in human cryptosporidiosis. N Engl J Med 1986;315:1643–7.
- Chappell CL, Okhuysen PC, Langer-Curry R, et al. Cryptosporidium hominis: experimental challenge of healthy adults. Am J Trop Med Hyg 2006;75:851–7.
- Shields JM, Hill VR, Arrowood MJ, Beach MJ. Inactivation of Cryptosporidium parvum under chlorinated recreational water conditions. J Water Health 2008;6:513–20.
- Chalmers RM, Elwin K, Thomas AL, Guy EC, Mason B. Long-term Cryptosporidium typing reveals the aetiology and species-specific epidemiology of human cryptosporidiosis in England and Wales, 2000 to 2003. Euro Surveill 2009;14:2.
Cyclosporiasis
Approximately one third of the laboratory-confirmed cases of cyclosporiasis—and the only outbreak—that were reported in the United States in 2012 occurred in Texas. Overall, CDC received notification of 44 laboratory-confirmed cases in Texas residents during 2012, nine of which were classified as outbreak associated. The illnesses in the reported outbreak were associated with eating at a Mexican-style restaurant in Texas during June and July 2012. Because many of the food items served at the restaurant contained similar combinations of ingredients, no vehicle of infection could be definitively implicated.
Of the 35 confirmed cases in Texas residents that were not associated with this restaurant, 31 occurred in persons not known to have traveled outside of the United States or Canada during the 14 days before becoming ill; their illness onset dates ranged from mid-June to mid-September. Even after excluding the nine restaurant-associated cases, the number of cases reported in Texas during 2012 was substantially higher than the 14 cases reported in 2011. During 2012, although the Texas Department of State Health Services conducted an epidemiologic investigation of the non-restaurant–associated cases, no vehicles of infection could be implicated. Molecular subtyping tools, which would facilitate linking cases to each other and to particular food items or sources, are not yet available for Cyclospora cayetanensis (1,2).
- Hall RL, Jones JL, Herwaldt BL. Surveillance for laboratory-confirmed sporadic cases of cyclosporiasis–United States, 1997–2008. MMWR 2011;60:(No. SS-2).
- Herwaldt BL. The ongoing saga of US outbreaks of cyclosporiasis associated with imported fresh produce: what Cyclospora cayetanensis has taught us and what we have yet to learn. In: Institute of Medicine. Addressing foodborne threats to health: policies, practices, and global coordination. Washington, DC: The National Academies Press; 2006:85–115, 133–40.
Dengue
During 2012, Florida, California, and Illinois reported the largest number of dengue cases in the 50 United States. In late 2012, an epidemic began in Puerto Rico, resulting in more reported cases in this territory than during 2011, but fewer than during the large epidemic in 2010. Persons of all age groups (range: age 0–9 through >80) were affected by dengue in 2012. The majority of dengue cases reported in the United States in 2012 were travel-associated and from top travel destinations (Jamaica, Dominican Republic, Haiti, and Puerto Rico).
Diphtheria
During 2012, one probable, nonfatal case of diphtheria was reported to CDC representing the first since 2003. One man aged 28 years who was a resident of New York had a positive polymerase chain reaction test for diphtheria tox gene A and B. The patient was inadequately immunized and also had a history of AIDS. All close family members were culture negative.
Ehrlichiosis and Anaplasmosis
In 2012, the reported incidence of Ehrlichia chaffeensis (1,128 cases) and Anaplasma phagocytophilum (2,389) were within the range of the incidence of the previous 5 years. A total of 17 cases of Ehrlichia ewingii were reported, with Illinois, Kansas, and Virginia each reporting a case for the first time. Increased use of molecular methods might be responsible for differentiating more reported cases of E. ewingii from E. chaffeensis and A. phagocytophilum.
Giardiasis
Giardia is transmitted through the fecal-oral route with the ingestion of Giardia cysts through the consumption of fecally contaminated water or through person-to-person (or, to a lesser extent, animal-to-person) transmission. Giardiasis normally is characterized by diarrhea, abdominal cramps, bloating, weight loss, and malabsorption.
Although giardiasis is the most common enteric parasitic infection in the United States and no declines in incidence have occurred in recent years, knowledge of its epidemiology remains incomplete. Giardiasis symptomatology is variable, infected persons can shed Giardia for several weeks, and recent studies indicate a potential for chronic sequelae from giardiasis (1,2). New epidemiologic studies are needed to identify effective public health prevention measures.
The majority of data on giardiasis transmission come from outbreak investigations; however, the overwhelming majority of reported giardiasis cases are not linked to known outbreaks. During 2009–2010, <1% of reported giardiasis cases were associated with outbreaks (3). The relative contributions of person-to-person, animal-to-person, foodborne, and waterborne transmission to sporadic human giardiasis in the United States are not well understood.
Until recently, no reliable serologic assays for Giardia have been available, and no population studies of Giardia seroprevalence have been conducted. With recent laboratory advances (4), such studies might now be feasible and would contribute substantially to understanding the prevalence of giardiasis in the United States. Enhanced genotyping methods would increase knowledge of the molecular epidemiology of Giardia, including elucidating species-specific subassemblages (5). These tools, combined with traditional epidemiology and surveillance, would improve understanding of giardiasis risk factors, enable researchers to identify outbreaks by linking cases currently classified as sporadic infections, and provide risk factor information needed to inform prevention strategies.
- Cantey PT, Roy S, Lee B, et al. Study of nonoutbreak giardiasis: novel findings and implications for research. Am J Med 2011;124:1175.e1–8.
- Wensaas KA, Langeland N, Hanevik K, et al. Irritable bowel syndrome and chronic fatigue 3 years after acute giardiasis: historic cohort study. Gut 2012;61:214–9.
- CDC. Giardiasis surveillance—United States, 2009–2010. MMWR 2012;61:(No. SS-5).
- Priest JW, Moss DM, Visvesvara GS, et al. Multiplex assay detection of immunoglobulin G antibodies that recognize Giardia intestinalis and Cryptosporidium parvum antigens. Clin Vaccine Immunol 2010;17:
1695–707. - Feng Y, Xiao L. Zoonotic potential and molecular epidemiology of Giardia species and giardiasis. Clin Microbiol Rev 2011;24:110–40.
Gonorrhea
After a 79% decline in the rate of reported gonorrhea during 1975–2009 and after reaching the lowest gonorrhea rate ever recorded in 2009, the national gonorrhea rate increased in 2012 for the third consecutive year. During 2009–2012, the national rate increased 9.6%. During 2011–2012, the rate increase was higher among men (8.3%) than women (0.6%), and in the West (19.4%) than Northeast (8.4%), Midwest (3.4%), or South (which decreased 1.4%). As in previous years, the highest rates were observed among persons aged 15–24 years, among blacks, and in the South. In 2012, the gonorrhea rate among blacks was 14.9 times the rate among whites (1).
Treatment for gonorrhea is complicated by antimicrobial resistance. Declining susceptibility to cephalosporins during 2006–2011 resulted in a change in the CDC treatment guidelines in 2012. The only CDC-recommended treatment regimen for gonorrhea is dual therapy with ceftriaxone and either azithromycin or doxycycline (2). In CDC's sentinel surveillance system, the Gonococcal Isolate Surveillance Project (GISP), the percentage of isolates with elevated ceftriaxone minimum inhibitory concentrations (MICs) decreased from 0.4% in 2011 to 0.3% in 2012, and the percentage of isolates with elevated cefixime MICs decreased from 1.4% in 2011 to 1.0% (1).
- CDC. Sexually transmitted disease surveillance 2012. Atlanta, GA: US Department of Health and Human Services; 2014.
- CDC. Update to CDC's sexually transmitted diseases treatment guidelines, 2010: oral cephalosporins no longer a recommended treatment for gonococcal infections. MMWR 2012;61:590–4.
Hansen Disease (leprosy)
The number of leprosy cases reported during 2011 and 2012 remained stable. More than half (69.5%) of all cases were reported from Hawaii (29.3%), California (15.8%), Florida (12.2%), and Texas (12.2%). The majority of cases (89%) reported location of acquisition of infection as unknown (73.2%) or as acquired outside of the United States (15.8%).
Hantavirus pulmonary syndrome
An outbreak of hantavirus infections in visitors to Yosemite National Park occurred during 2012, with 10 patients developing laboratory-confirmed hantavirus infection after overnight visits to the park during June and July. Eight patients had symptoms that met the case definition of Hantavirus pulmonary syndrome (HPS), and three patients died (1). The 10 confirmed patients came from three states: California (eight), Pennsylvania (one) and West Virginia (one). Further investigation found that nine patients had stayed in signature tent cabins at the Curry Village campground of the park; these structures have insulation between the canvas exterior and interior hard walls. Rodent infestations were detected in the insulation of these cabins, and all signature cabins were closed and dismantled. Efforts also were made to educate visitors and staff about HPS symptoms and prevention, and to preclude rodents from infesting existing structures at the park.
Also during 2012, a hiker who was camping in the Adirondak mountains of New York state developed HPS following an overnight stay in a three-sided shelter where rodent exposures were noted. Persons engaging in outdoor activities such as camping should be aware of the potential for exposure to rodents and hantavirus. Efforts should be made to eliminate rodents from overnight structures and to inspect structures carefully for potential rodent infestation. If a person develops symptoms of HPS within 8 weeks of the exposure, they should make their doctor aware of potential rodent exposures from outdoor activities so that hantavirus infection is considered.
Hantavirus infections, such as Punmala virus, that are not causing symptoms of HPS are not reportable. However, an imported case of hemorrhagic fever with renal syndrome (HFRS) occurred in a German visitor to Florida in 2012 (2). The patient had acute renal failure caused by Puumala virus infection, which was acquired in Germany. HFRS caused by Puumala virus is common in Germany and many other countries in Europe, with thousands of cases reported each year (3). HFRS should be considered as a cause of acute renal failure in visitors from areas where the disease is endemic in Europe.
- CDC. Notes from the field: Hantavirus pulmonary syndrome in visitors to a national park—Yosemite Valley, California, 2012. MMWR 2012;60:952.
- Knust B, Rollin PE. Twenty-year summary of surveillance for human hantavirus infections, United States. Emerg Infect Dis 2013;19:1934–7.
- Heyman P, Ceianu CS, Christova I, et al. A five-year perspective on the situation of haemorrhagic fever with renal syndrome and status of the hantavirus reservoirs in Europe, 2005–2010. Euro Surveill 2011;16:3.
Hemolytic Uremic Syndrome
Hemolytic uremic syndrome (HUS) is characterized by the triad of hemolytic anemia, thrombocytopenia, and renal insufficiency. The most common etiology of postdiarrheal HUS in the United States is infection with Shiga toxin-producing Escherichia coli, principally E. coli O157:H7 (1,2). Approximately 6.3% of all persons were infected with E. coli O157:H7, but the condition progressed to HUS in 5% of children aged <5 years (3). During 2012, as has previously been reported, the majority of reported cases occurred among children aged 1–4 years.
- Banatvala N, Griffin PM, Greene KD, et al. The United States prospective hemolytic uremic syndrome study: microbiologic, serologic, clinical, and epidemiologic findings. J Infect Dis 2001;183:1063–70.
- Mody RK, Luna-Gierke RE, Jones TF, et al. Infections in pediatric postdiarrheal hemolytic uremic syndrome: factors associated with identifying shiga toxin-producing Escherichia coli. Arch Pediatr Adolesc Med 2012;166:902–9.
- Gould LH, Demma L, Jones TF, et al. Hemolytic uremic syndrome and death in persons with Escherichia coli O157:H7 infection, Foodborne Diseases Active Surveillance Network sites, 2000–2006. Clin Infect Dis 2009;49:1480–5.
Influenza-Associated Pediatric Mortality
In June 2004, the Council of State and Territorial Epidemiologists added influenza-associated pediatric mortality (i.e., among persons aged <18 years) to the list of conditions reportable to the National Notifiable Diseases Surveillance System. Cumulative year-to-date incidence is published each week in MMWR Table I for low-incidence nationally notifiable diseases. MMWR counts of deaths are by date of report in a calendar year and not by date of occurrence. A total of 52 influenza-associated pediatric deaths were reported to CDC during January 1–December 31, 2012. This compares with a mean of 73 deaths (range: 43–118) per year reported for seasonal influenza during 2005–2011. A total of 348 deaths were reported from April 15, 2009 to September 30, 2010, coinciding with the 2009 influenza A (H1N1) pandemic.
Of the 52 influenza-associated pediatric deaths reported to CDC during 2012, a total of 34 occurred during the 2011–12 influenza season and the remaining 18 occurred during the 2012–13 influenza season. Approximately 35 (67%) deaths were associated with influenza A viruses and 16 (31%) with influenza B viruses. One death was associated with an influenza virus for which the type was not determined. Of 35 influenza A viruses, subtype was determined for 22 (63%); 10 were 2009 influenza A (H1N1) (pH1N1) viruses and 12 were A(H3N2) viruses.
In 2012, the median age at the time of death was 6.9 years (range: 16 days–16.4 years). This is similar to that observed before the 2009 A (H1N1) pandemic during the years 2005–2008, January–April 2009, and 2011 (4–7.5 years), but lower than that seen when pH1N1 viruses circulated widely during May–December 2009 (9.3 years), and in 2010 (8.2 years). Seven children (13%) were aged <6 months, 12 (23%) were aged 6–59 months, and 33 (63%) were aged 5–17 years. The overall influenza-associated death rate for children aged <18 years during 2012 was 0.07 per 100,000 population. The rates by age group were 0.09 per 100,000 for children aged <5 years and 0.06 for children aged 5 to <18years (1).
Information on the location of death was available for all children. Twenty seven (52%) children died after being admitted to the hospital (25 were admitted to the intensive care unit), a total of 14 (27%) died in the emergency department, and 11 (21%) died outside the hospital. Information on underlying or chronic medical condition was reported for 51 (98%) children: 28 (55%) children had one or more underlying or chronic medical conditions placing them at increased risk for influenza-associated complications (2). The most common group of underlying conditions was neurologic disorders (e.g., moderate to severe developmental delay, seizure disorders, cerebral palsy, mitochondrial disorders, neuromuscular disorders, and neurologic conditions), reported for 15 of 51 children. Approximately ten of 51 children had cardiac disease or congenital heart disease, and 14 of 51 children had a chronic pulmonary condition (e.g., asthma, cystic fibrosis, or other chronic pulmonary disease). Of 29 children who had specimens collected for bacterial culture from normally sterile sites, eight (28%) had positive cultures. Staphylococcus aureus was detected in two of eight (25%) positive cultures; one was methicillin-sensitive and for the other, methicillin-sensitivity testing was not done. Two cultures (25%) were positive for Streptococcus pneumoniae and two (25%) were positive for Group A Streptococcus. Group B Streptococcus, Pseudomonas aeruginosa, and coagulase-negative staphylococcus were identified in one patient each with the exception of one child who had positive culture for two pathogens (MSSA and pseudomonas aeruginosa). All children aged ≥6 months were recommended to be vaccinated in 2012 (3). Of the 36 children aged ≥6 months for whom seasonal vaccination status was known, six (17%) were vaccinated against influenza, as recommended by the Advisory Committee on Immunization Practices (ACIP). Seven children were aged <6 months and ineligible for vaccination (2,4).
The number of influenza-associated pediatric deaths reported during 2012 was lower than that in 5 of the previous 7 years. Influenza seasons typically span 2 calendar years and can vary widely in terms of severity and timing of peak activity, thus affecting the number of deaths reported in a calendar year. The 2011–12 influenza season was unusually mild and the peak of activity occurred during mid-March (5). All 35 pediatric deaths associated with that season were reported in 2012 or later. The 2012–13 influenza season was more severe and began earlier, peaking in late December, 2012, but the majority of pediatric deaths associated with that season were reported in 2013 (6). Continued surveillance for influenza-associated mortality is important to monitor the effects of seasonal and novel influenza, factors contributing to severe influenza-associated disease, and the influence of interventions among children.
- CDC. Bridged-race population estimates, data files, and documentation.Vintage 2012 post-censal estimates of the resident population of the United States (April 1, 2010, July 1, 2010–July 1, 2012), by year, county, single-year of age (0, 1, 2, 85 years and over), bridged race, Hispanic origin, and sex. Atlanta, GA: US Department of Health and Human Services, CDC; 2012. Available at http://www.cdc.gov/nchs/nvss/bridged_race/data_documentation.htm.
- CDC. Prevention and control of influenza with vaccines: recommendations of the Advisory Committee on Immunization Practices (ACIP)—United States, 2012–13 influenza season. MMWR 2012;61:613–8.
- CDC. Prevention and control of influenza with vaccines: recommendations of the Advisory Committee on Immunization Practices (ACIP), 2011. MMWR 2011;60:1128–32.
- CDC. Recommended immunization schedules for persons aged 0 through 18 years—United States, 2012. MMWR 2012;61:147.
- CDC. Update: influenza activity—United States, 2011–12 season and composition of the 2012–13 influenza vaccine. MMWR 2012;61:414–20.
- CDC. Update: influenza activity—United States, 2012–13 season and composition of the 2013–14 influenza vaccine. MMWR 2012;62:473–9.
Listeriosis
Listeria monocytogenes infection (listeriosis) is rare but can cause severe invasive disease (e.g., bacteremia and meningitis). Listeriosis is predominately acquired through contaminated food and occurs most frequently among older adults, persons with certain immunocompromising conditions, and in pregnant women and their newborns. Pregnancy-associated listeriosis is usually a relatively mild illness for the woman, but can result in fetal loss or severe neonatal disease.
Since 2000, listeriosis has been nationally notifiable. During 2012, approximately 0.23 infections per 100,000 population were reported to NNDSS. Progress toward the 2020 national target of 0.20 infections per 100,000 population (1) is measured through the Foodborne Diseases Active Surveillance Network (FoodNet), which conducts active, population-based surveillance for listeriosis in 10 U.S. states. In 2012, FoodNet reported a preliminary annual incidence of Listeria monocytogenes of 0.25 infections per 100,000 population, similar to the rate reported to NNDSS (2).
The Listeria Initiative is an enhanced surveillance system designed to aid in the rapid investigation of listeriosis outbreaks by combining molecular subtyping results with epidemiologic data collected by state and local health departments (3). As part of the Listeria Initiative, CDC recommends that all clinical isolates of L. monocytogenes be forwarded routinely to a public health laboratory for pulsed-field gel electrophoresis (PFGE) subtyping, and that these PFGE subtyping results be submitted to PulseNet, the National Molecular Subtyping Network for Foodborne Disease Surveillance (4); clinical isolates should also be promptly sent to CDC for further characterization. Additionally, communicable disease programs are asked to interview all patients with listeriosis promptly using the standard Listeria Initiative questionnaire, which is available in English and Spanish at http://www.cdc.gov/listeria/surveillance.html.
The Listeria Initiative has aided in the timely identification and removal of contaminated food during several listeriosis investigations, including a multistate outbreak of 22 illnesses that was linked to imported ricotta salata (a semi-firm cheese) in 2012 (5).
- US Department of Health and Human Services. Healthy People 2020 Objectives. Washington, DC: US Department of Health and Human Services; 2013. Available at http://www.healthypeople.gov/2020/topicsobjectives2020/objectiveslist.aspx?topicId=14.
- CDC. Foodborne Diseases Active Surveillance Network. Atlanta, GA: US Department of Health and Human Services, CDC; 2012. Available at http://www.cdc.gov/features/dsfoodnet2012/reportcard.html.
- CDC. The Listeria Initiative surveillance overview. Atlanta, GA: US Department of Health and Human Services, CDC; 2011. Available at http://www.cdc.gov/listeria/pdf/ListeriaInitiativeOverview_508.pdf.
- CDC. PulseNet. Atlanta, GA: US Department of Health and Human Services, CDC; 2013. Available at http://www.cdc.gov/pulsenet/.
- CDC. PulseNet Outbreaks. Atlanta, GA: US Department of Health and Human Services, CDC; 2012. Available at http://www.cdc.gov/listeria/outbreaks/cheese-09-12/index.html.
Lyme Disease
National surveillance for Lyme disease was implemented in the United States in 1991 using a case definition based on clinical and laboratory findings. The CSTE revised the case definition, effective 2008, to standardize laboratory criteria for confirmation and to allow reporting of probable cases.
During 2012, the number of confirmed and probable Lyme disease cases reported to CDC was similar to the number reported in 2010 and 2011, and substantially lower than the number reported in 2008 and 2009, however, the geographic distribution of cases increased nevertheless. In 2012, a total of 356 counties had a reported incidence of ≥10 confirmed cases per 100,000 persons, as compared with 324 counties in 2008.
Meningococcal Disease
Neisseria meningitidis is an important cause of bacterial meningitis and sepsis in the United States. The highest incidence of meningococcal disease occurs among infants aged <1 year, with a second peak occurring in adolescents and young adults (1,2). Among infants, disease incidence peaks within the first 6 months of life and most cases in this age group are caused by serogroup B (2). Rates of meningococcal disease are at historic lows in the United States, but meningococcal disease continues to cause significant morbidity and mortality in persons of all ages.
CDC's ACIP recommends routine use of quadrivalent (A, C, Y, W-135) meningococcal conjugate vaccine in adolescents and others at increased risk for meningococcal disease (1). In October 2010, a booster dose was recommended for adolescents at age 16 years (3). In 2012, coverage with at least 1 dose of meningococcal conjugate vaccine was 74.0% among adolescents aged 13–17 years in the United States; however, coverage ranged from 37.5% to 94.3%, by state (4).
- CDC. Prevention and control of meningococcal disease: recommendations of the Advisory Committee on Immunization Practices (ACIP). MMWR 2013;62:(No. RR-2).
- Cohn AC, MacNeil JR, Harrison LH, et al. Changes in Neisseria meningitidis disease epidemiology in the United States, 1998–2007: implications for prevention of meningococcal disease. Clin Infect Dis 2010;50:184–91.
- CDC. Updated recommendations for use of meningococcal conjugate vaccines—Advisory Committee on Immunization Practices (ACIP), 2010. MMWR 2011;60:72–6.
- CDC. National and state vaccination coverage among adolescents aged 13–17 years—United States, 2012. MMWR 2013;62:685–93.
Pertussis
Reported pertussis increased significantly between 2011 (incidence: 6.1 per 100,000 population) and 2012 (15.4 per 100,000 population). Several states experienced epidemic levels of disease, resulting in more U.S. pertussis case reports in 2012 (N = 48,277) than any year since 1955 (N = 62,786). Age-specific pertussis rates were highest among infants aged <1 year (126.7 per 100,000 population); adolescents aged 11–14 years contributed the second highest rates of disease nationally (59.2 per 100,000 population), followed closely by children aged 7–10 years (58.5 per 100,000).
Tetanus, diphtheria, and a cellular pertussis (Tdap) coverage among adolescents aged 13–17 years continues to improve (78.2% in 2011 to 84.6% in 2012); however, coverage among adults remains low (12.5% in 2011) (1–3). In February 2012, ACIP recommended that all adults aged ≥19 years not previously vaccinated with Tdap receive a single dose (3). In October 2012, the Tdap pregnancy recommendation was expanded to include vaccination during every pregnancy, regardless of a patient's Tdap history (4).
- CDC. National and state vaccination coverage among adolescents aged 13–17 years—United States, 2011. MMWR 2012;61:671–7.
- CDC. National and state vaccination coverage among adolescents aged 13–17 years—United States, 2012. MMWR 2013;62:685–93.
- CDC. Noninfluenza vaccination coverage among adults—United States, 2011. MMWR 2013;62:66–72.
- CDC. Updated recommendations for use of tetanus toxoid, reduced diphtheria toxoid and acellular pertussis (Tdap) vaccine in adults aged 65 years and older—Advisory Committee on Immunization Practices (ACIP), 2012. MMWR 2012;61:468–70.
- CDC. Updated recommendations for use of tetanus toxoid, reduced diphtheria toxoid, and acellular pertussis vaccine (Tdap) in pregnant women—Advisory Committee on Immunization Practices (ACIP), 2012. MMWR 2013;62:131–5.
Rabies
During 2012, one case of human rabies was reported in the United States. The case was reported from California after the patient died abroad and was diagnosed by the Swiss rabies center and confirmed at CDC as a rabies virus variant associated with the insectivorous Mexican free-tailed bat (Tadarida brasiliensis) (1). During 2012, the total number of animals submitted to state and local laboratories for rabies diagnosis increased 2.1%, compared with 2011. Among animals submitted, increases in the number of animals reported rabid were observed for the following species: bats (21.7%), cattle (76.9%), dogs (20.0%), horses/mules (6.8%), and sheep/goats (8.3%) (2). Decreases in the number of reported rabid cats (15.2%), foxes (20.4%), raccoons (1.4%), and skunks (5.4%) also were reported, compared with 2011 (2).
- CDC. US-acquired human rabies with symptom onset and diagnosis abroad, 2012. MMWR 2012;61:777–81.
- Dyer JL, Wallace R, Orciari L, et al. Rabies surveillance in the United States during 2012. J Am Vet Med Assoc 2013;243:805–15.
Salmonellosis
During 2012, a total of 17.4 laboratory-confirmed Salmonella infections per 100,000 population were reported; this is one and a half times the Healthy People 2020 objective of 11.4 infections per 100,000 population (1). Data from the Foodborne Diseases Active Surveillance Network (FoodNet), which conducts active surveillance for salmonellosis in 10 U.S. states, are used to measure progress toward Healthy People 2020 objectives. FoodNet reported a preliminary annual incidence of Salmonellosis in 2012 of 16.4 infections per 100,000 population, lower than the rate reported to NNDSS (2).
During 2012, as in previous years, the age groups with the highest number of reported cases of salmonellosis were children aged <5 years and adults aged ≥65 years. Salmonellosis is reported most frequently in late summer and early fall; in 2012, this seasonality was evident, with most reports in June, July, August, and September.
Accounting for underdiagnosis, Salmonella causes an estimated 1.2 million illnesses annually in the United States, approximately 1 million of which are transmitted by food consumed in the United States (3). Salmonella can contaminate a wide range of foods, and different serotypes tend to have different animal reservoirs and food sources, making control challenging.
During 2012, multistate outbreaks of Salmonella infections were linked to cantaloupe (serotypes Typhimurium and Newport); mangoes (serotype Branderup); ground beef (serotype Enteritidis); raw scraped ground tuna product (serotypes Bareilly and Nchanga); and peanut butter (serotype Bredeney) (4). An increasing number of outbreaks associated with contact with animals were also investigated, including outbreaks linked to live poultry (serotypes Infantis, Newport, Lille, Montevideo, and Hadar); small turtles (serotypes Sandiego, Pomona, and Poona) and hedgehogs (serotype Typhimurium); and dry dog food (serotype Infantis) (5).
In 2012, the national case definition for salmonellosis was updated to include a suspect category for reporting of cases of salmonellosis detected through the use of culture-independent diagnostic tests, which are increasingly being used by laboratories (6–8).
- US Department of Health and Human Services. Healthy People 2020 objectives. Washington, DC: US Department of Health and Human Services; 2013. Available at http://www.healthypeople.gov/2020/topicsobjectives2020/objectiveslist.aspx?topicId=14.
- CDC. Foodborne Diseases Active Surveillance Network. Atlanta, GA: US Department of Health and Human Services, CDC; 2013. Available at http://www.cdc.gov/foodnet/data/trends/tables/2012/table2a-b.html#table-2b.
- Scallan E, Hoekstra RM, Angulo FJ, et al. Foodborne illness acquired in the United States–major pathogens. Emerg Infect Dis 2011;17:7–15.
- CDC. Reports of selected Salmonella outbreak investigations. Atlanta, GA: US Department of Health and Human Services, CDC; 2013. Available at http://www.cdc.gov/salmonella/outbreaks.html.
- CDC. Gastrointestinal (enteric) diseases from animals. Atlanta, GA: US Department of Health and Human Services, CDC; 2013. Available at www.cdc.gov/zoonotic/gi.
- Council of State and Territorial Epidemiologists. Public health reporting and national notification for Salmonellosis. Position statement 11-ID-08. Atlanta, GA: Council of State and Territorial Epidemiologists; 2012. Available at http://c.ymcdn.com/sites/www.cste.org/resource/resmgr/PS/11-ID-08.pdf.
- Cronquist AB, Mody RK, Atkinson R, et al. Impacts of culture-independent diagnostic practices on public health surveillance for bacterial enteric pathogens. Clin Infect Dis 2012;54(Suppl 5):S432–9.
- Jones TF, Gerner-Smidt P. Nonculture diagnostic tests for enteric diseases. Emerg Infect Dis 2012;18:513–4.
Shigellosis
During 2012, the incidence of reported shigellosis in the United States was 4.9 infections per 100,000 population; Shigella infections have not declined over the past 10 years. During 2012, as in previous years, the age group with the highest number of reported cases was children aged <10 years. S. sonnei infections generally account for approximately 75% of reported shigellosis cases in the United States (1). Shigellosis does not demonstrate marked seasonality, likely reflecting the importance of person-to-person transmission.
Accounting for underdiagnosis, Shigella causes an estimated 494,000 illnesses annually in the United States, approximately 131,000 of which are transmitted by food consumed in the United States (1). Shigella is often spread from one person to another, including through sexual contact between men who have sex with men, and also can be transmitted by contaminated food or by contaminated water used for drinking or recreational purposes (3). Some cases are acquired during international travel (4,5). Day care-associated outbreaks are common and are often difficult to control (6).
During 2012, an outbreak of infections caused by Shigella sonnei with decreased susceptibility to azithromycin was reported in Los Angeles, California; this outbreak represents the first known transmission of Shigella sonnei with decreased susceptibility to azithromycin in the United States (7). Resistance to ampicillin and trimethoprim-sulfamethoxazole among S. sonnei strains in the United States remains common, and resistance to quinolones, including ciprofloxacin, is emerging and cause for concern (8).
In 2012, the national case definition for shigellosis was updated to include a "suspect" category for reporting of cases detected through the use of culture-independent diagnostic tests (9).
- CDC. National Shigella surveillance annual summary, 2011. Atlanta, GA: US Department of Health and Human Services, CDC; 2013. Available at http://www.cdc.gov/ncezid/dfwed/pdfs/shigella-annual-report-2011-508c.pdf.
- Scallan E, Hoekstra RM, Angulo FJ, et al. Foodborne illness acquired in the United States—major pathogens. Emerg Infect Dis 2011;17:7–15.
- Gupta A, Polyak CS, Bishop RD, Sobel J, Mintz ED. Laboratory confirmed shigellosis in the United States, 1989–2002: epidemiologic trends and patterns. Clin Infect Dis 2004;38:1372–7.
- Ram PK, Crump JA, Gupta SK, Miller MA, Mintz ED. Review article: part II. Analysis of data gaps pertaining to Shigella infections in low and medium human development index countries, 1984–2005. Epidemiol Infect 2008;136:577–603.
- Gupta SK, Strockbine N, Omondi M, et al. Short report: emergence of Shiga toxin 1 genes within Shigella dysenteriae Type 4 isolates from travelers returning from the island of Hispaniola. Am J Trop Med Hyg 2007;76:1163–5.
- Arvelo W, Hinkle J, Nguyen TA, et al. Transmission risk factors and treatment of pediatric shigellosis during a large daycare center-associated outbreak of multidrug resistant Shigella sonnei. Pediatr Infect Dis J 2009;28:976–80.
- CDC. Notes from the field: outbreak of infections caused by Shigella sonnei with decreased susceptibility to azithromycin—Los Angeles, CA, 2012. MMWR 2013;62:171.
- CDC. National Antimicrobial Resistance Monitoring System for enteric bacteria (NARMS): Human isolates final report, 2011. Atlanta, GA: US Department of Health and Human Services, CDC; 2013. Available at http://www.cdc.gov/narms.
- Council of State and Territorial Epidemiologists. Public health reporting and national notification for Shigellosis. Position statement 11-ID-19. Atlanta, GA: Council of State and Territorial Epidemiologists; 2012. Available at http://c.ymcdn.com/sites/www.cste.org/resource/resmgr/PS/11-ID-19.pdf.
Spotted Fever Rickettsiosis (Including RMSF)
During 2012, a total of 4,470 cases of spotted fever rickettsiosis (SFR) were reported, which was 60% more reported cases than during 2011 (2,802 cases) and the largest number of cases since reporting began. Case reports increased from 2011 to 2012 in every geographic region except the Pacific region, with the largest increases occurring in the East South Central (580 cases), South Atlantic (528 cases), and West South Central (377 cases). These recent changes in reported incidence suggest a widespread change in exposure to SFR during 2012 over a large portion of the United States, possibly because of increased tick vector activity. However, because tick population counts in the United States are not linked to this surveillance system, the reasons for this increase remain uncertain.
Shiga Toxin-Producing Escherichia coli
In 2012, the incidence in the United States of reported Shiga toxin-producing Escherichia coli (STEC) was 2.1 infections per 100,000 population. During 2012, as in previous years, the age group with the highest number of reported cases was children aged <5 years, although infections can occur in patients of all ages. During 2012, several multistate outbreaks of STEC infection were linked to foods, including organic spinach and spring mix blend (STEC O157:H7) and raw clover sprouts (STEC O26) (1).
Public health actions to monitor, prevent, and control STEC infections are taken on the basis of serogroup characterization. Development of postdiarrheal hemolytic uremic syndrome (HUS), a severe complication of STEC infection, is most strongly associated with STEC O157. Non-O157 STEC, a diverse group that varies in virulence, comprises more than 50 other serogroups. In the United States, STEC O157 is the most commonly reported serogroup causing human infection (2); however, increased use of assays for the detection of Shiga toxins in clinical laboratories in recent years has led to increased reporting of non-O157 STEC infection (3). STEC can produce Shiga toxin (Stx) 1, Stx 2, or both. In general, strains that produce certain types of Stx 2 are the most virulent (4). Accounting for underdiagnosis, an estimated >96,000 illnesses were caused by STEC O157, and approximately 168,000 illnesses were caused by non-O157 STEC occur each year (5).
Stool specimens from patients with community-acquired diarrhea submitted to clinical laboratories should be tested routinely both by culture for STEC O157 and by an assay that detects Shiga toxins (or the genes that encode them) (6). Detection of Shiga toxin alone is inadequate for clinical management and public health investigation; characterizing STEC isolates by serogroup and by pulsed-field gel electrophoresis pattern is important to detect, investigate, and control outbreaks.
- CDC. Reports of selected E. coli outbreak investigations. Atlanta, GA: US Department of Health and Human Services, CDC; 2013. Available at http://www.cdc.gov/ecoli/outbreaks.html.
- CDC. National Shiga toxin-producing Escherichia coli (STEC) Surveillance Annual Summary, 2011. Atlanta, Georgia: US Department of Health and Human Services, CDC; 2013. Available at http://www.cdc.gov/ncezid/dfwed/pdfs/national-stec-surv-summ-2011-508c.pdf.
- Gould LH, Mody RK, Ong KL; Emerging Infections Program Foodnet Working Group. Increased recognition of non-O157 Shiga toxin-producing Escherichia coli infections in the United States during 2000–2010: epidemiologic features and comparison with E. coli O157 infections. Foodborne Pathog Dis 2013;10:453–60.
- Mody RK, Griffin PM. Fecal shedding of Shiga toxin-producing Escherichia coli: what should be done to prevent secondary cases? Clin Infect Dis 2013;56:1141–4.
- Scallan E, Hoekstra RM, Angulo FJ, et al. Foodborne illness acquired in the United States—major pathogens. Emerg Infect Dis 2011;17:7–15.
- CDC. Recommendations for diagnosis of Shiga toxin-producing Escherichia coli infections by clinical laboratories, 2009. MMWR 2009;58:(No. RR-12).
Syphilis, Congenital
Trends in congenital syphilis (CS) usually follow trends in primary and secondary (P&S) syphilis among women, with a lag of 1–2 years. During 2005–2008, rates of female P&S and CS increased. From 2009 to 2012 the rates of female P&S and CS declined. In 2012, the CS rate of 7.8 cases per 100,000 live births was the lowest rate reported since the surveillance case definition for CS was revised in 1988. However, racial and ethnic disparities remain: rates of CS among blacks (29.6 cases per 100,000 live births) and among Hispanics (7.9 cases per 100,000 live births) were 14.1 and 3.8 higher times, respectively, the rate among whites (2.1 cases per 100,000 live births) (1).
- CDC. Sexually transmitted disease surveillance 2012. Atlanta, GA: US Department of Health and Human Services, CDC; 2014.
Syphilis, Primary and Secondary
Rates of primary and secondary (P&S) syphilis increased from 4.5 cases per 100,000 population in 2011 to 5.0 cases per 100,000 population in 2012. Rates remained unchanged among women (0.9 cases per 100,000 population), but increased among men for the 12th consecutive year. Rates were highest in men aged 20–24 years and 25–29 years. The increase in cases during 2011–2012 (15%) was larger than in previous years (6% during 2008–2009, 10% during 2009–2010, and 8% during 2010–2011). During 2007–2011, rates among black men aged 20–24 years increased 75% from 54.9 to 96.2 cases per 100,000 population; the magnitude of this increase (41.3 cases per 100,000 population) was the greatest reported for any age, sex, or race/ethnicity group. (1) In 2012, rates among men remained highest among blacks aged 20–24 years and 25–29 years (96.7 cases and 89.2 cases per 100,000 population, respectively). (1) During 2007–2012, 33 states and areas reported sex-of-partner data for 70% or more cases of P&S syphilis each year; cases among men having sex with men (MSM) increased each year. In 2012, 75% of cases of all primary and secondary syphilis cases were among MSM.
- CDC. Sexually transmitted disease surveillance 2012. Atlanta: U.S. Department of Health and Human Services, CDC; 2014.
Trichinellosis
The 12 cases in which a suspected or known source of infection was documented were attributed to the consumption of pork (n = six), bear (n = five), and wild boar (n = one). The pork exposures included domestic Berkshire (n = three), an unspecified type (n = two), and a foreign source (n = one). Of the persons who reported consuming bear meat, four admitted to either eating the meat rare or preparing it in a manner that was unlikely to thoroughly cook the meat (e.g., fried or with a countertop grill). For seven cases, no likely source of infection could be identified. The case reported in the Arizona resident occurred in late 2011 but was not reported until 2012.
Three small outbreaks were reported in 2012. The first was a three-person outbreak in a family for which no likely source of infection was identified because multiple undercooked pork and game meat meals were consumed during the incubation period. The second outbreak involved two persons who reported eating undercooked bear meat from Alaska. The third outbreak involved two persons who reported consuming undercooked pork chops at a restaurant and accounted for two of three domestic Berkshire pork-associated cases that might have come from free-range pigs. Although the U.S. demand for organic and free-range pork is increasing, the research regarding its safety relative to conventionally produced pork is limited and results are conflicting (1). Both organic/free-range and conventionally raised pork should be thoroughly cooked before consumption to prevent trichinellosis (2).
A confirmed diagnosis of trichinellosis is determined by a clinically compatible illness in a person with history of consumption of a likely meat source of infection and a positive laboratory test result that confirms infection with the parasite. In the majority of patients, trichinellosis is confirmed by serologic testing for Trichinella-specific antibodies. Specific antibodies typically are detectable between 3 and 5 weeks after infection, but might take as long as 60 days postinfection to develop (3). Multiple serum specimens should be drawn several weeks apart to demonstrate seroconversion in patients with clinically compatible illness and history of consumption of a likely meat source of infection whose initial specimen was negative. For patients without a clinically compatible illness and exposure to a likely meat source, the utility of serologic tests for Trichinella is limited because of the low predictive value of a positive result in such instances.
- US Department of Agriculture. Food safety fact sheet: organic pork and food safety. West Lafayette, IN: US Department of Agriculture; 2011. Available at http://www.ars.usda.gov/SP2UserFiles/Place/36022000/Organic%20Pork%20Food%20Safety%20Fact%20Sheet.pdf.
- CDC. Trichinellosis: prevention and control. July 19, 2013. Atlanta, GA: US Department of Health and Human Services, CDC; 2013. Available at http://www.cdc.gov/parasites/trichinellosis/prevent.html.
- Morakote N, Sukhavat K, Khamboonruang C, et al. Persistence of IgG, IgM, and IgE antibodies in human trichinosis. Trop Med Parasitol 1992;43:167–9.
Typhoid Fever
Typhoid fever is rare in the United States, and approximately 75% of cases are associated with international travel (1). The risk for infection is highest for travelers visiting friends and relatives in countries where typhoid fever is endemic, perhaps because they are less likely than other travelers to seek pretravel vaccination and to observe strict safe water and food practices. The risk also is higher for travelers who visit the areas when it is most highly endemic, such as the Indian subcontinent, even for a short time (2). In 2011, CDC removed pretravel typhoid vaccination recommendations for 26 low-risk destinations; pretravel vaccination guidelines are available at www.cdc.gov/travel (3).
- Lynch MF, Blanton EM, Bulens S, et al. Typhoid fever in the United States, 1999–2006. JAMA 2009;302:859–65.
- Steinberg EB, Bishop RB, Dempsey AF, et al. Typhoid fever in travelers: who should be targeted for prevention? Clin Infect Dis 2004;39:186–91.
- Johnson KJ, Gallagher NM, Mintz ED, et al. From the CDC: new country-specific recommendations for pre-travel typhoid vaccination. J Travel Med 2011;18:430–3.
Varicella
In 2012, data on varicella cases were reported to CDC through the National Notifiable Diseases Surveillance System from 40 states, an increase from 39 states in 2011. A second dose of varicella vaccine was added to the vaccination schedule for children in 2006 (1); varicella incidence in the 31 states meeting criteria for adequate and consistent reporting (2) has declined 77.1% from 31.4 per 100,000 in 2006 to 7.2 per 100,000 in 2012.
Variables critical for monitoring the effect of the varicella vaccination program include age, vaccination status, disease severity (e.g., number of lesions), outcome of the case (e.g., hospitalized), and whether the case is associated with an outbreak. Among the cases reported from the 31 states with adequate and consistent reporting (2) through 2012, data on age, vaccination status, disease severity, outcome, and whether the case was outbreak-related were included for 92%, 45%, 22%, 28%, and 65% of the cases, respectively, compared with 82%, 44%, 14%, 30%, and 65% in 2011. Reporting improved for some variables but not others. States are encouraged to increase completeness of reporting of these and other demographic, clinical, and epidemiologic variables to allow for effective continued monitoring of the impact of the 2-dose varicella vaccine program and changing varicella epidemiology.
- CDC. Prevention of varicella: recommendations of the Advisory Committee on Immunization Practices (ACIP). MMWR 2007;56:(No. RR-4).
- CDC. Evolution of varicella surveillance—selected states, 2000–2010. MMWR 2012;61:609–12.
Vibriosis
The incidence of reported vibriosis (infection caused by a species from the family Vibrionaceae other than toxigenic Vibrio cholerae O1 or O139) has increased over the past 15 years (1). Although vibriosis only became a nationally notifiable condition in 2007 (2), most states were reporting cases as early as 2000. In addition, the increase in reported cases nationally since 1996 is consistent with a similar increase in vibriosis cases reported by the 10 Foodborne Diseases Active Surveillance Network (FoodNet) sites (1). California and Florida report the largest numbers of cases annually. In 2012, an outbreak of V. parahemoyticus infections was associated with consumption of shellfish harvested from Oyster Bay Harbor, New York (3).
- Newton A, Kendall M, Vugia DJ, et al. Increasing rates of vibriosis in the United States, 1996–2010: review of surveillance data from 2 systems. Clin Infect Dis 2012;54(Suppl 5):S391–5.
- Council of State and Territorial Epidemiologists. National reporting for non-cholera Vibrio infections (vibriosis). Position statement 06-ID-05. Atlanta, GA: Council of State and Territorial Epidemiologists; 2006.
- Martinez-Urtaza J, Baker-Austin C, Jones JL. Spread of pacific northwest Vibrio parahaemolyticus strain. N Engl J Med 2013;369:1573–4.
PART 1 Summaries of Notifiable Diseases in the United States, 2012
Abbreviations and Symbols Used in Tables
U Data not available.
N Not reportable (i.e., report of disease is not required in that jurisdiction).
— No reported cases.
Notes: Rates <0.01 after rounding are listed as 0.
Data in the MMWR Summary of Notifiable Diseases — United States, 2012 might differ from data in other CDC surveillance reports because of differences in the timing of reports, the source of the data, the use of different case definitions, and print criteria.
|
TABLE 1. Reported cases of notifiable diseases,* by month — United States, 2012 |
||||||||||||||
|---|---|---|---|---|---|---|---|---|---|---|---|---|---|---|
|
Disease |
Jan. |
Feb. |
Mar. |
Apr. |
May |
June |
July |
Aug. |
Sept. |
Oct. |
Nov. |
Dec. |
Month not stated |
Total |
|
Arboviral diseases† |
||||||||||||||
|
California serogroup viruses |
||||||||||||||
|
neuroinvasive |
— |
— |
1 |
— |
2 |
9 |
21 |
20 |
14 |
6 |
— |
— |
— |
73 |
|
nonneuroinvasive |
— |
— |
— |
— |
1 |
2 |
4 |
— |
1 |
— |
— |
— |
— |
8 |
|
Eastern equine encephalitis virus |
||||||||||||||
|
neuroinvasive |
— |
— |
— |
— |
— |
1 |
2 |
3 |
8 |
1 |
— |
— |
— |
15 |
|
Powassan virus |
||||||||||||||
|
neuroinvasive |
— |
— |
— |
— |
3 |
4 |
— |
— |
— |
— |
— |
— |
— |
7 |
|
St. Louis encephalitis virus |
||||||||||||||
|
neuroinvasive |
— |
— |
— |
— |
— |
— |
— |
— |
1 |
— |
— |
— |
— |
1 |
|
nonneuroinvasive |
— |
— |
— |
— |
— |
— |
1 |
1 |
— |
— |
— |
— |
— |
2 |
|
West Nile virus |
||||||||||||||
|
neuroinvasive |
— |
— |
1 |
1 |
4 |
61 |
695 |
1,310 |
613 |
150 |
32 |
5 |
— |
2,872 |
|
nonneuroinvasive |
— |
— |
1 |
1 |
7 |
56 |
597 |
1,322 |
662 |
122 |
31 |
2 |
— |
2,801 |
|
Babesiosis |
15 |
4 |
18 |
21 |
54 |
158 |
222 |
119 |
66 |
61 |
120 |
79 |
— |
937 |
|
confirmed |
12 |
2 |
9 |
11 |
41 |
127 |
196 |
95 |
49 |
48 |
83 |
43 |
— |
716 |
|
probable |
3 |
2 |
9 |
10 |
13 |
31 |
26 |
24 |
17 |
13 |
37 |
36 |
— |
221 |
|
Botulism, total |
7 |
11 |
16 |
10 |
15 |
29 |
12 |
18 |
9 |
9 |
8 |
24 |
— |
168 |
|
foodborne |
— |
— |
4 |
2 |
1 |
3 |
1 |
6 |
1 |
1 |
1 |
7 |
— |
27 |
|
infant |
6 |
10 |
9 |
8 |
13 |
26 |
8 |
10 |
5 |
7 |
6 |
15 |
— |
123 |
|
other(wound and unspecified) |
1 |
1 |
3 |
— |
1 |
— |
3 |
2 |
3 |
1 |
1 |
2 |
— |
18 |
|
Brucellosis |
6 |
9 |
4 |
21 |
12 |
13 |
10 |
13 |
8 |
4 |
3 |
11 |
— |
114 |
|
Chancroid§ |
1 |
1 |
— |
3 |
2 |
1 |
1 |
— |
2 |
1 |
1 |
2 |
— |
15 |
|
Chlamydia trachomatis, infection§ |
105,502 |
110,857 |
140,484 |
110,083 |
113,318 |
131,723 |
106,784 |
114,812 |
139,652 |
114,657 |
97,623 |
137,481 |
— |
1,422,976 |
|
Cholera |
— |
1 |
1 |
1 |
2 |
6 |
— |
1 |
3 |
— |
1 |
1 |
— |
17 |
|
Coccidioidomycosis |
1,677 |
1,650 |
2,059 |
1,821 |
1,590 |
1,894 |
1,456 |
993 |
1,199 |
1,063 |
1,177 |
1,223 |
— |
17,802 |
|
Cryptosporidiosis, total |
430 |
413 |
672 |
538 |
520 |
748 |
751 |
1,035 |
1,157 |
602 |
473 |
617 |
— |
7,956 |
|
confirmed |
253 |
251 |
393 |
306 |
321 |
455 |
520 |
728 |
776 |
404 |
303 |
388 |
— |
5,098 |
|
probable |
162 |
151 |
276 |
221 |
190 |
280 |
216 |
297 |
373 |
182 |
155 |
215 |
— |
2,718 |
|
Cyclosporiasis |
3 |
1 |
1 |
2 |
8 |
19 |
40 |
17 |
19 |
6 |
3 |
4 |
— |
123 |
|
Dengue Virus infections† |
||||||||||||||
|
Dengue fever |
25 |
15 |
14 |
10 |
13 |
47 |
65 |
92 |
85 |
53 |
67 |
58 |
— |
544 |
|
Dengue hemorrhagic fever |
— |
— |
— |
— |
— |
— |
— |
— |
1 |
— |
2 |
— |
— |
3 |
|
Diphtheria |
— |
— |
1 |
— |
— |
— |
— |
— |
— |
— |
— |
— |
— |
1 |
|
Ehrlichiosis/Anaplasmosis |
||||||||||||||
|
Anaplasma phagocytophilum |
37 |
28 |
114 |
191 |
318 |
559 |
378 |
234 |
172 |
117 |
118 |
123 |
— |
2,389 |
|
Ehrlichia chaffeensis |
3 |
4 |
27 |
48 |
115 |
262 |
208 |
106 |
105 |
52 |
21 |
177 |
— |
1,128 |
|
Ehrlichia ewingii |
— |
— |
— |
2 |
— |
3 |
6 |
5 |
1 |
— |
— |
— |
— |
17 |
|
Undetermined |
1 |
1 |
6 |
10 |
29 |
42 |
35 |
24 |
11 |
12 |
11 |
9 |
— |
191 |
|
Giardiasis |
921 |
980 |
1,248 |
964 |
1,029 |
1,314 |
1,297 |
1,528 |
2,024 |
1,323 |
1,031 |
1,519 |
— |
15,178 |
|
Gonorrhea§ |
24,907 |
23,979 |
30,933 |
24,249 |
25,906 |
31,073 |
26,294 |
27,658 |
33,841 |
28,202 |
23,335 |
34,449 |
— |
334,826 |
|
Haemophilus influenzae, invasive disease |
||||||||||||||
|
all ages, all serotypes |
326 |
310 |
361 |
276 |
283 |
302 |
205 |
194 |
246 |
194 |
237 |
484 |
— |
3,418 |
|
age <5 yrs |
||||||||||||||
|
serotype b |
4 |
3 |
1 |
3 |
2 |
1 |
1 |
3 |
5 |
1 |
1 |
5 |
— |
30 |
|
nonserotype b |
23 |
25 |
20 |
11 |
15 |
18 |
8 |
11 |
11 |
12 |
17 |
34 |
— |
205 |
|
unknown serotype |
12 |
27 |
24 |
17 |
14 |
25 |
9 |
9 |
16 |
13 |
20 |
24 |
— |
210 |
|
Hansen disease (leprosy) |
6 |
5 |
8 |
6 |
5 |
2 |
8 |
6 |
7 |
11 |
7 |
11 |
— |
82 |
|
Hantavirus pulmonary syndrome |
1 |
2 |
1 |
5 |
5 |
1 |
4 |
3 |
3 |
1 |
3 |
1 |
— |
30 |
|
Hemolytic uremic syndrome, post-diarrheal |
8 |
11 |
15 |
22 |
28 |
16 |
34 |
40 |
40 |
21 |
17 |
22 |
— |
274 |
|
Hepatitis virus, acute |
||||||||||||||
|
A |
75 |
139 |
143 |
121 |
162 |
133 |
116 |
109 |
166 |
120 |
87 |
191 |
— |
1,562 |
|
B |
203 |
195 |
288 |
218 |
223 |
289 |
254 |
234 |
245 |
225 |
197 |
324 |
— |
2,895 |
|
C |
105 |
136 |
153 |
139 |
139 |
194 |
128 |
151 |
171 |
124 |
114 |
228 |
— |
1,782 |
|
Hepatitis B perinatal infection |
2 |
2 |
2 |
2 |
2 |
5 |
3 |
1 |
7 |
5 |
2 |
7 |
— |
40 |
|
Human immunodeficiency virus (HIV) diagnoses¶ |
3,806 |
3,404 |
3,543 |
3,458 |
3,602 |
3,429 |
3,382 |
3,388 |
2,817 |
2,719 |
1,507 |
301 |
5 |
35,361 |
|
Influenza-associated pediatric mortality** |
1 |
3 |
9 |
7 |
6 |
5 |
3 |
— |
— |
1 |
1 |
16 |
— |
52 |
|
Invasive pneumococcal disease |
||||||||||||||
|
all ages |
1,536 |
1,554 |
2,109 |
1,345 |
1,189 |
1,070 |
649 |
536 |
892 |
992 |
1,132 |
2,631 |
— |
15,635 |
|
age <5 yrs |
106 |
103 |
159 |
100 |
112 |
85 |
54 |
43 |
105 |
108 |
105 |
186 |
— |
1,266 |
|
Legionellosis |
163 |
170 |
183 |
147 |
247 |
406 |
286 |
525 |
545 |
380 |
261 |
375 |
— |
3,688 |
|
Listeriosis |
40 |
37 |
47 |
47 |
54 |
73 |
68 |
77 |
83 |
81 |
39 |
81 |
— |
727 |
|
Lyme disease, total |
1,024 |
907 |
1,344 |
1,574 |
2,206 |
6,309 |
5,786 |
3,552 |
2,807 |
1,864 |
1,476 |
1,982 |
— |
30,831 |
|
Confirmed |
632 |
601 |
844 |
952 |
1,469 |
4,866 |
4,456 |
2,598 |
1,980 |
1,309 |
1,017 |
1,290 |
— |
22,014 |
|
Probable |
392 |
306 |
500 |
622 |
737 |
1,443 |
1,330 |
954 |
827 |
555 |
459 |
692 |
— |
8,817 |
|
Malaria |
102 |
55 |
84 |
77 |
106 |
179 |
171 |
175 |
207 |
102 |
66 |
179 |
— |
1,503 |
|
TABLE 1. (Continued) Reported cases of notifiable diseases,* by month — United States, 2012 |
||||||||||||||
|---|---|---|---|---|---|---|---|---|---|---|---|---|---|---|
|
Disease |
Jan. |
Feb. |
Mar. |
Apr. |
May |
June |
July |
Aug. |
Sept. |
Oct. |
Nov. |
Dec. |
Month not stated |
Total |
|
Measles, total |
15 |
13 |
— |
7 |
4 |
5 |
4 |
— |
6 |
— |
1 |
— |
— |
55 |
|
indigenous |
9 |
12 |
— |
3 |
— |
3 |
3 |
— |
4 |
— |
— |
— |
— |
34 |
|
imported |
6 |
1 |
— |
4 |
4 |
2 |
1 |
— |
2 |
— |
1 |
— |
— |
21 |
|
Meningococcal disease |
||||||||||||||
|
all serogroups |
48 |
44 |
77 |
51 |
46 |
47 |
34 |
23 |
32 |
38 |
38 |
73 |
— |
551 |
|
serogroup A,C,Y, and W-135 |
14 |
8 |
23 |
13 |
12 |
14 |
9 |
6 |
9 |
15 |
14 |
24 |
— |
161 |
|
serogroup B |
5 |
9 |
18 |
10 |
10 |
13 |
5 |
7 |
6 |
9 |
6 |
12 |
— |
110 |
|
serogroup other |
1 |
1 |
3 |
3 |
— |
3 |
1 |
1 |
1 |
1 |
— |
5 |
— |
20 |
|
serogroup unknown |
28 |
26 |
33 |
25 |
24 |
17 |
19 |
9 |
16 |
13 |
18 |
32 |
— |
260 |
|
Mumps |
21 |
16 |
28 |
18 |
13 |
21 |
18 |
22 |
16 |
13 |
11 |
32 |
— |
229 |
|
Novel influenza A virus infection |
— |
— |
1 |
— |
— |
1 |
8 |
268 |
33 |
— |
— |
2 |
— |
313 |
|
Pertussis |
1,989 |
2,198 |
3,049 |
3,963 |
5,153 |
6,392 |
5,176 |
4,760 |
4,778 |
3,271 |
3,249 |
4,299 |
— |
48,277 |
|
Plague |
— |
— |
— |
— |
— |
3 |
— |
— |
1 |
— |
— |
— |
— |
4 |
|
Psittacosis |
1 |
— |
— |
— |
— |
1 |
— |
— |
— |
— |
— |
— |
— |
2 |
|
Q fever, total |
11 |
14 |
9 |
18 |
15 |
11 |
12 |
11 |
9 |
8 |
4 |
13 |
— |
135 |
|
acute |
9 |
14 |
7 |
16 |
14 |
9 |
11 |
9 |
6 |
7 |
3 |
8 |
— |
113 |
|
chronic |
2 |
— |
2 |
2 |
1 |
2 |
1 |
2 |
3 |
1 |
1 |
5 |
— |
22 |
|
Rabies |
||||||||||||||
|
animal |
186 |
360 |
414 |
385 |
408 |
464 |
405 |
474 |
498 |
335 |
256 |
356 |
— |
4,541 |
|
human |
— |
— |
— |
— |
— |
1 |
— |
— |
— |
— |
— |
— |
— |
1 |
|
Rubella |
1 |
1 |
— |
2 |
— |
1 |
— |
2 |
— |
1 |
— |
1 |
— |
9 |
|
Rubella, congenital syndrome |
— |
1 |
1 |
— |
— |
— |
— |
— |
1 |
— |
— |
— |
— |
3 |
|
Salmonellosis |
1,989 |
2,052 |
2,860 |
3,164 |
3,834 |
5,739 |
5,635 |
6,640 |
7,792 |
5,327 |
4,413 |
4,355 |
— |
53,800 |
|
Shiga toxin-producing E. coli (STEC) |
242 |
213 |
325 |
395 |
484 |
666 |
667 |
809 |
899 |
632 |
538 |
593 |
— |
6,463 |
|
Shigellosis |
909 |
945 |
1,096 |
1,001 |
1,121 |
1,345 |
1,275 |
1,373 |
1,901 |
1,553 |
1,288 |
1,476 |
— |
15,283 |
|
Spotted fever rickettsiosis, total |
53 |
74 |
132 |
198 |
356 |
918 |
642 |
544 |
634 |
250 |
146 |
523 |
— |
4,470 |
|
confirmed |
5 |
3 |
15 |
15 |
20 |
28 |
24 |
33 |
19 |
6 |
7 |
13 |
— |
188 |
|
probable |
47 |
70 |
117 |
183 |
336 |
889 |
617 |
511 |
615 |
244 |
139 |
510 |
— |
4,278 |
|
Streptococcal toxic-shock syndrome |
23 |
19 |
23 |
21 |
19 |
14 |
17 |
6 |
10 |
6 |
22 |
14 |
— |
194 |
|
Syphillis, total, all stages§, †† |
3,240 |
3,606 |
4,951 |
3,939 |
3,954 |
4,569 |
3,762 |
3,965 |
4,932 |
4,334 |
3,625 |
5,026 |
— |
49,903 |
|
congenital (age <1 yr)§ |
16 |
26 |
26 |
21 |
29 |
25 |
22 |
21 |
47 |
30 |
22 |
37 |
— |
322 |
|
primary and secondary§ |
1,006 |
1,116 |
1,479 |
1,146 |
1,199 |
1,489 |
1,211 |
1,259 |
1,534 |
1,411 |
1,192 |
1,625 |
— |
15,667 |
|
Tetanus |
1 |
2 |
5 |
6 |
1 |
5 |
3 |
1 |
3 |
2 |
3 |
5 |
— |
37 |
|
Toxic-shock syndrome (other than streptococcal) |
5 |
6 |
3 |
4 |
4 |
4 |
6 |
7 |
10 |
6 |
4 |
6 |
— |
65 |
|
Trichinellosis |
1 |
3 |
1 |
1 |
3 |
— |
— |
4 |
— |
1 |
3 |
1 |
— |
18 |
|
Tuberculosis§§ |
507 |
695 |
790 |
758 |
875 |
937 |
858 |
835 |
747 |
890 |
729 |
1,324 |
— |
9,945 |
|
Tularemia |
— |
— |
1 |
14 |
20 |
24 |
23 |
10 |
18 |
22 |
8 |
9 |
— |
149 |
|
Typhoid fever |
30 |
22 |
31 |
22 |
22 |
28 |
26 |
32 |
50 |
31 |
9 |
51 |
— |
354 |
|
Vancomycin-intermediate Staphylococcus aureus (VISA) |
2 |
6 |
15 |
10 |
8 |
8 |
5 |
8 |
13 |
14 |
18 |
27 |
— |
134 |
|
Vancomycin-resistant Staphylococcus aureus (VRSA) |
— |
— |
— |
— |
— |
1 |
— |
1 |
— |
— |
— |
— |
— |
2 |
|
Varicella (Chickenpox) |
||||||||||||||
|
morbidity |
1,043 |
1,240 |
1,849 |
1,354 |
1,373 |
1,030 |
545 |
552 |
1,149 |
1,027 |
919 |
1,366 |
— |
13,447 |
|
mortality¶¶ |
— |
1 |
— |
— |
1 |
1 |
— |
— |
— |
— |
— |
— |
— |
3 |
|
Vibriosis |
28 |
21 |
55 |
57 |
54 |
120 |
139 |
181 |
197 |
112 |
77 |
70 |
— |
1,111 |
|
* No cases of anthrax; eastern equine encephalitis virus disease, nonneuroinvasive; poliomyelitis, paralytic; poliovirus infection, nonparalytic; Powassan virus nonneuroinvasive disease; severe acute respiratory syndrome-associated coronavirus disease (SARS-CoV); smallpox; western equine encephalitis virus disease, neuroinvasive and non-neuroinvasive; yellow fever; and viral hemorrhagic fevers were reported in the United States during 2012. Data on chronic hepatitis B and hepatitis C virus infection (past or present) are not included because they are undergoing data quality review. † Totals reported to the Division of Vector-Borne Diseases (DVBD), National Center for Emerging and Zoonotic Infectious Diseases (NCEZID) (ArboNET Surveillance), as of June 1, 2013. § Totals reported to the Division of STD Prevention, National Center for HIV/AIDS, Viral Hepatitis, STD, and TB Prevention (NCHHSTP), as of May 29, 2013. ¶ Total number of HIV diagnoses reported to the Division of HIV/AIDS Prevention, National Center for HIV/AIDS, Viral Hepatitis, STD, and TB Prevention (NCHHSTP) through December 31, 2012. ** Totals reported to the Division of Influenza, National Center for Immunization and Respiratory Diseases (NCIRD), as of December 31, 2012. †† Includes the following categories: primary, secondary, latent (including early latent, late latent, and latent syphilis of unknown duration), neurosyphilis, late (including late syphilis with clinical manifestations other than neurosyphilis), and congenital syphilis. Totals reported to the Division of STD Prevention, NCHHSTP, as of May 29, 2013. §§ Totals reported to the Division of Tuberculosis Elimination, NCHHSTP, as of June 15, 2013. ¶¶ Totals reported to the Division of Viral Diseases, NCIRD, as of May 1, 2013. |
||||||||||||||
|
TABLE 2. Reported cases of notifiable diseases,* by geographic division and area — United States, 2012 |
|||||||||
|
Area |
Total Resident Population (in thousands) |
Arboviral diseases† |
|||||||
|---|---|---|---|---|---|---|---|---|---|
|
California serogroup viruses |
Eastern equine encephalitis virus |
Powassan virus |
St. Louis encephalitis virus |
West Nile virus |
|||||
|
Neuro- |
Nonneuro- invasive |
Neuro- |
Neuro- |
Neuro- |
Nonneuro- invasive |
Neuro- |
Nonneuro- invasive |
||
|
United States |
311,589 |
73 |
8 |
15 |
7 |
1 |
2 |
2,872 |
2,801 |
|
New England |
14,519 |
— |
— |
9 |
— |
— |
— |
42 |
21 |
|
Connecticut |
3,587 |
— |
— |
— |
— |
— |
— |
12 |
9 |
|
Maine |
1,329 |
— |
— |
— |
— |
— |
— |
1 |
— |
|
Massachusetts |
6,607 |
— |
— |
7 |
— |
— |
— |
25 |
8 |
|
New Hampshire |
1,318 |
— |
— |
— |
— |
— |
— |
1 |
— |
|
Rhode Island |
1,051 |
— |
— |
— |
— |
— |
— |
2 |
2 |
|
Vermont |
627 |
— |
— |
2 |
— |
— |
— |
1 |
2 |
|
Mid. Atlantic |
41,081 |
1 |
— |
— |
1 |
— |
— |
116 |
99 |
|
New Jersey |
8,835 |
— |
— |
— |
— |
— |
— |
22 |
26 |
|
New York (Upstate) |
11,232 |
1 |
— |
— |
1 |
— |
— |
35 |
31 |
|
New York City |
8,270 |
— |
— |
— |
— |
— |
— |
26 |
15 |
|
Pennsylvania |
12,744 |
— |
— |
— |
— |
— |
— |
33 |
27 |
|
E.N. Central |
46,504 |
16 |
3 |
— |
2 |
— |
— |
494 |
253 |
|
Illinois |
12,860 |
— |
— |
— |
— |
— |
— |
187 |
103 |
|
Indiana |
6,516 |
2 |
1 |
— |
— |
— |
— |
46 |
31 |
|
Michigan |
9,877 |
— |
— |
— |
— |
— |
— |
141 |
61 |
|
Ohio |
11,541 |
12 |
1 |
— |
— |
— |
— |
76 |
45 |
|
Wisconsin |
5,710 |
2 |
1 |
— |
2 |
— |
— |
44 |
13 |
|
W.N. Central |
20,641 |
4 |
— |
— |
4 |
— |
— |
225 |
437 |
|
Iowa |
3,064 |
— |
— |
— |
— |
— |
— |
11 |
20 |
|
Kansas |
2,870 |
— |
— |
— |
— |
— |
— |
20 |
36 |
|
Minnesota |
5,347 |
4 |
— |
— |
4 |
— |
— |
34 |
36 |
|
Missouri |
6,009 |
— |
— |
— |
— |
— |
— |
17 |
3 |
|
Nebraska |
1,842 |
— |
— |
— |
— |
— |
— |
42 |
151 |
|
North Dakota |
685 |
— |
— |
— |
— |
— |
— |
39 |
50 |
|
South Dakota |
824 |
— |
— |
— |
— |
— |
— |
62 |
141 |
|
S. Atlantic |
60,544 |
39 |
5 |
6 |
— |
— |
— |
185 |
129 |
|
Delaware |
908 |
— |
— |
— |
— |
— |
— |
2 |
7 |
|
District of Columbia |
619 |
— |
— |
— |
— |
— |
— |
8 |
2 |
|
Florida |
19,082 |
— |
— |
2 |
— |
— |
— |
52 |
21 |
|
Georgia |
9,812 |
— |
— |
1 |
— |
— |
— |
46 |
53 |
|
Maryland |
5,840 |
— |
— |
— |
— |
— |
— |
25 |
22 |
|
North Carolina |
9,651 |
26 |
— |
2 |
— |
— |
— |
7 |
— |
|
South Carolina |
4,673 |
2 |
— |
— |
— |
— |
— |
20 |
9 |
|
Virginia |
8,104 |
2 |
— |
1 |
— |
— |
— |
20 |
10 |
|
West Virginia |
1,855 |
9 |
5 |
— |
— |
— |
— |
5 |
5 |
|
E.S. Central |
18,548 |
10 |
— |
— |
— |
— |
— |
173 |
192 |
|
Alabama |
4,804 |
— |
— |
— |
— |
— |
— |
38 |
24 |
|
Kentucky |
4,367 |
— |
— |
— |
— |
— |
— |
13 |
10 |
|
Mississippi |
2,977 |
1 |
— |
— |
— |
— |
— |
103 |
144 |
|
Tennessee |
6,400 |
9 |
— |
— |
— |
— |
— |
19 |
14 |
|
W.S. Central |
36,930 |
3 |
— |
— |
— |
1 |
2 |
1,146 |
1,312 |
|
Arkansas |
2,939 |
— |
— |
— |
— |
— |
— |
44 |
20 |
|
Louisiana |
4,575 |
— |
— |
— |
— |
— |
— |
155 |
180 |
|
Oklahoma |
3,784 |
— |
— |
— |
— |
— |
— |
103 |
88 |
|
Texas |
25,632 |
3 |
— |
— |
— |
1 |
2 |
844 |
1,024 |
|
Mountain |
22,345 |
— |
— |
— |
— |
— |
— |
190 |
165 |
|
Arizona |
6,467 |
— |
— |
— |
— |
— |
— |
87 |
46 |
|
Colorado |
5,116 |
— |
— |
— |
— |
— |
— |
62 |
69 |
|
Idaho |
1,584 |
— |
— |
— |
— |
— |
— |
5 |
12 |
|
Montana |
998 |
— |
— |
— |
— |
— |
— |
1 |
5 |
|
Nevada |
2,720 |
— |
— |
— |
— |
— |
— |
5 |
4 |
|
New Mexico |
2,079 |
— |
— |
— |
— |
— |
— |
24 |
23 |
|
Utah |
2,814 |
— |
— |
— |
— |
— |
— |
3 |
2 |
|
Wyoming |
567 |
— |
— |
— |
— |
— |
— |
3 |
4 |
|
Pacific |
50,477 |
— |
— |
— |
— |
— |
— |
301 |
193 |
|
Alaska |
724 |
— |
— |
— |
— |
— |
— |
— |
— |
|
California |
37,684 |
— |
— |
— |
— |
— |
— |
297 |
182 |
|
Hawaii |
1,378 |
— |
— |
— |
— |
— |
— |
— |
— |
|
Oregon |
3,868 |
— |
— |
— |
— |
— |
— |
— |
11 |
|
Washington |
6,823 |
— |
— |
— |
— |
— |
— |
4 |
— |
|
Territories |
|||||||||
|
American Samoa |
55 |
— |
— |
— |
— |
— |
— |
— |
— |
|
C.N.M.I. |
52 |
— |
— |
— |
— |
— |
— |
— |
— |
|
Guam |
160 |
— |
— |
— |
— |
— |
— |
— |
— |
|
Puerto Rico |
3,707 |
— |
— |
— |
— |
— |
— |
1 |
— |
|
U.S. Virgin Islands |
106 |
— |
— |
— |
— |
— |
— |
— |
— |
|
Abbreviations: N = not reportable; U = unavailable; — = no reported cases; CNMI = Commonwealth of the Northern Mariana Islands. * No cases of anthrax; eastern equine encephalitis virus disease, nonneuroinvasive; poliomyelitis, paralytic; poliovirus infection, nonparalytic; Powassan virus nonneuroinvasive disease; severe acute respiratory syndrome-associated coronavirus disease (SARS-CoV); smallpox; western equine encephalitis virus disease, neuroinvasive and non-neuroinvasive; yellow fever; and viral hemorrhagic fevers were reported in the United States during 2012. Data on chronic hepatitis B and hepatitis C virus infection (past or present) are not included because they are undergoing data quality review. † Totals reported to the Division of Vector-Borne Diseases (DVBD), National Center for Emerging and Zoonotic Infectious Diseases (NCZVED) (ArboNET Surveillance), as of June 1, 2013. |
|||||||||
|
TABLE 2. (Continued) Reported cases of notifiable diseases,* by geographic division and area — United States, 2012 |
|||||||||
|
Area |
Babesiosis |
Botulism |
Brucellosis |
Chancroid§ |
|||||
|---|---|---|---|---|---|---|---|---|---|
|
Total |
Confirmed |
Probable |
Total |
Foodborne |
Infant |
Other† |
|||
|
United States |
937 |
716 |
221 |
168 |
27 |
123 |
18 |
114 |
15 |
|
New England |
471 |
418 |
53 |
2 |
— |
2 |
— |
— |
1 |
|
Connecticut |
123 |
106 |
17 |
1 |
— |
1 |
— |
— |
— |
|
Maine |
10 |
8 |
2 |
— |
— |
— |
— |
— |
— |
|
Massachusetts |
261 |
237 |
24 |
1 |
— |
1 |
— |
— |
1 |
|
New Hampshire |
19 |
18 |
1 |
— |
— |
— |
— |
— |
— |
|
Rhode Island |
56 |
47 |
9 |
— |
— |
— |
— |
— |
— |
|
Vermont |
2 |
2 |
— |
— |
— |
— |
— |
— |
— |
|
Mid. Atlantic |
346 |
224 |
122 |
37 |
2 |
34 |
1 |
4 |
— |
|
New Jersey |
92 |
75 |
17 |
7 |
1 |
6 |
— |
— |
— |
|
New York (Upstate) |
226 |
130 |
96 |
5 |
— |
4 |
1 |
— |
— |
|
New York City |
28 |
19 |
9 |
4 |
1 |
3 |
— |
3 |
— |
|
Pennsylvania |
N |
N |
N |
21 |
— |
21 |
— |
1 |
— |
|
E.N. Central |
72 |
55 |
17 |
11 |
4 |
7 |
— |
10 |
3 |
|
Illinois |
2 |
1 |
1 |
1 |
— |
1 |
— |
5 |
— |
|
Indiana |
1 |
— |
1 |
— |
— |
— |
— |
3 |
1 |
|
Michigan |
— |
— |
— |
4 |
2 |
2 |
— |
1 |
2 |
|
Ohio |
N |
N |
N |
6 |
2 |
4 |
— |
— |
— |
|
Wisconsin |
69 |
54 |
15 |
— |
— |
— |
— |
1 |
— |
|
W.N. Central |
41 |
14 |
27 |
2 |
— |
1 |
1 |
2 |
— |
|
Iowa |
N |
N |
N |
— |
— |
— |
— |
— |
— |
|
Kansas |
N |
N |
N |
1 |
— |
— |
1 |
1 |
— |
|
Minnesota |
40 |
13 |
27 |
— |
— |
— |
— |
— |
— |
|
Missouri |
N |
N |
N |
1 |
— |
1 |
— |
1 |
— |
|
Nebraska |
1 |
1 |
— |
— |
— |
— |
— |
— |
— |
|
North Dakota |
— |
— |
— |
— |
— |
— |
— |
— |
— |
|
South Dakota |
N |
N |
N |
— |
— |
— |
— |
— |
— |
|
S. Atlantic |
3 |
1 |
2 |
10 |
1 |
8 |
1 |
28 |
3 |
|
Delaware |
— |
— |
— |
1 |
1 |
— |
— |
— |
— |
|
District of Columbia |
N |
N |
N |
1 |
— |
1 |
— |
— |
— |
|
Florida |
N |
N |
N |
1 |
— |
1 |
— |
17 |
— |
|
Georgia |
N |
N |
N |
1 |
— |
1 |
— |
4 |
— |
|
Maryland |
3 |
1 |
2 |
2 |
— |
2 |
— |
1 |
1 |
|
North Carolina |
N |
N |
N |
1 |
— |
1 |
— |
5 |
1 |
|
South Carolina |
N |
N |
N |
1 |
— |
— |
1 |
— |
— |
|
Virginia |
N |
N |
N |
2 |
— |
2 |
— |
— |
1 |
|
West Virginia |
N |
N |
N |
— |
— |
— |
— |
1 |
— |
|
E.S. Central |
— |
— |
— |
7 |
— |
7 |
— |
2 |
1 |
|
Alabama |
— |
— |
— |
— |
— |
— |
— |
— |
1 |
|
Kentucky |
N |
N |
N |
4 |
— |
4 |
— |
1 |
— |
|
Mississippi |
N |
N |
N |
2 |
— |
2 |
— |
— |
— |
|
Tennessee |
— |
— |
— |
1 |
— |
1 |
— |
1 |
— |
|
W.S. Central |
— |
— |
— |
4 |
— |
3 |
1 |
22 |
— |
|
Arkansas |
N |
N |
N |
1 |
— |
1 |
— |
2 |
— |
|
Louisiana |
N |
N |
N |
— |
— |
— |
— |
2 |
— |
|
Oklahoma |
N |
N |
N |
1 |
— |
1 |
— |
— |
— |
|
Texas |
N |
N |
N |
2 |
— |
1 |
1 |
18 |
— |
|
Mountain |
— |
— |
— |
30 |
12 |
18 |
— |
9 |
— |
|
Arizona |
N |
N |
N |
14 |
12 |
2 |
— |
5 |
— |
|
Colorado |
N |
N |
N |
1 |
— |
1 |
— |
2 |
— |
|
Idaho |
N |
N |
N |
2 |
— |
2 |
— |
— |
— |
|
Montana |
— |
— |
— |
— |
— |
— |
— |
— |
— |
|
Nevada |
N |
N |
N |
— |
— |
— |
— |
— |
— |
|
New Mexico |
N |
N |
N |
2 |
— |
2 |
— |
— |
— |
|
Utah |
N |
N |
N |
9 |
— |
9 |
— |
2 |
— |
|
Wyoming |
— |
— |
— |
2 |
— |
2 |
— |
— |
— |
|
Pacific |
4 |
4 |
— |
65 |
8 |
43 |
14 |
37 |
7 |
|
Alaska |
N |
N |
N |
3 |
3 |
— |
— |
1 |
— |
|
California |
4 |
4 |
— |
52 |
3 |
36 |
13 |
34 |
7 |
|
Hawaii |
N |
N |
N |
— |
— |
— |
— |
2 |
— |
|
Oregon |
— |
— |
— |
4 |
1 |
3 |
— |
— |
— |
|
Washington |
— |
— |
— |
6 |
1 |
4 |
1 |
— |
— |
|
Territories |
|||||||||
|
American Samoa |
U |
U |
U |
— |
— |
— |
— |
— |
— |
|
C.N.M.I. |
— |
— |
— |
— |
— |
— |
— |
— |
— |
|
Guam |
— |
— |
— |
— |
— |
— |
— |
— |
— |
|
Puerto Rico |
N |
N |
N |
N |
N |
N |
N |
— |
— |
|
U.S. Virgin Islands |
N |
N |
N |
— |
— |
— |
— |
— |
— |
|
Abbreviations: N = not reportable; U: Unavailable —: No reported cases C.N.M.I.: Commonwealth of the Northern Mariana Islands. * No cases of anthrax; eastern equine encephalitis virus disease, nonneuroinvasive; poliomyelitis, paralytic; poliovirus infection, nonparalytic; Powassan virus nonneuroinvasive disease; severe acute respiratory syndrome-associated coronavirus disease (SARS-CoV); smallpox; western equine encephalitis virus disease, neuroinvasive and non-neuroinvasive; yellow fever; and viral hemorrhagic fevers were reported in the United States during 2012. Data on chronic hepatitis B and hepatitis C virus infection (past or present) are not included because they are undergoing data quality review. † Includes cases reported as wound and unspecified botulism. § Totals reported to the Division of STD Prevention, NCHHSTP, as of May 29, 2013. |
|||||||||
|
TABLE 2. (Continued) Reported cases of notifiable diseases,* by geographic division and area — United States, 2012 |
|||||||
|
Area |
Chlamydia trachomatis infection† |
Cholera |
Coccidioidomycosis |
Cryptosporidiosis |
|||
|---|---|---|---|---|---|---|---|
|
Total |
Confirmed |
Probable |
Cyclosporiasis |
||||
|
United States |
1,422,976 |
17 |
17,802 |
7,956 |
5,098 |
2,718 |
123 |
|
New England |
49,137 |
1 |
3 |
391 |
333 |
58 |
7 |
|
Connecticut |
13,065 |
— |
N |
41 |
41 |
— |
6 |
|
Maine |
3,413 |
— |
N |
58 |
32 |
26 |
N |
|
Massachusetts |
23,550 |
1 |
— |
155 |
155 |
— |
1 |
|
New Hampshire |
3,072 |
— |
2 |
54 |
22 |
32 |
— |
|
Rhode Island |
4,313 |
— |
1 |
16 |
16 |
— |
— |
|
Vermont |
1,724 |
— |
N |
67 |
67 |
— |
N |
|
Mid. Atlantic |
182,810 |
6 |
4 |
809 |
669 |
140 |
28 |
|
New Jersey |
27,271 |
— |
N |
42 |
41 |
1 |
7 |
|
New York (Upstate) |
38,227 |
— |
N |
229 |
220 |
9 |
5 |
|
New York City |
62,319 |
4 |
N |
124 |
121 |
3 |
16 |
|
Pennsylvania |
54,993 |
2 |
4 |
414 |
287 |
127 |
N |
|
E.N. Central |
221,639 |
— |
51 |
1,863 |
1,154 |
709 |
2 |
|
Illinois |
67,701 |
— |
N |
173 |
73 |
100 |
2 |
|
Indiana |
29,505 |
— |
N |
164 |
127 |
37 |
— |
|
Michigan |
47,566 |
— |
27 |
351 |
285 |
66 |
— |
|
Ohio |
53,141 |
— |
22 |
569 |
64 |
505 |
— |
|
Wisconsin |
23,726 |
— |
2 |
606 |
605 |
1 |
— |
|
W.N. Central |
81,983 |
— |
151 |
1,349 |
626 |
723 |
2 |
|
Iowa |
11,377 |
— |
N |
328 |
78 |
250 |
— |
|
Kansas |
11,135 |
— |
N |
122 |
65 |
57 |
— |
|
Minnesota |
18,056 |
— |
119 |
347 |
213 |
134 |
— |
|
Missouri |
27,835 |
— |
17 |
239 |
109 |
130 |
2 |
|
Nebraska |
6,748 |
— |
1 |
165 |
127 |
38 |
— |
|
North Dakota |
2,908 |
— |
14 |
35 |
3 |
32 |
N |
|
South Dakota |
3,924 |
— |
N |
113 |
31 |
82 |
— |
|
S. Atlantic |
285,340 |
9 |
9 |
1,142 |
686 |
456 |
34 |
|
Delaware |
4,438 |
— |
1 |
15 |
7 |
8 |
— |
|
District of Columbia |
6,808 |
— |
1 |
N |
N |
N |
N |
|
Florida |
77,644 |
7 |
N |
470 |
243 |
227 |
25 |
|
Georgia |
52,418 |
— |
N |
257 |
257 |
— |
2 |
|
Maryland |
26,534 |
2 |
7 |
86 |
30 |
56 |
4 |
|
North Carolina |
50,596 |
— |
N |
86 |
28 |
58 |
2 |
|
South Carolina |
27,149 |
— |
N |
72 |
36 |
36 |
— |
|
Virginia |
34,963 |
— |
N |
144 |
81 |
63 |
1 |
|
West Virginia |
4,790 |
— |
N |
12 |
4 |
8 |
— |
|
E.S. Central |
103,473 |
— |
— |
284 |
148 |
136 |
2 |
|
Alabama |
30,621 |
— |
N |
109 |
19 |
90 |
N |
|
Kentucky |
17,273 |
— |
N |
63 |
50 |
13 |
N |
|
Mississippi |
23,054 |
— |
N |
40 |
40 |
— |
N |
|
Tennessee |
32,525 |
— |
N |
72 |
39 |
33 |
2 |
|
W.S. Central |
187,843 |
1 |
4 |
596 |
482 |
114 |
45 |
|
Arkansas |
16,611 |
— |
N |
42 |
41 |
1 |
— |
|
Louisiana |
27,353 |
— |
4 |
155 |
155 |
— |
1 |
|
Oklahoma |
16,843 |
— |
N |
97 |
14 |
83 |
— |
|
Texas |
127,036 |
1 |
N |
302 |
272 |
30 |
44 |
|
Mountain |
93,204 |
— |
13,140 |
830 |
676 |
154 |
1 |
|
Arizona |
30,444 |
— |
12,920 |
47 |
35 |
12 |
— |
|
Colorado |
21,631 |
— |
N |
102 |
63 |
39 |
1 |
|
Idaho |
4,550 |
— |
N |
267 |
182 |
85 |
N |
|
Montana |
3,827 |
— |
3 |
69 |
69 |
— |
N |
|
Nevada |
11,137 |
— |
118 |
15 |
9 |
6 |
N |
|
New Mexico |
11,898 |
— |
37 |
94 |
91 |
3 |
— |
|
Utah |
7,615 |
— |
56 |
202 |
196 |
6 |
— |
|
Wyoming |
2,102 |
— |
6 |
34 |
31 |
3 |
— |
|
Pacific |
217,547 |
— |
4,440 |
692 |
324 |
228 |
2 |
|
Alaska |
5,462 |
— |
N |
7 |
7 |
— |
N |
|
California |
167,695 |
— |
4,431 |
365 |
216 |
9 |
1 |
|
Hawaii |
6,340 |
— |
N |
5 |
5 |
— |
— |
|
Oregon |
13,454 |
— |
2 |
214 |
16 |
198 |
1 |
|
Washington |
24,596 |
— |
7 |
101 |
80 |
21 |
— |
|
Territories |
|||||||
|
American Samoa |
— |
— |
N |
N |
N |
N |
N |
|
C.N.M.I. |
— |
— |
— |
— |
— |
— |
— |
|
Guam |
1,031 |
— |
— |
— |
— |
— |
— |
|
Puerto Rico |
6,227 |
— |
N |
N |
N |
N |
N |
|
U.S. Virgin Islands |
802 |
— |
— |
— |
— |
— |
— |
|
Abbreviations: N = not reportable; U = unavailable; — = no reported cases; CNMI = Commonwealth of the Northern Mariana Islands. * No cases of anthrax; eastern equine encephalitis virus disease, nonneuroinvasive; poliomyelitis, paralytic; poliovirus infection, nonparalytic; Powassan virus nonneuroinvasive disease; severe acute respiratory syndrome-associated coronavirus disease (SARS-CoV); smallpox; western equine encephalitis virus disease, neuroinvasive and non-neuroinvasive; yellow fever; and viral hemorrhagic fevers were reported in the United States during 2012. Data on chronic hepatitis B and hepatitis C virus infection (past or present) are not included because they are undergoing data quality review. † Totals reported to the Division of STD Prevention, NCHHSTP, as of May 29, 2013. |
|||||||
|
TABLE 2. (Continued) Reported cases of notifiable diseases,* by geographic division and area — United States, 2012 |
|||||||
|
Area |
Dengue virus infection† |
Ehrlichiosis/Anaplasmosis |
|||||
|---|---|---|---|---|---|---|---|
|
Dengue fever |
Dengue hemorrhagic fever |
Diphtheria |
Anaplasma phagocytophilum |
Ehrlichia chaffeensis |
Ehrlichia ewingii |
Undetermined |
|
|
United States |
544 |
3 |
1 |
2,389 |
1,128 |
17 |
191 |
|
New England |
17 |
— |
— |
659 |
52 |
— |
— |
|
Connecticut |
16 |
— |
— |
142 |
— |
— |
— |
|
Maine |
— |
— |
— |
52 |
3 |
— |
— |
|
Massachusetts |
— |
— |
— |
318 |
25 |
— |
— |
|
New Hampshire |
— |
— |
— |
52 |
3 |
— |
— |
|
Rhode Island |
— |
— |
— |
86 |
21 |
— |
— |
|
Vermont |
1 |
— |
— |
9 |
— |
— |
— |
|
Mid. Atlantic |
132 |
— |
1 |
482 |
123 |
— |
31 |
|
New Jersey |
— |
— |
— |
139 |
58 |
— |
1 |
|
New York (Upstate) |
16 |
— |
1 |
315 |
48 |
— |
13 |
|
New York City |
95 |
— |
— |
20 |
11 |
— |
— |
|
Pennsylvania |
21 |
— |
— |
8 |
6 |
— |
17 |
|
E.N. Central |
55 |
1 |
— |
604 |
61 |
1 |
102 |
|
Illinois |
20 |
1 |
— |
12 |
36 |
1 |
1 |
|
Indiana |
9 |
— |
— |
— |
— |
— |
35 |
|
Michigan |
9 |
— |
— |
6 |
2 |
— |
— |
|
Ohio |
6 |
— |
— |
1 |
3 |
— |
1 |
|
Wisconsin |
11 |
— |
— |
585 |
20 |
— |
65 |
|
W.N. Central |
19 |
1 |
— |
538 |
236 |
11 |
27 |
|
Iowa |
2 |
— |
— |
N |
N |
N |
N |
|
Kansas |
1 |
— |
— |
7 |
41 |
1 |
— |
|
Minnesota |
9 |
— |
— |
503 |
9 |
— |
17 |
|
Missouri |
5 |
1 |
— |
23 |
186 |
10 |
9 |
|
Nebraska |
— |
— |
— |
2 |
— |
— |
— |
|
North Dakota |
— |
— |
— |
3 |
— |
— |
— |
|
South Dakota |
2 |
— |
— |
— |
— |
— |
1 |
|
S. Atlantic |
185 |
— |
— |
56 |
334 |
2 |
11 |
|
Delaware |
— |
— |
— |
1 |
16 |
1 |
— |
|
District of Columbia |
— |
— |
— |
N |
N |
N |
N |
|
Florida |
139 |
— |
— |
5 |
23 |
— |
— |
|
Georgia |
11 |
— |
— |
5 |
24 |
— |
2 |
|
Maryland |
9 |
— |
— |
5 |
37 |
— |
— |
|
North Carolina |
7 |
— |
— |
21 |
109 |
— |
2 |
|
South Carolina |
2 |
— |
— |
— |
2 |
— |
— |
|
Virginia |
17 |
— |
— |
18 |
123 |
1 |
6 |
|
West Virginia |
— |
— |
— |
1 |
— |
— |
1 |
|
E.S. Central |
12 |
— |
— |
26 |
102 |
3 |
11 |
|
Alabama |
4 |
— |
— |
11 |
10 |
— |
5 |
|
Kentucky |
1 |
— |
— |
1 |
29 |
— |
— |
|
Mississippi |
1 |
— |
— |
1 |
2 |
— |
— |
|
Tennessee |
6 |
— |
— |
13 |
61 |
3 |
6 |
|
W.S. Central |
23 |
— |
— |
24 |
220 |
— |
1 |
|
Arkansas |
— |
— |
— |
8 |
85 |
— |
— |
|
Louisiana |
6 |
— |
— |
— |
1 |
— |
1 |
|
Oklahoma |
1 |
— |
— |
15 |
130 |
— |
— |
|
Texas |
16 |
— |
— |
1 |
4 |
— |
— |
|
Mountain |
13 |
— |
— |
— |
— |
— |
2 |
|
Arizona |
8 |
— |
— |
— |
— |
— |
1 |
|
Colorado |
— |
— |
— |
N |
N |
N |
N |
|
Idaho |
1 |
— |
— |
N |
N |
N |
N |
|
Montana |
2 |
— |
— |
N |
N |
N |
N |
|
Nevada |
2 |
— |
— |
— |
— |
— |
— |
|
New Mexico |
— |
— |
— |
N |
N |
N |
N |
|
Utah |
— |
— |
— |
— |
— |
— |
1 |
|
Wyoming |
— |
— |
— |
— |
— |
— |
— |
|
Pacific |
88 |
1 |
— |
— |
— |
— |
6 |
|
Alaska |
1 |
— |
— |
N |
N |
N |
N |
|
California |
64 |
— |
— |
— |
— |
— |
6 |
|
Hawaii |
8 |
— |
— |
N |
N |
N |
N |
|
Oregon |
— |
— |
— |
— |
— |
— |
— |
|
Washington |
15 |
1 |
— |
— |
— |
— |
— |
|
Territories |
|||||||
|
American Samoa |
— |
— |
— |
N |
N |
N |
N |
|
C.N.M.I. |
— |
— |
— |
— |
— |
— |
— |
|
Guam |
— |
— |
— |
N |
N |
N |
N |
|
Puerto Rico |
5,907 |
118 |
— |
N |
N |
N |
N |
|
U.S. Virgin Islands |
141 |
1 |
— |
— |
— |
— |
— |
|
Abbreviations: N = not reportable; U = unavailable; — = no reported cases; CNMI = Commonwealth of the Northern Mariana Islands. * No cases of anthrax; eastern equine encephalitis virus disease, nonneuroinvasive; poliomyelitis, paralytic; poliovirus infection, nonparalytic; Powassan virus nonneuroinvasive disease; severe acute respiratory syndrome-associated coronavirus disease (SARS-CoV); smallpox; western equine encephalitis virus disease, neuroinvasive and non-neuroinvasive; yellow fever; and viral hemorrhagic fevers were reported in the United States during 2012. Data on chronic hepatitis B and hepatitis C virus infection (past or present) are not included because they are undergoing data quality review. † Total number of reported laboratory-positive dengue cases including all confirmed cases [by anti-dengue virus (DENV) molecular diagnostic methods or seroconversion of anti-DENV IgM] and all probable cases (by a single, positive anti-DENV IgM). Totals reported to the DVBD, NCEZID (ArboNET Surveillance), as of June 1, 2013. |
|||||||
|
TABLE 2. (Continued) Reported cases of notifiable diseases,* by geographic division and area — United States, 2012 |
|||||||
|---|---|---|---|---|---|---|---|
|
Area |
Giardiasis |
Gonorrhea† |
Haemophilus influenza, invasive disease |
Hansen disease (leprosy) |
|||
|
All ages, serotypes |
Age <5 years |
||||||
|
Serotype b |
Nonserotype b |
Unknown serotype |
|||||
|
United States |
15,178 |
334,826 |
3,418 |
30 |
205 |
210 |
82 |
|
New England |
1,436 |
5,970 |
235 |
2 |
13 |
7 |
3 |
|
Connecticut |
223 |
2,133 |
61 |
— |
— |
3 |
1 |
|
Maine |
169 |
456 |
23 |
— |
2 |
— |
N |
|
Massachusetts |
698 |
2,628 |
111 |
2 |
10 |
— |
1 |
|
New Hampshire |
105 |
147 |
12 |
— |
— |
4 |
1 |
|
Rhode Island |
58 |
507 |
19 |
— |
— |
— |
— |
|
Vermont |
183 |
99 |
9 |
— |
1 |
— |
N |
|
Mid. Atlantic |
2,928 |
45,447 |
674 |
8 |
29 |
24 |
5 |
|
New Jersey |
423 |
7,486 |
124 |
— |
— |
11 |
— |
|
New York (Upstate) |
975 |
7,884 |
201 |
4 |
9 |
3 |
N |
|
New York City |
872 |
14,687 |
123 |
— |
— |
7 |
4 |
|
Pennsylvania |
658 |
15,390 |
226 |
4 |
20 |
3 |
1 |
|
E.N. Central |
2,203 |
59,268 |
570 |
6 |
40 |
41 |
2 |
|
Illinois |
347 |
18,149 |
159 |
1 |
11 |
13 |
— |
|
Indiana |
227 |
7,338 |
104 |
2 |
13 |
1 |
— |
|
Michigan |
547 |
12,584 |
82 |
— |
— |
16 |
2 |
|
Ohio |
578 |
16,493 |
158 |
3 |
16 |
— |
— |
|
Wisconsin |
504 |
4,704 |
67 |
— |
— |
11 |
— |
|
W.N. Central |
1,726 |
17,676 |
245 |
2 |
7 |
23 |
4 |
|
Iowa |
251 |
2,006 |
— |
— |
— |
— |
— |
|
Kansas |
133 |
2,228 |
32 |
— |
1 |
3 |
— |
|
Minnesota |
610 |
3,082 |
85 |
2 |
6 |
6 |
1 |
|
Missouri |
330 |
7,889 |
82 |
— |
— |
8 |
3 |
|
Nebraska |
194 |
1,429 |
31 |
— |
— |
3 |
— |
|
North Dakota |
64 |
335 |
15 |
— |
— |
3 |
N |
|
South Dakota |
144 |
707 |
— |
— |
— |
— |
— |
|
S. Atlantic |
2,438 |
73,447 |
818 |
3 |
30 |
55 |
12 |
|
Delaware |
24 |
899 |
8 |
— |
1 |
— |
— |
|
District of Columbia |
77 |
2,402 |
3 |
— |
— |
1 |
— |
|
Florida |
1,095 |
19,462 |
229 |
— |
— |
24 |
10 |
|
Georgia |
544 |
15,326 |
186 |
— |
8 |
16 |
1 |
|
Maryland |
239 |
5,686 |
87 |
1 |
7 |
— |
— |
|
North Carolina |
N |
14,318 |
99 |
— |
— |
11 |
1 |
|
South Carolina |
128 |
7,638 |
72 |
1 |
4 |
3 |
— |
|
Virginia |
272 |
6,885 |
101 |
— |
8 |
— |
— |
|
West Virginia |
59 |
831 |
33 |
1 |
2 |
— |
N |
|
E.S. Central |
178 |
29,526 |
220 |
1 |
16 |
3 |
2 |
|
Alabama |
178 |
9,270 |
55 |
1 |
2 |
1 |
1 |
|
Kentucky |
N |
4,283 |
36 |
— |
1 |
— |
— |
|
Mississippi |
N |
6,875 |
26 |
— |
6 |
— |
1 |
|
Tennessee |
N |
9,098 |
103 |
— |
7 |
2 |
— |
|
W.S. Central |
332 |
50,094 |
207 |
— |
16 |
11 |
14 |
|
Arkansas |
108 |
4,307 |
30 |
— |
1 |
3 |
1 |
|
Louisiana |
224 |
8,873 |
57 |
— |
— |
8 |
3 |
|
Oklahoma |
N |
4,441 |
117 |
— |
15 |
— |
N |
|
Texas |
N |
32,473 |
3 |
— |
N |
N |
10 |
|
Mountain |
1,199 |
13,576 |
307 |
5 |
47 |
7 |
3 |
|
Arizona |
113 |
5,809 |
120 |
2 |
23 |
1 |
— |
|
Colorado |
356 |
2,822 |
58 |
— |
4 |
— |
— |
|
Idaho |
153 |
167 |
18 |
— |
3 |
1 |
— |
|
Montana |
67 |
108 |
6 |
— |
1 |
— |
— |
|
Nevada |
91 |
2,264 |
21 |
— |
1 |
1 |
2 |
|
New Mexico |
95 |
1,883 |
46 |
1 |
8 |
1 |
— |
|
Utah |
287 |
479 |
33 |
2 |
6 |
3 |
1 |
|
Wyoming |
37 |
44 |
5 |
— |
1 |
— |
— |
|
Pacific |
2,738 |
39,822 |
142 |
3 |
7 |
39 |
37 |
|
Alaska |
96 |
726 |
15 |
— |
— |
5 |
— |
|
California |
1,715 |
33,579 |
32 |
— |
— |
30 |
13 |
|
Hawaii |
34 |
815 |
22 |
— |
— |
4 |
24 |
|
Oregon |
381 |
1,464 |
69 |
2 |
4 |
— |
N |
|
Washington |
512 |
3,238 |
4 |
1 |
3 |
— |
N |
|
Territories |
|||||||
|
American Samoa |
— |
— |
— |
— |
— |
— |
— |
|
C.N.M.I. |
— |
— |
— |
— |
— |
— |
— |
|
Guam |
2 |
92 |
— |
— |
— |
— |
10 |
|
Puerto Rico |
24 |
345 |
— |
— |
— |
— |
— |
|
U.S. Virgin Islands |
— |
136 |
N |
N |
N |
N |
— |
|
Abbreviations: N = not reportable; U = unavailable; — = no reported cases; CNMI = Commonwealth of the Northern Mariana Islands. * No cases of anthrax; eastern equine encephalitis virus disease, nonneuroinvasive; poliomyelitis, paralytic; poliovirus infection, nonparalytic; Powassan virus nonneuroinvasive disease; severe acute respiratory syndrome-associated coronavirus disease (SARS-CoV); smallpox; western equine encephalitis virus disease, neuroinvasive and non-neuroinvasive; yellow fever; and viral hemorrhagic fevers were reported in the United States during 2012. Data on chronic hepatitis B and hepatitis C virus infection (past or present) are not included because they are undergoing data quality review. † Totals reported to the Division of STD Prevention, NCHHSTP, as of May 29, 2013. |
|||||||
|
TABLE 2. (Continued) Reported cases of notifiable diseases,* by geographic division and area — United States, 2012 |
|||||||
|
Area |
Hantavirus pulmonary syndrome |
Hemolytic uremic syndrome, postdiarrheal |
Hepatitis, viral, acute |
Hepatitis B perinatal infection |
HIV diagnoses† |
||
|---|---|---|---|---|---|---|---|
|
A |
B |
C |
|||||
|
United States |
30 |
274 |
1,562 |
2,895 |
1,782 |
40 |
35,361 |
|
New England |
— |
10 |
83 |
105 |
85 |
— |
935 |
|
Connecticut |
N |
2 |
23 |
15 |
34 |
— |
277 |
|
Maine |
— |
2 |
9 |
9 |
8 |
— |
38 |
|
Massachusetts |
— |
5 |
40 |
75 |
37 |
— |
510 |
|
New Hampshire |
— |
— |
6 |
4 |
N |
— |
44 |
|
Rhode Island |
— |
— |
3 |
U |
U |
— |
62 |
|
Vermont |
— |
1 |
2 |
2 |
6 |
— |
4 |
|
Mid. Atlantic |
2 |
16 |
233 |
246 |
230 |
12 |
5,616 |
|
New Jersey |
— |
3 |
60 |
70 |
71 |
2 |
990 |
|
New York (Upstate) |
1 |
12 |
63 |
50 |
83 |
3 |
1,327 |
|
New York City |
— |
1 |
48 |
63 |
10 |
4 |
2,026 |
|
Pennsylvania |
1 |
N |
62 |
63 |
66 |
3 |
1,273 |
|
E.N. Central |
1 |
42 |
235 |
457 |
245 |
4 |
3,771 |
|
Illinois |
1 |
7 |
67 |
86 |
26 |
1 |
1,388 |
|
Indiana |
— |
12 |
11 |
90 |
110 |
— |
472 |
|
Michigan |
— |
5 |
100 |
81 |
76 |
2 |
654 |
|
Ohio |
— |
10 |
36 |
178 |
7 |
1 |
1,013 |
|
Wisconsin |
— |
8 |
21 |
22 |
26 |
— |
244 |
|
W.N. Central |
2 |
52 |
89 |
99 |
62 |
2 |
1,161 |
|
Iowa |
1 |
10 |
7 |
13 |
3 |
— |
116 |
|
Kansas |
— |
7 |
15 |
9 |
16 |
— |
147 |
|
Minnesota |
— |
13 |
29 |
17 |
32 |
1 |
308 |
|
Missouri |
— |
18 |
20 |
48 |
4 |
1 |
496 |
|
Nebraska |
— |
1 |
16 |
10 |
3 |
— |
58 |
|
North Dakota |
— |
3 |
2 |
— |
— |
— |
9 |
|
South Dakota |
1 |
— |
— |
2 |
4 |
— |
27 |
|
S. Atlantic |
1 |
26 |
267 |
754 |
423 |
5 |
10,327 |
|
Delaware |
— |
— |
9 |
11 |
— |
1 |
136 |
|
District of Columbia |
N |
N |
— |
— |
— |
— |
509 |
|
Florida |
— |
1 |
87 |
247 |
107 |
1 |
4,629 |
|
Georgia |
— |
7 |
46 |
109 |
82 |
1 |
1,236 |
|
Maryland |
— |
4 |
28 |
52 |
39 |
— |
1,016 |
|
North Carolina |
— |
7 |
34 |
73 |
63 |
— |
1,145 |
|
South Carolina |
— |
4 |
6 |
37 |
1 |
— |
716 |
|
Virginia |
— |
3 |
49 |
84 |
76 |
2 |
871 |
|
West Virginia |
1 |
— |
8 |
141 |
55 |
— |
69 |
|
E.S. Central |
— |
26 |
78 |
577 |
331 |
1 |
2,120 |
|
Alabama |
N |
7 |
19 |
79 |
24 |
— |
545 |
|
Kentucky |
— |
N |
25 |
180 |
178 |
1 |
312 |
|
Mississippi |
N |
1 |
11 |
78 |
U |
N |
441 |
|
Tennessee |
— |
18 |
23 |
240 |
129 |
— |
822 |
|
W.S. Central |
— |
26 |
161 |
367 |
140 |
6 |
5,118 |
|
Arkansas |
— |
3 |
8 |
74 |
5 |
1 |
125 |
|
Louisiana |
— |
1 |
7 |
44 |
11 |
— |
1,156 |
|
Oklahoma |
— |
9 |
12 |
79 |
80 |
1 |
253 |
|
Texas |
— |
13 |
134 |
170 |
44 |
4 |
3,584 |
|
Mountain |
11 |
17 |
163 |
89 |
112 |
— |
1,504 |
|
Arizona |
1 |
2 |
93 |
14 |
U |
— |
590 |
|
Colorado |
3 |
6 |
28 |
24 |
42 |
— |
362 |
|
Idaho |
— |
3 |
11 |
5 |
11 |
— |
24 |
|
Montana |
3 |
1 |
6 |
2 |
9 |
— |
20 |
|
Nevada |
— |
— |
10 |
28 |
12 |
— |
326 |
|
New Mexico |
1 |
— |
10 |
3 |
21 |
— |
109 |
|
Utah |
2 |
5 |
4 |
13 |
17 |
— |
65 |
|
Wyoming |
1 |
— |
1 |
— |
— |
— |
8 |
|
Pacific |
13 |
59 |
253 |
201 |
154 |
10 |
4,809 |
|
Alaska |
N |
N |
1 |
1 |
— |
— |
26 |
|
California |
9 |
44 |
209 |
136 |
63 |
7 |
4,037 |
|
Hawaii |
— |
— |
5 |
5 |
— |
1 |
43 |
|
Oregon |
2 |
15 |
9 |
25 |
37 |
— |
205 |
|
Washington |
2 |
— |
29 |
34 |
54 |
2 |
498 |
|
Territories |
|||||||
|
American Samoa |
N |
N |
— |
— |
— |
— |
— |
|
C.N.M.I. |
— |
— |
— |
— |
— |
— |
— |
|
Guam |
N |
— |
— |
— |
— |
— |
2 |
|
Puerto Rico |
— |
N |
6 |
32 |
N |
— |
507 |
|
U.S. Virgin Islands |
— |
N |
— |
— |
— |
— |
8 |
|
Abbreviations: N = not reportable; U = unavailable; — = no reported cases; CNMI = Commonwealth of the Northern Mariana Islands. * No cases of anthrax; eastern equine encephalitis virus disease, nonneuroinvasive; poliomyelitis, paralytic; poliovirus infection, nonparalytic; Powassan virus nonneuroinvasive disease; severe acute respiratory syndrome-associated coronavirus disease (SARS-CoV); smallpox; western equine encephalitis virus disease, neuroinvasive and non-neuroinvasive; yellow fever; and viral hemorrhagic fevers were reported in the United States during 2012. Data on chronic hepatitis B and hepatitis C virus infection (past or present) are not included because they are undergoing data quality review. † Total number of HIV diagnoses reported to the Division of HIV/AIDS Prevention, National Center for HIV/AIDS, Viral Hepatitis, STD, and TB Prevention (NCHHSTP) through December 31, 2012. |
|||||||
|
TABLE 2. (Continued) Reported cases of notifiable diseases,* by geographic division and area — United States, 2012 |
|||||||||
|
Area |
Influenza- |
Invasive pneumococcal disease§ |
Legionellosis |
Listeriosis |
Lyme disease |
Malaria |
|||
|---|---|---|---|---|---|---|---|---|---|
|
All Ages |
Age <5 years |
Total |
Confirmed |
Probable |
|||||
|
United States |
52 |
15,635 |
1,266 |
3,688 |
727 |
30,831 |
22,014 |
8,817 |
1,503 |
|
New England |
1 |
1,199 |
77 |
308 |
60 |
11,095 |
7,455 |
3,640 |
104 |
|
Connecticut |
— |
309 |
17 |
55 |
22 |
2,657 |
1,653 |
1,004 |
21 |
|
Maine |
1 |
102 |
3 |
18 |
5 |
1,111 |
885 |
226 |
5 |
|
Massachusetts |
— |
571 |
50 |
173 |
27 |
5,138 |
3,396 |
1,742 |
48 |
|
New Hampshire |
— |
80 |
6 |
19 |
3 |
1,450 |
1,002 |
448 |
9 |
|
Rhode Island |
— |
73 |
1 |
31 |
2 |
217 |
133 |
84 |
17 |
|
Vermont |
— |
64 |
— |
12 |
1 |
522 |
386 |
136 |
4 |
|
Mid. Atlantic |
6 |
2,290 |
130 |
975 |
166 |
11,607 |
8,922 |
2,685 |
386 |
|
New Jersey |
3 |
596 |
39 |
173 |
44 |
3,576 |
2,732 |
844 |
67 |
|
New York (Upstate) |
2 |
1,045 |
64 |
325 |
43 |
2,456 |
1,714 |
742 |
42 |
|
New York City |
— |
649 |
27 |
177 |
38 |
542 |
330 |
212 |
225 |
|
Pennsylvania |
1 |
N |
N |
300 |
41 |
5,033 |
4,146 |
887 |
52 |
|
E.N. Central |
7 |
2,894 |
228 |
847 |
102 |
2,209 |
1,765 |
444 |
145 |
|
Illinois |
1 |
N |
49 |
226 |
29 |
204 |
204 |
— |
43 |
|
Indiana |
1 |
728 |
37 |
54 |
10 |
74 |
64 |
10 |
22 |
|
Michigan |
3 |
540 |
30 |
178 |
21 |
98 |
80 |
18 |
26 |
|
Ohio |
— |
1,149 |
86 |
288 |
28 |
67 |
49 |
18 |
41 |
|
Wisconsin |
2 |
477 |
26 |
101 |
14 |
1,766 |
1,368 |
398 |
13 |
|
W.N. Central |
2 |
846 |
92 |
171 |
30 |
1,735 |
1,032 |
703 |
101 |
|
Iowa |
— |
N |
N |
13 |
3 |
165 |
92 |
73 |
6 |
|
Kansas |
— |
N |
N |
16 |
7 |
19 |
9 |
10 |
7 |
|
Minnesota |
1 |
499 |
31 |
51 |
7 |
1,515 |
911 |
604 |
58 |
|
Missouri |
1 |
N |
36 |
68 |
8 |
2 |
1 |
1 |
19 |
|
Nebraska |
— |
143 |
14 |
11 |
5 |
15 |
5 |
10 |
4 |
|
North Dakota |
— |
108 |
— |
3 |
— |
15 |
10 |
5 |
2 |
|
South Dakota |
— |
96 |
11 |
9 |
— |
4 |
4 |
— |
5 |
|
S. Atlantic |
8 |
3,210 |
277 |
613 |
116 |
3,842 |
2,667 |
1,175 |
355 |
|
Delaware |
— |
34 |
2 |
17 |
3 |
669 |
507 |
162 |
2 |
|
District of Columbia |
— |
60 |
4 |
N |
N |
N |
N |
N |
6 |
|
Florida |
4 |
988 |
80 |
213 |
33 |
118 |
67 |
51 |
59 |
|
Georgia |
— |
997 |
81 |
56 |
20 |
31 |
31 |
— |
66 |
|
Maryland |
— |
426 |
31 |
123 |
16 |
1,651 |
1,113 |
538 |
112 |
|
North Carolina |
2 |
N |
N |
65 |
13 |
122 |
27 |
95 |
34 |
|
South Carolina |
1 |
382 |
27 |
26 |
9 |
44 |
35 |
9 |
9 |
|
Virginia |
1 |
N |
36 |
76 |
18 |
1,110 |
805 |
305 |
65 |
|
West Virginia |
— |
323 |
16 |
37 |
4 |
97 |
82 |
15 |
2 |
|
E.S. Central |
1 |
1,298 |
96 |
137 |
32 |
70 |
24 |
46 |
36 |
|
Alabama |
— |
112 |
16 |
20 |
10 |
25 |
13 |
12 |
10 |
|
Kentucky |
— |
209 |
11 |
43 |
11 |
14 |
8 |
6 |
10 |
|
Mississippi |
— |
187 |
25 |
17 |
4 |
1 |
1 |
— |
4 |
|
Tennessee |
1 |
790 |
44 |
57 |
7 |
30 |
2 |
28 |
12 |
|
W.S. Central |
11 |
1,967 |
197 |
229 |
41 |
86 |
37 |
49 |
143 |
|
Arkansas |
2 |
185 |
13 |
20 |
6 |
— |
— |
— |
4 |
|
Louisiana |
— |
247 |
29 |
29 |
2 |
7 |
3 |
4 |
13 |
|
Oklahoma |
2 |
N |
26 |
22 |
5 |
4 |
1 |
3 |
24 |
|
Texas |
7 |
1,535 |
129 |
158 |
28 |
75 |
33 |
42 |
102 |
|
Mountain |
6 |
1,714 |
142 |
135 |
34 |
44 |
29 |
15 |
75 |
|
Arizona |
1 |
661 |
50 |
44 |
14 |
13 |
7 |
6 |
19 |
|
Colorado |
— |
429 |
35 |
24 |
10 |
— |
— |
— |
24 |
|
Idaho |
— |
N |
1 |
5 |
1 |
5 |
— |
5 |
8 |
|
Montana |
— |
31 |
2 |
4 |
1 |
6 |
6 |
— |
— |
|
Nevada |
4 |
107 |
9 |
18 |
1 |
10 |
10 |
— |
8 |
|
New Mexico |
1 |
273 |
20 |
9 |
5 |
1 |
1 |
— |
2 |
|
Utah |
— |
183 |
23 |
27 |
2 |
5 |
2 |
3 |
14 |
|
Wyoming |
— |
30 |
2 |
4 |
— |
4 |
3 |
1 |
— |
|
Pacific |
10 |
217 |
27 |
273 |
146 |
143 |
83 |
60 |
158 |
|
Alaska |
— |
138 |
19 |
1 |
1 |
10 |
4 |
6 |
8 |
|
California |
7 |
N |
N |
219 |
97 |
70 |
61 |
9 |
108 |
|
Hawaii |
1 |
79 |
8 |
4 |
6 |
N |
N |
N |
4 |
|
Oregon |
— |
N |
N |
22 |
16 |
48 |
5 |
43 |
12 |
|
Washington |
2 |
N |
N |
27 |
26 |
15 |
13 |
2 |
26 |
|
Territories |
|||||||||
|
American Samoa |
— |
N |
— |
N |
N |
N |
N |
N |
— |
|
C.N.M.I. |
— |
— |
— |
— |
— |
— |
— |
— |
— |
|
Guam |
— |
— |
— |
— |
— |
— |
— |
— |
— |
|
Puerto Rico |
— |
— |
— |
2 |
— |
N |
N |
N |
1 |
|
U.S. Virgin Islands |
— |
— |
— |
— |
— |
N |
N |
N |
— |
|
Abbreviations: N = not reportable; U = unavailable; — = no reported cases; CNMI = Commonwealth of the Northern Mariana Islands. * No cases of anthrax; eastern equine encephalitis virus disease, nonneuroinvasive; poliomyelitis, paralytic; poliovirus infection, nonparalytic; Powassan virus nonneuroinvasive disease; severe acute respiratory syndrome-associated coronavirus disease (SARS-CoV); smallpox; western equine encephalitis virus disease, neuroinvasive and non-neuroinvasive; yellow fever; and viral hemorrhagic fevers were reported in the United States during 2012. Data on chronic hepatitis B and hepatitis C virus infection (past or present) are not included because they are undergoing data quality review. † Totals reported to the Influenza Division, National Center for Immunization and Respiratory Diseases (NCIRD), as of December 31, 2012. § Streptococcus pneumoniae, invasive disease. The previous categories of invasive pneumococcal disease among children less than 5 years and invasive, drug-resistant Streptococcus pneumoniae were eliminated. All cases of invasive Streptococcus pneumoniae disease, regardless of age or drug resistance are reported under a single disease code. |
|||||||||
|
TABLE 2. (Continued) Reported cases of notifiable diseases,* by geographic division and area — United States, 2012 |
||||||||
|
Area |
Measles |
Meningococcal disease |
||||||
|---|---|---|---|---|---|---|---|---|
|
Total |
Indigenous |
Imported |
All |
Serogroup A, C, Y, and W-135 |
Serogroup B |
Serogroup |
Serogroup unknown |
|
|
United States |
55 |
34 |
21 |
551 |
161 |
110 |
20 |
260 |
|
New England |
1 |
— |
1 |
15 |
6 |
4 |
2 |
3 |
|
Connecticut |
1 |
— |
1 |
4 |
2 |
2 |
— |
— |
|
Maine |
— |
— |
— |
3 |
2 |
— |
1 |
— |
|
Massachusetts |
— |
— |
— |
6 |
2 |
1 |
1 |
2 |
|
New Hampshire |
— |
— |
— |
— |
— |
— |
— |
— |
|
Rhode Island |
— |
— |
— |
— |
— |
— |
— |
— |
|
Vermont |
— |
— |
— |
2 |
— |
1 |
— |
1 |
|
Mid. Atlantic |
9 |
1 |
8 |
85 |
17 |
21 |
2 |
45 |
|
New Jersey |
2 |
1 |
1 |
14 |
— |
— |
— |
14 |
|
New York (Upstate) |
1 |
— |
1 |
21 |
8 |
10 |
— |
3 |
|
New York City |
4 |
— |
4 |
25 |
— |
— |
— |
25 |
|
Pennsylvania |
2 |
— |
2 |
25 |
9 |
11 |
2 |
3 |
|
E.N. Central |
17 |
13 |
4 |
72 |
34 |
24 |
6 |
8 |
|
Illinois |
— |
— |
— |
17 |
8 |
5 |
4 |
— |
|
Indiana |
15 |
13 |
2 |
8 |
2 |
5 |
— |
1 |
|
Michigan |
1 |
— |
1 |
13 |
7 |
6 |
— |
— |
|
Ohio |
1 |
— |
1 |
25 |
14 |
4 |
1 |
6 |
|
Wisconsin |
— |
— |
— |
9 |
3 |
4 |
1 |
1 |
|
W.N. Central |
6 |
4 |
2 |
40 |
5 |
4 |
— |
31 |
|
Iowa |
— |
— |
— |
2 |
— |
1 |
— |
1 |
|
Kansas |
6 |
4 |
2 |
6 |
4 |
1 |
— |
1 |
|
Minnesota |
— |
— |
— |
12 |
1 |
1 |
— |
10 |
|
Missouri |
— |
— |
— |
16 |
— |
— |
— |
16 |
|
Nebraska |
— |
— |
— |
3 |
— |
— |
— |
3 |
|
North Dakota |
— |
— |
— |
1 |
— |
1 |
— |
— |
|
South Dakota |
— |
— |
— |
— |
— |
— |
— |
— |
|
S. Atlantic |
4 |
4 |
— |
83 |
16 |
8 |
2 |
57 |
|
Delaware |
1 |
1 |
— |
1 |
1 |
— |
— |
— |
|
District of Columbia |
1 |
1 |
— |
2 |
— |
— |
— |
2 |
|
Florida |
— |
— |
— |
45 |
— |
— |
— |
45 |
|
Georgia |
2 |
2 |
— |
11 |
5 |
2 |
— |
4 |
|
Maryland |
— |
— |
— |
4 |
3 |
1 |
— |
— |
|
North Carolina |
— |
— |
— |
6 |
3 |
2 |
— |
1 |
|
South Carolina |
— |
— |
— |
5 |
2 |
1 |
2 |
— |
|
Virginia |
— |
— |
— |
5 |
— |
1 |
— |
4 |
|
West Virginia |
— |
— |
— |
4 |
2 |
1 |
— |
1 |
|
E.S. Central |
— |
— |
— |
17 |
10 |
3 |
1 |
3 |
|
Alabama |
— |
— |
— |
6 |
3 |
— |
1 |
2 |
|
Kentucky |
— |
— |
— |
1 |
1 |
— |
— |
— |
|
Mississippi |
— |
— |
— |
3 |
— |
2 |
— |
1 |
|
Tennessee |
— |
— |
— |
7 |
6 |
1 |
— |
— |
|
W.S. Central |
4 |
2 |
2 |
58 |
27 |
21 |
2 |
8 |
|
Arkansas |
4 |
2 |
2 |
8 |
5 |
3 |
— |
— |
|
Louisiana |
— |
— |
— |
4 |
— |
— |
— |
4 |
|
Oklahoma |
— |
— |
— |
9 |
3 |
4 |
2 |
— |
|
Texas |
— |
— |
— |
37 |
19 |
14 |
— |
4 |
|
Mountain |
5 |
5 |
— |
41 |
20 |
6 |
2 |
13 |
|
Arizona |
2 |
2 |
— |
6 |
6 |
— |
— |
— |
|
Colorado |
— |
— |
— |
6 |
2 |
4 |
— |
— |
|
Idaho |
— |
— |
— |
4 |
1 |
— |
— |
3 |
|
Montana |
— |
— |
— |
10 |
4 |
2 |
1 |
3 |
|
Nevada |
— |
— |
— |
3 |
1 |
— |
— |
2 |
|
New Mexico |
2 |
2 |
— |
5 |
1 |
— |
1 |
3 |
|
Utah |
1 |
1 |
— |
4 |
2 |
— |
— |
2 |
|
Wyoming |
— |
— |
— |
3 |
3 |
— |
— |
— |
|
Pacific |
9 |
5 |
4 |
140 |
26 |
19 |
3 |
92 |
|
Alaska |
— |
— |
— |
2 |
— |
— |
— |
2 |
|
California |
8 |
5 |
3 |
87 |
— |
— |
— |
87 |
|
Hawaii |
— |
— |
— |
2 |
— |
— |
— |
2 |
|
Oregon |
1 |
— |
1 |
25 |
14 |
10 |
— |
1 |
|
Washington |
— |
— |
— |
24 |
12 |
9 |
3 |
— |
|
Territories |
||||||||
|
American Samoa |
— |
— |
— |
— |
— |
— |
— |
— |
|
C.N.M.I. |
— |
— |
— |
— |
— |
— |
— |
— |
|
Guam |
— |
— |
— |
— |
— |
— |
— |
— |
|
Puerto Rico |
2 |
2 |
— |
— |
— |
— |
— |
— |
|
U.S. Virgin Islands |
— |
— |
— |
— |
— |
— |
— |
— |
|
Abbreviations: N = not reportable; U = unavailable; — = no reported cases; CNMI = Commonwealth of the Northern Mariana Islands. * No cases of anthrax; eastern equine encephalitis virus disease, nonneuroinvasive; poliomyelitis, paralytic; poliovirus infection, nonparalytic; Powassan virus nonneuroinvasive disease; severe acute respiratory syndrome-associated coronavirus disease (SARS-CoV); smallpox; western equine encephalitis virus disease, neuroinvasive and non-neuroinvasive; yellow fever; and viral hemorrhagic fevers were reported in the United States during 2012. Data on chronic hepatitis B and hepatitis C virus infection (past or present) are not included because they are undergoing data quality review. |
||||||||
|
TABLE 2. (Continued) Reported cases of notifiable diseases,* by geographic division and area — United States, 2012 |
||||||||
|
Area |
Mumps |
Novel influenza A virus infections† |
Pertussis |
Plague |
Psittacosis |
Q fever |
||
|---|---|---|---|---|---|---|---|---|
|
Total |
Acute |
Chronic |
||||||
|
United States |
229 |
313 |
48,277 |
4 |
2 |
135 |
113 |
22 |
|
New England |
8 |
— |
2,594 |
— |
— |
1 |
1 |
— |
|
Connecticut |
— |
— |
182 |
— |
N |
— |
— |
— |
|
Maine |
— |
— |
737 |
— |
— |
— |
— |
— |
|
Massachusetts |
6 |
— |
648 |
— |
— |
1 |
1 |
— |
|
New Hampshire |
— |
— |
269 |
— |
— |
N |
N |
N |
|
Rhode Island |
2 |
— |
113 |
— |
— |
— |
— |
— |
|
Vermont |
— |
— |
645 |
— |
— |
N |
N |
N |
|
Mid. Atlantic |
30 |
11 |
6,511 |
— |
1 |
10 |
6 |
4 |
|
New Jersey |
— |
— |
1,395 |
— |
— |
3 |
3 |
— |
|
New York (Upstate) |
6 |
— |
2,715 |
— |
— |
3 |
1 |
2 |
|
New York City |
20 |
— |
456 |
— |
— |
1 |
— |
1 |
|
Pennsylvania |
4 |
11 |
1,945 |
— |
1 |
3 |
2 |
1 |
|
E.N. Central |
60 |
275 |
11,085 |
— |
— |
29 |
29 |
— |
|
Illinois |
32 |
4 |
2,026 |
— |
— |
4 |
4 |
— |
|
Indiana |
4 |
138 |
441 |
— |
— |
2 |
2 |
— |
|
Michigan |
10 |
6 |
845 |
— |
— |
3 |
3 |
— |
|
Ohio |
6 |
107 |
893 |
— |
— |
2 |
2 |
— |
|
Wisconsin |
8 |
20 |
6,880 |
— |
— |
18 |
18 |
— |
|
W.N. Central |
23 |
10 |
8,104 |
— |
— |
13 |
8 |
5 |
|
Iowa |
6 |
1 |
1,736 |
— |
— |
N |
N |
N |
|
Kansas |
4 |
— |
887 |
— |
— |
2 |
1 |
1 |
|
Minnesota |
7 |
8 |
4,142 |
— |
— |
— |
— |
— |
|
Missouri |
5 |
1 |
815 |
— |
— |
3 |
2 |
1 |
|
Nebraska |
1 |
— |
240 |
— |
— |
6 |
3 |
3 |
|
North Dakota |
— |
— |
214 |
— |
— |
— |
— |
— |
|
South Dakota |
— |
— |
70 |
— |
— |
2 |
2 |
— |
|
S. Atlantic |
22 |
15 |
2,891 |
— |
— |
15 |
15 |
— |
|
Delaware |
— |
— |
57 |
— |
— |
— |
— |
— |
|
District of Columbia |
2 |
— |
26 |
— |
— |
N |
N |
N |
|
Florida |
5 |
— |
575 |
— |
— |
1 |
1 |
— |
|
Georgia |
3 |
— |
318 |
— |
— |
4 |
4 |
— |
|
Maryland |
— |
12 |
369 |
— |
— |
1 |
1 |
— |
|
North Carolina |
2 |
— |
612 |
— |
— |
9 |
9 |
— |
|
South Carolina |
1 |
— |
224 |
— |
— |
— |
— |
— |
|
Virginia |
7 |
— |
625 |
— |
— |
— |
— |
— |
|
West Virginia |
2 |
3 |
85 |
— |
— |
— |
— |
— |
|
E.S. Central |
6 |
— |
1,260 |
— |
— |
5 |
3 |
2 |
|
Alabama |
2 |
— |
212 |
— |
— |
— |
— |
— |
|
Kentucky |
2 |
— |
666 |
— |
— |
3 |
1 |
2 |
|
Mississippi |
— |
— |
77 |
— |
— |
— |
— |
— |
|
Tennessee |
2 |
— |
305 |
— |
— |
2 |
2 |
— |
|
W.S. Central |
22 |
— |
2,692 |
— |
— |
15 |
10 |
5 |
|
Arkansas |
1 |
— |
248 |
— |
— |
1 |
1 |
— |
|
Louisiana |
2 |
— |
72 |
— |
— |
— |
— |
— |
|
Oklahoma |
4 |
— |
154 |
— |
— |
2 |
1 |
1 |
|
Texas |
15 |
— |
2,218 |
— |
N |
12 |
8 |
4 |
|
Mountain |
15 |
1 |
6,097 |
2 |
— |
18 |
13 |
5 |
|
Arizona |
3 |
— |
1,130 |
— |
— |
2 |
1 |
1 |
|
Colorado |
7 |
— |
1,494 |
1 |
— |
9 |
8 |
1 |
|
Idaho |
— |
— |
235 |
— |
— |
1 |
— |
1 |
|
Montana |
1 |
— |
549 |
— |
— |
2 |
2 |
— |
|
Nevada |
— |
— |
112 |
— |
— |
— |
— |
— |
|
New Mexico |
— |
— |
924 |
1 |
— |
1 |
1 |
— |
|
Utah |
3 |
1 |
1,591 |
— |
— |
3 |
1 |
2 |
|
Wyoming |
1 |
— |
62 |
— |
— |
— |
— |
— |
|
Pacific |
43 |
1 |
7,043 |
2 |
1 |
29 |
28 |
1 |
|
Alaska |
— |
— |
353 |
— |
— |
— |
— |
— |
|
California |
34 |
— |
795 |
— |
1 |
22 |
22 |
— |
|
Hawaii |
1 |
1 |
73 |
— |
— |
— |
— |
— |
|
Oregon |
6 |
— |
906 |
2 |
— |
4 |
4 |
— |
|
Washington |
2 |
— |
4,916 |
— |
— |
3 |
2 |
1 |
|
Territories |
||||||||
|
American Samoa |
— |
— |
— |
— |
N |
N |
N |
N |
|
C.N.M.I. |
— |
— |
— |
— |
— |
— |
— |
— |
|
Guam |
4 |
— |
1 |
— |
— |
N |
N |
N |
|
Puerto Rico |
4 |
— |
— |
— |
N |
— |
— |
— |
|
U.S. Virgin Islands |
— |
— |
— |
— |
— |
— |
— |
— |
|
Abbreviations: N = not reportable; U = unavailable; — = no reported cases; CNMI = Commonwealth of the Northern Mariana Islands. * No cases of anthrax; eastern equine encephalitis virus disease, nonneuroinvasive; poliomyelitis, paralytic; poliovirus infection, nonparalytic; Powassan virus nonneuroinvasive disease; severe acute respiratory syndrome-associated coronavirus disease (SARS-CoV); smallpox; western equine encephalitis virus disease, neuroinvasive and non-neuroinvasive; yellow fever; and viral hemorrhagic fevers were reported in the United States during 2012. Data on chronic hepatitis B and hepatitis C virus infection (past or present) are not included because they are undergoing data quality review. † Totals reported to the Influenza Division, NCIRD, as of December 31, 2012. |
||||||||
|
TABLE 2. (Continued) Reported cases of notifiable diseases,* by geographic division and area — United States, 2012 |
||||||
|
Area |
Rabies |
Rubella |
Rubella, Congenital syndrome |
Salmonellosis |
Shiga toxin-producing E. Coli (STEC)† |
|
|---|---|---|---|---|---|---|
|
Animal |
Human |
|||||
|
United States |
4,541 |
1 |
9 |
3 |
53,800 |
6,463 |
|
New England |
386 |
— |
1 |
— |
1,993 |
209 |
|
Connecticut |
173 |
— |
— |
— |
444 |
50 |
|
Maine |
91 |
— |
— |
— |
161 |
20 |
|
Massachusetts |
— |
— |
1 |
— |
1,036 |
96 |
|
New Hampshire |
28 |
— |
— |
— |
156 |
23 |
|
Rhode Island |
28 |
— |
— |
— |
108 |
2 |
|
Vermont |
66 |
— |
— |
— |
88 |
18 |
|
Mid. Atlantic |
832 |
— |
2 |
— |
5,417 |
675 |
|
New Jersey |
— |
— |
— |
— |
1,147 |
138 |
|
New York (Upstate) |
420 |
— |
1 |
— |
1,395 |
243 |
|
New York City |
13 |
— |
1 |
— |
1,180 |
85 |
|
Pennsylvania |
399 |
— |
— |
— |
1,695 |
209 |
|
E.N. Central |
170 |
— |
3 |
1 |
5,896 |
1,176 |
|
Illinois |
63 |
— |
1 |
1 |
1,970 |
218 |
|
Indiana |
8 |
— |
1 |
— |
781 |
181 |
|
Michigan |
59 |
— |
— |
— |
995 |
285 |
|
Ohio |
40 |
— |
— |
— |
1,268 |
238 |
|
Wisconsin |
N |
— |
1 |
— |
882 |
254 |
|
W.N. Central |
252 |
— |
— |
— |
3,554 |
1,025 |
|
Iowa |
33 |
— |
— |
— |
622 |
181 |
|
Kansas |
56 |
— |
— |
— |
491 |
97 |
|
Minnesota |
— |
— |
— |
— |
781 |
258 |
|
Missouri |
28 |
— |
— |
— |
1,071 |
308 |
|
Nebraska |
— |
— |
— |
— |
353 |
102 |
|
North Dakota |
75 |
— |
— |
— |
66 |
32 |
|
South Dakota |
60 |
— |
— |
— |
170 |
47 |
|
S. Atlantic |
1,334 |
— |
2 |
1 |
15,344 |
610 |
|
Delaware |
— |
— |
— |
— |
148 |
13 |
|
District of Columbia |
— |
— |
— |
— |
70 |
8 |
|
Florida |
103 |
— |
— |
— |
6,523 |
93 |
|
Georgia |
286 |
— |
— |
— |
2,637 |
136 |
|
Maryland |
325 |
— |
2 |
1 |
951 |
74 |
|
North Carolina |
— |
— |
— |
— |
2,200 |
162 |
|
South Carolina |
— |
— |
— |
— |
1,452 |
25 |
|
Virginia |
560 |
— |
— |
— |
1,144 |
81 |
|
West Virginia |
60 |
— |
— |
— |
219 |
18 |
|
E.S. Central |
71 |
— |
— |
1 |
4,229 |
308 |
|
Alabama |
55 |
— |
— |
1 |
1,150 |
64 |
|
Kentucky |
14 |
— |
— |
— |
732 |
87 |
|
Mississippi |
2 |
— |
— |
— |
1,246 |
30 |
|
Tennessee |
— |
— |
— |
— |
1,101 |
127 |
|
W.S. Central |
899 |
— |
— |
— |
8,697 |
705 |
|
Arkansas |
131 |
— |
— |
— |
1,404 |
69 |
|
Louisiana |
4 |
— |
— |
— |
1,544 |
27 |
|
Oklahoma |
81 |
— |
— |
— |
759 |
110 |
|
Texas |
683 |
— |
— |
— |
4,990 |
499 |
|
Mountain |
313 |
— |
— |
— |
2,465 |
723 |
|
Arizona |
N |
— |
— |
— |
859 |
141 |
|
Colorado |
183 |
— |
— |
— |
509 |
175 |
|
Idaho |
23 |
— |
— |
— |
134 |
139 |
|
Montana |
N |
— |
— |
— |
109 |
44 |
|
Nevada |
18 |
— |
— |
— |
185 |
37 |
|
New Mexico |
47 |
— |
— |
— |
334 |
55 |
|
Utah |
15 |
— |
— |
— |
260 |
107 |
|
Wyoming |
27 |
— |
— |
— |
75 |
25 |
|
Pacific |
284 |
1 |
1 |
— |
6,205 |
1,032 |
|
Alaska |
6 |
— |
— |
— |
59 |
N |
|
California |
252 |
1 |
1 |
— |
4,562 |
588 |
|
Hawaii |
— |
— |
— |
— |
341 |
20 |
|
Oregon |
17 |
— |
— |
— |
401 |
192 |
|
Washington |
9 |
— |
— |
— |
842 |
232 |
|
Territories |
||||||
|
American Samoa |
— |
— |
4 |
— |
||
|
C.N.M.I. |
— |
— |
— |
— |
— |
— |
|
Guam |
— |
— |
— |
— |
13 |
— |
|
Puerto Rico |
27 |
— |
— |
N |
165 |
4 |
|
U.S. Virgin Islands |
— |
N |
— |
— |
— |
— |
|
Abbreviations: N = not reportable; U = unavailable; — = no reported cases; CNMI = Commonwealth of the Northern Mariana Islands. * No cases of anthrax; eastern equine encephalitis virus disease, nonneuroinvasive; poliomyelitis, paralytic; poliovirus infection, nonparalytic; Powassan virus nonneuroinvasive disease; severe acute respiratory syndrome-associated coronavirus disease (SARS-CoV); smallpox; western equine encephalitis virus disease, neuroinvasive and non-neuroinvasive; yellow fever; and viral hemorrhagic fevers were reported in the United States during 2012. Data on chronic hepatitis B and hepatitis C virus infection (past or present) are not included because they are undergoing data quality review. † Includes E. coli O157:H7; Shiga toxin-positive, serogroup non-O157; and Shiga toxin positive, not serogrouped. |
||||||
|
TABLE 2. (Continued) Reported cases of notifiable diseases,* by geographic division and area — United States, 2012 |
||||||||
|---|---|---|---|---|---|---|---|---|
|
Area |
Shigellosis |
Spotted Fever Rickettsiosis† |
Streptococcal toxic-shock syndrome |
Syphilis§ |
||||
|
Total |
Confirmed |
Probable |
All Stages |
Congenital (age <1 yr) |
Primary and Secondary |
|||
|
United States |
15,283 |
4,470 |
188 |
4,278 |
194 |
49,903 |
322 |
15,667 |
|
New England |
212 |
26 |
1 |
25 |
37 |
1,118 |
1 |
474 |
|
Connecticut |
46 |
— |
— |
— |
19 |
121 |
— |
55 |
|
Maine |
7 |
3 |
— |
3 |
10 |
22 |
— |
17 |
|
Massachusetts |
131 |
7 |
— |
7 |
2 |
806 |
1 |
316 |
|
New Hampshire |
8 |
2 |
— |
2 |
— |
64 |
— |
36 |
|
Rhode Island |
15 |
13 |
— |
13 |
— |
93 |
— |
44 |
|
Vermont |
5 |
1 |
1 |
— |
6 |
12 |
— |
6 |
|
Mid. Atlantic |
2,478 |
204 |
6 |
198 |
27 |
7,544 |
15 |
1,947 |
|
New Jersey |
952 |
128 |
— |
128 |
10 |
883 |
1 |
229 |
|
New York (Upstate) |
828 |
28 |
5 |
23 |
11 |
939 |
8 |
233 |
|
New York City |
564 |
7 |
— |
7 |
— |
4,373 |
— |
991 |
|
Pennsylvania |
134 |
41 |
1 |
40 |
6 |
1,349 |
6 |
494 |
|
E.N. Central |
2,568 |
232 |
11 |
218 |
74 |
5,147 |
51 |
1,839 |
|
Illinois |
280 |
151 |
9 |
142 |
37 |
2,423 |
27 |
804 |
|
Indiana |
161 |
33 |
2 |
28 |
17 |
531 |
— |
224 |
|
Michigan |
251 |
3 |
— |
3 |
9 |
786 |
7 |
295 |
|
Ohio |
1,749 |
23 |
— |
23 |
10 |
1,138 |
16 |
425 |
|
Wisconsin |
127 |
22 |
— |
22 |
1 |
269 |
1 |
91 |
|
W.N. Central |
973 |
349 |
5 |
344 |
2 |
1,111 |
3 |
399 |
|
Iowa |
91 |
8 |
— |
8 |
— |
143 |
— |
70 |
|
Kansas |
130 |
— |
— |
— |
— |
129 |
— |
24 |
|
Minnesota |
390 |
15 |
— |
15 |
— |
335 |
1 |
118 |
|
Missouri |
71 |
315 |
4 |
311 |
1 |
426 |
1 |
157 |
|
Nebraska |
272 |
9 |
1 |
8 |
1 |
35 |
1 |
8 |
|
North Dakota |
8 |
1 |
— |
1 |
— |
14 |
— |
4 |
|
South Dakota |
11 |
1 |
— |
1 |
— |
29 |
— |
18 |
|
S. Atlantic |
2,903 |
1,279 |
119 |
1,160 |
21 |
11,442 |
72 |
3,805 |
|
Delaware |
22 |
30 |
— |
30 |
— |
106 |
1 |
38 |
|
District of Columbia |
26 |
2 |
1 |
1 |
— |
589 |
— |
165 |
|
Florida |
1,702 |
31 |
3 |
28 |
N |
4,483 |
37 |
1,369 |
|
Georgia |
660 |
92 |
92 |
— |
— |
2,432 |
14 |
937 |
|
Maryland |
222 |
9 |
— |
9 |
N |
1,243 |
12 |
431 |
|
North Carolina |
136 |
591 |
12 |
579 |
7 |
1,036 |
1 |
347 |
|
South Carolina |
37 |
61 |
7 |
54 |
4 |
623 |
6 |
225 |
|
Virginia |
91 |
461 |
4 |
457 |
7 |
906 |
1 |
285 |
|
West Virginia |
7 |
2 |
— |
2 |
3 |
24 |
— |
8 |
|
E.S. Central |
1,250 |
950 |
13 |
937 |
8 |
2,618 |
7 |
782 |
|
Alabama |
332 |
167 |
3 |
164 |
N |
705 |
4 |
216 |
|
Kentucky |
426 |
62 |
3 |
59 |
8 |
390 |
2 |
150 |
|
Mississippi |
285 |
25 |
2 |
23 |
N |
456 |
— |
150 |
|
Tennessee |
207 |
696 |
5 |
691 |
— |
1,067 |
1 |
266 |
|
W.S. Central |
2,780 |
1,332 |
13 |
1,319 |
1 |
9,560 |
121 |
2,222 |
|
Arkansas |
96 |
837 |
5 |
832 |
— |
468 |
11 |
173 |
|
Louisiana |
215 |
9 |
— |
9 |
1 |
1,779 |
32 |
339 |
|
Oklahoma |
543 |
409 |
6 |
403 |
N |
256 |
— |
83 |
|
Texas |
1,926 |
77 |
2 |
75 |
N |
7,057 |
78 |
1,627 |
|
Mountain |
789 |
75 |
11 |
64 |
24 |
2,138 |
16 |
698 |
|
Arizona |
444 |
50 |
10 |
40 |
— |
787 |
14 |
202 |
|
Colorado |
123 |
6 |
1 |
5 |
2 |
503 |
— |
208 |
|
Idaho |
9 |
4 |
— |
4 |
— |
53 |
— |
26 |
|
Montana |
11 |
3 |
— |
3 |
N |
3 |
— |
2 |
|
Nevada |
55 |
— |
— |
— |
3 |
445 |
1 |
113 |
|
New Mexico |
108 |
4 |
— |
4 |
— |
234 |
1 |
101 |
|
Utah |
34 |
6 |
— |
6 |
18 |
101 |
— |
42 |
|
Wyoming |
5 |
2 |
— |
2 |
1 |
12 |
— |
4 |
|
Pacific |
1,330 |
23 |
9 |
13 |
— |
9,225 |
36 |
3,501 |
|
Alaska |
7 |
N |
— |
— |
— |
34 |
1 |
11 |
|
California |
1,071 |
21 |
8 |
12 |
N |
8,015 |
34 |
2,953 |
|
Hawaii |
27 |
N |
N |
N |
— |
43 |
— |
23 |
|
Oregon |
92 |
1 |
— |
1 |
N |
424 |
1 |
212 |
|
Washington |
133 |
1 |
1 |
— |
N |
709 |
— |
302 |
|
Territories |
||||||||
|
American Samoa |
5 |
N |
N |
N |
N |
— |
— |
— |
|
C.N.M.I. |
— |
— |
— |
— |
— |
— |
— |
— |
|
Guam |
1 |
N |
N |
N |
— |
27 |
— |
6 |
|
Puerto Rico |
2 |
N |
N |
N |
N |
704 |
1 |
306 |
|
U.S. Virgin Islands |
— |
N |
N |
N |
— |
2 |
— |
— |
|
Abbreviations: N = not reportable; U = unavailable; — = no reported cases; CNMI = Commonwealth of the Northern Mariana Islands. * No cases of anthrax; eastern equine encephalitis virus disease, nonneuroinvasive; poliomyelitis, paralytic; poliovirus infection, nonparalytic; Powassan virus nonneuroinvasive disease; severe acute respiratory syndrome-associated coronavirus disease (SARS-CoV); smallpox; western equine encephalitis virus disease, neuroinvasive and non-neuroinvasive; yellow fever; and viral hemorrhagic fevers were reported in the United States during 2012. Data on chronic hepatitis B and hepatitis C virus infection (past or present) are not included because they are undergoing data quality review. † Total case count includes four unknown case status reports. § Includes the following categories: primary, secondary, latent (including early latent, late latent, and latent syphilis of unknown duration), neurosyphilis, late (including late syphilis with clinical manifestations other than neurosyphilis), and congenital syphilis. Totals reported to the Division of STD Prevention, NCHHSTP, as of May 29, 2013. |
||||||||
|
TABLE 2. (Continued) Reported cases of notifiable diseases,* by geographic division and area — United States, 2012 |
|||||
|---|---|---|---|---|---|
|
Area |
Tetanus |
Toxic-shock syndrome |
Trichinellosis |
Tuberculosis† |
Tularemia |
|
United States |
37 |
65 |
18 |
9,945 |
149 |
|
New England |
— |
— |
— |
342 |
8 |
|
Connecticut |
— |
N |
— |
74 |
— |
|
Maine |
— |
— |
— |
17 |
— |
|
Massachusetts |
— |
— |
— |
215 |
8 |
|
New Hampshire |
— |
— |
— |
9 |
— |
|
Rhode Island |
— |
— |
— |
23 |
— |
|
Vermont |
— |
— |
— |
4 |
— |
|
Mid. Atlantic |
4 |
18 |
2 |
1,402 |
— |
|
New Jersey |
— |
3 |
2 |
302 |
— |
|
New York (Upstate) |
— |
9 |
— |
215 |
— |
|
New York City |
1 |
— |
— |
651 |
— |
|
Pennsylvania |
3 |
6 |
— |
234 |
— |
|
E.N. Central |
8 |
12 |
4 |
818 |
8 |
|
Illinois |
1 |
4 |
1 |
347 |
4 |
|
Indiana |
3 |
1 |
— |
102 |
4 |
|
Michigan |
2 |
6 |
1 |
149 |
— |
|
Ohio |
2 |
1 |
— |
149 |
— |
|
Wisconsin |
— |
— |
2 |
71 |
— |
|
W.N. Central |
3 |
9 |
1 |
406 |
64 |
|
Iowa |
— |
1 |
— |
46 |
1 |
|
Kansas |
— |
— |
— |
42 |
22 |
|
Minnesota |
2 |
4 |
1 |
162 |
— |
|
Missouri |
1 |
4 |
— |
89 |
27 |
|
Nebraska |
— |
— |
— |
22 |
6 |
|
North Dakota |
— |
— |
— |
26 |
3 |
|
South Dakota |
— |
— |
— |
19 |
5 |
|
S. Atlantic |
7 |
11 |
4 |
1,901 |
5 |
|
Delaware |
— |
1 |
— |
28 |
— |
|
District of Columbia |
— |
— |
1 |
37 |
— |
|
Florida |
4 |
N |
— |
679 |
— |
|
Georgia |
— |
9 |
N |
357 |
— |
|
Maryland |
— |
N |
1 |
224 |
2 |
|
North Carolina |
— |
— |
— |
211 |
1 |
|
South Carolina |
2 |
1 |
— |
122 |
— |
|
Virginia |
1 |
N |
2 |
235 |
2 |
|
West Virginia |
— |
— |
— |
8 |
— |
|
E.S. Central |
2 |
3 |
— |
459 |
6 |
|
Alabama |
1 |
— |
— |
134 |
— |
|
Kentucky |
— |
— |
N |
80 |
4 |
|
Mississippi |
1 |
N |
— |
81 |
— |
|
Tennessee |
— |
3 |
— |
164 |
2 |
|
W.S. Central |
5 |
1 |
1 |
1,540 |
39 |
|
Arkansas |
— |
1 |
N |
70 |
22 |
|
Louisiana |
— |
— |
— |
149 |
— |
|
Oklahoma |
2 |
N |
— |
88 |
17 |
|
Texas |
3 |
N |
1 |
1,233 |
— |
|
Mountain |
2 |
4 |
1 |
457 |
10 |
|
Arizona |
— |
1 |
1 |
211 |
— |
|
Colorado |
1 |
— |
— |
64 |
1 |
|
Idaho |
— |
1 |
— |
15 |
1 |
|
Montana |
— |
N |
— |
5 |
3 |
|
Nevada |
— |
— |
— |
82 |
1 |
|
New Mexico |
1 |
— |
— |
40 |
1 |
|
Utah |
— |
2 |
— |
37 |
2 |
|
Wyoming |
— |
— |
— |
3 |
1 |
|
Pacific |
6 |
7 |
5 |
2,620 |
9 |
|
Alaska |
1 |
N |
5 |
66 |
2 |
|
California |
4 |
7 |
— |
2,191 |
2 |
|
Hawaii |
— |
N |
— |
117 |
— |
|
Oregon |
— |
N |
— |
61 |
— |
|
Washington |
1 |
N |
— |
185 |
5 |
|
Territories |
|||||
|
American Samoa |
— |
N |
N |
1 |
— |
|
C.N.M.I. |
— |
— |
— |
21 |
— |
|
Guam |
— |
— |
— |
68 |
— |
|
Puerto Rico |
1 |
N |
N |
71 |
— |
|
U.S. Virgin Islands |
— |
N |
— |
4 |
— |
|
Abbreviations: N = not reportable; U = unavailable; — = no reported cases; CNMI = Commonwealth of the Northern Mariana Islands. * No cases of anthrax; eastern equine encephalitis virus disease, nonneuroinvasive; poliomyelitis, paralytic; poliovirus infection, nonparalytic; Powassan virus nonneuroinvasive disease; severe acute respiratory syndrome-associated coronavirus disease (SARS-CoV); smallpox; western equine encephalitis virus disease, neuroinvasive and non-neuroinvasive; yellow fever; and viral hemorrhagic fevers were reported in the United States during 2012. Data on chronic hepatitis B and hepatitis C virus infection (past or present) are not included because they are undergoing data quality review. † Totals reported to the Division of Tuberculosis Elimination, NCHHSTP, as of June 15, 2013. |
|||||
|
TABLE 2. (Continued) Reported cases of notifiable diseases,* by geographic division and area — United States, 2012 |
||||||
|---|---|---|---|---|---|---|
|
Area |
Typhoid fever |
Vancomycin- |
Vancomycin-resistant |
Varicella |
Vibriosis§ |
|
|
Morbidity |
Mortality† |
|||||
|
United States |
354 |
134 |
2 |
13,447 |
3 |
1,111 |
|
New England |
17 |
3 |
— |
1,424 |
— |
118 |
|
Connecticut |
2 |
— |
— |
265 |
— |
24 |
|
Maine |
— |
— |
— |
258 |
— |
10 |
|
Massachusetts |
12 |
2 |
— |
534 |
N |
70 |
|
New Hampshire |
1 |
N |
— |
142 |
— |
3 |
|
Rhode Island |
2 |
1 |
— |
80 |
— |
11 |
|
Vermont |
— |
— |
— |
145 |
N |
— |
|
Mid. Atlantic |
97 |
40 |
— |
1,327 |
1 |
80 |
|
New Jersey |
20 |
3 |
— |
466 |
1 |
41 |
|
New York (Upstate) |
22 |
30 |
— |
N |
N |
N |
|
New York City |
45 |
4 |
— |
— |
— |
27 |
|
Pennsylvania |
10 |
3 |
— |
861 |
— |
12 |
|
E.N. Central |
47 |
25 |
— |
3,583 |
— |
51 |
|
Illinois |
14 |
4 |
— |
898 |
— |
22 |
|
Indiana |
4 |
N |
— |
469 |
— |
6 |
|
Michigan |
9 |
10 |
— |
971 |
— |
7 |
|
Ohio |
15 |
9 |
— |
806 |
N |
11 |
|
Wisconsin |
5 |
2 |
— |
439 |
— |
5 |
|
W.N. Central |
13 |
21 |
— |
881 |
— |
27 |
|
Iowa |
3 |
N |
— |
N |
N |
N |
|
Kansas |
1 |
N |
N |
395 |
— |
N |
|
Minnesota |
5 |
1 |
— |
— |
— |
15 |
|
Missouri |
3 |
20 |
— |
388 |
— |
8 |
|
Nebraska |
— |
— |
— |
27 |
— |
2 |
|
North Dakota |
1 |
— |
— |
39 |
— |
2 |
|
South Dakota |
— |
— |
— |
32 |
N |
N |
|
S. Atlantic |
46 |
16 |
1 |
1,611 |
— |
322 |
|
Delaware |
— |
— |
1 |
3 |
— |
6 |
|
District of Columbia |
1 |
2 |
— |
19 |
— |
4 |
|
Florida |
11 |
7 |
— |
816 |
— |
147 |
|
Georgia |
12 |
1 |
— |
51 |
— |
29 |
|
Maryland |
7 |
1 |
— |
N |
— |
53 |
|
North Carolina |
4 |
2 |
— |
N |
N |
31 |
|
South Carolina |
1 |
— |
— |
11 |
— |
11 |
|
Virginia |
10 |
2 |
— |
505 |
N |
41 |
|
West Virginia |
— |
1 |
— |
206 |
— |
N |
|
E.S. Central |
5 |
1 |
1 |
201 |
— |
55 |
|
Alabama |
1 |
1 |
— |
190 |
N |
20 |
|
Kentucky |
— |
N |
N |
N |
N |
2 |
|
Mississippi |
1 |
— |
— |
11 |
N |
16 |
|
Tennessee |
3 |
— |
1 |
N |
— |
17 |
|
W.S. Central |
33 |
26 |
— |
2,715 |
1 |
119 |
|
Arkansas |
2 |
— |
— |
236 |
— |
N |
|
Louisiana |
2 |
1 |
— |
69 |
N |
53 |
|
Oklahoma |
— |
2 |
— |
N |
N |
— |
|
Texas |
29 |
23 |
— |
2,410 |
1 |
66 |
|
Mountain |
17 |
2 |
— |
1,578 |
— |
45 |
|
Arizona |
7 |
2 |
— |
535 |
— |
29 |
|
Colorado |
7 |
N |
— |
483 |
N |
10 |
|
Idaho |
— |
N |
N |
N |
N |
N |
|
Montana |
— |
N |
N |
132 |
— |
N |
|
Nevada |
1 |
— |
— |
N |
N |
4 |
|
New Mexico |
— |
N |
N |
99 |
— |
1 |
|
Utah |
2 |
— |
— |
310 |
— |
1 |
|
Wyoming |
— |
— |
— |
19 |
N |
— |
|
Pacific |
79 |
— |
— |
127 |
1 |
294 |
|
Alaska |
— |
N |
N |
58 |
N |
3 |
|
California |
61 |
N |
N |
24 |
1 |
170 |
|
Hawaii |
5 |
— |
— |
45 |
— |
35 |
|
Oregon |
2 |
N |
N |
N |
N |
19 |
|
Washington |
11 |
N |
— |
N |
— |
67 |
|
Territories |
||||||
|
American Samoa |
4 |
N |
N |
N |
N |
N |
|
C.N.M.I. |
— |
N |
— |
— |
— |
— |
|
Guam |
— |
— |
— |
50 |
N |
1 |
|
Puerto Rico |
— |
— |
— |
199 |
— |
N |
|
U.S. Virgin Islands |
— |
— |
— |
— |
— |
— |
|
Abbreviations: N = not reportable; U = unavailable; — = no reported cases; CNMI = Commonwealth of the Northern Mariana Islands. * No cases of anthrax; eastern equine encephalitis virus disease, nonneuroinvasive; poliomyelitis, paralytic; poliovirus infection, nonparalytic; Powassan virus nonneuroinvasive disease; severe acute respiratory syndrome-associated coronavirus disease (SARS-CoV); smallpox; western equine encephalitis virus disease, neuroinvasive and non-neuroinvasive; yellow fever; and viral hemorrhagic fevers were reported in the United States during 2012. Data on chronic hepatitis B and hepatitis C virus infection (past or present) are not included because they are undergoing data quality review. † Totals reported to the Division of Viral Diseases, NCIRD, as of May 1, 2013. § Vibriosis refers to any species of the family Vibrionaceae, other than toxigenic Vibrio cholerae O1 or O139. |
||||||
|
TABLE 3. Reported cases and incidence* of notifiable diseases,† by age group — United States, 2012 |
||||||||||||||||
|---|---|---|---|---|---|---|---|---|---|---|---|---|---|---|---|---|
|
Disease |
<1 yr |
1–4 yrs |
5–14 yrs |
15–24 yrs |
25–39 yrs |
40–64 yrs |
≥65 yrs |
Age not stated |
Total |
|||||||
|
No. |
Rate |
No. |
Rate |
No. |
Rate |
No. |
Rate |
No. |
Rate |
No. |
Rate |
No. |
Rate |
|||
|
Arboviral diseases§ |
||||||||||||||||
|
California serogroup viruses |
||||||||||||||||
|
neuroinvasive |
1 |
(0.03) |
9 |
(0.06) |
47 |
(0.11) |
3 |
(0.01) |
5 |
(0.01) |
7 |
(0.01) |
1 |
(0.00) |
— |
73 |
|
nonneuroinvasive |
— |
(0.00) |
1 |
(0.01) |
6 |
(0.01) |
— |
(0.00) |
— |
(0.00) |
— |
(0.00) |
1 |
(0.00) |
— |
8 |
|
Eastern equine encephalitis virus |
||||||||||||||||
|
neuroinvasive |
— |
(0.00) |
— |
(0.00) |
4 |
(0.01) |
— |
(0.00) |
1 |
(0.00) |
5 |
(0.00) |
5 |
(0.01) |
— |
15 |
|
Powassan virus |
||||||||||||||||
|
neuroinvasive |
— |
(0.00) |
— |
(0.00) |
— |
(0.00) |
— |
(0.00) |
2 |
(0.00) |
2 |
(0.00) |
3 |
(0.01) |
— |
7 |
|
St. Louis encephalitis virus |
||||||||||||||||
|
neuroinvasive |
— |
(0.00) |
— |
(0.00) |
— |
(0.00) |
— |
(0.00) |
— |
(0.00) |
1 |
(0.00) |
— |
(0.00) |
— |
1 |
|
nonneuroinvasive |
— |
(0.00) |
— |
(0.00) |
— |
(0.00) |
— |
(0.00) |
— |
(0.00) |
2 |
(0.00) |
— |
(0.00) |
— |
2 |
|
West Nile virus |
||||||||||||||||
|
neuroinvasive |
4 |
(0.10) |
7 |
(0.04) |
38 |
(0.09) |
126 |
(0.29) |
313 |
(0.51) |
1,272 |
(1.22) |
1,112 |
(2.69) |
— |
2,872 |
|
nonneuroinvasive |
2 |
(0.05) |
13 |
(0.08) |
60 |
(0.15) |
142 |
(0.32) |
490 |
(0.80) |
1,414 |
(1.36) |
680 |
(1.64) |
— |
2,801 |
|
Babesiosis¶ |
3 |
(0.15) |
3 |
(0.04) |
13 |
(0.07) |
20 |
(0.09) |
64 |
(0.21) |
366 |
(0.70) |
339 |
(1.68) |
129 |
937 |
|
confirmed |
3 |
(0.08) |
2 |
(0.01) |
4 |
(0.01) |
9 |
(0.02) |
47 |
(0.08) |
267 |
(0.26) |
274 |
(0.66) |
110 |
716 |
|
probable |
— |
(0.00) |
1 |
(0.01) |
9 |
(0.02) |
11 |
(0.03) |
17 |
(0.03) |
99 |
(0.09) |
65 |
(0.15) |
19 |
221 |
|
Botulism, total |
118 |
(2.98) |
1 |
(0.01) |
1 |
(0.00) |
7 |
(0.02) |
18 |
(0.03) |
15 |
(0.01) |
7 |
(0.02) |
1 |
168 |
|
foodborne |
— |
(0.00) |
— |
(0.00) |
— |
(0.00) |
5 |
(0.01) |
15 |
(0.02) |
5 |
(0.00) |
2 |
(0.00) |
— |
27 |
|
infant |
118 |
(2.98) |
1 |
(0.01) |
— |
(0.00) |
— |
(0.00) |
— |
(0.00) |
1 |
(0.00) |
2 |
(0.00) |
1 |
123 |
|
other(wound and unspecified) |
— |
(0.00) |
— |
(0.00) |
1 |
(0.00) |
2 |
(0.00) |
3 |
(0.00) |
9 |
(0.01) |
3 |
(0.01) |
— |
18 |
|
Brucellosis |
— |
(0.00) |
3 |
(0.02) |
11 |
(0.03) |
10 |
(0.02) |
25 |
(0.04) |
40 |
(0.04) |
25 |
(0.06) |
— |
114 |
|
Chancroid |
— |
(0.00) |
— |
(0.00) |
— |
(0.00) |
7 |
(0.02) |
5 |
(0.01) |
1 |
(0.00) |
2 |
( 0.00) |
— |
15 |
|
Chlamydia trachomatis, infection** |
— |
(0.00) |
— |
(0.00) |
— |
(0.00) |
987,412 |
(2254.18) |
365,410 |
(595.19) |
49,153 |
(47.33) |
1,134 |
(2.74) |
4,590 |
1,422,976 |
|
Cholera |
— |
(0.00) |
1 |
(0.01) |
— |
(0.00) |
1 |
(0.00) |
3 |
(0.00) |
5 |
(0.00) |
6 |
(0.01) |
1 |
17 |
|
Coccidioidomycosis¶ |
24 |
(1.36) |
84 |
(1.17) |
690 |
(3.79) |
1,948 |
(9.87) |
4,087 |
(15.00) |
7,357 |
(15.88) |
3,514 |
(19.18) |
98 |
17,802 |
|
Cryptosporidiosis, total |
90 |
(2.27) |
904 |
(5.60) |
1,004 |
(2.45) |
1,165 |
(2.67) |
1,587 |
(2.59) |
1,950 |
(1.88) |
1,156 |
(2.80) |
100 |
7,956 |
|
confirmed |
63 |
(1.58) |
648 |
(4.05) |
672 |
(1.67) |
775 |
(1.76) |
1,016 |
(1.65) |
1,186 |
(1.13) |
659 |
(1.59) |
79 |
5,098 |
|
probable |
26 |
(0.66) |
249 |
(1.54) |
319 |
(0.78) |
368 |
(0.84) |
534 |
(0.87) |
721 |
(0.69) |
483 |
(1.17) |
18 |
2,718 |
|
Cyclosporiasis |
1 |
(0.03) |
1 |
(0.01) |
2 |
(0.01) |
5 |
(0.01) |
32 |
(0.06) |
63 |
(0.07) |
17 |
(0.05) |
2 |
123 |
|
Dengue virus infection |
||||||||||||||||
|
Dengue fever |
— |
(0.00) |
5 |
(0.03) |
41 |
(0.10) |
64 |
(0.15) |
135 |
(0.22) |
225 |
(0.22) |
71 |
(0.17) |
3 |
544 |
|
Dengue hemorrhagic fever |
— |
(0.00) |
— |
(0.00) |
— |
(0.00) |
— |
(0.00) |
1 |
(0.00) |
1 |
(0.00) |
1 |
(0.00) |
— |
3 |
|
Diphtheria |
— |
(0.00) |
— |
(0.00) |
— |
(0.00) |
— |
(0.00) |
1 |
(0.00) |
— |
(0.00) |
— |
(0.00) |
— |
1 |
|
Ehrlichiosis/Anaplasmosis |
||||||||||||||||
|
Anaplasma phagocytophilum |
— |
(0.00) |
15 |
(0.10) |
104 |
(0.27) |
141 |
(0.34) |
275 |
(0.47) |
1,008 |
(1.02) |
664 |
(1.69) |
182 |
2,389 |
|
Ehrlichia chaffeensis |
— |
(0.00) |
11 |
(0.07) |
58 |
(0.15) |
53 |
(0.13) |
144 |
(0.25) |
511 |
(0.52) |
340 |
(0.86) |
11 |
1,128 |
|
Ehrlichia ewingii |
— |
(0.00) |
— |
(0.00) |
— |
(0.00) |
— |
(0.00) |
(0.00) |
11 |
(0.01) |
6 |
(0.02) |
— |
17 |
|
|
Undetermined |
— |
(0.00) |
5 |
(0.03) |
14 |
(0.04) |
12 |
(0.03) |
27 |
(0.05) |
92 |
(0.09) |
41 |
(0.10) |
— |
191 |
|
Giardiasis |
112 |
(3.45) |
1,939 |
(14.73) |
2,031 |
(6.05) |
1,705 |
(4.70) |
2,912 |
(5.75) |
4,726 |
(5.44) |
1,379 |
(3.94) |
374 |
15,178 |
|
Gonorrhea** |
— |
(0.00) |
— |
(0.00) |
— |
(0.00) |
196,772 |
(449.21) |
106,054 |
(172.74) |
26,578 |
(25.59) |
644 |
(1.56) |
1,376 |
334,826 |
|
Haemophilus influenzae, invasive disease |
||||||||||||||||
|
all ages, all serotypes |
280 |
(7.06) |
165 |
(1.02) |
108 |
(0.26) |
105 |
(0.24) |
205 |
(0.33) |
886 |
(0.85) |
1,632 |
(3.94) |
37 |
3,418 |
|
age <5 yrs |
||||||||||||||||
|
serotype b |
16 |
(0.40) |
14 |
(0.09) |
— |
(0.00) |
— |
(0.00) |
— |
(0.00) |
— |
(0.00) |
— |
(0.00) |
— |
30 |
|
nonserotype b |
124 |
(3.46) |
81 |
(0.55) |
— |
(0.00) |
— |
(0.00) |
— |
(0.00) |
— |
(0.00) |
— |
(0.00) |
— |
205 |
|
unknown serotype |
140 |
(3.90) |
70 |
(0.48) |
— |
(0.00) |
— |
(0.00) |
— |
(0.00) |
— |
(0.00) |
— |
(0.00) |
— |
210 |
|
Hansen disease (leprosy) |
— |
(0.00) |
— |
(0.00) |
— |
(0.00) |
5 |
(0.01) |
19 |
(0.03) |
21 |
(0.02) |
12 |
(0.03) |
25 |
82 |
|
Hantavirus pulmonary syndrome |
— |
(0.00) |
— |
(0.00) |
3 |
(0.01) |
2 |
(0.00) |
8 |
(0.01) |
12 |
(0.01) |
3 |
(0.01) |
2 |
30 |
|
Hemolytic uremic syndrome, post-diarrheal |
5 |
(0.13) |
122 |
(0.80) |
81 |
(0.21) |
16 |
(0.04) |
10 |
(0.02) |
11 |
(0.01) |
15 |
(0.04) |
14 |
274 |
|
Hepatitis virus, acute |
||||||||||||||||
|
A |
3 |
(0.08) |
32 |
(0.20) |
82 |
(0.20) |
262 |
(0.60) |
360 |
(0.59) |
541 |
(0.52) |
260 |
(0.63) |
22 |
1,562 |
|
B |
2 |
(0.05) |
— |
(0.00) |
3 |
(0.01) |
129 |
(0.30) |
1,146 |
(1.87) |
1,391 |
(1.34) |
146 |
(0.35) |
78 |
2,895 |
|
C |
10 |
(0.26) |
— |
(0.00) |
1 |
(0.00) |
448 |
(1.06) |
786 |
(1.33) |
479 |
(0.48) |
24 |
(0.06) |
34 |
1,782 |
|
Hepatitis B perinatal infection |
25 |
(0.64) |
14 |
(0.09) |
— |
(0.00) |
— |
(0.00) |
— |
(0.00) |
— |
(0.00) |
— |
(0.00) |
1 |
40 |
|
Human immunodeficiency virus (HIV) diagnoses†† |
48 |
(1.20) |
43 |
(0.30) |
119 |
(0.30) |
7,500 |
(17.10) |
13,957 |
(22.60) |
13,018 |
(12.50) |
676 |
(1.60) |
— |
35,361 |
|
Influenza-associated pediatric mortality§§ |
10 |
(0.26) |
9 |
(0.06) |
28 |
(0.07) |
5 |
(0.04) |
— |
(0.00) |
— |
(0.00) |
— |
(0.00) |
— |
52 |
|
Invasive pneumococcal disease |
||||||||||||||||
|
all ages |
369 |
(14.40) |
749 |
(7.14) |
457 |
(1.71) |
292 |
(1.03) |
1,187 |
(3.00) |
6,303 |
(9.31) |
5,861 |
(21.52) |
417 |
15,635 |
|
age <5 yrs |
419 |
(14.09) |
847 |
(6.96) |
— |
(0.00) |
— |
(0.00) |
— |
(0.00) |
— |
(0.00) |
— |
(0.00) |
— |
1,266 |
|
Legionellosis |
1 |
(0.03) |
1 |
(0.01) |
6 |
(0.01) |
38 |
(0.09) |
248 |
(0.41) |
1,863 |
(1.80) |
1,442 |
(3.49) |
89 |
3,688 |
|
Listeriosis |
36 |
(0.91) |
2 |
(0.01) |
5 |
(0.01) |
20 |
(0.05) |
63 |
(0.10) |
183 |
(0.18) |
395 |
(0.96) |
23 |
727 |
|
Lyme disease, total |
13 |
(0.33) |
891 |
(5.55) |
4,297 |
(10.52) |
3,063 |
(7.04) |
3,452 |
(5.66) |
9,588 |
(9.29) |
4,325 |
(10.52) |
5,202 |
30,831 |
|
Confirmed |
13 |
(0.33) |
743 |
(4.62) |
3,274 |
(8.01) |
2,000 |
(4.59) |
2,382 |
(3.90) |
6,987 |
(6.76) |
3,103 |
(7.54) |
3,512 |
22,014 |
|
Probable |
— |
(0.00) |
148 |
(0.92) |
1,023 |
(2.50) |
1,063 |
(2.44) |
1,070 |
(1.75) |
2,601 |
(2.52) |
1,222 |
(2.97) |
1,690 |
8,817 |
|
TABLE 3. (Continued) Reported cases and incidence* of notifiable diseases,† by age group — United States, 2012 |
||||||||||||||||
|---|---|---|---|---|---|---|---|---|---|---|---|---|---|---|---|---|
|
Disease |
<1 yr |
1–4 yrs |
5–14 yrs |
15–24 yrs |
25–39 yrs |
40–64 yrs |
≥65 yrs |
Age not stated |
Total |
|||||||
|
No. |
Rate |
No. |
Rate |
No. |
Rate |
No. |
Rate |
No. |
Rate |
No. |
Rate |
No. |
Rate |
|||
|
Malaria |
1 |
(0.03) |
48 |
(0.30) |
140 |
(0.34) |
243 |
(0.55) |
420 |
(0.68) |
560 |
(0.54) |
60 |
(0.15) |
31 |
1,503 |
|
Measles, total |
4 |
(0.10) |
11 |
(0.07) |
19 |
(0.05) |
2 |
(0.00) |
12 |
(0.02) |
7 |
(0.01) |
— |
(0.00) |
— |
55 |
|
indigenous |
1 |
(0.03) |
6 |
(0.04) |
14 |
(0.03) |
2 |
(0.00) |
8 |
(0.01) |
3 |
(0.00) |
— |
(0.00) |
— |
34 |
|
imported |
3 |
(0.08) |
5 |
(0.03) |
5 |
(0.01) |
— |
(0.00) |
4 |
(0.01) |
4 |
(0.00) |
— |
(0.00) |
— |
21 |
|
Meningococcal disease |
||||||||||||||||
|
all serogroups |
64 |
(1.61) |
47 |
(0.29) |
28 |
(0.07) |
95 |
(0.22) |
81 |
(0.13) |
134 |
(0.13) |
101 |
(0.24) |
1 |
551 |
|
serogroup A,C,Y, and W-135 |
13 |
(0.33) |
5 |
(0.03) |
9 |
(0.02) |
25 |
(0.06) |
16 |
(0.03) |
56 |
(0.05) |
37 |
(0.09) |
— |
161 |
|
serogroup B |
29 |
(0.73) |
20 |
(0.12) |
10 |
(0.02) |
20 |
(0.05) |
13 |
(0.02) |
11 |
(0.01) |
7 |
(0.02) |
— |
110 |
|
serogroup other |
2 |
(0.05) |
2 |
(0.01) |
1 |
(0.00) |
3 |
(0.01) |
4 |
(0.01) |
4 |
(0.00) |
4 |
(0.01) |
— |
20 |
|
serogroup unknown |
20 |
(0.50) |
20 |
(0.12) |
8 |
(0.02) |
47 |
(0.11) |
48 |
(0.08) |
63 |
(0.06) |
53 |
(0.13) |
1 |
260 |
|
Mumps |
4 |
(0.10) |
37 |
(0.23) |
54 |
(0.13) |
23 |
(0.05) |
37 |
(0.06) |
57 |
(0.05) |
16 |
(0.04) |
1 |
229 |
|
Novel influenza A virus infection |
7 |
(0.17) |
96 |
(0.59) |
175 |
(0.42) |
17 |
(0.03) |
3 |
(0.00) |
12 |
(0.00) |
1 |
(0.00) |
2 |
313 |
|
Pertussis |
4,955 |
(124.93) |
5,802 |
(35.90) |
21,852 |
(53.24) |
5,636 |
(12.87) |
3,377 |
(5.50) |
4,916 |
(4.73) |
1,139 |
(2.75) |
600 |
48,277 |
|
Plague |
— |
(0.00) |
— |
(0.00) |
1 |
(0.00) |
— |
(0.00) |
1 |
(0.00) |
1 |
(0.00) |
1 |
(0.00) |
— |
4 |
|
Psittacosis |
— |
(0.00) |
— |
(0.00) |
1 |
(0.00) |
— |
(0.00) |
— |
(0.00) |
1 |
(0.00) |
— |
(0.00) |
— |
2 |
|
Q fever, total |
— |
(0.00) |
— |
(0.00) |
— |
(0.00) |
7 |
(0.02) |
23 |
(0.04) |
78 |
(0.08) |
26 |
(0.06) |
1 |
135 |
|
acute |
— |
(0.00) |
— |
(0.00) |
— |
(0.00) |
7 |
(0.02) |
21 |
(0.03) |
67 |
(0.07) |
17 |
(0.04) |
1 |
113 |
|
chronic |
— |
(0.00) |
— |
(0.00) |
— |
(0.00) |
— |
(0.00) |
2 |
(0.00) |
11 |
(0.01) |
9 |
(0.02) |
— |
22 |
|
Rabies, human |
— |
(0.00) |
— |
(0.00) |
— |
(0.00) |
— |
(0.00) |
1 |
(0.00) |
— |
(0.00) |
— |
(0.00) |
— |
1 |
|
Rubella |
— |
(0.00) |
— |
(0.00) |
1 |
(0.00) |
1 |
(0.00) |
6 |
(0.01) |
1 |
(0.00) |
— |
(0.00) |
— |
9 |
|
Rubella, congenital syndrome |
3 |
(0.08) |
— |
(0.00) |
— |
(0.00) |
— |
(0.00) |
— |
(0.00) |
— |
(0.00) |
— |
(0.00) |
— |
3 |
|
Salmonellosis |
5,649 |
(142.43) |
8,524 |
(52.74) |
6,566 |
(16.00) |
4,997 |
(11.41) |
7,038 |
(11.46) |
12,742 |
(12.27) |
7,476 |
(18.07) |
808 |
53,800 |
|
Shiga toxin-producing E. coli (STEC) |
193 |
(4.88) |
1,510 |
(9.37) |
1,204 |
(2.94) |
1,091 |
(2.50) |
892 |
(1.46) |
956 |
(0.92) |
538 |
(1.30) |
79 |
6,463 |
|
Shigellosis |
289 |
(7.29) |
4,487 |
(27.76) |
4,478 |
(10.91) |
1,176 |
(2.68) |
2,224 |
(3.62) |
1,836 |
(1.77) |
585 |
(1.41) |
208 |
15,283 |
|
Spotted fever rickettsiosis, total |
6 |
(0.15) |
63 |
(0.39) |
278 |
(0.68) |
401 |
(0.92) |
805 |
(1.32) |
1,990 |
(1.93) |
915 |
(2.23) |
12 |
4,470 |
|
confirmed |
— |
(0.00) |
7 |
(0.04) |
15 |
(0.04) |
11 |
(0.03) |
35 |
(0.06) |
83 |
(0.08) |
37 |
(0.09) |
— |
188 |
|
probable |
6 |
(0.15) |
56 |
(0.35) |
263 |
(0.64) |
390 |
(0.89) |
769 |
(1.26) |
1,905 |
(1.84) |
877 |
(2.13) |
12 |
4,278 |
|
Streptococcal toxic-shock syndrome |
2 |
(0.08) |
4 |
(0.04) |
9 |
(0.03) |
10 |
(0.04) |
33 |
(0.09) |
80 |
(0.12) |
55 |
(0.20) |
1 |
194 |
|
Syphillis, total, all stages**,¶¶ |
— |
(0.00) |
— |
(0.00) |
— |
(0.00) |
11,083 |
(25.30) |
20,189 |
(32.88) |
16,977 |
(16.35) |
1,161 |
(2.81) |
128 |
49,903 |
|
congenital (age <1 yr)** |
— |
(0.00) |
— |
(0.00) |
— |
(0.00) |
— |
(0.00) |
— |
(0.00) |
— |
(0.00) |
— |
(0.00) |
— |
322 |
|
primary and secondary** |
— |
(0.00) |
— |
(0.00) |
— |
(0.00) |
4,160 |
(9.50) |
6,683 |
(10.89) |
4,671 |
(4.50) |
123 |
(0.30) |
20 |
15,667 |
|
Tetanus |
2 |
(0.05) |
1 |
(0.01) |
1 |
(0.00) |
4 |
(0.01) |
9 |
(0.01) |
6 |
( 0.01) |
6 |
(0.01) |
8 |
37 |
|
Toxic-shock syndrome(other than streptococcal) |
— |
(0.00) |
4 |
(0.03) |
16 |
(0.05) |
33 |
(0.10) |
7 |
(0.02) |
4 |
( 0.01) |
1 |
(0.00) |
— |
65 |
|
Trichinellosis |
— |
(0.00) |
— |
(0.00) |
— |
(0.00) |
— |
(0.00) |
7 |
(0.01) |
9 |
(0.01) |
2 |
(0.01) |
— |
18 |
|
Tuberculosis*** |
58 |
(1.46) |
202 |
(1.25) |
226 |
(0.55) |
1,020 |
(2.33) |
2,421 |
(3.94) |
3,811 |
(3.67) |
2,204 |
(5.32) |
3 |
9,945 |
|
Tularemia |
— |
(0.00) |
16 |
(0.10) |
19 |
(0.05) |
7 |
(0.02) |
15 |
(0.02) |
53 |
(0.05) |
33 |
(0.08) |
6 |
149 |
|
Typhoid fever |
4 |
(0.10) |
49 |
(0.30) |
63 |
(0.15) |
65 |
(0.15) |
102 |
(0.17) |
49 |
(0.05) |
9 |
(0.02) |
13 |
354 |
|
Vancomycin-intermediate Staphylococcus aureus (VISA) |
— |
(0.00) |
— |
(0.00) |
2 |
(0.01) |
4 |
(0.01) |
12 |
(0.03) |
60 |
(0.08) |
54 |
(0.17) |
2 |
134 |
|
Vancomycin-resistant Staphylococcus aureus (VRSA) |
— |
(0.00) |
— |
(0.00) |
— |
(0.00) |
1 |
(0.00) |
— |
(0.00) |
— |
(0.00) |
1 |
(0.00) |
— |
2 |
|
Vibriosis |
11 |
(0.30) |
18 |
(0.12) |
92 |
(0.24) |
70 |
(0.17) |
179 |
(0.32) |
434 |
(0.46) |
239 |
(0.63) |
68 |
1,111 |
|
* Per 100,000 population. † No cases of anthrax; eastern equine encephalitis virus disease, nonneuroinvasive; poliomyelitis, paralytic; poliovirus infection, nonparalytic; Powassan virus nonneuroinvasive disease; severe acute respiratory syndrome-associated coronavirus disease (SARS-CoV); smallpox; western equine encephalitis virus disease, neuroinvasive and non-neuroinvasive; yellow fever; and viral hemorrhagic fevers were reported in the United States during 2012. Data on chronic hepatitis B and hepatitis C virus infection (past or present) are not included because they are undergoing data quality review. § Totals reported to the Division of Vector-Borne Diseases (DVBD), National Center for Emerging and Zoonotic Infectious Diseases (NCEZID) (ArboNET Surveillance), as of June 1, 2013. ¶ Notifiable in <25 states. ** Totals reported to the Division of STD Prevention, National Center for HIV/AIDS, Viral Hepatitis, STD, and TB Prevention (NCHHSTP), as of May 29, 2013. †† Total number of HIV diagnoses reported to the Division of HIV/AIDS Prevention, National Center for HIV/AIDS, Viral Hepatitis, STD, and TB Prevention (NCHHSTP) through December 31, 2012. §§ Totals reported to the Division of Influenza, National Center for Immunization and Respiratory Diseases (NCIRD), as of December 31, 2012. ¶¶ Includes the following categories: primary, secondary, latent (including early latent, late latent, and latent syphilis of unknown duration), neurosyphilis, late (including late syphilis with clinical manifestations other than neurosyphilis), and congenital syphilis. Totals reported to the Division of STD Prevention, National Center for HIV/AIDS, Viral Hepatitis, STD, and TB Prevention (NCHHSTP), as of May 29, 2013. *** Totals reported to the Division of Tuberculosis Elimination, NCHHSTP, as of June 15, 2013. |
||||||||||||||||
|
TABLE 4. Reported cases and incidence* of notifiable diseases,† by sex — United States, 2012 |
||||||
|---|---|---|---|---|---|---|
|
Disease |
Male |
Female |
Age not stated |
Total |
||
|
No. |
Rate |
No. |
Rate |
|||
|
Arboviral diseases§ |
||||||
|
California serogroup viruses |
||||||
|
neuroinvasive |
41 |
(0.03) |
32 |
(0.02) |
— |
73 |
|
nonneuroinvasive |
4 |
(0.00) |
4 |
(0.00) |
— |
8 |
|
Eastern equine encephalitis virus |
||||||
|
neuroinvasive |
13 |
(0.01) |
2 |
(0.00) |
— |
15 |
|
Powassan virus |
||||||
|
neuroinvasive |
4 |
(0.00) |
3 |
(0.00) |
— |
7 |
|
St. Louis encephalitis virus |
||||||
|
neuroinvasive |
— |
(0.00) |
1 |
(0.00) |
— |
1 |
|
nonneuroinvasive |
1 |
(0.00) |
1 |
(0.00) |
— |
2 |
|
West Nile virus |
||||||
|
neuroinvasive |
1,717 |
(1.12) |
1,155 |
(0.73) |
— |
2,872 |
|
nonneuroinvasive |
1,475 |
(0.96) |
1,326 |
(0.84) |
— |
2,801 |
|
Babesiosis¶ |
585 |
(0.76) |
321 |
(0.40) |
31 |
937 |
|
confirmed |
453 |
(0.29) |
233 |
(0.14) |
30 |
716 |
|
probable |
132 |
(0.08) |
88 |
(0.05) |
1 |
221 |
|
Botulism, total |
110 |
(0.07) |
57 |
(0.04) |
1 |
168 |
|
foodborne |
22 |
(0.01) |
5 |
(0.00) |
— |
27 |
|
infant |
74 |
(3.65) |
48 |
(2.48) |
1 |
123 |
|
other(wound and unspecified) |
14 |
(0.01) |
4 |
(0.00) |
— |
18 |
|
Brucellosis |
70 |
(0.05) |
44 |
(0.03) |
— |
114 |
|
Chancroid** |
7 |
(0.00) |
8 |
(0.01) |
— |
15 |
|
Chlamydia trachomatis, infection** |
402,557 |
(262.66) |
1,018,272 |
(643.15) |
2,147 |
1,422,976 |
|
Cholera |
8 |
(0.01) |
9 |
(0.01) |
— |
17 |
|
Coccidioidomycosis¶ |
8,581 |
(12.62) |
9,025 |
(13.03) |
196 |
17,802 |
|
Cryptosporidiosis, total |
3,725 |
(2.44) |
4,212 |
(2.67) |
19 |
7,956 |
|
confirmed |
2,434 |
(1.58) |
2,652 |
(1.67) |
12 |
5,098 |
|
probable |
1,214 |
(0.79) |
1,498 |
(0.94) |
6 |
2,718 |
|
Cyclosporiasis |
57 |
(0.04) |
66 |
(0.05) |
— |
123 |
|
Dengue virus infection |
||||||
|
Dengue fever |
269 |
(0.18) |
274 |
(0.17) |
1 |
544 |
|
Dengue hemorrhagic fever |
3 |
(0.00) |
— |
(0.00) |
— |
3 |
|
Diphtheria |
1 |
(0.00) |
— |
(0.00) |
— |
1 |
|
Ehrlichiosis/Anaplasmosis |
||||||
|
Anaplasma phagocytophilum |
1,356 |
(0.93) |
975 |
(0.65) |
58 |
2,389 |
|
Ehrlichia chaffeensis |
661 |
(0.45) |
463 |
(0.31) |
4 |
1,128 |
|
Ehrlichia ewingii |
10 |
(0.01) |
7 |
(0.00) |
— |
17 |
|
Undetermined |
105 |
(0.07) |
86 |
(0.06) |
— |
191 |
|
Giardiasis |
8,872 |
(6.97) |
6,227 |
(4.73) |
79 |
15,178 |
|
Gonorrhea** |
162,235 |
(105.86) |
172,066 |
(108.68) |
525 |
334,826 |
|
Haemophilus influenzae, invasive disease |
||||||
|
all ages, all serotypes |
1,566 |
(1.02) |
1,835 |
(1.16) |
17 |
3,418 |
|
age <5 yrs |
||||||
|
serotype b |
16 |
(0.16) |
14 |
(0.14) |
— |
30 |
|
nonserotype b |
120 |
(1.17) |
84 |
(0.85) |
1 |
205 |
|
unknown serotype |
132 |
(1.28) |
78 |
(0.79) |
— |
210 |
|
Hansen disease (leprosy) |
39 |
(0.03) |
19 |
(0.01) |
24 |
82 |
|
Hantavirus pulmonary syndrome |
16 |
(0.01) |
14 |
(0.01) |
— |
30 |
|
Hemolytic uremic syndrome, post-diarrheal |
107 |
(0.07) |
152 |
(0.10) |
15 |
274 |
|
Hepatitis virus, acute |
||||||
|
A |
769 |
(0.50) |
783 |
(0.49) |
10 |
1,562 |
|
B |
1,803 |
(1.18) |
1,084 |
(0.69) |
8 |
2,895 |
|
C |
957 |
(0.65) |
823 |
(0.54) |
2 |
1,782 |
|
Hepatitis B perinatal infection |
19 |
(0.01) |
20 |
(0.01) |
1 |
40 |
|
Human immunodeficiency virus (HIV) diagnoses†† |
28,221 |
(18.30) |
7,140 |
(4.50) |
— |
35,361 |
|
Influenza-associated pediatric mortality§§ |
25 |
(0.07) |
27 |
(0.07) |
— |
52 |
|
Invasive pneumococcal disease |
||||||
|
all ages |
7,893 |
(7.94) |
7,559 |
(7.33) |
183 |
15,635 |
|
age <5 yrs |
758 |
(9.79) |
501 |
(6.76) |
7 |
1,266 |
|
Legionellosis |
2,339 |
(1.53) |
1,341 |
(0.85) |
8 |
3,688 |
|
Listeriosis |
288 |
(0.19) |
437 |
(0.28) |
2 |
727 |
|
Lyme disease, total |
16,907 |
(11.10) |
13,269 |
(8.43) |
655 |
30,831 |
|
Confirmed |
12,278 |
(8.05) |
9,265 |
(5.88) |
471 |
22,014 |
|
Probable |
4,629 |
(3.03) |
4,004 |
(2.54) |
184 |
8,817 |
|
Malaria |
998 |
(0.65) |
492 |
(0.31) |
13 |
1,503 |
|
TABLE 4. (Continued) Reported cases and incidence* of notifiable diseases,† by sex — United States, 2012 |
||||||
|---|---|---|---|---|---|---|
|
Disease |
Male |
Female |
Age not stated |
Total |
||
|
No. |
Rate |
No. |
Rate |
|||
|
Measles, total |
34 |
(0.02) |
20 |
(0.01) |
1 |
55 |
|
indigenous |
22 |
(0.01) |
11 |
(0.01) |
1 |
34 |
|
imported |
12 |
(0.01) |
9 |
(0.01) |
— |
21 |
|
Meningococcal disease |
||||||
|
all serogroups |
265 |
(0.17) |
284 |
(0.18) |
2 |
551 |
|
serogroup A,C,Y, and W-135 |
71 |
(0.05) |
89 |
(0.06) |
1 |
161 |
|
serogroup B |
57 |
(0.04) |
53 |
(0.03) |
— |
110 |
|
serogroup other |
7 |
(0.00) |
13 |
(0.01) |
— |
20 |
|
serogroup unknown |
130 |
(0.08) |
129 |
(0.08) |
1 |
260 |
|
Mumps |
131 |
(0.09) |
98 |
(0.06) |
— |
229 |
|
Novel influenza A virus infection |
148 |
(0.10) |
1 |
(0.00) |
164 |
313 |
|
Pertussis |
21,786 |
(14.21) |
25,907 |
(16.36) |
584 |
48,277 |
|
Plague |
2 |
(0.00) |
2 |
(0.00) |
— |
4 |
|
Psittacosis |
1 |
(0.00) |
1 |
(0.00) |
— |
2 |
|
Q fever, total |
102 |
(0.07) |
32 |
(0.02) |
1 |
135 |
|
acute |
84 |
(0.06) |
28 |
(0.02) |
1 |
113 |
|
chronic |
18 |
(0.01) |
4 |
(0.00) |
— |
22 |
|
Rabies, human |
1 |
(0.00) |
(0.00) |
— |
1 |
|
|
Rubella |
6 |
(0.00) |
3 |
(0.00) |
— |
9 |
|
Rubella, congenital syndrome |
2 |
(0.00) |
1 |
(0.00) |
— |
3 |
|
Salmonellosis |
25,876 |
(16.88) |
27,548 |
(17.40) |
376 |
53,800 |
|
Shiga toxin-producing E. coli (STEC) |
3,025 |
(1.98) |
3,391 |
(2.15) |
47 |
6,463 |
|
Shigellosis |
7,462 |
(4.87) |
7,773 |
(4.91) |
48 |
15,283 |
|
Spotted fever rickettsiosis, total |
2,856 |
(1.88) |
1,607 |
(1.02) |
7 |
4,470 |
|
confirmed |
126 |
(0.08) |
62 |
(0.04) |
— |
188 |
|
probable |
2,730 |
(1.79) |
1,541 |
(0.98) |
7 |
4,278 |
|
Streptococcal toxic-shock syndrome |
93 |
(0.09) |
101 |
(0.10) |
— |
194 |
|
Syphillis, total, all stages**,¶¶ |
40,151 |
(26.20) |
9,684 |
(6.12) |
68 |
49,903 |
|
congenital (age <1 yr)** |
176 |
(8.68) |
133 |
(6.86) |
13 |
322 |
|
primary and secondary** |
14,190 |
(9.26) |
1,458 |
(0.92) |
19 |
15,667 |
|
Tetanus |
24 |
(0.02) |
13 |
(0.01) |
— |
37 |
|
Toxic-shock syndrome(other than streptococcal) |
9 |
(0.01) |
56 |
(0.05) |
— |
65 |
|
Trichinellosis |
12 |
(0.01) |
6 |
(0.00) |
— |
18 |
|
Tuberculosis*** |
6,028 |
(3.93) |
3,914 |
(2.47) |
3 |
9,945 |
|
Tularemia |
94 |
(0.06) |
51 |
(0.03) |
4 |
149 |
|
Typhoid fever |
172 |
(0.11) |
182 |
(0.11) |
— |
354 |
|
Vancomycin-intermediate Staphylococcus aureus (VISA) |
80 |
(0.07) |
54 |
(0.05) |
— |
134 |
|
Vancomycin-resistant Staphylococcus aureus (VRSA) |
1 |
(0.00) |
1 |
(0.00) |
— |
2 |
|
Vibriosis |
743 |
(0.53) |
359 |
(0.25) |
9 |
1,111 |
|
* Per 100,000 population. † No cases of anthrax; eastern equine encephalitis virus disease, nonneuroinvasive; poliomyelitis, paralytic; poliovirus infection, nonparalytic; Powassan virus nonneuroinvasive disease; severe acute respiratory syndrome-associated coronavirus disease (SARS-CoV); smallpox; western equine encephalitis virus disease, neuroinvasive and non-neuroinvasive; yellow fever; and viral hemorrhagic fevers were reported in the United States during 2012. Data on chronic hepatitis B and hepatitis C virus infection (past or present) are not included because they are undergoing data quality review. § Totals reported to the Division of Vector-Borne Diseases (DVBD), National Center for Emerging and Zoonotic Infectious Diseases (NCEZID) (ArboNET Surveillance), as of June 1, 2013. ¶ Notifiable in <25 states. ** Totals reported to the Division of STD Prevention, National Center for HIV/AIDS, Viral Hepatitis, STD, and TB Prevention (NCHHSTP), as of May 29, 2013. †† Total number of HIV diagnoses reported to the Division of HIV/AIDS Prevention, National Center for HIV/AIDS, Viral Hepatitis, STD, and TB Prevention (NCHHSTP) through December 31, 2012. §§ Totals reported to the Division of Influenza, National Center for Immunization and Respiratory Diseases (NCIRD), as of December 31, 2012. ¶¶ Includes the following categories: primary, secondary, latent (including early latent, late latent, and latent syphilis of unknown duration), neurosyphilis, late (including late syphilis with clinical manifestations other than neurosyphilis), and congenital syphilis. Totals reported to the Division of STD Prevention, National Center for HIV/AIDS, Viral Hepatitis, STD, and TB Prevention (NCHHSTP), as of May 29, 2013. *** Totals reported to the Division of Tuberculosis Elimination, NCHHSTP, as of June 15, 2013. |
||||||
|
TABLE 5. Reported cases and incidence* of notifiable diseases,† by race— United States, 2012 |
|||||||||||
|---|---|---|---|---|---|---|---|---|---|---|---|
|
Disease |
American Indian or Alaska Native |
Asian or Pacific Islander |
Black |
White |
Other |
Race not stated |
Total |
||||
|
No. |
Rate |
No. |
Rate |
No. |
Rate |
No. |
Rate |
||||
|
Arboviral diseases§ |
|||||||||||
|
California serogroup viruses |
|||||||||||
|
neuroinvasive |
2 |
(0.05) |
0 |
(0.00) |
2 |
(0.00) |
65 |
(0.03) |
0 |
4 |
73 |
|
West Nile virus |
|||||||||||
|
neuroinvasive |
16 |
(0.37) |
28 |
(0.16) |
276 |
(0.65) |
2,097 |
(0.85) |
36 |
419 |
2,872 |
|
nonneuroinvasive |
13 |
(0.30) |
21 |
(0.12) |
140 |
(0.33) |
2,054 |
(0.83) |
30 |
543 |
2,801 |
|
Babesiosis¶ |
8 |
(0.41) |
25 |
(0.21) |
15 |
(0.08) |
523 |
(0.42) |
16 |
350 |
937 |
|
confirmed |
4 |
(0.09) |
22 |
(0.13) |
14 |
(0.03) |
421 |
(0.16) |
14 |
241 |
716 |
|
probable |
4 |
(0.09) |
3 |
(0.02) |
1 |
(0.00) |
102 |
(0.03) |
2 |
109 |
221 |
|
Botulism, total |
6 |
(0.14) |
10 |
(0.06) |
5 |
(0.01) |
113 |
(0.05) |
3 |
31 |
168 |
|
foodborne |
6 |
(0.14) |
1 |
(0.01) |
1 |
(0.00) |
14 |
(0.01) |
1 |
4 |
27 |
|
infant |
— |
(0.00) |
9 |
(3.87) |
3 |
(0.44) |
89 |
(2.99) |
2 |
20 |
123 |
|
Brucellosis |
1 |
(0.02) |
3 |
(0.02) |
4 |
(0.01) |
78 |
(0.03) |
7 |
21 |
114 |
|
Chlamydia trachomatis, infection** |
18,989 |
(437.85) |
20,374 |
(115.79) |
460,473 |
(1078.5) |
463,538 |
(187.70) |
52,121 |
407,481 |
1,422,976 |
|
Coccidioidomycosis¶ |
159 |
(8.29) |
216 |
(2.50) |
459 |
(3.30) |
3,340 |
(2.96) |
301 |
13,327 |
17,802 |
|
Cryptosporidiosis, total |
38 |
(0.88) |
87 |
(0.50) |
576 |
(1.36) |
5,498 |
(2.23) |
224 |
1,533 |
7,956 |
|
confirmed |
25 |
(0.58) |
69 |
(0.39) |
377 |
(0.88) |
3,458 |
(1.40) |
147 |
1,022 |
5,098 |
|
probable |
13 |
(0.30) |
18 |
(0.10) |
199 |
(0.47) |
2,040 |
(0.83) |
77 |
371 |
2,718 |
|
Cyclosporiasis |
0 |
(0.00) |
1 |
(0.01) |
3 |
(0.01) |
77 |
(0.04) |
4 |
38 |
123 |
|
Dengue fever |
4 |
(0.09) |
65 |
(0.37) |
57 |
(0.13) |
240 |
(0.10) |
31 |
147 |
544 |
|
Ehrlichiosis/Anaplasmosis |
|||||||||||
|
Anaplasma phagocytophilum |
15 |
(0.40) |
15 |
(0.09) |
9 |
(0.02) |
1,522 |
(0.65) |
28 |
800 |
2,389 |
|
Ehrlichia chaffeensis |
26 |
(0.69) |
3 |
(0.02) |
36 |
(0.09) |
744 |
(0.32) |
18 |
301 |
1,128 |
|
Undetermined |
1 |
(0.03) |
3 |
(0.02) |
2 |
(0.00) |
117 |
(0.05) |
5 |
63 |
191 |
|
Giardiasis |
52 |
(1.51) |
782 |
(4.91) |
1,151 |
(3.35) |
6,534 |
(3.19) |
498 |
6,161 |
15,178 |
|
Gonorrhea** |
3,380 |
(77.94) |
3,080 |
(17.50) |
170,048 |
(398.28) |
80,274 |
(32.50) |
9,160 |
68,884 |
334,826 |
|
Haemophilus influenzae, invasive disease |
|||||||||||
|
all ages, all serotypes |
40 |
(0.92) |
57 |
(0.32) |
403 |
(0.94) |
2,153 |
(0.87) |
102 |
663 |
3,418 |
|
age <5 yrs |
|||||||||||
|
serotype b |
— |
(0.00) |
— |
(0.00) |
1 |
(0.03) |
24 |
(0.16) |
1 |
4 |
30 |
|
nonserotype b |
10 |
(2.55) |
7 |
(0.59) |
35 |
(1.02) |
96 |
(0.63) |
12 |
45 |
205 |
|
unknown serotype |
7 |
(1.79) |
6 |
(0.51) |
32 |
(0.94) |
114 |
(0.75) |
6 |
45 |
210 |
|
Hansen disease (leprosy) |
0 |
(0.00) |
16 |
(0.10) |
3 |
(0.01) |
26 |
(0.01) |
1 |
36 |
82 |
|
Hantavirus pulmonary syndrome |
3 |
(0.07) |
3 |
(0.02) |
0 |
(0.00) |
18 |
(0.01) |
1 |
5 |
30 |
|
Hemolytic uremic syndrome, post-diarrheal |
1 |
(0.02) |
8 |
(0.05) |
9 |
(0.02) |
209 |
(0.09) |
9 |
38 |
274 |
|
Hepatitis virus |
|||||||||||
|
A, acute |
7 |
(0.16) |
103 |
(0.59) |
96 |
(0.22) |
935 |
(0.38) |
79 |
342 |
1,562 |
|
B, acute |
19 |
(0.44) |
68 |
(0.39) |
448 |
(1.05) |
1,792 |
(0.73) |
62 |
506 |
2,895 |
|
C, acute |
44 |
(1.12) |
16 |
(0.09) |
59 |
(0.14) |
1,308 |
(0.55) |
41 |
314 |
1,782 |
|
Hepatitis B perinatal infection |
1 |
(0.02) |
25 |
(0.14) |
1 |
(0.00) |
4 |
(0.00) |
0 |
9 |
40 |
|
Human immunodeficiency virus (HIV) diagnoses†† |
187 |
(8.10) |
717 |
(4.60) |
16,152 |
(41.70) |
10,371 |
(5.20) |
7,934 |
— |
35,361 |
|
Influenza-associated pediatric mortality§§ |
1 |
(0.07) |
3 |
(0.07) |
9 |
(0.07) |
28 |
(0.05) |
2 |
9 |
52 |
|
Invasive pneumococcal disease |
|||||||||||
|
all ages |
194 |
(7.79) |
177 |
(1.98) |
2,431 |
(7.89) |
9,097 |
(5.67) |
294 |
3,442 |
15,635 |
|
age <5 yrs |
31 |
(10.98) |
41 |
(5.64) |
265 |
(9.30) |
609 |
(5.38) |
45 |
275 |
1,266 |
|
Legionellosis |
10 |
(0.23) |
45 |
(0.26) |
604 |
(1.43) |
2,340 |
(0.95) |
54 |
635 |
3,688 |
|
Listeriosis |
3 |
(0.07) |
43 |
(0.24) |
67 |
(0.16) |
465 |
(0.19) |
26 |
123 |
727 |
|
Lyme disease, total |
102 |
(2.36) |
305 |
(1.83) |
323 |
(0.76) |
17,802 |
(7.23) |
943 |
11,356 |
30,831 |
|
Confirmed |
70 |
(1.62) |
212 |
(1.27) |
219 |
(0.51) |
12,604 |
(5.11) |
747 |
8,162 |
22,014 |
|
Probable |
32 |
(0.74) |
93 |
(0.56) |
104 |
(0.24) |
5,198 |
(2.11) |
196 |
3,194 |
8,817 |
|
Malaria |
2 |
(0.05) |
122 |
(0.69) |
866 |
(2.03) |
248 |
(0.10) |
33 |
232 |
1,503 |
|
Measles, total |
0 |
(0.00) |
5 |
(0.03) |
8 |
(0.02) |
37 |
(0.01) |
2 |
3 |
55 |
|
indigenous |
0 |
(0.00) |
1 |
(0.01) |
5 |
(0.01) |
26 |
(0.01) |
0 |
2 |
34 |
|
Meningococcal disease |
|||||||||||
|
all serogroups |
10 |
(0.23) |
14 |
(0.08) |
83 |
(0.19) |
351 |
(0.14) |
20 |
73 |
551 |
|
serogroup A,C,Y, and W-135 |
4 |
(0.09) |
1 |
(0.01) |
25 |
(0.06) |
104 |
(0.04) |
6 |
21 |
161 |
|
serogroup B |
1 |
(0.02) |
3 |
(0.02) |
5 |
(0.01) |
86 |
(0.03) |
4 |
11 |
110 |
|
serogroup unknown |
4 |
(0.09) |
10 |
(0.06) |
48 |
(0.11) |
155 |
(0.06) |
9 |
34 |
260 |
|
TABLE 5. (Continued) Reported cases and incidence* of notifiable diseases,† by race— United States, 2012 |
|||||||||||
|---|---|---|---|---|---|---|---|---|---|---|---|
|
Disease |
American Indian or Alaska Native |
Asian or Pacific Islander |
Black |
White |
Other |
Race not stated |
Total |
||||
|
No. |
Rate |
No. |
Rate |
No. |
Rate |
No. |
Rate |
||||
|
Mumps |
0 |
(0.00) |
27 |
(0.15) |
14 |
(0.03) |
117 |
(0.05) |
17 |
54 |
229 |
|
Novel influenza A virus infection |
0 |
(0.00) |
6 |
(0.03) |
1 |
(0.00) |
13 |
(0.01) |
11 |
282 |
313 |
|
Pertussis |
543 |
(12.52) |
655 |
(3.72) |
1,761 |
(4.12) |
33,067 |
(13.39) |
1,453 |
10,798 |
48,277 |
|
Q fever, total |
0 |
(0.00) |
4 |
(0.02) |
2 |
(0.00) |
85 |
(0.03) |
3 |
41 |
135 |
|
acute |
0 |
(0.00) |
4 |
(0.02) |
2 |
(0.00) |
70 |
(0.03) |
3 |
34 |
113 |
|
Salmonellosis |
347 |
(8.00) |
1,568 |
(8.91) |
5,013 |
(11.74) |
32,739 |
(13.26) |
1,713 |
12,420 |
53,800 |
|
Shiga toxin-producing E. coli (STEC) |
32 |
(0.76) |
116 |
(0.66) |
276 |
(0.65) |
4,434 |
(1.80) |
175 |
1,430 |
6,463 |
|
Shigellosis |
193 |
(4.45) |
224 |
(1.27) |
3,085 |
(7.23) |
8,004 |
(3.24) |
629 |
3,148 |
15,283 |
|
Spotted fever rickettsiosis, total |
158 |
(3.75) |
20 |
(0.12) |
116 |
(0.27) |
2,827 |
(1.15) |
36 |
1,313 |
4,470 |
|
confirmed |
11 |
(0.25) |
0 |
(0.00) |
6 |
(0.01) |
135 |
(0.05) |
0 |
36 |
188 |
|
probable |
147 |
(3.39) |
20 |
(0.12) |
110 |
(0.26) |
2,689 |
(1.09) |
36 |
1,276 |
4,278 |
|
Streptococcal toxic-shock syndrome |
1 |
(0.04) |
6 |
(0.07) |
18 |
(0.06) |
131 |
(0.08) |
4 |
34 |
194 |
|
Syphillis, total, all stages**,¶¶ |
285 |
(6.57) |
1,127 |
(6.41) |
21,386 |
(50.09) |
21,447 |
(8.68) |
2,840 |
2,818 |
49,903 |
|
congenital (age <1 yr)** |
2 |
(2.59) |
6 |
(2.58) |
185 |
(27.12) |
116 |
(3.90) |
6 |
7 |
322 |
|
primary and secondary** |
77 |
(1.78) |
341 |
(1.94) |
6,391 |
(14.97) |
7,530 |
(3.05) |
725 |
603 |
15,667 |
|
Tetanus |
0 |
(0.00) |
0 |
(0.00) |
3 |
(0.01) |
28 |
(0.01) |
0 |
6 |
37 |
|
Toxic-shock syndrome(other than streptococcal) |
0 |
(0.00) |
1 |
(0.01) |
5 |
(0.02) |
48 |
(0.03) |
1 |
10 |
65 |
|
Tuberculosis*** |
169 |
(3.90) |
2,977 |
(16.92) |
2,286 |
(5.35) |
4,199 |
(1.70) |
175 |
139 |
9,945 |
|
Tularemia |
10 |
(0.23) |
2 |
(0.01) |
2 |
(0.00) |
108 |
(0.04) |
0 |
27 |
149 |
|
Typhoid fever |
4 |
(0.09) |
198 |
(1.13) |
19 |
(0.04) |
48 |
(0.02) |
32 |
53 |
354 |
|
Vancomycin-intermediate Staphylococcus aureus (VISA) |
1 |
(0.04) |
0 |
(0.00) |
30 |
(0.08) |
75 |
(0.04) |
1 |
27 |
134 |
|
Vibriosis |
1 |
(0.03) |
50 |
(0.30) |
67 |
(0.16) |
719 |
(0.32) |
21 |
253 |
1,111 |
|
* Per 100,000 population. Diseases for which <25 cases were reported are not included in this table. † No cases of anthrax; eastern equine encephalitis virus disease, nonneuroinvasive; poliomyelitis, paralytic; poliovirus infection, nonparalytic; Powassan virus nonneuroinvasive disease; severe acute respiratory syndrome-associated coronavirus disease (SARS-CoV); smallpox; western equine encephalitis virus disease, neuroinvasive and non-neuroinvasive; yellow fever; and viral hemorrhagic fevers were reported in the United States during 2012. Data on chronic hepatitis B and hepatitis C virus infection (past or present) are not included because they are undergoing data quality review. § Totals reported to the Division of Vector-Borne Diseases (DVBD), National Center for Emerging and Zoonotic Infectious Diseases (NCEZID) (ArboNET Surveillance), as of June 1, 2013. ¶ Notifiable in <25 states. ** Cases with unknown race have not been redistributed. For this reason, the total number of cases reported here might differ slightly from totals reported in other surveillance summaries. †† Total number of HIV diagnoses reported to the Division of HIV/AIDS Prevention, National Center for HIV/AIDS, Viral Hepatitis, STD, and TB Prevention (NCHHSTP) through December 31, 2012. §§ Totals reported to the Division of Influenza, National Center for Immunization and Respiratory Diseases (NCIRD), as of December 31, 2012. ¶¶ Includes the following categories: primary, secondary, latent (including early latent, late latent, and latent syphilis of unknown duration), neurosyphilis, late (including late syphilis with clinical manifestations other than neurosyphilis), and congenital syphilis. Totals reported to the Division of STD Prevention, National Center for HIV/AIDS, Viral Hepatitis, STD, and TB Prevention (NCHHSTP), as of May 29, 2013. *** Totals reported to the Division of Tuberculosis Elimination, NCHHSTP, as of June 15, 2013. |
|||||||||||
|
TABLE 6. Reported cases and incidence* of notifiable diseases,† by ethnicity — United States, 2012 |
||||||
|---|---|---|---|---|---|---|
|
Disease |
Hispanic |
Non-Hispanic |
Ethnicity not stated |
Total |
||
|
Rate |
Rate |
|||||
|
Arboviral diseases§ |
||||||
|
California serogroup viruses |
||||||
|
neuroinvasive |
1 |
(0.00) |
65 |
(0.03) |
7 |
73 |
|
West Nile virus |
||||||
|
neuroinvasive |
339 |
(0.65) |
1,855 |
(0.71) |
678 |
2,872 |
|
nonneuroinvasive |
208 |
(0.40) |
1,806 |
(0.70) |
787 |
2,801 |
|
Babesiosis¶ |
35 |
(0.13) |
469 |
(0.36) |
433 |
937 |
|
confirmed |
33 |
(0.06) |
387 |
(0.14) |
296 |
716 |
|
probable |
2 |
(0.00) |
82 |
(0.02) |
137 |
221 |
|
Botulism, total |
35 |
(0.07) |
96 |
(0.04) |
37 |
168 |
|
foodborne |
6 |
(0.01) |
15 |
(0.01) |
6 |
27 |
|
infant |
20 |
(1.94) |
75 |
(2.56) |
28 |
123 |
|
Brucellosis |
60 |
(0.12) |
42 |
(0.02) |
12 |
114 |
|
Chlamydia trachomatis, infection** |
196,493 |
(378.74) |
681,833 |
(262.54) |
544,650 |
1,422,976 |
|
Coccidioidomycosis¶ |
1,626 |
(7.40) |
3,028 |
(4.07) |
13,148 |
17,802 |
|
Cryptosporidiosis, total |
508 |
(0.98) |
4,989 |
(1.93) |
2,459 |
7,956 |
|
confirmed |
382 |
(0.74) |
3,136 |
(1.21) |
1,580 |
5,098 |
|
probable |
126 |
(0.24) |
1,853 |
(0.71) |
739 |
2,718 |
|
Cyclosporiasis |
15 |
(0.03) |
68 |
(0.03) |
40 |
123 |
|
Dengue fever |
163 |
(0.31) |
235 |
(0.09) |
146 |
544 |
|
Ehrlichiosis/Anaplasmosis |
||||||
|
Anaplasma phagocytophilum |
35 |
(0.07) |
1,422 |
(0.58) |
932 |
2,389 |
|
Ehrlichia chaffeensis |
19 |
(0.04) |
758 |
(0.31) |
351 |
1,128 |
|
Undetermined |
5 |
(0.01) |
120 |
(0.05) |
66 |
191 |
|
Giardiasis |
942 |
(2.33) |
7,043 |
(3.23) |
7,193 |
15,178 |
|
Gonorrhea** |
31,590 |
(60.89) |
190,563 |
(73.38) |
112,673 |
334,826 |
|
Haemophilus influenzae, invasive disease |
||||||
|
all ages, all serotypes |
208 |
(0.40) |
1,942 |
(0.75) |
1,268 |
3,418 |
|
age <5 yrs |
||||||
|
serotype b |
1 |
(0.02) |
23 |
(0.15) |
6 |
30 |
|
nonserotype b |
24 |
(0.47) |
94 |
(0.63) |
87 |
205 |
|
unknown serotype |
30 |
(0.58) |
122 |
(0.81) |
58 |
210 |
|
Hansen disease (leprosy) |
18 |
(0.04) |
33 |
(0.01) |
31 |
82 |
|
Hantavirus pulmonary syndrome |
5 |
(0.01) |
22 |
(0.01) |
3 |
30 |
|
Hemolytic uremic syndrome, post-diarrheal |
24 |
(0.05) |
194 |
(0.08) |
56 |
274 |
|
Hepatitis virus, acute |
||||||
|
A |
259 |
(0.50) |
895 |
(0.34) |
408 |
1,562 |
|
B |
193 |
(0.37) |
1,804 |
(0.70) |
898 |
2,895 |
|
C |
104 |
(0.21) |
1,099 |
(0.44) |
579 |
1,782 |
|
Hepatitis B perinatal infection |
2 |
(0.00) |
26 |
(0.01) |
12 |
40 |
|
Human immunodeficiency virus (HIV) diagnoses†† |
7,266 |
(13.70) |
28,095 |
(10.80) |
— |
35,361 |
|
Influenza-associated pediatric mortality§§ |
7 |
(0.04) |
31 |
(0.05) |
14 |
52 |
|
Invasive pneumococcal disease |
||||||
|
all ages |
951 |
(3.09) |
8,054 |
(4.69) |
6,630 |
15,635 |
|
age <5 yrs |
140 |
(4.12) |
661 |
(5.62) |
465 |
1,266 |
|
Legionellosis |
196 |
(0.38) |
2,403 |
(0.93) |
1,089 |
3,688 |
|
Listeriosis |
83 |
(0.16) |
450 |
(0.17) |
194 |
727 |
|
Lyme disease, total |
559 |
(1.08) |
12,386 |
(4.80) |
17,886 |
30,831 |
|
Confirmed |
361 |
(0.70) |
8,736 |
(3.38) |
12,917 |
22,014 |
|
Probable |
198 |
(0.38) |
3,650 |
(1.41) |
4,969 |
8,817 |
|
Malaria |
34 |
(0.07) |
1,098 |
(0.42) |
371 |
1,503 |
|
Measles, total |
2 |
(0.00) |
49 |
(0.02) |
4 |
55 |
|
indigenous |
1 |
(0.00) |
31 |
(0.01) |
2 |
34 |
|
Meningococcal disease |
||||||
|
all serogroups |
100 |
(0.19) |
331 |
(0.13) |
120 |
551 |
|
serogroup A,C,Y, and W-135 |
20 |
(0.04) |
106 |
(0.04) |
35 |
161 |
|
serogroup B |
16 |
(0.03) |
69 |
(0.03) |
25 |
110 |
|
serogroup unknown |
62 |
(0.12) |
146 |
(0.06) |
52 |
260 |
|
Mumps |
33 |
(0.06) |
133 |
(0.05) |
63 |
229 |
|
Novel influenza A virus infection |
8 |
(0.02) |
233 |
(0.09) |
72 |
313 |
|
Pertussis |
5,831 |
(11.24) |
29,954 |
(11.53) |
12,492 |
48,277 |
|
TABLE 6. (Continued) Reported cases and incidence* of notifiable diseases,† by ethnicity — United States, 2012 |
||||||
|---|---|---|---|---|---|---|
|
Disease |
Hispanic |
Non-Hispanic |
Ethnicity not stated |
Total |
||
|
Rate |
Rate |
|||||
|
Q fever, total |
17 |
(0.03) |
70 |
(0.03) |
48 |
135 |
|
acute |
16 |
(0.03) |
58 |
(0.02) |
39 |
113 |
|
Salmonellosis |
6,674 |
(12.86) |
30,614 |
(11.79) |
16,512 |
53,800 |
|
Shiga toxin-producing E. coli (STEC) |
713 |
(1.38) |
3,949 |
(1.52) |
1,801 |
6,463 |
|
Shigellosis |
3,174 |
(6.12) |
8,531 |
(3.28) |
3,578 |
15,283 |
|
Spotted fever rickettsiosis, total |
111 |
(0.21) |
2,841 |
(1.10) |
1,518 |
4,470 |
|
confirmed |
2 |
(0.00) |
124 |
(0.05) |
62 |
188 |
|
probable |
109 |
(0.21) |
2,715 |
(1.05) |
1,454 |
4,278 |
|
Streptococcal toxic-shock syndrome |
18 |
(0.09) |
108 |
(0.06) |
68 |
194 |
|
Syphillis, total, all stages**,¶¶ |
11,312 |
(21.80) |
35,397 |
(13.63) |
3,194 |
49,903 |
|
congenital (age <1 yr)** |
79 |
(7.64) |
232 |
(7.91) |
11 |
322 |
|
primary and secondary** |
3,089 |
(5.95) |
11,864 |
(4.57) |
714 |
15,667 |
|
Tetanus |
9 |
(0.02) |
18 |
(0.01) |
10 |
37 |
|
Toxic-shock syndrome(other than streptococcal) |
3 |
(0.01) |
43 |
(0.02) |
19 |
65 |
|
Tuberculosis*** |
2,790 |
(5.38) |
7,140 |
(2.75) |
15 |
9,945 |
|
Tularemia |
4 |
(0.01) |
110 |
(0.04) |
35 |
149 |
|
Typhoid fever |
39 |
(0.08) |
267 |
(0.10) |
48 |
354 |
|
Vancomycin-intermediate Staphylococcus aureus (VISA) |
10 |
(0.03) |
87 |
(0.04) |
37 |
134 |
|
Vibriosis |
94 |
(0.19) |
675 |
(0.29) |
342 |
1,111 |
|
* Per 100,000 population. Diseases for which <25 cases were reported are not included in this table. † No cases of anthrax; eastern equine encephalitis virus disease, nonneuroinvasive; poliomyelitis, paralytic; poliovirus infection, nonparalytic; Powassan virus nonneuroinvasive disease; severe acute respiratory syndrome-associated coronavirus disease (SARS-CoV); smallpox; western equine encephalitis virus disease, neuroinvasive and non-neuroinvasive; yellow fever; and viral hemorrhagic fevers were reported in the United States during 2012. Data on chronic hepatitis B and hepatitis C virus infection (past or present) are not included because they are undergoing data quality review. § Totals reported to the Division of Vector-Borne Diseases (DVBD), National Center for Emerging and Zoonotic Infectious Diseases (NCEZID) (ArboNET Surveillance), as of June 1, 2013. ¶ Notifiable in <25 states. ** Cases with unknown race have not been redistributed. For this reason, the total number of cases reported here might differ slightly from totals reported in other surveillance summaries. †† Total number of HIV diagnoses reported to the Division of HIV/AIDS Prevention, National Center for HIV/AIDS, Viral Hepatitis, STD, and TB Prevention (NCHHSTP) through December 31, 2012. §§ Totals reported to the Division of Influenza, National Center for Immunization and Respiratory Diseases (NCIRD), as of December 31, 2012. ¶¶ Includes the following categories: primary, secondary, latent (including early latent, late latent, and latent syphilis of unknown duration), neurosyphilis, late (including late syphilis with clinical manifestations other than neurosyphilis), and congenital syphilis. Totals reported to the Division of STD Prevention, National Center for HIV/AIDS, Viral Hepatitis, STD, and TB Prevention (NCHHSTP), as of May 29, 2013. *** Totals reported to the Division of Tuberculosis Elimination, NCHHSTP, as of June 15, 2013. |
||||||
PART 2
Graphs and Maps for Selected Notifiable Diseases in the United States, 2012
Abbreviations and Symbols Used in Graphs and Maps
U Data not available.
N Not reportable (i.e., report of disease not required in that jurisdiction).
DC District of Columbia
NYC New York City
AS American Samoa
CNMI Commonwealth of Northern Mariana Islands
GU Guam
PR Puerto Rico
VI U.S. Virgin Islands
Anthrax. Number of both naturally occurring and biological terrorism-related reported cases, by year — United States, 1957–2012
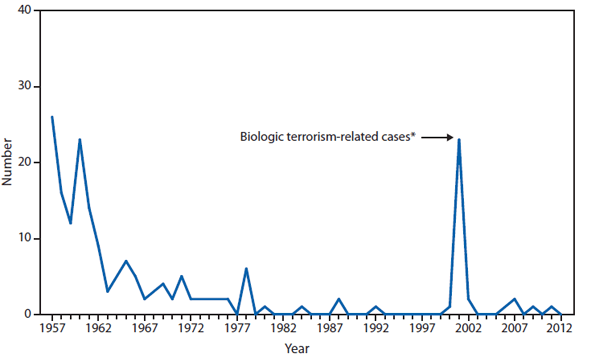
* Twenty-two bioterrorism-associated cases were reported from Connecticut, Florida, Maryland, New Jersey, Pennsylvania, and Virginia in 2001, and one naturally occurring epizootic-associated case was reported from Texas.
Naturally occurring anthrax epizootics occur annually among U.S. wildlife and livestock populations. In 2012, these were reported in states that routinely experience such outbreaks including Texas, North Dakota, and Nevada; however, livestock outbreaks additionally occurred in 2012 in Mississippi, Oregon, and Colorado, where anthrax outbreaks were not reported in livestock for ≥2 decades. These outbreaks were associated with exposures in persons handling and disposing of affected livestock and collecting diagnostic specimens. Although no human infections resulted, these exposures reflect the importance of timely recognition of anthrax in susceptible animals and the use of appropriate protective measures to prevent human exposures.
Alternate Text: This figure is a line graph that presents the number of anthrax cases by year in the United States from 1957 to 2012.
ARBOVIRAL DISEASES. Number* of reported cases of neuroinvasive disease, by year — United States, 2003–2012
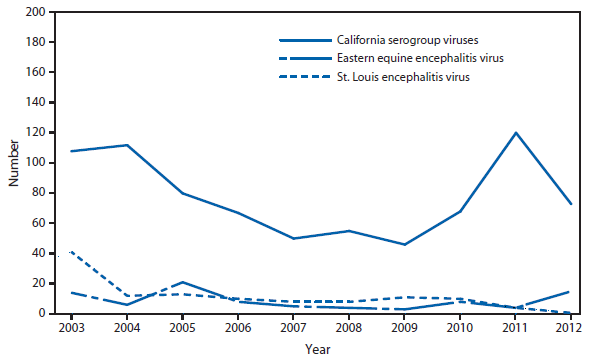
* Data from the Division of Vector-Borne Diseases (DVBD), National Center for Emerging and Zoonotic Infectious Diseases (ArboNET Surveillance). Only reported cases of neuroinvasive disease are shown.
Alternate Text: This figure is a line graph that presents the number of cases of neuroinvasive disease, broken down by California serogroup viruses, Eastern equine encephalitis virus, and St. Louis encephalitis virus, from 2003 to 2012.
ARBOVIRAL DISEASES, WEST NILE VIRUS. Incidence* of reported cases of neuroinvasive disease — United States and U.S. territories, 2012
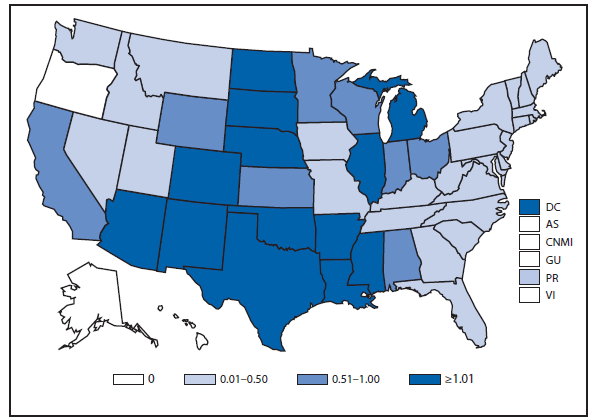
* Per 100,000 population. Data from the Division of Vector-Borne Diseases (DVBD), National Center for Emerging and Zoonotic Infectious Diseases (ArboNET Surveillance).
In 2012, the states with the highest reported incidence of West Nile virus (WNV) neuroinvasive disease were South Dakota (7.44 per 100,000), North Dakota (5.57), Mississippi (3.45), Louisiana (3.37), and Texas (3.24). Four states reported more than half of the WNV neuroinvasive disease cases: Texas (844 cases), California (297), Illinois (187), and Louisiana (155).
Alternate Text: This figure is a map that presents the incidence of reported cases per 100,000 population of neuroinvasive disease in each state 2012.
ARBOVIRAL DISEASES, WEST NILE VIRUS. Incidence* of reported cases of neuroinvasive disease, by year — United States, 2003–2012
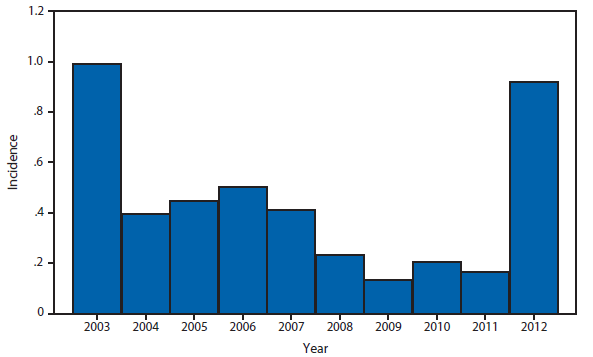
* Per 100,000 population. Data from the Division of Vector-Borne Diseases (DVBD), National Center for Emerging and Zoonotic Infectious Diseases (ArboNET Surveillance).
During 2004–2011, sporadic cases and smaller outbreaks continued to occur, but national incidence generally declined until 2012, when a large multistate outbreak of WNV occurred.
Alternate Text: This figure is a bar graph that presents the incidence per 100,000 population of reported cases of neuroinvasive disease during 2012.
ARBOVIRAL DISEASES, WEST NILE VIRUS. Incidence* of reported cases of neuroinvasive disease, by age group — United States, 2012
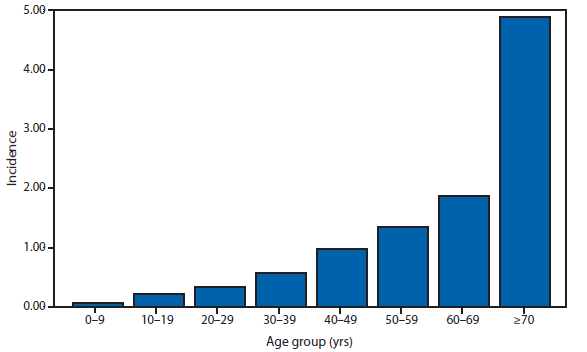
* Per 100,000 population. Data from the Division of Vector-Borne Diseases (DVBD), National Center for Emerging and Zoonotic Infectious Diseases (ArboNET Surveillance).
In 2012, the median age of patients with West Nile virus neuroinvasive disease was 59 years (range: 1 month–100 years), with increasing incidence among older age groups.
Alternate Text: This figure is a bar graph that presents the incidence of cases reported of neuroinvasive disease by age groups spanning 9 years.
BABESIOSIS. Number of reported cases, by county — United States, 2012
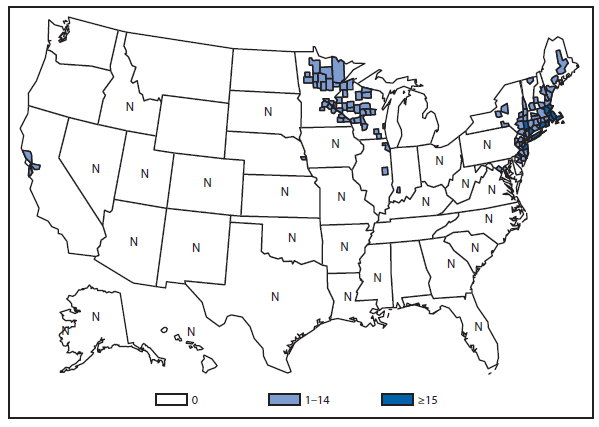
Babesiosis, a tickborne parasitic infection, became nationally notifiable in 2011. Approximately 97% of cases were reported from the Northeast and Upper Midwest.
Alternate Text: This figure is a map that presents the number of reported cases in each state in 2012.
BOTULISM, FOODBORNE. Number of reported cases, by year — United States, 1992–2012
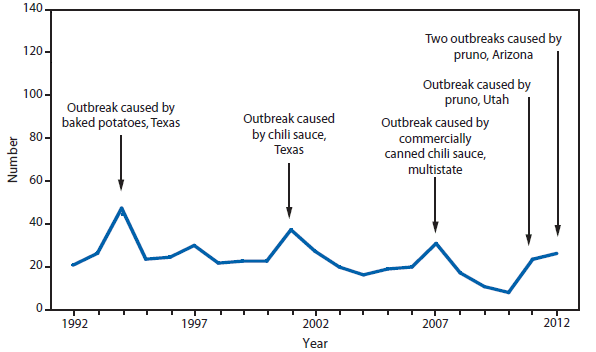
The number of foodborne botulism cases has remained fairly steady, with peaks corresponding to larger outbreaks. In 2012, four outbreaks occurred, two associated with consumption of pruno, an illicit alcoholic brew, in an Arizona prison (4 cases and 8 cases), one associated with home-canned spaghetti and meat sauce (2 cases), and one associated with home-canned beets (3 cases).
Alternate Text: This figure is a line graph that presents the number of foodborne-related botulism cases in the United States from 1992 to 2012.
BOTULISM, INFANT. Number of reported cases, by year — United States, 1992–2012
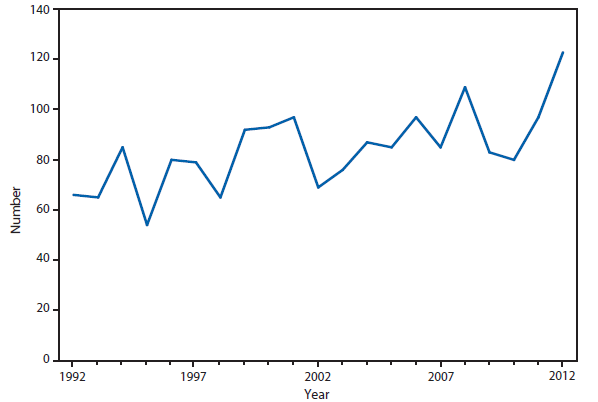
In 2012, infant botulism, caused by production of botulinum toxin in the intestine, remained the most common category of botulism in the United States.
Alternate Text: This figure is a line graph that presents the number of botulism cases in U.S. infants from 1992 to 2012.
BOTULISM, OTHER. Number* of reported cases, by year — United States, 2002–2012
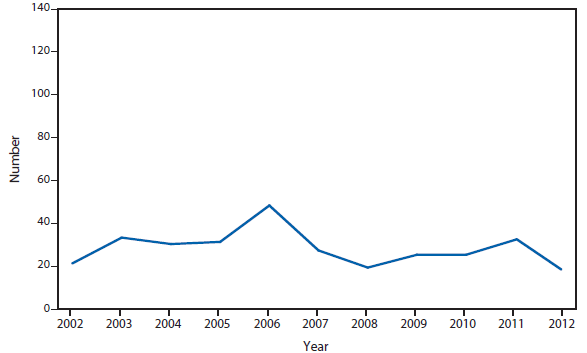
* Includes wound and unspecified.
Annual numbers of cases of wound botulism and of botulism in "unspecified" transmission categories have remained generally stable during the past decade.
Alternate Text: This figure is a line graph that presents the number of wound-related and unspecified botulism cases in the United States from 2002 to 2012.
Brucellosis. Number of reported cases, by year — United States, 1982–2012
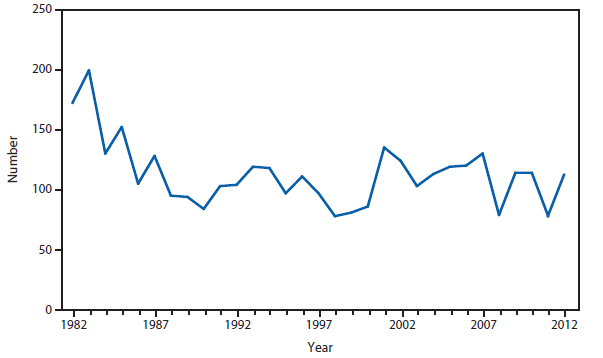
Reported cases for 2012 increased by 44% compared with 2011.
Alternate Text: This figure is a line graph that presents the number of brucellosis cases in the United States from 1982 to 2012.
Brucellosis. Number of reported cases — United States and U.S. territories, 2012
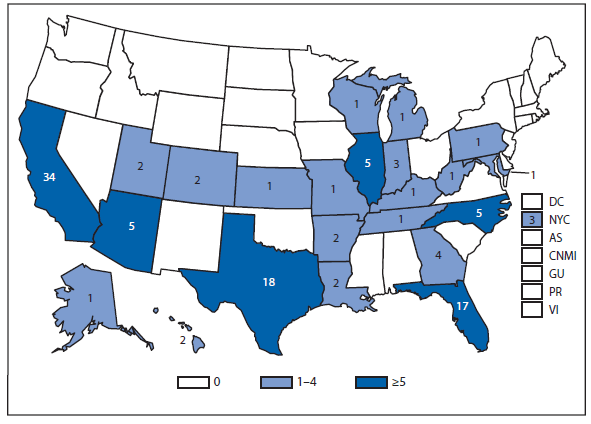
Cases from Arizona, California, Florida, Illinois, North Carolina, and Texas accounted for approximately three quarters (73.7%) of all reported cases.
Alternate Text: This figure is a map of the United States and U.S. territories that presents the number of brucellosis cases in each state and territory in 2012.
Chlamydia. Incidence* among women — United States and U.S. territories, 2012
* Per 100,000 population.
In 2012, the chlamydia rate among women in the U.S. and territories (Guam, Puerto Rico, and Virgin Islands) was 639.0 cases per 100,000 population.
Alternate Text : This figure is a map of the United States and U.S. territories that presents the incidence per 100,000 population of chlamydia among women in 2012.
Cholera. Number of reported cases — United States and U.S. territories, 2012
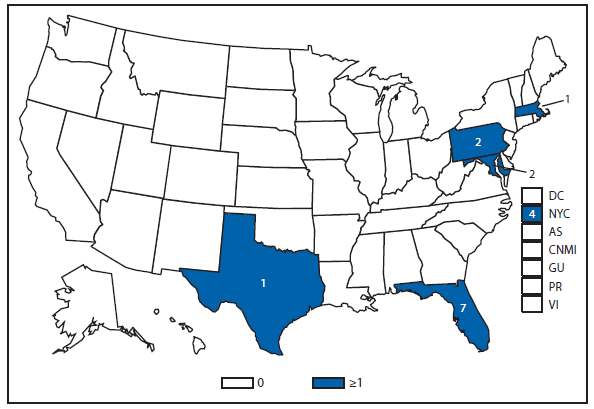
In 2012, as in 2010 and 2011, most cases of cholera reported the United States were in travelers who had recently arrived from Hispaniola. Of the 17 cholera infections in 2012, 16 were travel-associated (12 with travel to Hispaniola [nine to Haiti and three to the Dominican Republic] and four to other cholera-affected countries). One patient reported exposure to Vibrio cholerae in a laboratory.
Alternate Text: This figure is a map of the United States and U.S. territories that presents the number of cholera cases in each state and territory in 2012.
COCCIDIOIDOMYCOSIS. Number of reported cases — United States and U.S. territories, 2012
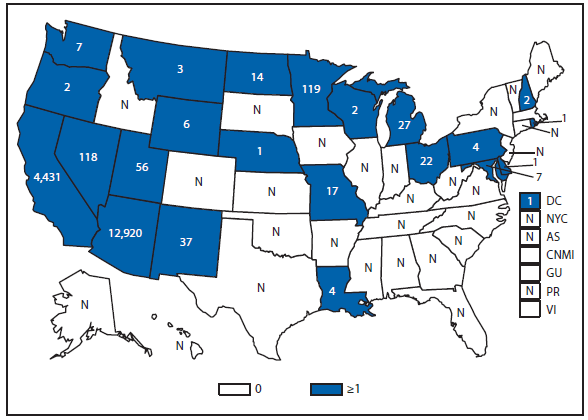
In 2012, 72.6% of reported coccidioidomycosis cases were from Arizona, 24.9% from California, 1.2% from other endemic states (Nevada, New Mexico, and Utah) combined, and 1.3% from nonendemic states.
Alternate Text: This figure is a map of the United States and U.S. territories that presents the number of reported cases in each state and territory in 2012.
Cryptosporidiosis. Incidence* — United States and U.S. territories, 2012
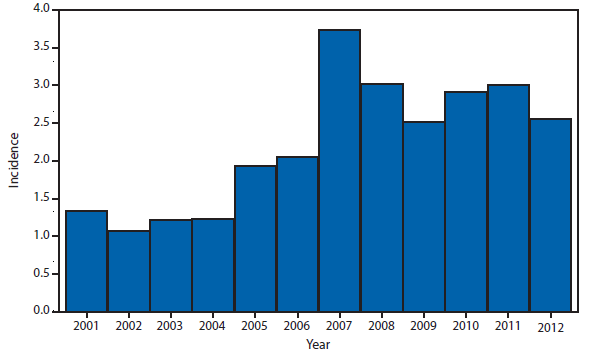
* Per 100,000 population.
Cryptosporidiosis is widespread geographically in the United States. Although incidence appears to be consistently higher in certain states, differences in reported incidence among states might reflect differences in risk factors; the number of cases associated with outbreaks; or in the capacity to detect, investigate, and report cases. Incidence categories have been modified to reflect the recent increase in incidence.
Alternate Text: This figure is a bar chart that presents the incidence per 100,000 population of cryptosporidiosis cases in the United States from 2001 to 2012.
Cryptosporidiosis. Incidence,* by year — United States, 2001–2012
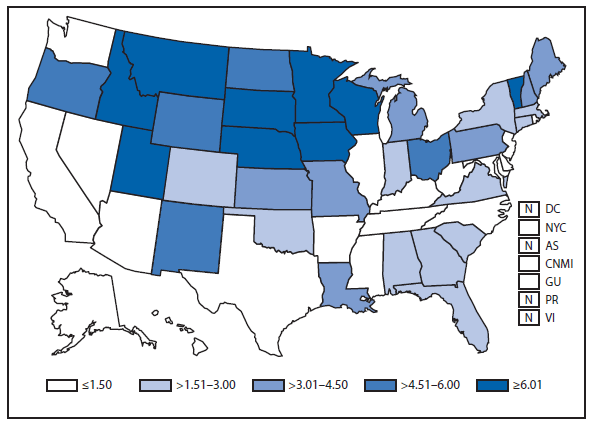
* Per 100,000 population.
Cryptosporidiosis incidence remains historically elevated relative to the baseline observed before 2005. Whether the changes in cryptosporidiosis reporting reflect a real change in cryptosporidiosis incidence or changing diagnosis, testing, or reporting patterns is unclear.
Alternate Text: This figure is a map of the United States and U.S. territories that presents the incidence range per 100,000 population of cryptosporidiosis cases in each state and territory in 2012.
CYCLOSPORIASIS. Number of reported cases — United States and U.S. territories, 2012
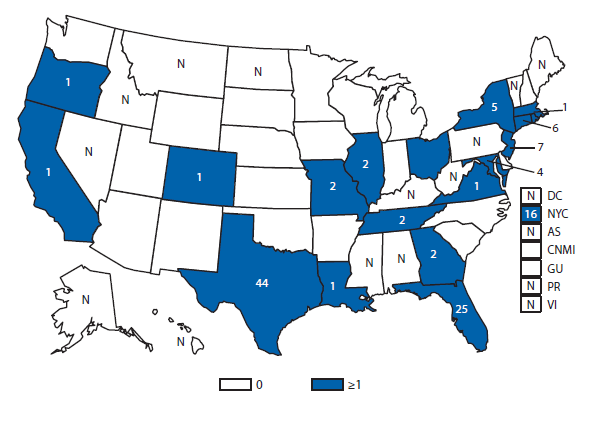
Alternate Text: This figure is a map that provides the reported cases of Cyclosporiasis in the United States and in U.S. territories in 2012.
Dengue virus infection. Number* of reported cases, by age group — United States, 2012
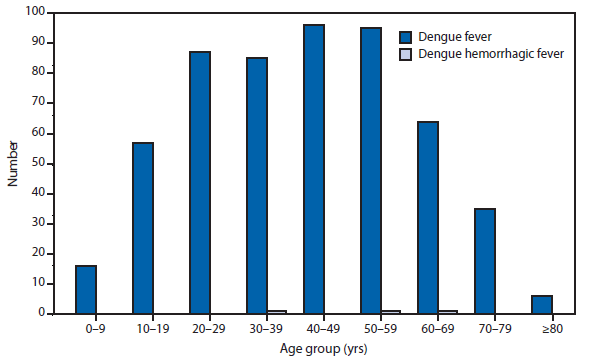
* Data from the Division of Vector-Borne Diseases (DVBD), National Center for Emerging and Zoonotic Infectious Diseases (ArboNET Surveillance).
Alternate Text: This figure is a bar chart of the number of reported cases of dengue virus infection by age group in the United States in 2012.
Dengue fever and dengue hemorrhagic fever. Number of reported cases, by location of residence* — United States and U.S. territories, 2012
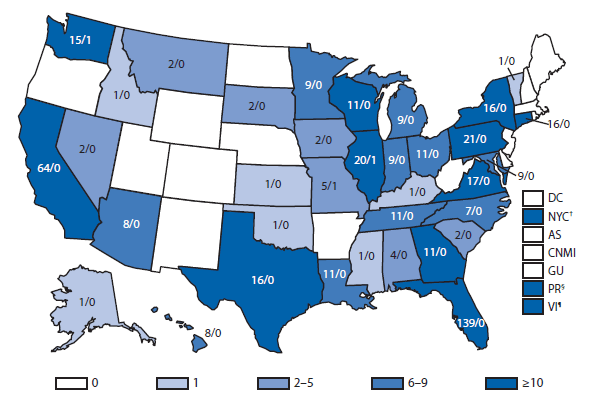
* Number of Dengue fever cases/number of Dengue Hemmorrhagic fever. Data from the Division of Vector-Borne Diseases (DVBD), National Center for Emerging and Zoonotic Infectious Diseases (ArboNET Surveillance).
† New York City reported cases 95/0.
§ Puerto Rico locally acquired cases 5,907/118.
¶ Virgin Islands reported cases 141/1.
Alternate Text: This figure is a map of the United States that presents the number of cases of dengue fever and dengue hemorrhagic fever in the United States and its territories in 2012.
DIPHTHERIA. Number* of reported cases, by year — United States, 1982–2012
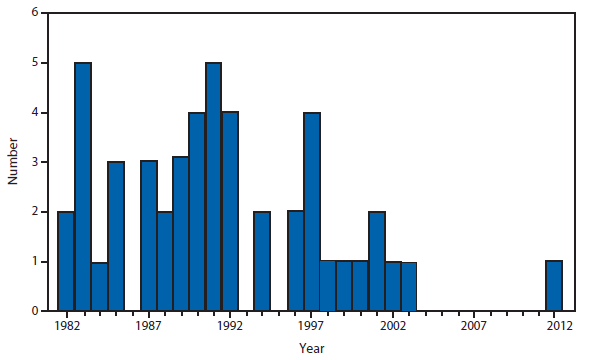
* Data from the Division of Vector-Borne Diseases (DVBD), National Center for Emerging and Zoonotic Infectious Diseases (ArboNET Surveillance).
In 2012, a probable case of non-fatal respiratory diphtheria with a positive PCR test for diphtheria tox gene A and B was reported in an inadequately immunized adult male with a history of AIDS. This is the first case of respiratory diphtheria reported to CDC since 2003. Respiratory diphtheria can manifest as an acute membranous pharyngitis in persons who are unimmunized or inadequately immunized.
Alternate Text: This figure is a bar graph that presents the number of reported cases of diphtheria, by year, in the United States during 1982-2012.
eHRLICHIOSIS, ANAPLASMA PHAGOCYTOPHILUM. Number of reported cases, by county — United States, 2012
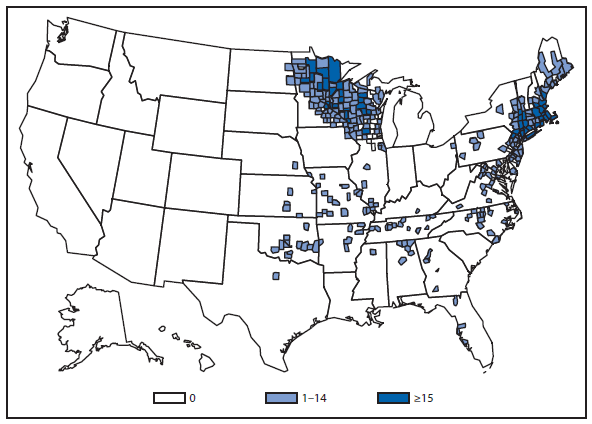
Anaplasmosis is caused by infection with Anaplasma phagocytophilum. Cases are reported primarily from the upper Midwest and coastal New England, reflecting both the range of the primary tick vector species, Ixodes scapularis — also known to transmit Lyme disease and babesiosis—and the range of preferred animal hosts for tick feeding.
Alternate Text: This figure is a map of the United States that presents the number of ehrlichiosis (anaplasma phagocytophilum) cases by county in 2012.
EHRLICHIOSIS, EHRLICHIA CHAFFEENSIS. Number of reported cases, by county — United States, 2012
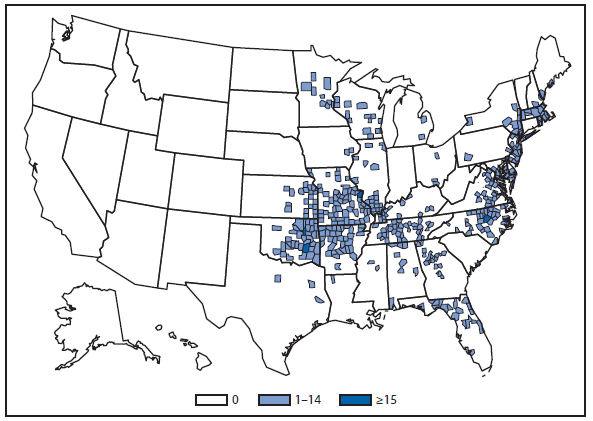
Ehrlichia chaffeensis is the most common type of ehrlichiosis infection in the United States. This tick-borne pathogen is transmitted by Amblyomma americanum, the lonestar tick. The majority of cases of E. chaffeensis are reported from the Midwest, South, and Northeast regions.
Alternate Text: This figure is a map of the United States that presents the number of Ehrlichiosis (Ehrlichia chaffeensis) cases by county in 2012.
eHRLICHIOSIS, EhRLICHIA EWINGII. Number of reported cases, by county — United States, 2012
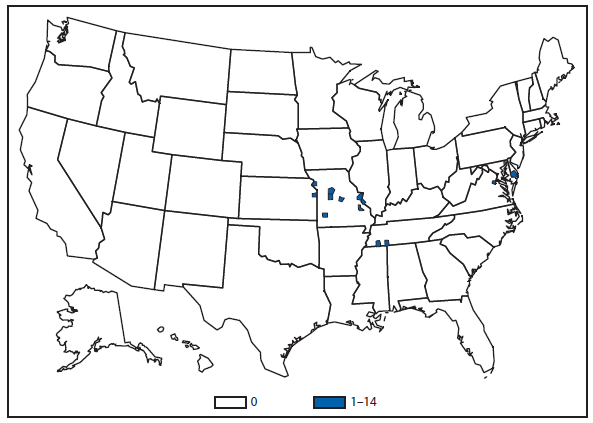
Ehrlichiosis ewingii is the least common cause of ehrlichiosis. E. ewingii is carried by Amblyomma americanum, the lonestar tick, which is the same vector that transmits E. chaffeensis. Currently, no serologic tests are used to distinguish between the two species, and differentiation can only be made by molecular genotyping.
Alternate Text: This figure is a map of the United States that presents the number of Ehrlichiosis (Ehrlichia ewingii) cases in by county in 2012.
eHRLICHIOSIS, undetermined. Number of reported cases, by county — United States, 2012
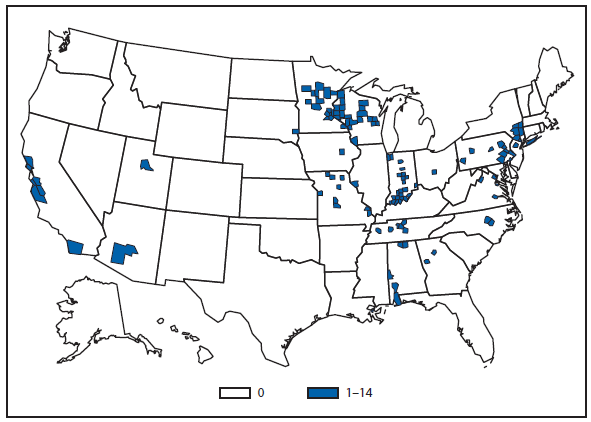
Cases of ehrlichiosis and anaplasmosis caused by an undetermined species are reported across the United States, but these cases are more likely to be reported in the Midwest region and the Middle Atlantic division. This classification is most often used in geographic areas where no clear geographic boundary separates the individual tick vectors. Because ehrlichiosis and anaplasmosis elicit some cross reactivity in antibody detection, this category also can be used when single, inappropriate diagnostic tests are performed.
Alternate Text: This figure is a map of the United States that presents the number of Ehrlichiosis (undetermined) cases by county in 2012.
GIARDIASIS. Incidence* — United States and U.S. territories, 2012
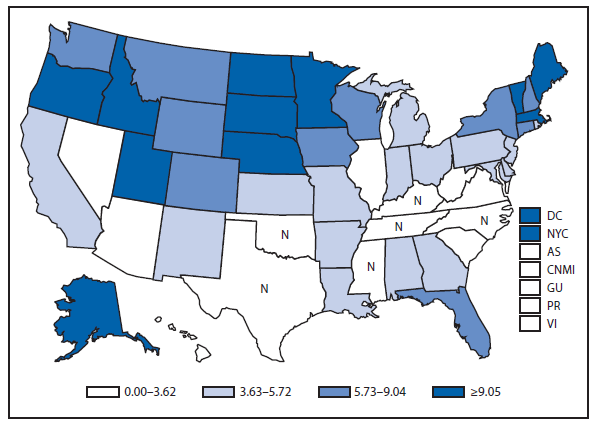
* Per 100,000 population.
Giardiasis is widespread geographically in the United States, with varying reported rates in certain states and regions. Whether these differences are of biologic significance or reflect differences in giardiasis case detection and reporting among states is unclear.
Alternate Text: This figure is a map of the United States and U.S. territories that presents the incidence range per 100,000 population of giardiasis cases in each state and territory in 2012.
Gonorrhea. Incidence,* by sex — United States, 1997–2012
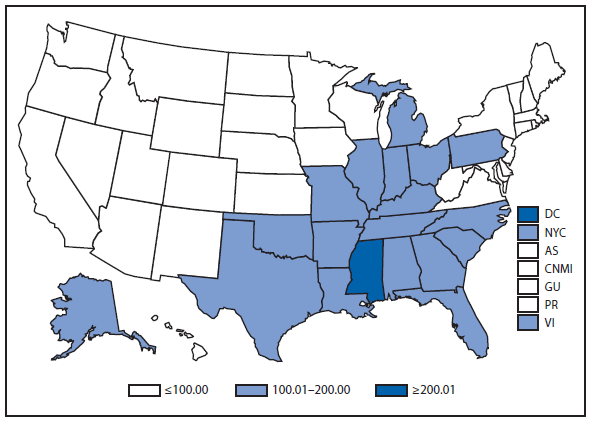
* Per 100,000 population.
For the eleventh year in a row, the gonorrhea rate among women was slightly higher than the rate among men.
Alternate Text: This figure is a map of the United States and U.S. territories that presents the incidence range per 100,000 population of gonorrhea cases in each state and territory in 2012.
Gonorrhea. Incidence* — United States and U.S. territories, 2012
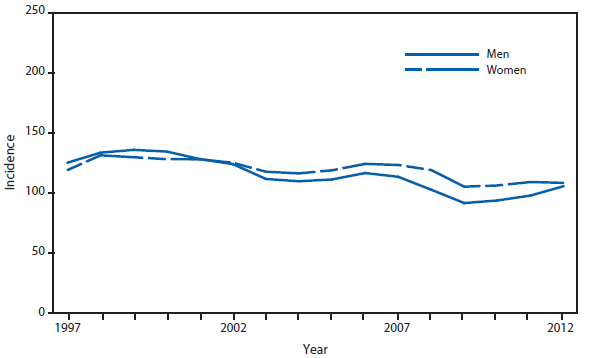
* Per 100,000 population.
In 2012, the gonorrhea rate in the U.S. and territories (Guam, Puerto Rico, and Virgin Islands) was 106.3 cases per 100,000 population, an increase from the rate in 2011.
Alternate Text: This figure is a line graph that presents the incidence per 100,000 population of gonorrhea cases in the United States, with separate lines for men and women, from 1997 to 2012.
Gonorrhea. Incidence,* by race/ethnicity — United States, 1997–2012
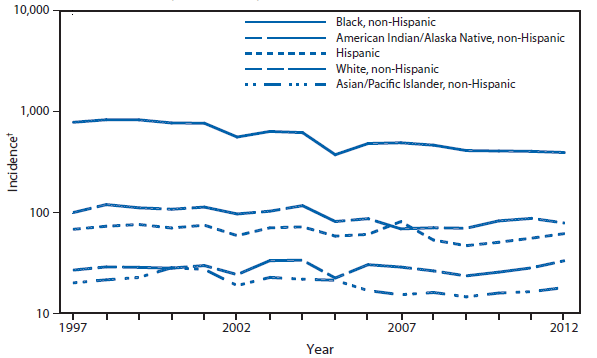
* Per 100,000 population.
† Y-axis is log scale.
Gonorrhea incidence among blacks decreased considerably during the 1990s but continues to be the highest among all races/ethnicities. In 2012, incidence among non-Hispanic blacks was approximately 14 times greater than that for non-Hispanic whites.
Alternate Text: This figure is a line graph that presents the incidence per 100,000 population of gonorrhea cases in the United States by race/ethnicity, with separate lines for black non-Hispanic, white non-Hispanic, American Indian/Alaska Native non-Hispanic, Asian/Pacific Islander non-Hispanic, and Hispanic, from 1997 to 2012.
Haemophilus influenzae, Invasive Disease. Incidence,* by serotype among children aged <5 years — United States, 1999–2012

* Per 100,000 population.
Incidence rates are for all invasive Haemophilus influenzae (serotype b (Hib), non-b, and nontypeable) among children aged <5 years. The epidemiology of invasive Haemophilus influenzae disease has changed in the United States in the post vaccine era. Since the introduction of conjugate Hib vaccines in 1987, the incidence of invasive Hib disease among children aged <5 years decreased by 99% to <1 case per 100,000 children. Nontypeable Haemophilus influenzae now causes the majority of invasive disease in all age groups. To ensure appropriate chemophrophylaxis measures for contacts of invasive Hib disease and to detect emergence of invasive non-Hib disease, serotyping of all Haemophilus influenzae isolates in children <5 years, and thorough and timely investigation of all cases of Hib disease are essential.
Alternate Text: This figure is a line graph that presents the incidence rates for all invasive Haemophilus influenzae (serotype b (Hib), non-b, and nontypeable) in the United States among persons aged <5 years, from 1999 to 2012.
Haemophilus influenzae, Invasive Disease. Incidence,* by serotype among persons aged ≥5 years — United States, 1999–2012
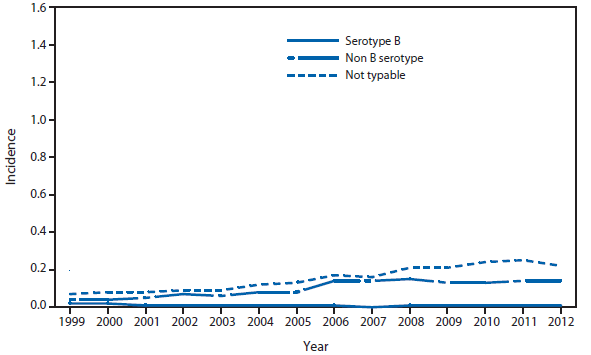
* Per 100,000 population.
Incidence rates are for all invasive Haemophilus influenzae (serotype b (Hib), non-b, and nontypeable) among persons aged ≥5 years. The epidemiology of invasive Haemophilus influenzae disease has changed in the United States in the post vaccine era. Nontypeable Haemophilus influenzae now causes the majority of invasive disease in all age groups. To ensure appropriate chemophrophylaxis measures for contacts of invasive Hib disease and to detect emergence of invasive non-Hib disease, serotyping of all Haemophilus influenzae isolates in children <5 years, and thorough and timely investigation of all cases of Hib disease are essential.
Alternate Text: This figure is a line graph that presents the incidence of invasive Haemophilus influenzae(serotype b (Hib), non-b, and nontypeable) in the United States, with separate lines for persons aged ≥5 years, from 1999 to 2012.
Hansen Disease (leprosy). Number of reported cases, by year — United States, 1992–2012
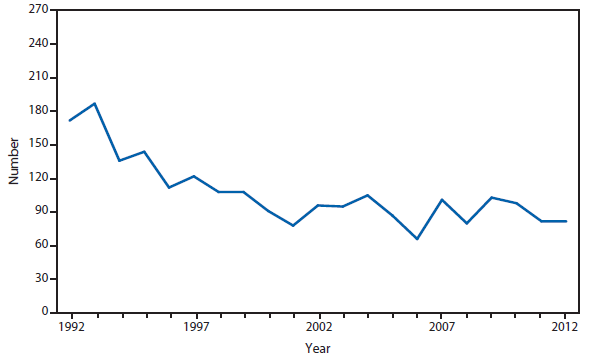
The number of Hansen disease cases reported in 2011 and 2012 remained stable.
Alternate Text: This figure is a line graph that presents the number of Hansen disease cases, also known as leprosy, in the United States from 1992 to 2012.
Hemolytic Uremic Syndrome, Postdiarrheal. Number of reported cases — United States and U.S. territories, 2012
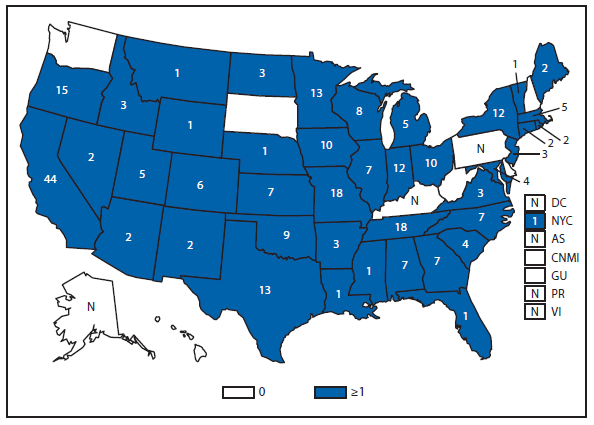
In 2012, cases continued to be reported from all regions of the country. The majority of cases of postdiarrheal hemolytic uremic syndrome (HUS) are caused by Shiga toxin-producing Escherichia coli (STEC). STEC O157:H7 is the serotype most commonly identified in patients with HUS (based on data collected in the FoodNet surveillance system).
Alternate Text: This figure is a map of the United States and U.S. territories that presents the number of hemolytic uremic, postdiarrheal cases in each state and territory in 2012.
Hepatitis, Viral. Incidence,* by year — United States, 1982–2012
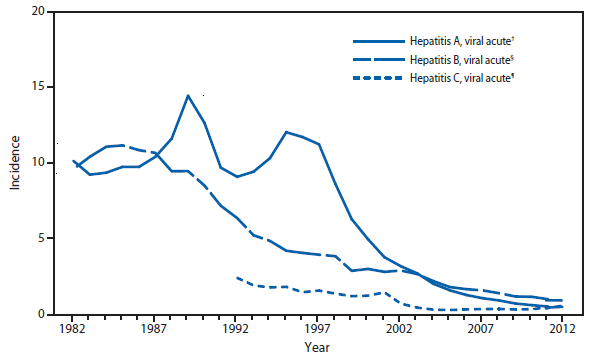
* Per 100,000 population.
† Hepatitis A vaccine was first licensed in 1995.
§ Hepatitis B vaccine was first licensed in June 1982.
¶ An anti-hepatitis C virus (HCV) antibody test first became available in May 1990.
Hepatitis A incidence remains at the lowest rate recorded since 2010. The hepatitis A vaccine became available in 1995, the last year a peak in incidence of acute, symptomatic hepatitis A was observed.
Coinciding with the implementation of the national vaccination strategy to eliminate hepatitis B infections, the incidence of acute hepatitis B has declined since 1987. Acute hepatitis B incidence has remained stable since 2008. The incidence of acute hepatitis C declined between 1992 and 2005, remained stable from 2006 to 2010, and increased in both 2011 and 2012. Some of the increase reflects increased case ascertainment by state and local health departments funded by CDC to conduct more active investigations of persons who have positive laboratory results.
Alternate Text: This figure is a line graph that presents the incidence per 100,000 population of viral hepatitis, with separate lines for hepatitis A, B, and C, in the United States from 1982 to 2011.
Hepatitis A. Incidence,* by county — United States, 2012
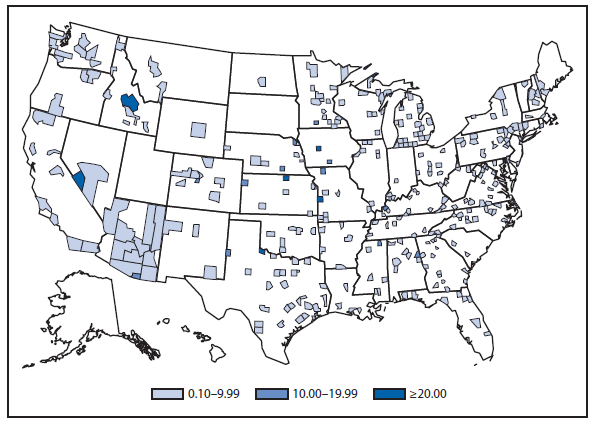
* Per 100,000 population.
Hepatitis A virus infection rates are the lowest ever reported. However, several counties shown in this map had rates of disease ≥20 cases /100,000 population in 2012. Low rates of hepatitis A are because of, at least in part, increasing vaccination rates among young persons.
Alternate Text: This figure is a map of the United States that presents the incidence range per 100,000 population of hepatitis A by county in 2012.
Hepatitis B Perinatal Infection. Number of reported cases — United States and U.S. territories, 2012
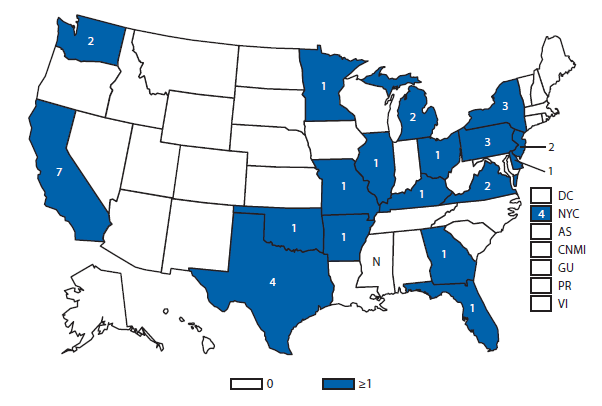
Perinatal hepatitis B, defined as hepatitis B surface antigen (HBsAg) positivity in any infant aged <24 months who was born in the United States or in a U.S. territory to an HBsAg positive mother, became nationally notifiable in 1995. Because of the asymptomatic nature of hepatitis B in young children, lack of timely testing among exposed infants, and incomplete reporting of infants with hepatitis B to public health surveillance programs, the reported cases of perinatal hepatitis B is considered low and represent only a fraction of all infants infected with hepatitis B virus at birth.
Alternate Text: This figure is a map of the United States in which the number of reported cases of Hepatitis B is provided in each state U.S. territory.
HUMAN IMMUNODEFICIENCY VIRUS DIAGNOSES. Percentage of diagnosed cases, by race/ethnicity — United States, 2012
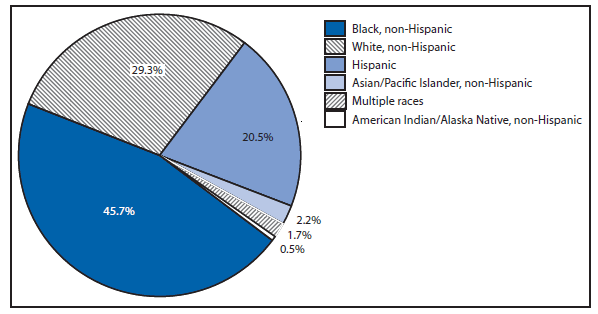
Of persons diagnosed with HIV infection in 2012, the greatest percentage was among blacks/African Americans, followed by whites, Hispanics/Latinos, Asians/Pacific Islanders, persons of multiple races, and American Indians/Alaska Natives.
Alternate Text: This figure is a pie chart that presents the percentage of diagnosed cases of HIV by race/ethnicity in the United States in 2012. The race/ethnicities included are black non-Hispanic, white non-Hispanic, Asian/Pacific Islanders non-Hispanic, American Indian/Alaska Native non-Hispanic, and Hispanic.
HUMAN IMMUNODEFICIENCY VIRUS DIAGNOSES. Diagnosis rates* — United States and U.S. territories, 2012
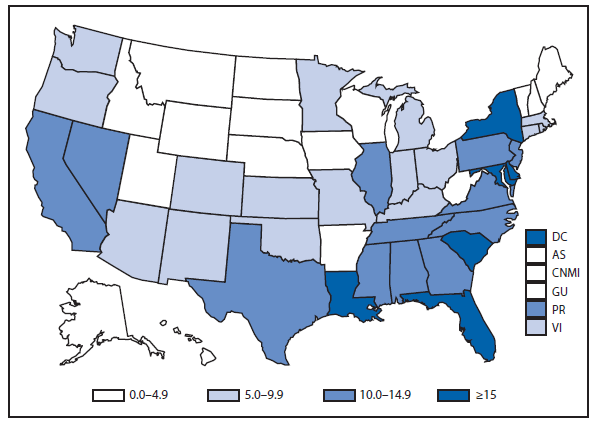
* Per 100,000 population.
The highest rates (i.e., ≥15 diagnoses per 100,000 population) of diagnoses of HIV infection were observed in certain states in the Southeast and Northeast. A rate ≥15 diagnoses per 100,000 population also was observed in the District of Columbia.
Alternate Text: This figure is a map of the United States and U.S. territories that presents the rates per 100,000 population of diagnosed HIV cases in each state and territory in 2012.
INFLUENZA-ASSOCIATED PEDIATRIC MORTALITY. Incidence* — United States and U.S. territories, 2012
* Per 100,000 population.
During 2012, a total of 24 states reported 52 influenza-associated pediatric deaths to CDC for an overall incidence rate in the United States of 0.07 deaths per 100,000 children aged <18 years. This represents a decrease in the overall rate when compared with 2011 (0.16 deaths per 100, 000 children aged <18 years) and a substantial decrease in the rate compared with 2009 (0.48 deaths per 100,000 children aged <18 years) when three peaks in influenza-associated deaths were observed: one from seasonal influenza activity, a small peak during the summer months from the initial pandemic 2009 A(H1N1) activity, followed by a much larger peak associated with pandemic activity in the fall of 2009. The state-to-state variation in rates are more likely related to the small numbers of deaths in each state rather than true differences in disease burden.
Alternate Text: This figure is a map of the United States and U.S. territories that presents the incidence range per 100,000 population of influenza-associated pediatric deaths in each state and territory in 2012.
LEGIONELLOSIS. Incidence,* by year — United States, 1997–2012
* Per 100,000 population.
The incidence of legionellosis decreased slightly from 2011 to 2012, but a general increasing trend in disease began in 2003. Factors contributing to this increase include a true increase in disease transmission, greater use of diagnostic testing, and increased reporting.
Alternate Text: This figure is a line graph that presents the incidence per 100,000 population of legionellosis cases in the United States from 1997 to 2012.
LISTERIOSIS. Incidence* — United States and U.S. territories, 2012
* Per 100,000 population.
During 2012, a total of 47 states and New York City reported 727 cases of listeriosis for an overall incidence rate in the United States of 0.23 infections per 100,000. Incidence rates were generally highest in the Northeastern and Northwestern states. Listeriosis is foodborne and occurs most frequently among older adults or persons who are pregnant or immunocompromised.
Alternate Text: This figure is a map of the United States and U.S. territories that presents the incidence range per 100,000 population of listeriosis cases in each state and territory in 2012.
LYME DISEASE. Incidence* of reported confirmed cases, by county — United States, 2012
* Per 100,000 population.
Approximately 95% of confirmed Lyme disease cases were reported from states in the Northeast, mid-Atlantic, and upper Midwest. A rash that can be confused with early Lyme disease sometimes occurs following bites of the lone star tick (Amblyomma americanum). These ticks, which do not transmit the Lyme disease bacterium, are common human-biting ticks in the southern and southeastern United States.
Alternate Text: This figure is a map of the United States that presents the incidence per 100,000 population of lyme disease cases in each county in 2012.
MALARIA. Number of reported cases — United States and U.S. territories, 2012
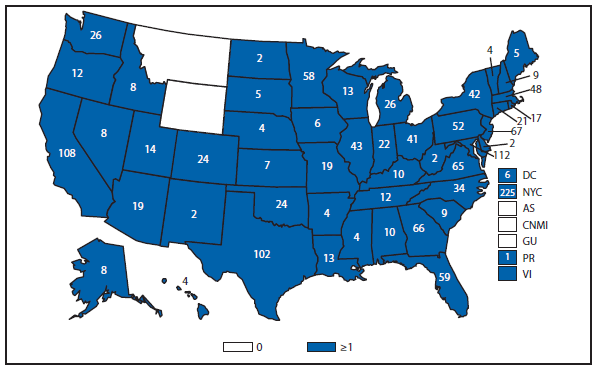
The numbers on the map represent the number of reported malaria cases with illness onset in 2012. In 2012, cases of malaria were reported from almost every state, and almost all cases reported in the United States were acquired overseas. Cases in New York City (n = 225), Maryland (n = 112), California (n = 108), Texas (n = 102), New Jersey (n = 67), Georgia (n = 66), Virginia (n = 65), and Florida (n = 59) accounted for 53% of the reported cases, from large immigrant populations and international travelers.
Alternate Text: This figure is a map of the United States and U.S. territories that presents the number of malaria cases in the United States in 2012.
MEASLES. Incidence,* by year — United States, 1977–2012
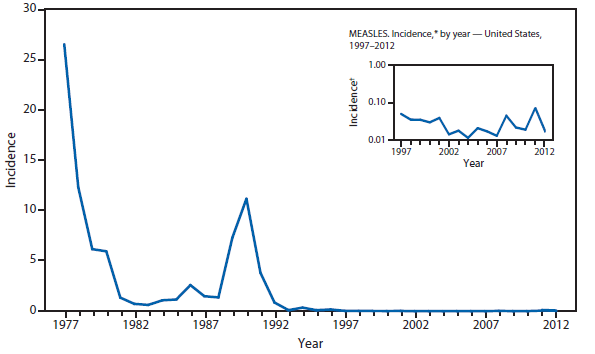
* Per 100,000 population.
† In the inset figure, the Y axis is a log scale.
Measles vaccine was licensed in 1963. Endemic measles was declared eliminated from the United States in 2000.
Alternate Text: This figure is a line graph that presents the incidence per 100,000 population of measles cases in the United States from 1977 to 2012.
MENINGOCOCCAL DISEASE. Incidence,* by year — United States, 1982–2012
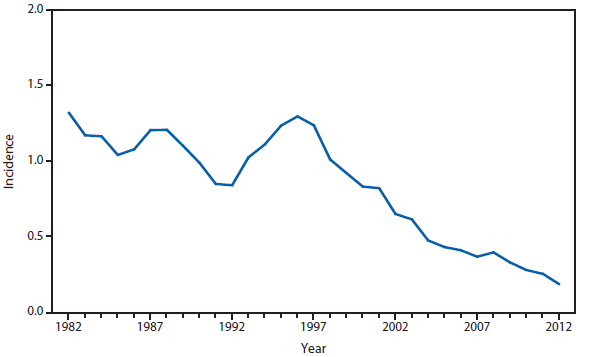
* Per 100,000 population.
Meningococcal disease incidence remained low in 2012, but it continues to cause significant morbidity and mortality in the United States. The highest incidence of meningococcal disease occurs among infants, with a second peak occurring in late adolescence. In 2005, a quadrivalent (A, C, Y, W-135) meningococcal conjugate vaccine was licensed and recommended for adolescents and others at increased risk for disease. In October 2010, a booster dose was recommended to be added for adolescents at age 16 years.
Alternate Text: This figure is a line graph that presents the incidence per 100,000 population of meningococcal disease cases in the United States from 1982 to 2012.
MUMPS. Incidence,* by year — United States, 1987–2012
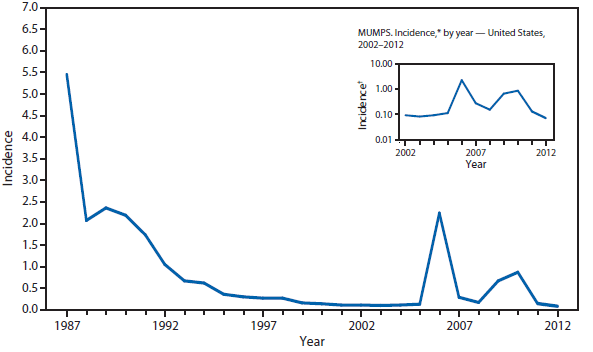
* Per 100,000 population.
† In the inset figure, the Y axis is a log scale.
The widespread use of a second dose of mumps vaccine, beginning in 1989, was followed by historically low morbidity until 2006, when the United States experienced the largest mumps outbreak in 2 decades. The 2006 outbreak of more than 6,000 cases primarily affected college students aged 18–24 years in the Midwest.
Alternate Text: This figure is a line graph that presents the incidence per 100,000 population of mumps cases in the United States from 1987 to 2012
NOVEL INFLUENZA A VIRUS INFECTIONS. Number of reported cases — United States and U.S. territories, 2012
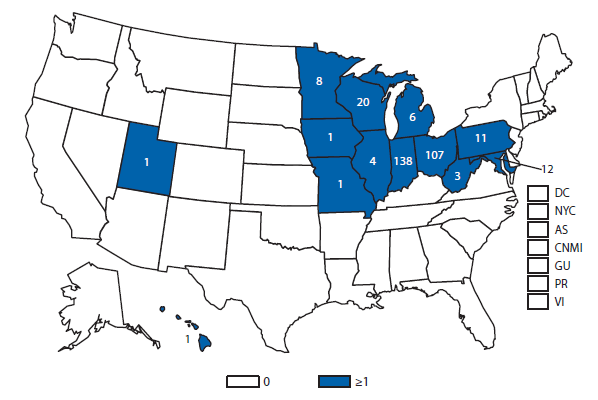
H3N2v viruses with the matrix (M) gene from the 2009 H1N1 pandemic virus were first detected in people in 2011 and were responsible for a multi-state outbreak in the summer of 2012. Most cases of H3N2v identified during 2012 were associated with exposure to pigs at agricultural fairs. Agricultural fairs take place across the United States every year, primarily during the summer months and into early fall. Many fairs have swine barns, where pigs from different places come in close contact with each other and with people. These venues might allow spread of influenza viruses both among pigs and between pigs and people. Data indicate that infected pigs might spread influenza viruses even if they show no sign of infection (e.g., coughing or sneezing). Although instances of limited person-to-person spread of this virus have been identified in the past, sustained, or community-wide transmission of H3N2v has not occurred.
Alternate Text: This figure is a U.S. map that presents the number of reported cases of novel influenza A virus in the United States and U.S. territories in 2012.
PERTUSSIS. Incidence,* by year — United States, 1982–2012
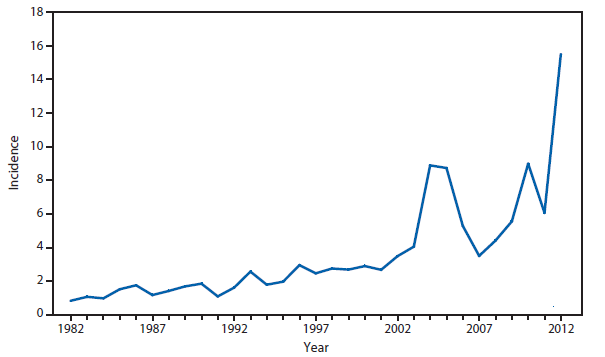
* Per 100,000 population.
Pertussis remains endemic in the United States with cyclic peaks occurring every 2–5 years. Incidence increased more than 150% during 2011–2012; cases reported in 2012 represent the largest number of reported cases in the United States since 1955.
Alternate Text: This figure is a line graph that presents the incidence per 100,000 population of pertussis cases in the United States from 1982 to 2012.
PERTUSSIS. Incidence,* by age — United States, 2012
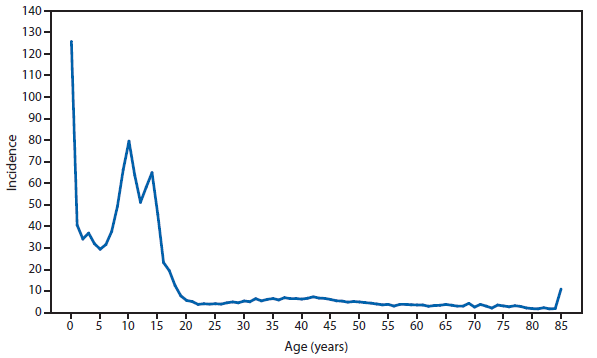
* Per 100,000 population.
Pertussis continues to have cyclic peaks every 3 to 5 years. Incidence in 2011 declined 32% following the peak in 2010.
Alternate Text: This figure is a line graph that presents the incidence of pertussis per 100,000 population in 5-year increments between ages 0 and ≥85 years.
PERTUSSIS. Number of reported cases, by age group — United States, 2012
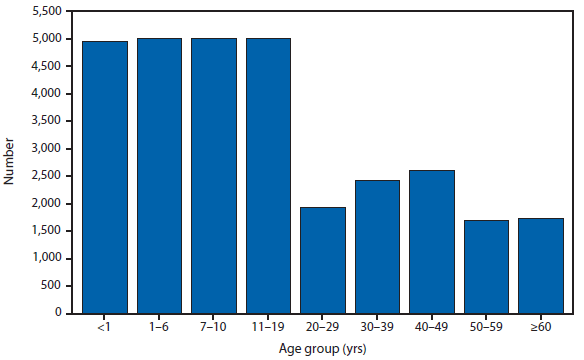
Infants, especially those who are too young to be fully vaccinated, are at greatest risk for severe disease and death from pertussis, and continue to have the greatest prevalence of reported disease. During 2012, increased rates of pertussis occurred among school-aged children and adolescents, similar to trends observed in recent years.
Alternate Text: This figure is a bar chart that presents the number of pertussis cases, broken down by age group from age <1 year to ≥60 years, in the United States and U.S. territories in 2012.
Q FEVER, ACUTE AND CHRONIC. Number of reported cases* — United States and U.S. territories, 2012
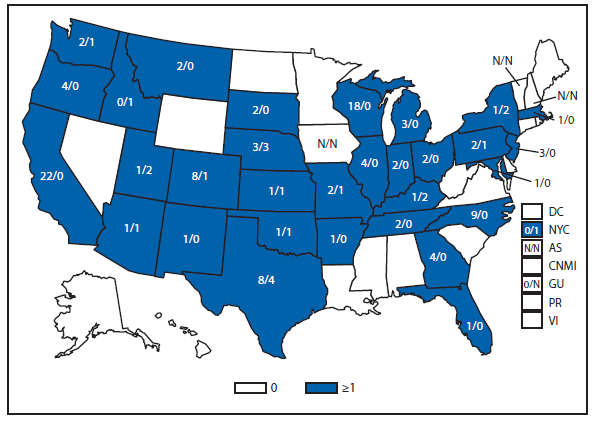
* Number of Q fever acute cases/number of Q fever chronic cases.
Q fever, caused by Coxiella burnetii, is reported throughout the United States. Human cases of Q fever most often result from contact with infected livestock, especially sheep, goats, and cattle.
Alternate Text: This figure is a map of the United States and U.S. territories that presents the number of acute and chronic Q fever cases in each state and territory in 2012.
RABIES, ANIMAL. Number* of reported cases, by county — United States, 2012
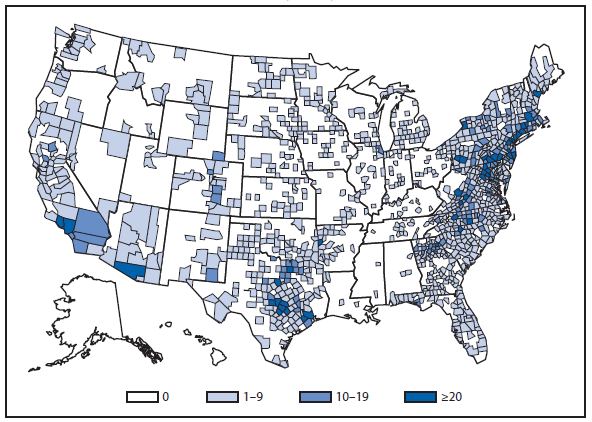
* Data from the National Center for Emerging and Zoonotic Infectious Diseases, Division of High-consequence Pathogens and Pathology.
Several rabies virus variants associated with distinct reservoir species have been identified in the United States. The circulation of rabies virus variants associated with raccoons (eastern United States), skunks (central United States and California), and foxes (Texas, Arizona, and Alaska) occur over defined geographic areas. Several distinct rabies virus variants associated with different bat species are broadly distributed across the contiguous United States. Hawaii is the only state considered free of rabies.
Alternate Text:: This figure is a map of the United States that presents the number of rabies cases, by county, among wild and domestic animals in the United States in 2012.
RUBELLA. Incidence,* by year — United States, 1982–2012
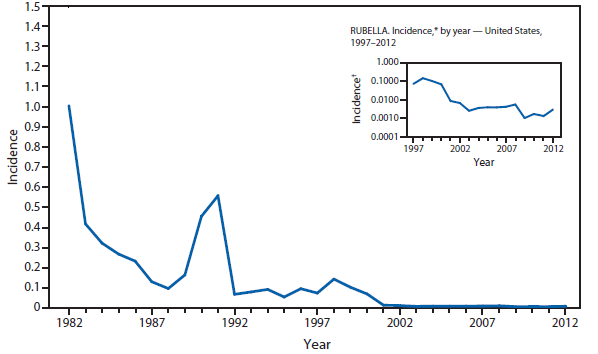
* Per 100,000 population.
† In the inset figure, the Y axis is a log scale.
Rubella vaccine was licensed in 1969. Elimination of endemic rubella virus transmission was documented in the United States in 2004.
Alternate Text: This figure is a line graph that presents the incidence per 100,000 population of rubella cases in the United States from 1982 to 2012.
SALMONELLOSIS AND SHIGELLOSIS. Incidence,* by year — United States, 1982–2012
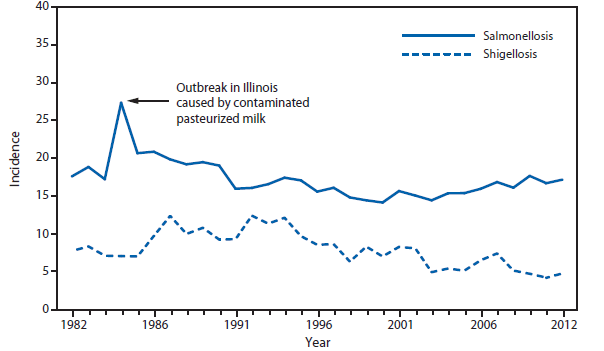
* Per 100,000 population.
The incidence of reported salmonellosis has remained relatively stable during the past 2 decades. During 2012, an increasing number of outbreaks associated with contact with animals (hedgehogs, live poultry, and small turtles) were investigated (www.cdc.gov/zoonotic/gi).
Alternate Text: This figure is a line graph that presents the number of salmonellosis and shigellosis cases in the United States from 1982 to 2012.
SHIGA TOXIN-PRODUCING ESCHERICHIA COLI (STEC). Incidence* of reported cases — United States and U.S. territories, 2012
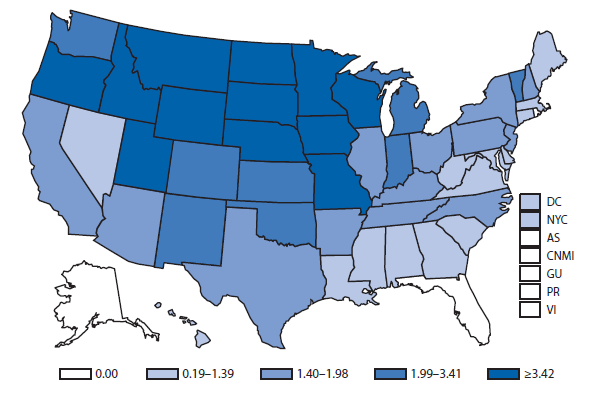
* Per 100,000 population.
The highest rates (≥3.42 infections per 100,000 population) of STEC infection were reported from states in the northern portions of the Midwest, West, and Pacific regions.
Alternate Text: This figure is a map of the United States and U.S. territories that presents the incidence of Shiga-toxin producing Escherichia coli cases in each state and territory in 2012.
SPOTTED FEVER RICKETTSIOSIS. Number of reported cases, by county — United States, 2012
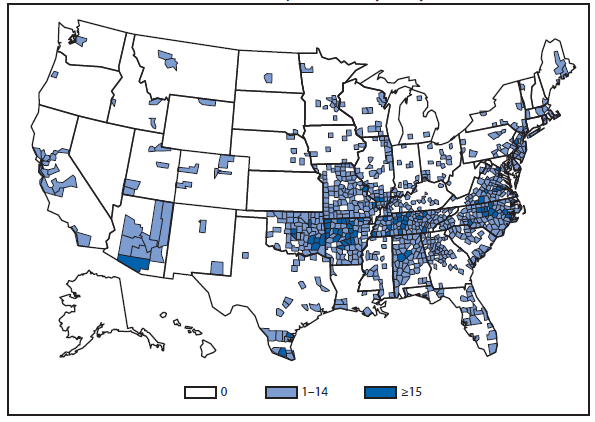
In the United States, the majority of cases of spotted fever rickettsiosis are attributed to infection with Rickettsia rickettsii, the causative agent of Rocky Mountain spotted fever (RMSF), but might also be from other agents such as Rickettsia parkeri and Rickettsia species 364D. RMSF is ubiquitous across the United States, which represents the widespread nature of the three tick vectors known to transmit RMSF: Dermacentor variabilis in the East, Dermacentor andersoni in the West, and Rhipicephalus sanguineus, recently recognized as a new tick vector in parts of Arizona. Historically, much of the incidence of RMSF has been in the Central Atlantic region and parts of the Midwest; however, endemic transmission of RMSF in Arizona communities has led to a substantial reported incidence rate.
Alternate Text: The figure is a map that presents the number of spotted fever rickettsiosis cases by county in the United States in 2012.
SYPHILIS, CONGENITAL. Incidence* among infants, by year of birth — United States, 1982–2012
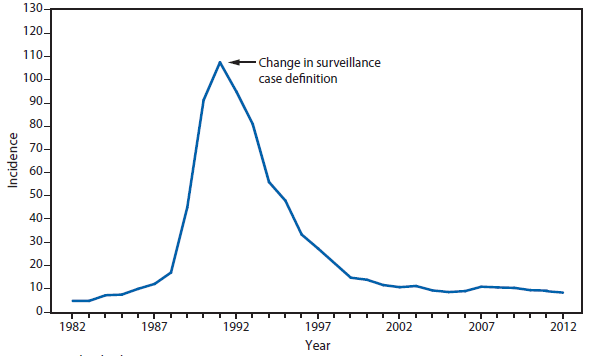
* Per 100,000 live births.
Following a decline in the incidence of congenital syphilis since 1991, overall congenital syphilis rates decreased from 2011 to 2012, from 8.7 to 7.8 cases per 100,000 live births.
Alternate Text: This figure is a line graph that presents the incidence per 100,000 live births of congenital syphilis cases among infants aged <1 year in the United States during 1982-2012.
SYPHILIS, PRIMARY AND SECONDARY. Incidence* — United States and U.S. territories, 2012
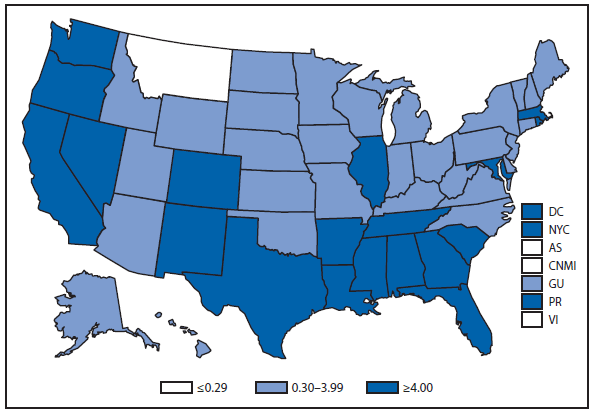
* Per 100,000 population.
In 2012, the primary and secondary syphilis rate in the United States and territories (Guam, Puerto Rico, and Virgin Islands) was 5.1 cases per 100,000 population.
Alternate Text: This figure is a map of the United States and U.S. territories that presents the incidence per 100,000 population of primary and secondary syphilis cases in each state and territory in 2012.
SYPHILIS, PRIMARY AND SECONDARY. Incidence,* by sex — United States, 1997–2012
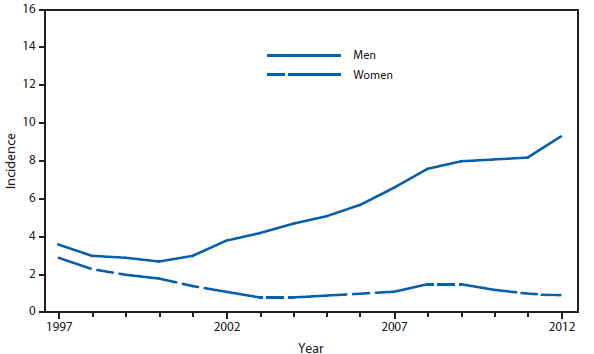
* Per 100,000 population.
During 2011–2012, the incidence of primary and secondary syphilis in the United States remained constant in women and increased in men (women: constant at 0.9; men: increased from 8.1 to 9.3) per 100,000 population.
Alternate Text: This figure is a line graph that presents the incidence per 100,000 population of primary and secondary syphilis cases among men and women in the United States from 1997 to 2012.
Syphilis, Primary and Secondary. Incidence,* by race/ethnicity — United States, 1997–2012
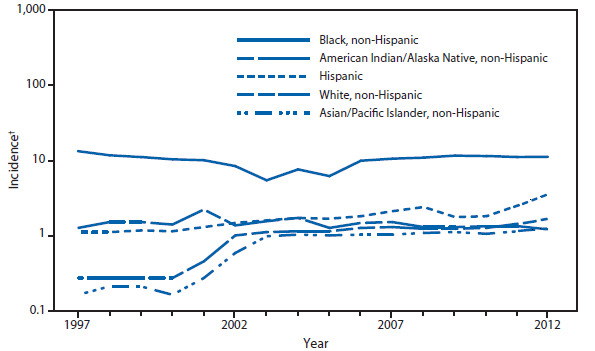
* Per 100,000 population.
† Y-axis is log scale.
During 2011–2012, incidence of primary and secondary syphilis increased among all races/ethnicities except American Indians/Alaska Natives. Incidence per 100,000 population increased from 2.3 to 2.6 among non-Hispanic whites; from 4.5 to 5.9 among Hispanics; from 15.3 to 15.8 among non-Hispanic blacks; from 1.5 to 2.0 among Asians/Pacific Islanders; and decreased from 2.7 to 2.5 among American Indians/Alaska Natives.
Alternate Text: This figure is a line graph that presents the incidence per 100,000 population of primary and secondary syphilis cases by race/ethnicity in the United States from 1997 to 2012. The race/ethnicities include black non-Hispanic, white non-Hispanic, American Indian/Alaska Native non-Hispanic, Asian/Pacific Islander non-Hispanic, and Hispanic.
Trichinellosis. Number of reported cases, by year — United States, 1982–2012
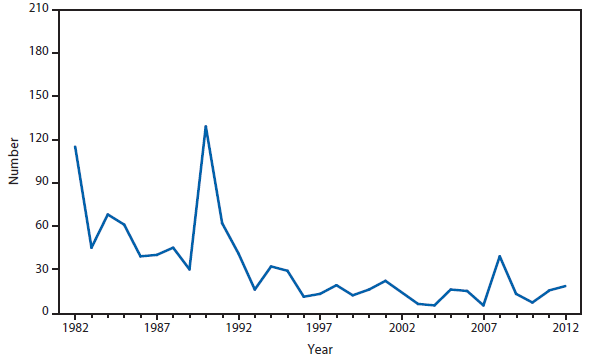
The 12 cases with a suspected or known source of infection were attributed to the consumption of pork (n = 6), bear (n = 5), and wild boar (n = 1). Trichinellosis can be prevented by thoroughly cooking meat to USDA-recommended temperatures.
Alternate Text: This figure is a line graph that presents the number of trichinellosis cases in the United States from 1982 to 2012.
Tuberculosis. Incidence* — United States and U.S. territories, 2012
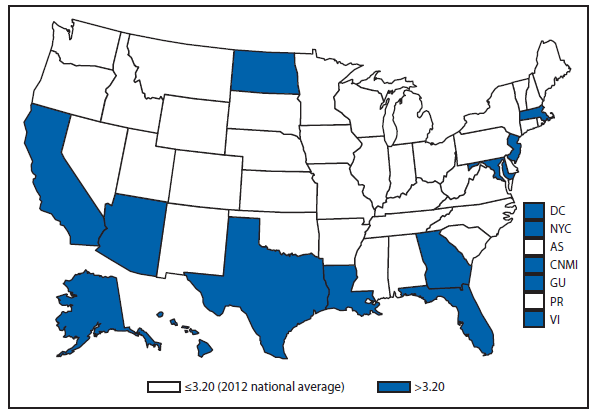
* Per 100,000 population. Data from the Division of Tuberculosis Elimination, National Center for HIV/AIDS, Viral Hepatitis, STD, and TB Prevention.
In 2012, the rate of TB in the United States decreased to 3.2 cases per 100,000.
Alternate Text: This figure is a map of the United States and U.S. territories that presents the incidence range per 100,000 population of tuberculosis cases in each state and territory in 2012.
Tuberculosis. Number of reported cases among U.S.-born and foreign-born persons,* by year — United States, 2002–2012
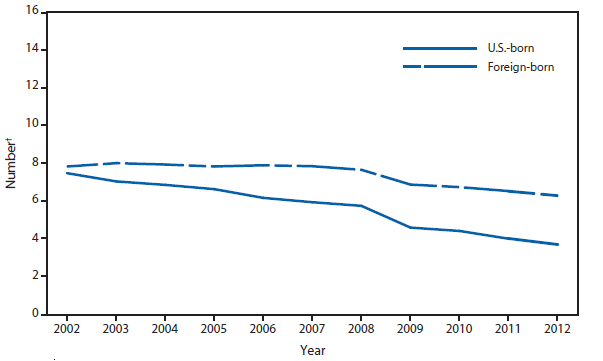
* Cases in U.S.-born tuberculosis (TB) patients continue to decline, continuing a trend begun in 1993.
† Number represented is in thousands. Data from the Division of Tuberculosis Elimination, National Center for HIV/AIDS, Viral Hepatitis, STD, and TB Prevention.
TB in both U.S.-born and foreign-born persons continues to decline, although the decline in foreign-born persons has been slower. In 2002, the proportion of U.S. TB cases that were foreign-born was 51%; this proportion rose to 63% by 2012.
Alternate Text: This figure is a line graph that presents the number of cases of tuberculosis cases, separated by U.S.-born and foreign-born persons, in the United States from 2002 to 2012.
Tuberculosis. Incidence,* by race/ethnicity† — United States, 2002–2012
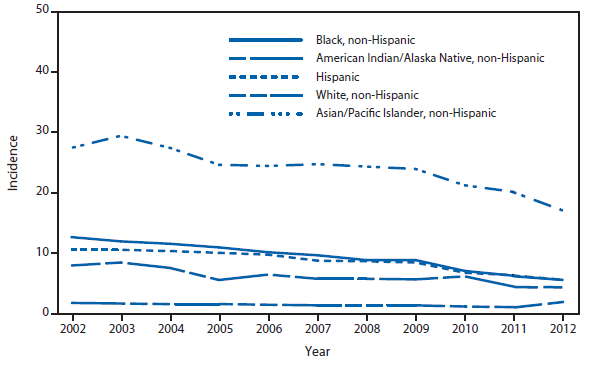
* Per 100,000 population.
† Data from the Division of Tuberculosis Elimination, National Center for HIV/AIDS, Viral Hepatitis, STD, and TB Prevention.
Non-Hispanic Asian/Pacific Islanders still have a disproportionate prevalence of TB in the United States; it is approximately 25 times higher than non-Hispanic whites.
Alternate Text: This figure is a line graph that presents the incidence per 100,000 population of tuberculosis cases by race/ethnicity in the United States from 2001 to 2011. The race/ethnicities include black non-Hispanic, white non-Hispanic, American Indian/Alaska Natives non-Hispanic, Asian/Pacific Islanders non-Hispanic, and non-Hispanic.
Tularemia. Number of reported cases — United States and U.S. territories, 2012
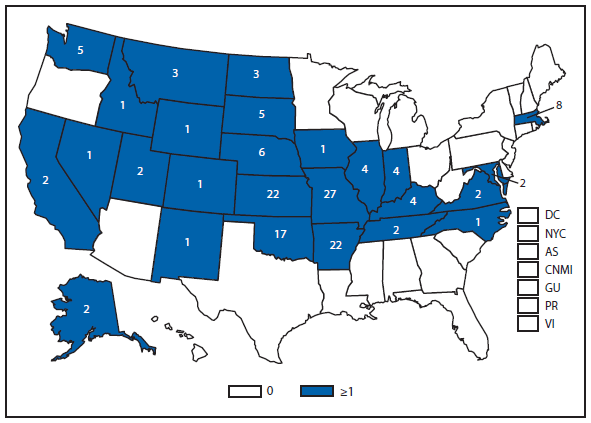
To better define the geographic distribution of Francisella tularensis subspecies, CDC requests that isolates be forwarded to the CDC laboratory in Fort Collins, Colorado.
Alternate Text: This figure is a map of the United States and U.S. territories that presents the number of tularemia cases in each state and territory in 2011.
Typhoid fever. Number of reported cases, by year — United States, 1982–2012
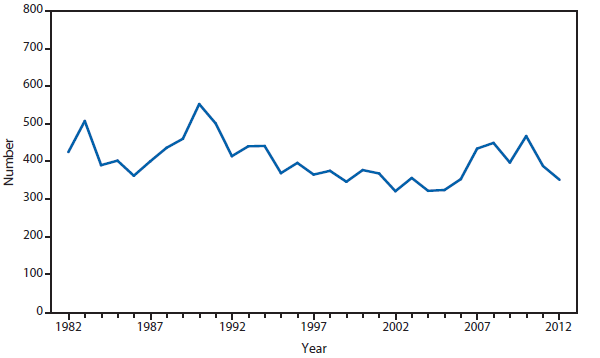
Typhoid fever in the United States remains primarily a disease of travelers to countries where typhoid fever is endemic; CDC recommends vaccination against typhoid fever for all travelers to endemic areas.
Alternate Text: This figure is a line graph that presents the number of cases of typhoid fever in the United States from 1982 to 2012.
Varicella (ChickenPox). Number of reported cases — Illinois, Michigan, Texas, and West Virginia, 1996–2012
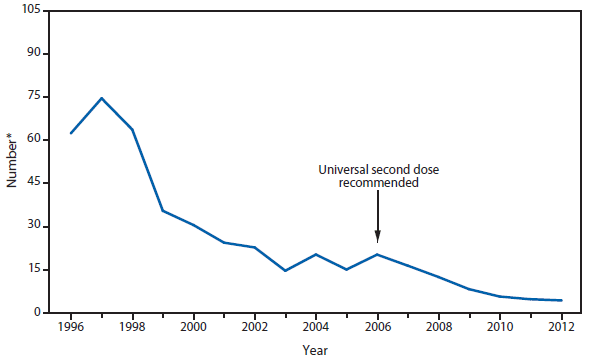
* In thousands.
Varicella was not nationally notifiable in 1996, when the first dose of the varicella vaccine was recommended in the United States. However, four states (Michigan, Illinois, Texas, and Virginia) were reporting varicella cases to CDC before the varicella vaccine was recommended and have continued reporting, providing consistent data to allow for monitoring of trends in varicella disease. In these four states, the number of cases reported in 2012 was 8% lower than 2011 and 94% less than the average number reported during the pre-vaccine years (1993–1995).
Alternate Text: This figure is a line graph that presents the number of cases of varicella, also know as chickenpox, in Illinois, Michigan, Texas, and West Virginia from 1995 to 2011.
Vibriosis. Number of reported cases — United States and U.S. territories, 2012
Consumption of raw or undercooked seafood, especially molluscan shellfish, remains a major risk factor for foodborne vibriosis (infection caused by a species from the family Vibrionaceae other than toxigenic Vibrio cholerae O1 or O139). In 2012, a multistate outbreak of Vibrio parahaemolyticus infections of a serotype previously only associated in the United States with shellfish from the Pacific Northwest was associated with consumption of shellfish harvested from Oyster Bay Harbor, New York.
Alternate Text: This figure is a map of the United States and U.S. territories that presents the number of cases of vibriosis in each state and territory in 2012.
PART 3
Historical Summaries of Notifiable Diseases in the United States, 1980–2012
Abbreviations and Symbols Used in Tables
NA Data not available.
— No reported cases.
Notes: Rates <0.01 after rounding are listed as 0.
Data in the MMWR Summary of Notifiable Diseases — United States, 2011 might differ from data in other CDC surveillance reports because of differences in the timing of reports, the source of the data, the use of different case definitions, and print criteria.
|
TABLE 7. Reported incidence* of notifiable diseases — United States, 2002–2012 |
|||||||||||
|---|---|---|---|---|---|---|---|---|---|---|---|
|
Disease |
2002 |
2003 |
2004 |
2005 |
2006 |
2007 |
2008 |
2009 |
2010 |
2011 |
2012 |
|
AIDS |
15.29 |
15.36 |
15.28 |
14.00 |
12.87 |
12.53 |
13.00 |
† |
† |
† |
† |
|
Anthrax |
0 |
— |
— |
— |
0 |
0 |
0 |
0 |
0 |
0 |
0 |
|
Arboviral diseases§ |
|||||||||||
|
California serogroup virus disease |
|||||||||||
|
neuroinvasive |
— |
— |
— |
0.02 |
0.02 |
0.02 |
0.02 |
0.02 |
0.02 |
0.04 |
0.02 |
|
nonneuroinvasive |
¶ |
¶ |
¶ |
0 |
0 |
0 |
0 |
0 |
0 |
0.01 |
0 |
|
Eastern equine encephalitis virus disease |
|||||||||||
|
neuroinvasive |
— |
— |
— |
0 |
0 |
0 |
0 |
0 |
0 |
0 |
0 |
|
nonneuroinvasive |
¶ |
¶ |
¶ |
0 |
0 |
0 |
0 |
0 |
0 |
0 |
— |
|
Powassan virus disease |
|||||||||||
|
neuroinvasive |
— |
— |
— |
0 |
0 |
0 |
0 |
0 |
0 |
0 |
0 |
|
nonneuroinvasive |
¶ |
¶ |
¶ |
0 |
0 |
0 |
0 |
0 |
0 |
0 |
0 |
|
St. Louis encephalitis virus disease |
|||||||||||
|
neuroinvasive |
— |
— |
— |
0 |
0 |
0 |
0 |
0 |
0 |
0 |
0 |
|
nonneuroinvasive |
¶ |
¶ |
¶ |
0 |
0 |
0 |
0 |
0 |
0 |
0 |
0 |
|
West Nile virus disease |
|||||||||||
|
neuroinvasive |
— |
— |
— |
0.45 |
0.5 |
0.41 |
0.23 |
0.13 |
0.2 |
0.16 |
0.92 |
|
nonneuroinvasive |
¶ |
¶ |
¶ |
0.58 |
0.94 |
0.8 |
0.22 |
0.11 |
0.13 |
0.07 |
0.90 |
|
Western equine encephalitis virus disease |
|||||||||||
|
neuroinvasive |
— |
— |
— |
— |
— |
— |
— |
— |
— |
— |
— |
|
nonneuroinvasive |
¶ |
¶ |
¶ |
— |
— |
— |
— |
— |
— |
— |
— |
|
Babesiosis** |
|||||||||||
|
confirmed |
¶ |
¶ |
¶ |
¶ |
¶ |
¶ |
¶ |
¶ |
¶ |
0.39 |
0.22 |
|
probable |
¶ |
¶ |
¶ |
¶ |
¶ |
¶ |
¶ |
¶ |
¶ |
0.12 |
0.06 |
|
Botulism, total |
0.03 |
0.01 |
0.02 |
0.01 |
0.02 |
0.05 |
0.05 |
0.04 |
0.04 |
0.01 |
0.05 |
|
foodborne |
0 |
0.01 |
0.01 |
0.01 |
0.01 |
0.01 |
0.01 |
0 |
0 |
0.01 |
0.01 |
|
infant |
1.79 |
1.87 |
2.12 |
2.09 |
2.35 |
2.05 |
2.56 |
1.92 |
1.88 |
2.34 |
3.1 |
|
other (wound and unspecified) |
— |
— |
— |
— |
— |
— |
— |
— |
— |
— |
0.01 |
|
Brucellosis |
0.04 |
0.04 |
0.04 |
0.04 |
0.04 |
0.04 |
0.03 |
0.04 |
0.04 |
0.03 |
0.04 |
|
Chancroid†† |
0.02 |
0.02 |
0 |
0.01 |
0.01 |
0.01 |
0.01 |
0.01 |
0.01 |
0 |
0 |
|
Chlamydia trachomatis infections†† |
296.55 |
304.71 |
319.61 |
332.51 |
347.8 |
370.2 |
401.34 |
409.19 |
426.01 |
457.14 |
456.69 |
|
Cholera |
0 |
0 |
0 |
0 |
0 |
0 |
0 |
0 |
0 |
0.01 |
0.01 |
|
Coccidioidomycosis |
3.03 |
2.57 |
4.14 |
6.24 |
6.79 |
14.39 |
7.76 |
13.24 |
§ |
16.49 |
12.97 |
|
Cryptosporidiosis** |
1.07 |
1.22 |
1.23 |
1.93 |
2.05 |
3.73 |
3.02 |
2.52 |
2.91 |
3 |
2.56 |
|
confirmed |
¶ |
¶ |
¶ |
¶ |
¶ |
¶ |
¶ |
2.43 |
2.73 |
1.98 |
1.68 |
|
probable |
¶ |
¶ |
¶ |
¶ |
¶ |
¶ |
¶ |
0.09 |
0.19 |
1.01 |
0.87 |
|
Cyclosporiasis |
0.06 |
0.03 |
0.14 |
0.24 |
0.06 |
0.04 |
0.05 |
0.05 |
0.07 |
0.05 |
0.04 |
|
Dengue virus infection§ |
|||||||||||
|
Dengue fever |
¶ |
¶ |
¶ |
¶ |
¶ |
¶ |
¶ |
¶ |
0.22 |
0.08 |
0.17 |
|
Dengue hemorrhagic fever |
¶ |
¶ |
¶ |
¶ |
¶ |
¶ |
¶ |
¶ |
0 |
0 |
0 |
|
Diphtheria |
0 |
0 |
— |
— |
— |
— |
— |
— |
— |
— |
— |
|
Ehrlichiosis |
|||||||||||
|
human granulocytic (HGE) |
0.18 |
0.13 |
0.2 |
0.28 |
0.23 |
0.31 |
§§ |
§§ |
§§ |
§§ |
§§ |
|
human monocytic (HME) |
0.08 |
0.11 |
0.12 |
0.18 |
0.2 |
0.3 |
§§ |
§§ |
§§ |
§§ |
§§ |
|
human (other & unspecified)¶¶ |
— |
— |
— |
0.04 |
0.08 |
0.12 |
§§ |
§§ |
§§ |
§§ |
§§ |
|
Ehrlichiosis/Anaplasmosis |
|||||||||||
|
Ehrlichia chaffeensis |
¶ |
¶ |
¶ |
¶ |
¶ |
¶ |
0.35 |
0.34 |
0.26 |
0.29 |
0.38 |
|
Ehrlichia ewingii |
¶ |
¶ |
¶ |
¶ |
¶ |
¶ |
0 |
0 |
0 |
0 |
0.01 |
|
Anaplasma phagocytophilum |
¶ |
¶ |
¶ |
¶ |
¶ |
¶ |
0.43 |
0.42 |
0.61 |
0.88 |
0.81 |
|
Undetermined |
¶ |
¶ |
¶ |
¶ |
¶ |
¶ |
0.06 |
0.06 |
0.04 |
0.05 |
0.06 |
|
Encephalitis/meningitis, arboviral*** |
|||||||||||
|
California serogroup virus |
0.06 |
0.06 |
0 |
*** |
*** |
*** |
*** |
*** |
*** |
*** |
*** |
|
Eastern equine virus |
0 |
0 |
0 |
*** |
*** |
*** |
*** |
*** |
*** |
*** |
*** |
|
Powassan virus |
0 |
0 |
0 |
*** |
*** |
*** |
*** |
*** |
*** |
*** |
*** |
|
St. Louis virus |
0.01 |
0.01 |
0 |
*** |
*** |
*** |
*** |
*** |
*** |
*** |
*** |
|
West Nile virus |
1.01 |
1 |
0.43 |
*** |
*** |
*** |
*** |
*** |
*** |
*** |
*** |
|
Western equine virus |
0 |
0 |
0 |
*** |
*** |
*** |
*** |
*** |
*** |
*** |
*** |
|
Enterohemorrhagic Escherichia coli |
|||||||||||
|
O157:H7 |
1.36 |
0.93 |
0.87 |
0.89 |
¶ |
¶ |
¶ |
§§ |
§§ |
§§ |
§§ |
|
non—O157 |
0.08 |
0.09 |
0.13 |
0.19 |
¶ |
¶ |
¶ |
§§ |
§§ |
§§ |
§§ |
|
not serogrouped |
0.02 |
0.05 |
0.13 |
0.16 |
¶ |
¶ |
¶ |
§§ |
§§ |
§§ |
§§ |
|
Giardiasis |
8.06 |
6.84 |
8.35 |
7.82 |
7.28 |
7.66 |
7.41 |
7.37 |
7.64 |
6.42 |
5.87 |
|
Gonorrhea†† |
125.03 |
116.37 |
113.52 |
115.64 |
120.9 |
118.9 |
111.64 |
99.05 |
100.76 |
104.14 |
107.46 |
|
TABLE 7. (Continued) Reported incidence* of notifiable diseases —United States, 2002—2012 |
|||||||||||
|---|---|---|---|---|---|---|---|---|---|---|---|
|
Disease |
2002 |
2003 |
2004 |
2005 |
2006 |
2007 |
2008 |
2009 |
2010 |
2011 |
2012 |
|
Haemophilus influenzae, invasive disease |
|||||||||||
|
all ages, serotypes |
0.62 |
0.70 |
0.72 |
0.78 |
0.82 |
0.85 |
0.96 |
0.99 |
1.03 |
1.15 |
1.10 |
|
age<5 yrs |
|||||||||||
|
serotype b |
0.18 |
0.16 |
0.03 |
0.04 |
0.14 |
0.11 |
0.14 |
0.18 |
0.11 |
0.06 |
0.15 |
|
nonserotype b |
0.75 |
0.59 |
0.04 |
0.67 |
0.86 |
0.97 |
1.18 |
1.17 |
0.94 |
0.57 |
1.02 |
|
unknown serotype |
0.80 |
1.15 |
0.97 |
1.08 |
0.88 |
0.88 |
0.79 |
0.79 |
1.05 |
0.89 |
1.04 |
|
Hansen disease (leprosy) |
0.04 |
0.03 |
0.04 |
0.03 |
0.03 |
0.04 |
0.03 |
0.04 |
0.04 |
0.03 |
0.03 |
|
Hantavirus pulmonary syndrome |
0.01 |
0.01 |
0.01 |
0.01 |
0.01 |
0.01 |
0.01 |
0.01 |
0.01 |
0.01 |
0.01 |
|
Hemolytic uremic syndrome, postdiarrheal |
0.08 |
0.06 |
0.07 |
0.08 |
0.11 |
0.10 |
0.12 |
0.09 |
0.09 |
0.10 |
0.09 |
|
Hepatitis, viral, acute*** |
|||||||||||
|
A |
3.13 |
2.66 |
1.95 |
1.53 |
1.21 |
1.00 |
0.86 |
0.65 |
0.54 |
0.45 |
0.50 |
|
B |
2.84 |
2.61 |
2.14 |
1.78 |
1.62 |
1.51 |
1.34 |
1.12 |
1.10 |
0.94 |
0.93 |
|
C |
0.65 |
0.38 |
0.31 |
0.23 |
0.26 |
0.28 |
0.29 |
0.27 |
0.29 |
0.42 |
0.59 |
|
Hepatitis B perinatal infection |
— |
— |
— |
— |
— |
— |
— |
— |
— |
— |
0.01 |
|
Human immunodeficiency virus (HIV) diagnoses† |
— |
— |
— |
— |
— |
— |
— |
12.13 |
11.64 |
11.32 |
11.26 |
|
Influenza-associated pediatric mortality††† |
¶ |
¶ |
¶ |
0.02 |
0.07 |
0.10 |
0.12 |
0.48 |
0.08 |
0.17 |
0.07 |
|
Invasive pneumococcal disease§§§ |
|||||||||||
|
all ages |
§§§ |
§§§ |
§§§ |
§§§ |
§§§ |
§§§ |
§§§ |
§§§ |
8.83 |
8.52 |
7.72 |
|
age <5 years |
§§§ |
§§§ |
§§§ |
§§§ |
§§§ |
§§§ |
§§§ |
§§§ |
14.15 |
7.64 |
8.35 |
|
Legionellosis |
0.47 |
0.78 |
0.71 |
0.78 |
0.96 |
0.91 |
1.05 |
1.16 |
1.09 |
1.36 |
1.19 |
|
Listeriosis |
0.24 |
0.24 |
0.32 |
0.31 |
0.30 |
0.27 |
0.25 |
0.28 |
0.27 |
0.28 |
0.23 |
|
Lyme disease, total¶¶¶ |
8.44 |
7.39 |
6.84 |
7.94 |
6.75 |
9.21 |
11.67 |
12.71 |
9.86 |
10.78 |
9.96 |
|
confirmed |
¶¶¶ |
¶¶¶ |
¶¶¶ |
¶¶¶ |
¶¶¶ |
¶¶¶ |
9.59 |
9.85 |
7.38 |
7.92 |
7.10 |
|
probable |
¶¶¶ |
¶¶¶ |
¶¶¶ |
¶¶¶ |
¶¶¶ |
¶¶¶ |
2.08 |
2.8 |
2.49 |
2.84 |
2.84 |
|
Malaria |
0.51 |
0.49 |
0.51 |
0.51 |
0.50 |
0.47 |
0.42 |
0.48 |
0.58 |
0.56 |
0.48 |
|
Measles |
0.02 |
0.02 |
0.01 |
0.02 |
0.02 |
0.01 |
0.05 |
0.02 |
0.02 |
0.06 |
0.02 |
|
indigenous |
— |
— |
— |
— |
— |
— |
— |
— |
— |
— |
0.01 |
|
imported |
— |
— |
— |
— |
— |
— |
— |
— |
— |
— |
0.01 |
|
Meningococcal disease, invasive**** |
|||||||||||
|
all serogroups |
0.64 |
0.61 |
0.47 |
0.42 |
0.40 |
0.36 |
0.39 |
0.32 |
0.27 |
0.25 |
0.18 |
|
serogroup A,C,Y, & W-135 |
¶ |
¶ |
¶ |
0.10 |
0.11 |
0.11 |
0.11 |
0.10 |
0.09 |
0.08 |
0.05 |
|
serogroup B |
¶ |
¶ |
¶ |
0.05 |
0.07 |
0.06 |
0.06 |
0.06 |
0.04 |
0.05 |
0.04 |
|
other serogroup |
¶ |
¶ |
¶ |
0.01 |
0.01 |
0.01 |
0.01 |
0.01 |
0 |
0.01 |
0.01 |
|
serogroup unknown |
¶ |
¶ |
¶ |
0.26 |
0.22 |
0.18 |
0.20 |
0.16 |
0.13 |
0.10 |
0.08 |
|
Mumps |
0.10 |
0.08 |
0.09 |
0.11 |
2.22 |
0.27 |
0.15 |
0.65 |
0.85 |
0.13 |
0.07 |
|
Novel influenza A virus infections |
¶ |
¶ |
¶ |
¶ |
¶ |
0 |
0 |
14.37 |
0 |
0 |
0.10 |
|
Pertussis |
3.47 |
4.04 |
8.88 |
8.72 |
5.27 |
3.49 |
4.40 |
5.54 |
8.97 |
6.06 |
15.49 |
|
Plague |
0 |
0 |
0 |
0 |
0.01 |
0 |
0 |
0 |
0 |
0 |
0 |
|
Poliomyelitis, paralytic |
0 |
0 |
0 |
0 |
0 |
— |
— |
0 |
— |
— |
— |
|
Poliovirus infection, nonparalytic |
¶ |
¶ |
¶ |
¶ |
¶ |
— |
— |
— |
— |
— |
— |
|
Psittacosis |
0.01 |
0 |
0 |
0.01 |
0.01 |
0 |
0 |
0 |
0 |
0 |
0 |
|
Q Fever,†††† |
0.02 |
0.02 |
0.03 |
0.05 |
0.06 |
0.06 |
0.04 |
0.04 |
0.04 |
0.04 |
0.04 |
|
acute |
¶ |
¶ |
¶ |
¶ |
¶ |
¶ |
0.04 |
0.03 |
0.04 |
0.04 |
0.04 |
|
chronic |
¶ |
¶ |
¶ |
¶ |
¶ |
¶ |
0 |
0.01 |
0.01 |
0.01 |
0.01 |
|
Rabies |
|||||||||||
|
animal |
0 |
0 |
0 |
0 |
0 |
0 |
0 |
0 |
0 |
0 |
1.48 |
|
human |
0 |
0 |
0 |
0 |
0 |
0 |
0 |
0 |
0 |
0 |
0 |
|
Rubella |
0.01 |
0 |
0 |
0 |
0 |
0 |
0.01 |
0 |
0 |
0 |
0 |
|
Rubella, congenital syndrome |
0 |
0 |
0 |
0 |
0 |
0 |
— |
— |
0 |
— |
0 |
|
Salmonellosis |
15.73 |
15.16 |
14.47 |
15.43 |
15.45 |
16.03 |
16.92 |
16.18 |
17.73 |
16.79 |
17.27 |
|
SARS-CoV§§§§ |
¶ |
0 |
— |
— |
— |
— |
— |
— |
— |
— |
— |
|
Shiga toxin-producing E. coli (STEC) |
¶ |
¶ |
¶ |
¶ |
1.71 |
1.62 |
1.76 |
1.53 |
1.78 |
1.96 |
2.08 |
|
Shigellosis |
8.37 |
8.19 |
4.99 |
5.51 |
5.23 |
6.60 |
7.50 |
5.24 |
4.82 |
4.32 |
4.90 |
|
Spotted Fever Rickettsiosis, total¶¶¶¶ |
0.39 |
0.38 |
0.60 |
0.66 |
0.80 |
0.77 |
0.85 |
0.60 |
0.65 |
0.91 |
1.44 |
|
confirmed |
¶¶¶¶ |
¶¶¶¶ |
¶¶¶¶ |
¶¶¶¶ |
¶¶¶¶ |
¶¶¶¶ |
0.06 |
0.05 |
0.05 |
0.08 |
0.06 |
|
probable |
¶¶¶¶ |
¶¶¶¶ |
¶¶¶¶ |
¶¶¶¶ |
¶¶¶¶ |
¶¶¶¶ |
0.78 |
0.55 |
0.59 |
0.83 |
1.38 |
|
Smallpox |
¶ |
¶ |
— |
— |
— |
— |
— |
— |
— |
— |
— |
|
Streptococcal disease, invasive, group A |
1.69 |
2.04 |
1.82 |
2.00 |
2.24 |
1.89 |
2.30 |
2.13 |
¶ |
¶ |
¶ |
|
Streptococcal, toxic shock syndrome |
0.05 |
0.06 |
0.06 |
0.07 |
0.06 |
0.06 |
0.07 |
0.08 |
0.07 |
0.09 |
0.10 |
|
Streptococcus pneumoniae invasive disease(IPD)***** |
|||||||||||
|
all ages |
***** |
***** |
***** |
***** |
***** |
***** |
***** |
***** |
8.83 |
8.52 |
— |
|
age <5 yrs |
***** |
***** |
***** |
***** |
***** |
***** |
***** |
***** |
14.15 |
7.64 |
— |
|
TABLE 7. (Continued) Reported incidence* of notifiable diseases —United States, 2002—2012 |
|||||||||||
|---|---|---|---|---|---|---|---|---|---|---|---|
|
Disease |
2002 |
2003 |
2004 |
2005 |
2006 |
2007 |
2008 |
2009 |
2010 |
2011 |
2012 |
|
Streptococcus pneumoniae, invasive disease |
|||||||||||
|
drug resistant, all ages |
1.14 |
0.99 |
1.49 |
1.42 |
2.19 |
1.49 |
1.60 |
1.75 |
**** |
**** |
**** |
|
age <5 yrs |
— |
— |
— |
— |
— |
3.73 |
3.51 |
4.54 |
**** |
**** |
**** |
|
non-drug resistant, age <5 yrs |
3.62 |
8.86 |
8.22 |
8.21 |
11.93 |
13.59 |
13.36 |
12.93 |
**** |
**** |
**** |
|
Syphilis, total, all stages†† |
11.68 |
11.90 |
11.94 |
11.33 |
12.46 |
13.67 |
15.34 |
14.74 |
14.93 |
14.90 |
16.02 |
|
congenital (age <1 yr) |
11.44 |
10.56 |
9.12 |
8.24 |
9.07 |
10.46 |
10.12 |
9.90 |
8.85 |
8.68 |
8.12 |
|
primary and secondary |
2.44 |
2.49 |
2.71 |
2.97 |
3.29 |
3.83 |
4.48 |
4.60 |
4.49 |
4.52 |
5.03 |
|
Tetanus |
0.01 |
0.01 |
0.01 |
0.01 |
0.01 |
0.01 |
0.01 |
0.01 |
0.01 |
0.01 |
0.01 |
|
Toxic-shock syndrome |
0.05 |
0.05 |
0.04 |
0.04 |
0.05 |
0.04 |
0.03 |
0.03 |
0.04 |
0.03 |
0.03 |
|
Trichinellosis |
0.01 |
0 |
0 |
0.01 |
0.01 |
0 |
0.01 |
0 |
0 |
0.01 |
0.01 |
|
Tuberculosis††††† |
5.36 |
5.17 |
5.09 |
4.80 |
4.65 |
4.44 |
4.28 |
3.80 |
3.64 |
3.41 |
3.19 |
|
Tularemia |
0.03 |
0.04 |
0.05 |
0.05 |
0.03 |
0.05 |
0.04 |
0.03 |
0.04 |
0.05 |
0.05 |
|
Tyhoid fever |
0.11 |
0.12 |
0.11 |
0.11 |
0.12 |
0.14 |
0.15 |
0.13 |
0.15 |
0.13 |
0.11 |
|
Vancomycin-intermediate Staphylococcus aureus |
¶ |
¶ |
— |
0 |
0 |
0.02 |
0.03 |
0.03 |
0.04 |
0.04 |
0.06 |
|
Vancomycin—resistant Staphylococcus aureus |
¶ |
¶ |
0 |
0 |
0 |
0 |
0 |
0 |
0 |
— |
— |
|
Varicella (chickenpox morbidity)§§§§§ |
10.27 |
7.27 |
18.41 |
19.64 |
28.65 |
18.68 |
13.56 |
8.71 |
6.46 |
5.79 |
5.33 |
|
Varicella (chickenpox mortality) |
— |
— |
— |
— |
— |
— |
— |
— |
— |
— |
0 |
|
Vibriosis |
¶ |
¶ |
¶ |
¶ |
¶ |
0.25 |
0.24 |
0.30 |
0.30 |
0.29 |
0.39 |
|
Viral hemorrhagic fevers |
¶ |
¶ |
¶ |
¶ |
¶ |
¶ |
¶ |
¶ |
0 |
0 |
0 |
|
Yellow fever¶¶¶¶¶ |
0 |
— |
— |
— |
— |
— |
— |
— |
— |
— |
— |
|
* Per 100,000 population. † In 2008, CDC published a revised HIV case definition. This combined separate surveillance case definitions for HIV infection and AIDS into a single case definition for HIV infection that includes AIDS (and incorporates the HIV infection classification system). The revised HIV case definition provides a more complete presentation of the HIV epidemic on a population level. Please see the Centers for Disease Control and Prevention revised surveillance case definitions for HIV infection among adults, adolescents, and children aged <18 months and for HIV infection and AIDS among children aged 18 months to <13 years—United States, 2008. MMWR 2008;57(No.RR-10):1–12. These case counts can be found under "HIV Diagnoses" in this table. The total number of HIV diagnoses includes all cases reported to the Division of HIV/AIDS Prevention, National Center for HIV/AIDS, Viral Hepatitis, STD, and TB Prevention (NCHHSTP), through December 31, 2012. AIDS: Acquired Immunodeficiency Syndrome. HIV: Human Immunodeficiency Virus. § Totals reported to the Division of Vector-Borne Diseases (DVBD), National Center for Emerging and Zoonotic Infectious Diseases (NCZVED) (ArboNET Surveillance), as of June 1, 2013. ¶ Not nationally notifiable. ** Revision of National Surveillance Case Definition distinguishing between confirmed and probable cases. †† Total reported to the Division of STD Prevention, NCHHSTP, as of May 3, 2013. §§ Data for ehrlichiosis attributable to other or unspecified agents were being withheld from publication pending the outcome of discussions concerning the reclassification of certain Ehrlichia species, which will probably affect how data in this category were reported. As of January 1, 2008, these categories were replaced with codes for Anaplasma phagocytophilum. Refer to Ehrlichiosis/Anaplasmosis. ¶¶ See also "Arboviral Diseases" incidence rates. In 2005, the arboviral disease surveillance case definitions and categories were revised. The nationally notifiable arboviral encephalitis and meningitis conditions continued to be nationally notifiable in 2005 and 2006, but under the category of arboviral neuroinvasive disease. In addition, in 2005, nonneuroinvasive domestic arboviral diseases for the six domestic arboviruses listed above were added to the list of nationally notifiable diseases. *** Data on hepatitis B chronic, and hepatitis C, virus infection (past or present) are not included because they are undergoing data quality review. ††† Totals reported to the Division of Influenza, National Center for Immunization and Respiratory Diseases (NCIRD), as of December 31, 2012. §§§ The previous categories of invasive pneumococcal disease among children aged <5 years and invasive, drug-resistant Streptococcus pneumoniae were eliminated. All cases of invasive Streptococcus pneumoniae disease, regardless of age or drug resistance are reported under a single disease code. ¶¶¶ The National surveillance case definition was revised in 2008; probable cases not previously reported. **** To help public health specialists monitor the impact of the new meningococcal conjugate vaccine (Menactra(r), licensed in the United States in January 2005), the data display for meningococcal disease was modified to differentiate the fraction of the disease that is vaccine preventable (serogroups A,C,Y, W-135) from the non-preventable fraction of disease (serogroup B and others). †††† In 2008, Q fever acute and chronic reporting categories were recognized as a result of revision to the Q fever case definition. Before that time, case counts were not differentiated relative to acute and chronic Q fever cases. §§§§ Severe acute respiratory syndrome–associated coronavirus disease. ¶¶¶¶ Revision of the National Surveillance Case Definition distinguishing between confirmed and probable cases; total case count includes two case reports with unknown case status. ***** The previous categories of invasive pneumococcal disease among children aged <5 years and invasive, drug-resistant Streptococcus pneumoniae were eliminated. ††††† Totals reported to the Division of Tuberculosis Elimination, NCHHSTP, as of June 15, 2013. §§§§§ Varicella became nationally notifiable in 2003. ¶¶¶¶¶ The last indigenous case of yellow fever was reported in 1911; all other case reports since 1911 have been imported. |
|||||||||||
|
TABLE 8. Reported cases of notifiable diseases — United States, 2005–2012 |
||||||||
|---|---|---|---|---|---|---|---|---|
|
Disease |
2005 |
2006 |
2007 |
2008 |
2009 |
2010 |
2011 |
2012 |
|
AIDS* |
41,120 |
38,423 |
37,503 |
39,202 |
† |
† |
† |
† |
|
Anthrax |
— |
1 |
1 |
— |
1 |
— |
1 |
— |
|
Arboviral diseases§ |
|
|
|
|
|
|
|
|
|
California serogroup virus disease |
|
|
|
|
|
|
|
|
|
neuroinvasive |
73 |
64 |
50 |
55 |
46 |
68 |
120 |
73 |
|
nonneuroinvasive |
7 |
5 |
5 |
7 |
9 |
7 |
17 |
8 |
|
Eastern equine encephalitis virus disease |
|
|
|
|
|
|
|
|
|
neuroinvasive |
21 |
8 |
3 |
4 |
3 |
10 |
4 |
15 |
|
nonneuroinvasive |
— |
— |
1 |
— |
1 |
— |
— |
— |
|
Powassan virus disease |
|
|
|
|
|
|
|
|
|
neuroinvasive |
1 |
1 |
7 |
2 |
6 |
8 |
12 |
7 |
|
nonneuroinvasive |
— |
— |
— |
— |
— |
— |
4 |
— |
|
St. Louis encephalitis virus disease |
|
|
|
|
|
|
|
|
|
neuroinvasive |
7 |
7 |
8 |
8 |
11 |
8 |
4 |
1 |
|
nonneuroinvasive |
6 |
3 |
1 |
5 |
1 |
2 |
2 |
2 |
|
Western equine encephalitis virus disease |
|
|
|
|
|
|
|
|
|
neuroinvasive |
— |
— |
— |
— |
— |
— |
— |
— |
|
nonneuroinvasive |
— |
— |
— |
— |
— |
— |
— |
— |
|
West Nile virus disease |
|
|
|
|
|
|
|
|
|
neuroinvasive |
1,309 |
1,495 |
1,227 |
689 |
386 |
629 |
486 |
2,872 |
|
nonneuroinvasive |
1,691 |
2,744 |
2,403 |
667 |
334 |
392 |
226 |
2,801 |
|
Babesiosis†† |
|
|
|
|
|
|
|
|
|
confirmed |
¶ |
¶ |
¶ |
¶ |
¶ |
¶ |
850 |
716 |
|
probable |
¶ |
¶ |
¶ |
¶ |
¶ |
¶ |
278 |
221 |
|
Botulism, total |
135 |
165 |
144 |
145 |
118 |
112 |
153 |
168 |
|
foodborne |
19 |
20 |
32 |
17 |
10 |
7 |
24 |
27 |
|
infant |
85 |
97 |
85 |
109 |
83 |
80 |
97 |
123 |
|
other (wound and unspecified) |
— |
— |
— |
— |
— |
— |
32 |
18 |
|
Brucellosis |
120 |
121 |
131 |
80 |
115 |
115 |
79 |
114 |
|
Chancroid** |
17 |
33 |
23 |
25 |
28 |
24 |
8 |
15 |
|
Chlamydia trachomatis infections** |
976,445 |
1,030,911 |
1,108,374 |
1,210,523 |
1,244,180 |
1,307,893 |
1,412,791 |
1,422,976 |
|
Cholera |
8 |
9 |
7 |
5 |
10 |
13 |
40 |
17 |
|
Coccidioidomycosis |
6,542 |
8,917 |
8,121 |
7,523 |
12,926 |
¶ |
22,634 |
17,802 |
|
Cryptosporidiosis, total†† |
5,659 |
6,071 |
11,170 |
9,113 |
7,654 |
8,944 |
9,250 |
7,956 |
|
confirmed |
†† |
†† |
†† |
†† |
7,393 |
8,375 |
6,130 |
5,098 |
|
probable |
†† |
†† |
†† |
†† |
261 |
569 |
3,120 |
2,718 |
|
Cyclosporiasis |
543 |
137 |
93 |
139 |
141 |
179 |
151 |
123 |
|
Dengue virus infection§ |
|
|
|
|
|
|
|
|
|
Dengue fever |
¶ |
¶ |
¶ |
¶ |
¶ |
690 |
251 |
544 |
|
Dengue hemorrhagic fever |
¶ |
¶ |
¶ |
¶ |
¶ |
10 |
3 |
3 |
|
Diphtheria |
— |
— |
— |
— |
— |
— |
— |
1 |
|
Ehrlichiosis |
|
|
|
|
|
|
|
|
|
human granulocytic (HGE) |
786 |
646 |
834 |
§§ |
§§ |
§§ |
§§ |
§§ |
|
human monocytic (HME) |
506 |
578 |
828 |
§§ |
§§ |
§§ |
§§ |
§§ |
|
human (other & unspecified) |
112 |
231 |
337 |
§§ |
§§ |
§§ |
§§ |
§§ |
|
Ehrlichiosis/Anaplasmosis |
|
|
|
|
|
|
|
|
|
Ehrlichia chaffeensis |
¶ |
¶ |
¶ |
957 |
944 |
740 |
850 |
1,128 |
|
Ehrlichia ewingii |
¶ |
¶ |
¶ |
9 |
7 |
10 |
13 |
17 |
|
Anaplasma phagocytophilum |
¶ |
¶ |
¶ |
1,009 |
1,161 |
1,761 |
2,575 |
2,389 |
|
Undetermined |
¶ |
¶ |
¶ |
132 |
155 |
104 |
148 |
191 |
|
Enterohemorrhagic Escherichia coli infection |
|
|
|
|
|
|
|
|
|
Shiga toxin-positive |
|
|
|
|
|
|
|
|
|
O157:H7 |
2,621 |
¶ |
¶ |
¶ |
¶ |
¶ |
¶ |
¶ |
|
non—O157 |
501 |
¶ |
¶ |
¶ |
¶ |
¶ |
¶ |
¶ |
|
not serogrouped |
407 |
¶ |
¶ |
¶ |
¶ |
¶ |
¶ |
¶ |
|
Giardiasis |
19,733 |
18,953 |
19,417 |
18,908 |
19,399 |
19,811 |
16,747 |
15,178 |
|
Gonorrhea** |
339,593 |
358,366 |
355,991 |
336,742 |
301,174 |
309,341 |
321,849 |
334,826 |
|
Haemophilus influenzae, invasive disease |
|
|
|
|
|
|
|
|
|
all ages, serotypes |
2,304 |
2,436 |
2,541 |
2,886 |
3,022 |
3,151 |
3,539 |
3,418 |
|
age <5 yrs. |
|
|
|
|
|
|
|
|
|
serotype b |
9 |
29 |
22 |
30 |
38 |
23 |
14 |
30 |
|
nonserotype b |
135 |
175 |
199 |
244 |
245 |
200 |
145 |
205 |
|
unknown serotype |
217 |
179 |
180 |
163 |
166 |
223 |
226 |
210 |
|
TABLE 8. (Continued) Reported cases of notifiable diseases — United States, 2005–2012 |
||||||||
|---|---|---|---|---|---|---|---|---|
|
Disease |
2005 |
2006 |
2007 |
2008 |
2009 |
2010 |
2011 |
2012 |
|
Hansen disease (leprosy) |
87 |
66 |
101 |
80 |
103 |
98 |
82 |
82 |
|
Hantavirus pulmonary syndrome |
26 |
40 |
32 |
18 |
20 |
20 |
23 |
30 |
|
Hemolytic uremic syndrome, postdiarrheal |
221 |
288 |
292 |
330 |
242 |
266 |
290 |
274 |
|
Hepatitis, viral, acute¶¶ |
|
|
|
|
|
|
|
|
|
A |
4,488 |
3,579 |
2,979 |
2,585 |
1,987 |
1,670 |
1,398 |
1,562 |
|
B |
5,119 |
4,713 |
4,519 |
4,033 |
3,405 |
3,374 |
2,903 |
2,895 |
|
C |
652 |
766 |
845 |
877 |
782 |
849 |
1,229 |
1,782 |
|
Hepatitis B perinatal infection |
— |
— |
— |
— |
— |
— |
— |
40 |
|
Human immunodeficiency virus (HIV) diagnoses† |
— |
— |
— |
— |
36,870 |
35,741 |
35,266 |
35,361 |
|
Influenza-associated pediatric mortality*** |
45 |
43 |
77 |
90 |
358 |
61 |
118 |
52 |
|
Invasive pneumococcal disease |
|
|
|
|
|
|
|
|
|
all ages |
— |
— |
— |
— |
— |
— |
— |
15,635 |
|
age<5 years |
— |
— |
— |
— |
— |
— |
— |
1,266 |
|
Legionellosis |
2,301 |
2,834 |
2,716 |
3,181 |
3,522 |
3,346 |
4,202 |
3,688 |
|
Listeriosis |
896 |
884 |
808 |
759 |
851 |
821 |
870 |
727 |
|
Lyme disease, total†† |
23,305 |
19,931 |
27,444 |
35,198 |
38,468 |
30,158 |
33,097 |
30,831 |
|
confirmed |
††† |
††† |
††† |
28,921 |
29,959 |
22,561 |
24,364 |
22,014 |
|
probable |
††† |
††† |
††† |
6,277 |
8,509 |
7,597 |
8,733 |
8,817 |
|
Malaria |
1,494 |
1,474 |
1,408 |
1,255 |
1,451 |
1,773 |
1,724 |
1,503 |
|
Measles |
66 |
55 |
43 |
140 |
71 |
63 |
220 |
55 |
|
indigenous |
— |
— |
— |
— |
— |
— |
— |
34 |
|
imported |
— |
— |
— |
— |
— |
— |
— |
21 |
|
Meningococcal disease, invasive§§§ |
|
|
|
|
|
|
|
|
|
all serogroups |
1,245 |
1,194 |
1,077 |
1,172 |
980 |
833 |
759 |
551 |
|
serogroup A,C,Y, & W-135 |
297 |
318 |
325 |
330 |
301 |
280 |
257 |
161 |
|
serogroup B |
156 |
193 |
167 |
188 |
174 |
135 |
159 |
110 |
|
other serogroup |
27 |
32 |
35 |
38 |
23 |
12 |
20 |
20 |
|
serogroup unknown |
765 |
651 |
550 |
616 |
482 |
406 |
323 |
260 |
|
Mumps |
314 |
6,584 |
800 |
454 |
1,991 |
2,612 |
404 |
229 |
|
Novel influenza A virus infections |
¶ |
¶ |
4 |
2 |
43,696 |
4 |
14 |
313 |
|
Pertussis |
25,616 |
15,632 |
10,454 |
13,278 |
16,858 |
27,550 |
18,719 |
48,277 |
|
Plague |
8 |
17 |
7 |
3 |
8 |
2 |
3 |
4 |
|
Poliomyelitis, paralytic¶¶¶ |
1 |
— |
— |
— |
1 |
— |
— |
— |
|
Poliovirus infection, nonparalytic |
— |
— |
— |
— |
— |
— |
— |
— |
|
Psittacosis |
16 |
21 |
12 |
8 |
9 |
4 |
2 |
2 |
|
Q Fever**** |
136 |
169 |
171 |
120 |
113 |
131 |
134 |
135 |
|
acute |
§§§§ |
§§§§ |
§§§§ |
106 |
93 |
106 |
110 |
113 |
|
chronic |
§§§§ |
§§§§ |
§§§§ |
14 |
20 |
25 |
24 |
22 |
|
Rabies |
|
|
|
|
|
|
|
|
|
animal |
5,915 |
5,534 |
5,862 |
4,196 |
5,343 |
4,331 |
4,357 |
4,541 |
|
human |
2 |
3 |
1 |
2 |
4 |
2 |
6 |
1 |
|
Rubella |
11 |
11 |
12 |
16 |
3 |
5 |
4 |
9 |
|
Rubella, congenital syndrome |
1 |
1 |
— |
— |
2 |
— |
— |
3 |
|
Salmonellosis |
45,322 |
45,808 |
47,995 |
51,040 |
49,192 |
54,424 |
51,887 |
53,800 |
|
SARS-CoV†††† |
— |
— |
— |
— |
— |
— |
— |
— |
|
Shiga toxin-producing E. coli (STEC) |
¶ |
4,432 |
4,847 |
5,309 |
4,643 |
5,476 |
6,047 |
6,463 |
|
Shigellosis |
16,168 |
15,503 |
19,758 |
22,625 |
15,931 |
14,786 |
13,352 |
15,283 |
|
Spotted Fever Rickettsiosis, total§§§§ |
1,936 |
2,288 |
2,221 |
2,563 |
1,815 |
1,985 |
2,802 |
4,470 |
|
confirmed |
§§§§ |
§§§§ |
§§§§ |
190 |
151 |
156 |
234 |
188 |
|
probable |
§§§§ |
§§§§ |
§§§§ |
2,367 |
1,662 |
1,835 |
2,562 |
4,278 |
|
Streptococcal disease, invasive, group A |
4,715 |
5,407 |
5,294 |
5,674 |
5,279 |
¶ |
¶ |
¶ |
|
Streptococcal, toxic shock syndrome |
129 |
125 |
132 |
157 |
161 |
142 |
168 |
194 |
|
Streptococcus pneumoniae invasive disease(IPD) |
|
|
|
|
|
|
|
|
|
all ages |
¶¶¶¶ |
¶¶¶¶ |
¶¶¶¶ |
¶¶¶¶ |
¶¶¶¶ |
16,569 |
17,138 |
††††† |
|
age <5 yrs |
¶¶¶¶ |
¶¶¶¶ |
¶¶¶¶ |
¶¶¶¶ |
¶¶¶¶ |
2,186 |
1,459 |
††††† |
|
Streptococcus pneumoniae, invasive disease |
|
|
|
|
|
|
|
|
|
drug resistant, all ages |
2,996 |
3,308 |
3,329 |
3,448 |
3,370 |
††††† |
††††† |
††††† |
|
age <5 yrs |
— |
— |
563 |
532 |
583 |
††††† |
††††† |
††††† |
|
non-drug resistant, age <5 yrs |
1,495 |
1,861 |
2,032 |
1,998 |
1988 |
††††† |
††††† |
††††† |
|
Syphilis, total, all stages** |
33,278 |
36,935 |
40,920 |
46,277 |
44,828 |
45,834 |
46,042 |
49,903 |
|
congenital (age <1 yr.) |
339 |
382 |
430 |
431 |
427 |
377 |
360 |
322 |
|
primary and secondary |
8,724 |
9,756 |
11,466 |
13,500 |
13,997 |
13,774 |
13,970 |
15,667 |
|
Tetanus |
27 |
41 |
28 |
19 |
18 |
26 |
36 |
37 |
|
Toxic-shock syndrome |
90 |
101 |
92 |
71 |
74 |
82 |
78 |
65 |
|
TABLE 8. (Continued) Reported cases of notifiable diseases — United States, 2005–2012 |
||||||||
|---|---|---|---|---|---|---|---|---|
|
Disease |
2005 |
2006 |
2007 |
2008 |
2009 |
2010 |
2011 |
2012 |
|
Trichinellosis |
16 |
15 |
5 |
39 |
13 |
7 |
15 |
18 |
|
Tuberculosis***** |
14,097 |
13,779 |
13,299 |
12,904 |
11,545 |
11,182 |
10,528 |
9,945 |
|
Tularemia |
154 |
95 |
137 |
123 |
93 |
124 |
166 |
149 |
|
Typhoid fever |
324 |
353 |
434 |
449 |
397 |
467 |
390 |
354 |
|
Vancomycin-intermediate Staphylococcus aureus |
3 |
6 |
37 |
63 |
78 |
91 |
82 |
134 |
|
Vancomycin-resistant Staphylococcus aureus |
2 |
1 |
2 |
— |
1 |
2 |
— |
2 |
|
Varicella (chickenpox)††††† |
32,242 |
48,445 |
40,146 |
30,386 |
20,480 |
15,427 |
14,513 |
13,447 |
|
Varicella (deaths) §§§§§ |
3 |
— |
6 |
2 |
2 |
4 |
5 |
3 |
|
Vibriosis (noncholera Vibrio species infections) |
¶ |
¶ |
549 |
588 |
789 |
846 |
832 |
1,111 |
|
Viral hemorrhagic fever |
¶ |
¶ |
¶ |
¶ |
¶ |
1 |
¶ |
¶ |
|
Yellow fever¶¶¶¶¶ |
— |
— |
— |
— |
— |
— |
— |
— |
|
* Acquired Immunodeficiency syndrome (AIDS). The total number of AIDS cases includes all cases reported to the Division of HIV/AIDS Prevention, National Center for HIV/AIDS, Viral Hepatitis, STD, and TB Prevention (NCHHSTP). † In 2008, CDC published a revised HIV case definition. This combined separate surveillance case definitions for HIV infection and AIDS into a single case definition for HIV infection that includes AIDS (and incorporates the HIV infection classification system). The revised HIV case definition provides a more complete presentation of HIV on a population level. Please see the Centers for Disease Control and Prevention revised surveillance case definitions for HIV infection among adults, adolescents, and children aged <18 months and for HIV infection and AIDS among children aged 18 months to <13 years—United States, 2008. MMWR 2008;57(No.RR-10):1–12. These case counts can be found under 'HIV diagnoses' in this table. The total number of HIV diagnoses includes all cases reported to the Division of HIV/AIDS Prevention, National Center for HIV/AIDS, Viral Hepatitis, STD, and TB Prevention (NCHHSTP), through December 31, 2012. HIV: Human Immunodeficiency Virus. § Totals reported to the Division of Vector-Borne Diseases (DVBD), National Center for Emerging and Zoonotic Infectious Diseases (NCEZID) (ArboNET Surveillance), as of June 1, 2013. ¶ Not nationally notifiable. ** Totals reported to the Division of STD Prevention, NCHHSTP, as of May 3, 2013. †† Revision of national surveillance case definition distinguishing between confirmed and probable cases. §§ As of January 1, 2008, these categories were replaced with codes for Anaplasma phagocytophilum. Refer to Ehrlichiosis/Anaplasmosis. ¶¶ Data on hepatitis B chronic, and hepatitis C, virus infection (past or present) are not included because they are undergoing data quality review. *** Totals reported to the Division of Influenza, National Center for Immunization and Respiratory Diseases (NCIRD), as of December 31, 2012. ††† National surveillance case definition revised in 2008; probable cases not previously reported. §§§ To help public health specialists monitor the impact of the new meningococcal conjugate vaccine (Menactra, licensed in the United States in January 2005), the data display for meningococcal disease was modified to differentiate the fraction of the disease that is potentially vaccine preventable (serogroups A, C, Y, W-135) from the non-vaccine preventable fraction of disease (serogroup B and others). ¶¶¶ Cases of vaccine-associated paralytic poliomyelitis caused by polio vaccine virus. Numbers might not reflect changes made on the basis of retrospective case evaluations or late reports (CDC. Poliomyelitis United States, 1975–1984. MMWR 1986;35:180–2). **** Q fever acute and chronic reporting categories were recognized as a result of revision to the Q fever case definition. Before then, acute and chronic Q fever cases were not reported separately. †††† Severe acute respiratory syndrome (SARS)–associated coronavirus disease. The total number of SARS–CoV cases includes all cases reported to the Division of Viral Diseases, Coordinating Center for Infectious Diseases. §§§§ Revision of national surveillance case definition distinguishing between confirmed and probable cases; total case count includes two case reports with unknown case status. ¶¶¶¶ The previous categories of invasive pneumococcal disease among children aged <5 years and invasive, drug-resistant Streptococcus pneumoniae were eliminated. All cases of invasive Streptococcus pneumoniae disease, regardless of age or drug resistance are reported under a single disease code. ***** Totals reported to the Division of Tuberculosis Elimination, NCHHSTP, as of June 15, 2013. ††††† Varicella was removed from the nationally notifiable disease list in 1991. Varicella became nationally notifiable again in 2003. §§§§§ Totals reported to the Division of Viral Diseases, National Center for Immunization and Respiratory Diseases (NCIRD), as of May 1, 2013. ¶¶¶¶¶ The last indigenous case of yellow fever was reported in 1911; all other cases reported since 1911 have been imported. |
||||||||
|
TABLE 9. Reported cases of notifiable diseases—United States, 1997–2004 |
||||||||
|---|---|---|---|---|---|---|---|---|
|
Disease |
1997 |
1998 |
1999 |
2000 |
2001 |
2002 |
2003 |
2004 |
|
AIDS* |
58,492 |
46,521 |
45,104 |
40,758 |
41,868 |
42,745 |
44,232 |
44,108 |
|
Anthrax |
— |
— |
— |
1 |
23 |
2 |
— |
— |
|
Botulism, total (including wound and unspecified) |
132 |
116 |
154 |
138 |
155 |
118 |
129 |
133 |
|
foodborne |
31 |
22 |
23 |
23 |
39 |
28 |
20 |
16 |
|
infant |
79 |
65 |
92 |
93 |
97 |
69 |
76 |
87 |
|
Brucellosis |
98 |
79 |
82 |
87 |
136 |
125 |
104 |
114 |
|
Chancroid† |
243 |
189 |
143 |
78 |
38 |
67 |
54 |
30 |
|
Chlamydia trachomatis infections† |
526,671 |
604,420 |
656,721 |
702,093 |
783,242 |
834,555 |
877,478 |
929,462 |
|
Cholera |
6 |
17 |
6 |
5 |
3 |
2 |
2 |
5 |
|
Coccidioidomycosis |
1,749 |
2,274 |
2,826 |
2,867 |
3,922 |
4,968 |
4,870 |
6,449 |
|
Cryptosporidiosis |
2,566 |
3,793 |
2,361 |
3,128 |
3,785 |
3,016 |
3,506 |
3,577 |
|
Cyclosporiasis |
§ |
§ |
§ |
60 |
147 |
156 |
75 |
171 |
|
Diphtheria |
4 |
1 |
1 |
1 |
2 |
1 |
1 |
— |
|
Ehrlichiosis |
||||||||
|
human granulocytic |
§ |
§ |
203 |
351 |
261 |
511 |
362 |
537 |
|
human monocytic |
§ |
§ |
99 |
200 |
142 |
216 |
321 |
338 |
|
human (other and unspecified) |
§ |
§ |
¶ |
¶ |
¶ |
¶ |
¶ |
¶ |
|
Encephalitis/Meningitis, arboviral |
||||||||
|
California serogroup virus |
129 |
97 |
70 |
114 |
128 |
164 |
108 |
112 |
|
Eastern equine virus |
14 |
4 |
5 |
3 |
9 |
10 |
14 |
6 |
|
Powassan virus |
§ |
§ |
§ |
§ |
§ |
1 |
— |
1 |
|
St. Louis virus |
13 |
24 |
4 |
2 |
79 |
28 |
41 |
12 |
|
West Nile virus |
§ |
§ |
§ |
§ |
§ |
2,840 |
2,866 |
1,142 |
|
Western equine virus |
— |
— |
1 |
— |
— |
— |
— |
— |
|
Enterohemorrhagic Escherichia coli infection |
||||||||
|
Shiga toxin-positive |
||||||||
|
O157:H7 |
2,555 |
3,161 |
4,513 |
4,528 |
3,284 |
3,840 |
2,671 |
2,544 |
|
Non-O157 |
§ |
§ |
§ |
§ |
171 |
194 |
252 |
316 |
|
not serogrouped |
§ |
§ |
§ |
§ |
20 |
60 |
156 |
308 |
|
Giardiasis |
§ |
§ |
§ |
§ |
§ |
21,206 |
19,709 |
20,636 |
|
Gonorrhea† |
324,907 |
355,642 |
360,076 |
358,995 |
361,705 |
351,852 |
335,104 |
330,132 |
|
Haemophilus influenzae, invasive disease |
||||||||
|
all ages, serotypes |
1,162 |
1,194 |
1,309 |
1,398 |
1,597 |
1,743 |
2,013 |
2,085 |
|
age <5 yrs |
||||||||
|
serotype b |
§ |
§ |
§ |
§ |
§ |
34 |
32 |
19 |
|
nonserotype b |
§ |
§ |
§ |
§ |
§ |
144 |
117 |
135 |
|
unknown serotype |
§ |
§ |
§ |
§ |
§ |
153 |
227 |
177 |
|
Hansen disease (Leprosy) |
122 |
108 |
108 |
91 |
79 |
96 |
95 |
105 |
|
Hantavirus Pulmonary Syndrome |
NA |
NA |
33 |
41 |
8 |
19 |
26 |
24 |
|
Hemolytic uremic syndrome, postdiarrheal |
91 |
119 |
181 |
249 |
202 |
216 |
178 |
200 |
|
Hepatitis, viral, acute |
||||||||
|
A |
30,021 |
23,229 |
17,047 |
13,397 |
10,609 |
8,795 |
7,653 |
5,683 |
|
B |
10,416 |
10,258 |
7,694 |
8,036 |
7,843 |
7,996 |
7,526 |
6,212 |
|
C/non-A, non-B** |
3,816 |
3,518 |
3,111 |
3,197 |
3,976 |
1,835 |
1,102 |
720 |
|
Legionellosis |
1,163 |
1,355 |
1,108 |
1,127 |
1,168 |
1,321 |
2,232 |
2,093 |
|
Listeriosis |
§ |
§ |
§ |
755 |
613 |
665 |
696 |
753 |
|
Lyme disease |
12,801 |
16,801 |
16,273 |
17,730 |
17,029 |
23,763 |
21,273 |
19,804 |
|
Malaria |
2,001 |
1,611 |
1,666 |
1,560 |
1,544 |
1,430 |
1,402 |
1,458 |
|
Measles |
138 |
100 |
100 |
86 |
116 |
44 |
56 |
37 |
|
Meningococcal disease, invasive |
3,308 |
2,725 |
2,501 |
2,256 |
2,333 |
1,814 |
1,756 |
1,361 |
|
Mumps |
683 |
666 |
387 |
338 |
266 |
270 |
231 |
258 |
|
Pertussis |
6,564 |
7,405 |
7,288 |
7,867 |
7,580 |
9,771 |
11,647 |
25,827 |
|
Plague |
4 |
9 |
9 |
6 |
2 |
2 |
1 |
3 |
|
Poliomyelitis, paralytic |
6 |
3 |
2 |
— |
— |
— |
— |
— |
|
Psittacosis |
33 |
47 |
16 |
17 |
25 |
18 |
12 |
12 |
|
Q Fever |
§ |
§ |
§ |
21 |
26 |
61 |
71 |
70 |
|
Rabies |
||||||||
|
animal |
8,105 |
7,259 |
6,730 |
6,934 |
7,150 |
7,609 |
6,846 |
6,345 |
|
human |
2 |
1 |
— |
4 |
1 |
3 |
2 |
7 |
|
Rubella |
181 |
364 |
267 |
176 |
23 |
18 |
7 |
10 |
|
Rubella, congenital syndrome |
5 |
7 |
9 |
9 |
3 |
1 |
1 |
— |
|
Salmonellosis, excluding typhoid fever |
41,901 |
43,694 |
40,596 |
39,574 |
40,495 |
44,264 |
43,657 |
42,197 |
|
SARS-CoV |
— |
— |
— |
— |
— |
— |
8 |
— |
|
Shigellosis |
23,117 |
23,626 |
17,521 |
22,922 |
20,221 |
23,541 |
23,581 |
14,627 |
|
TABLE 9. (Continued) Reported cases of notifiable diseases—United States, 1997–2004 |
||||||||
|---|---|---|---|---|---|---|---|---|
|
Disease |
1997 |
1998 |
1999 |
2000 |
2001 |
2002 |
2003 |
2004 |
|
Spotted Fever Rickettsiosis |
409 |
365 |
579 |
495 |
695 |
1,104 |
1,091 |
1,713 |
|
Streptococcal disease, invasive, group A |
1,973 |
2,260 |
2,667 |
3,144 |
3,750 |
4,720 |
5,872 |
4,395 |
|
Streptococcal toxic-shock syndrome |
33 |
58 |
65 |
83 |
77 |
118 |
161 |
132 |
|
Streptococcus pneumoniae, invasive disease, |
||||||||
|
drug-resistant, all ages |
1,799 |
2,823 |
4,625 |
4,533 |
2,896 |
2,546 |
2,356 |
†††† |
|
non-drug resistant age <5 yrs |
§ |
§ |
§ |
§ |
498 |
513 |
845 |
†††† |
|
Syphilis, total, all stages† |
46,540 |
37,977 |
35,628 |
31,575 |
32,221 |
32,871 |
34,270 |
33,401 |
|
congenital (age <1 yr) |
1,081 |
843 |
579 |
580 |
504 |
460 |
432 |
375 |
|
primary and secondary |
8,550 |
6,993 |
6,657 |
5,979 |
6,103 |
6,862 |
7,177 |
7,980 |
|
Tetanus |
50 |
41 |
40 |
35 |
37 |
25 |
20 |
34 |
|
Toxic-shock syndrome |
157 |
138 |
113 |
135 |
127 |
109 |
133 |
95 |
|
Trichinellosis |
13 |
19 |
12 |
16 |
22 |
14 |
6 |
5 |
|
Tuberculosis†† |
19,851 |
18,361 |
17,531 |
16,377 |
15,989 |
15,075 |
14,874 |
14,517 |
|
Tularemia |
§ |
§ |
§ |
142 |
129 |
90 |
129 |
134 |
|
Typhoid fever |
365 |
375 |
346 |
377 |
368 |
321 |
356 |
322 |
|
Varicella (chickenpox)§§ |
98,727 |
82,455 |
46,016 |
27,382 |
22,536 |
22,841 |
20,948 |
32,931 |
|
Varicella (deaths)¶¶ |
§ |
§ |
§ |
§ |
§ |
9 |
2 |
9 |
|
Yellow fever*** |
— |
— |
— |
— |
— |
1 |
— |
— |
|
* Acquired immunodeficiency syndrome. † Cases were reported to the Division of STD Prevention, National Center for HIV/AIDS, Viral Hepatitis, STD, and TB Prevention (NCHHSTP). § Not nationally notifiable. ¶ Data for ehrlichiosis attributable to other or unspecified agents were being withheld from publication pending the outcome of discussions concerning the reclassification of certain Ehrlichia species, which will probably affect how data in this category were reported. ** The anti-hepatitis C virus antibody test became available in May 1990. †† Cases were updated through the Division of Tuberculosis Elimination, NCHHSTP. §§ Varicella was removed from the nationally notifiable disease list in 1981. Certain states continued to report these cases to CDC. ¶¶ Totals reported to the Division of Viral Diseases, National Center for Immunization and Respiratory Diseases (NCIRD). *** The last indigenous case of yellow fever was reported in 1911; all other case reports since 1911 have been imported. |
||||||||
|
TABLE 10. Reported cases of notifiable diseases — United States, 1989–1996 |
||||||||
|---|---|---|---|---|---|---|---|---|
|
Disease |
1989 |
1990 |
1991 |
1992 |
1993 |
1994 |
1995 |
1996 |
|
AIDS* |
33,722 |
41,595 |
43,672 |
45,472 |
103,691 |
78,279 |
71,547 |
66,885 |
|
Amebiasis |
3,217 |
3,328 |
2,989 |
2,942 |
2,970 |
2,983 |
— |
— |
|
Anthrax |
— |
— |
— |
1 |
— |
— |
— |
— |
|
Aseptic meningitis |
10,274 |
11,852 |
14,526 |
12,223 |
12,848 |
8,932 |
— |
— |
|
Botulism, total (including wound and unspecified) |
89 |
92 |
114 |
91 |
97 |
143 |
97 |
119 |
|
foodborne |
23 |
23 |
27 |
21 |
27 |
50 |
24 |
25 |
|
infant |
60 |
65 |
81 |
66 |
65 |
85 |
54 |
80 |
|
Brucellosis |
95 |
82 |
104 |
105 |
120 |
119 |
98 |
112 |
|
Chancroid |
4,692 |
4,212 |
3,476 |
1,886 |
1,399 |
773 |
606 |
386 |
|
Chlamydia trachomatis infections |
— |
— |
— |
— |
— |
— |
447,638 |
498,884 |
|
Cholera |
— |
6 |
26 |
103 |
18 |
39 |
23 |
4 |
|
Coccidioidomycosis |
— |
— |
— |
— |
— |
— |
1,212 |
1,697 |
|
Crytosporidiosis |
— |
— |
— |
— |
— |
— |
2,970 |
2,827 |
|
Cyclosporiasis |
† |
† |
† |
† |
† |
† |
† |
† |
|
Diphtheria† |
3 |
4 |
5 |
4 |
— |
2 |
— |
2 |
|
human granulocytic |
§ |
§ |
§ |
§ |
§ |
§ |
§ |
§ |
|
human monocytic |
§ |
§ |
§ |
§ |
§ |
§ |
§ |
§ |
|
human (other and unspecified) |
§ |
§ |
§ |
§ |
§ |
§ |
§ |
§ |
|
Encephalitis, primary |
981 |
1,341 |
1,021 |
774 |
919 |
717 |
** |
** |
|
Postinfectious¶ |
88 |
105 |
82 |
129 |
170 |
143 |
** |
** |
|
Enterohemorrhagic Escherichia coli infection Shiga toxin-positive |
||||||||
|
O157:H7 |
¶ |
¶ |
¶ |
¶ |
¶ |
1,420 |
2,139 |
2,741 |
|
Non-O157 |
¶ |
¶ |
¶ |
¶ |
¶ |
¶ |
— |
§ |
|
not serogrouped |
¶ |
¶ |
¶ |
¶ |
¶ |
¶ |
— |
§ |
|
Giardiasis |
§ |
§ |
§ |
§ |
§ |
§ |
§ |
§ |
|
Gonorrhea |
733,151 |
690,169 |
620,478 |
501,409 |
439,673 |
418,068 |
392,848 |
325,883 |
|
Granuloma inguinale |
7 |
97 |
29 |
6 |
19 |
3 |
— |
— |
|
Haemophilus influenzae, invasive disease |
||||||||
|
all ages, serotypes |
¶ |
¶ |
¶ |
1,412 |
1,419 |
1,174 |
1,180 |
1,170 |
|
age<5 yrs |
||||||||
|
serotype b |
§ |
§ |
§ |
§ |
§ |
§ |
§ |
§ |
|
nonserotype b |
§ |
§ |
§ |
§ |
§ |
§ |
§ |
§ |
|
unknown serotype |
§ |
§ |
§ |
§ |
§ |
§ |
§ |
§ |
|
Hansen disease (leprosy) |
163 |
198 |
154 |
172 |
187 |
136 |
144 |
112 |
|
Hantavirus pulmonary syndrome |
NA |
NA |
NA |
NA |
NA |
NA |
NA |
NA |
|
Hemolytic uremic syndrome, postdiarrheal |
— |
— |
— |
— |
— |
— |
72 |
97 |
|
Hepatitis, viral, acute |
||||||||
|
A |
35,821 |
31,441 |
24,378 |
23,112 |
24,238 |
26,796 |
31,582 |
31,302 |
|
B |
23,419 |
21,102 |
18,003 |
16,126 |
13,361 |
12,517 |
10,805 |
10,637 |
|
C/ non-A, non-B** |
2,529 |
2,553 |
3,582 |
6,010 |
4,786 |
4,470 |
4,576 |
3,716 |
|
unspecified |
2,306 |
1,671 |
1,260 |
884 |
627 |
444 |
— |
— |
|
Legionellosis |
1,190 |
1,370 |
1,317 |
1,339 |
1,280 |
1,615 |
1,241 |
1,198 |
|
Leptospirosis |
93 |
77 |
58 |
54 |
51 |
38 |
— |
— |
|
Listeriosis |
§ |
§ |
§ |
§ |
§ |
§ |
§ |
§ |
|
Lyme disease |
** |
** |
** |
9,895 |
8,257 |
13,043 |
11,700 |
16,455 |
|
Lymphogranuloma venereum |
189 |
277 |
471 |
302 |
285 |
235 |
— |
— |
|
Malaria |
1,277 |
1,292 |
1,278 |
1,087 |
1,411 |
1,229 |
1,419 |
1,800 |
|
Measles |
18,193 |
27,786 |
9,643 |
2,237 |
312 |
963 |
309 |
508 |
|
Meningococcal disease, invasive |
2,727 |
2,451 |
2,130 |
2,134 |
2,637 |
2,886 |
3,243 |
3,437 |
|
Mumps |
5,712 |
5,292 |
4,264 |
2,572 |
1,692 |
1,537 |
906 |
751 |
|
Murine typhus fever |
41 |
50 |
43 |
28 |
25 |
** |
— |
— |
|
Pertussis |
4,157 |
4,570 |
2,719 |
4,083 |
6,586 |
4,617 |
5,137 |
7,796 |
|
Plague |
4 |
2 |
11 |
13 |
10 |
17 |
9 |
5 |
|
Poliomyelitis, paralytic |
11 |
6 |
10 |
6 |
4 |
8 |
7 |
7 |
|
Psittacosis |
116 |
113 |
94 |
92 |
60 |
38 |
64 |
42 |
|
Rabies |
||||||||
|
animal |
4,724 |
4,826 |
6,910 |
8,589 |
9,337 |
8,147 |
7,811 |
6,982 |
|
human |
1 |
1 |
3 |
1 |
3 |
6 |
5 |
3 |
|
Rheumatic fever, acute |
144 |
108 |
127 |
75 |
112 |
112 |
— |
— |
|
Rocky Mountain spotted fever |
623 |
651 |
628 |
502 |
456 |
465 |
590 |
831 |
|
Rubella |
396 |
1,125 |
1,401 |
160 |
192 |
227 |
128 |
238 |
|
Rubella, congenital syndrome |
3 |
11 |
47 |
11 |
5 |
7 |
6 |
4 |
|
TABLE 10. (Continued) Reported cases of notifiable diseases — United States, 1989–1996 |
||||||||
|---|---|---|---|---|---|---|---|---|
|
Disease |
1989 |
1990 |
1991 |
1992 |
1993 |
1994 |
1995 |
1996 |
|
Salmonellosis |
47,812 |
48,603 |
48,154 |
40,912 |
41,641 |
43,323 |
45,970 |
45,471 |
|
SARS-CoV |
— |
— |
— |
— |
— |
— |
— |
— |
|
Shigellosis |
25,010 |
27,077 |
23,548 |
23,931 |
32,198 |
29,769 |
32,080 |
25,978 |
|
Streptococcal disease, invasive, Group A |
— |
— |
— |
— |
— |
— |
613 |
1,445 |
|
Streptococcal toxic-shock syndrome |
— |
— |
— |
— |
— |
— |
10 |
19 |
|
Streptococcus pneumoniae, invasive disease, |
||||||||
|
drug-resistant, all ages |
— |
— |
— |
— |
— |
— |
309 |
1,514 |
|
non-drug resistant age <5 yrs |
§ |
§ |
§ |
§ |
§ |
§ |
§ |
§ |
|
Syphilis, |
||||||||
|
total, all stages |
110,797 |
134,255 |
128,569 |
112,581 |
101,259 |
81,696 |
68,953 |
52,976 |
|
congenital (age <1 yr) |
1,837 |
3,865 |
4,424 |
4,067 |
3,420 |
2,452 |
1,863 |
1,282 |
|
primary and secondary |
44,540 |
50,223 |
42,935 |
33,973 |
26,498 |
20,627 |
16,500 |
11,387 |
|
Tetanus |
53 |
64 |
57 |
45 |
48 |
51 |
41 |
36 |
|
Toxic-shock syndrome |
400 |
322 |
280 |
244 |
212 |
192 |
191 |
145 |
|
Trichinosis |
30 |
129 |
62 |
41 |
16 |
32 |
29 |
11 |
|
Tuberculosis |
23,495 |
25,701 |
26,283 |
26,673 |
25,313 |
24,361 |
22,860 |
21,337 |
|
Tularemia |
152 |
152 |
193 |
159 |
132 |
96 |
§ |
§ |
|
Typhoid fever |
460 |
552 |
501 |
414 |
440 |
441 |
369 |
460 |
|
Varicella |
185,441 |
173,099 |
147,076 |
158,364 |
134,722 |
151,219 |
120,624 |
83,511 |
|
Varicella (chickenpox) |
§ |
§ |
§ |
§ |
§ |
§ |
§ |
§ |
|
Yellow fever†† |
— |
— |
— |
— |
— |
— |
— |
1 |
|
* Acquired immunodeficiency syndrome. † Cutaneous diphtheria ceased being nationally notifiable after 1979. § In 1984, data were recorded by date of report to state health departments. ¶ Not nationally notifiable. ** The anti-hepatitis C virus antibody test became available in 1990. †† No cases of yellow fever were reported during 1989–1996. |
||||||||
|
TABLE 11. Reported cases of notifiable diseases* — United States, 1981–1988 |
||||||||
|---|---|---|---|---|---|---|---|---|
|
Disease |
1981 |
1982 |
1983 |
1984 |
1985 |
1986 |
1987 |
1988 |
|
AIDS† |
§ |
§ |
§ |
4,445 |
8,249 |
12,932 |
21,070 |
31,001 |
|
Amebiasis |
6,632 |
7,304 |
6,658 |
5,252 |
4,433 |
3,532 |
3,123 |
2,860 |
|
Anthrax |
– |
– |
– |
1 |
– |
– |
1 |
2 |
|
Aseptic meningitis |
9,547 |
9,680 |
12,696 |
8,326 |
10,619 |
11,374 |
11,487 |
7,234 |
|
Botulism, total (including wounds and unspecified) |
103 |
97 |
133 |
123 |
122 |
109 |
82 |
84 |
|
foodborne |
§ |
§ |
§ |
§ |
49 |
23 |
17 |
28 |
|
infant |
§ |
§ |
§ |
§ |
70 |
79 |
59 |
50 |
|
Brucellosis |
185 |
173 |
200 |
131 |
153 |
106 |
129 |
96 |
|
Chancroid |
850 |
1,392 |
847 |
666 |
2,067 |
3,756 |
4,998 |
5,001 |
|
Chlamydia trachomatis infections |
– |
– |
– |
– |
– |
– |
– |
– |
|
Cholera |
19 |
– |
1 |
1 |
4 |
23 |
6 |
8 |
|
Diphtheria |
5 |
2 |
5 |
1 |
3 |
– |
3 |
2 |
|
Encephalitis |
– |
|||||||
|
primary |
1,492 |
1,464 |
1,761 |
1,257 |
1,376 |
1,302 |
1,418 |
882 |
|
postinfectious |
43 |
36 |
34 |
108 |
161 |
124 |
121 |
121 |
|
Enterohemorrhagic Escherichia coli |
||||||||
|
Gonorrhea |
990,864 |
960,633 |
900,435 |
878,556 |
911,419 |
900,868 |
780,905 |
719,536 |
|
Granuloma inguinale |
66 |
17 |
24 |
30 |
44 |
61 |
22 |
11 |
|
Hansen disease (leprosy) |
256 |
250 |
259 |
290 |
361 |
270 |
238 |
184 |
|
Hepatitis |
||||||||
|
A (infectious) |
25,802 |
23,403 |
21,532 |
22,040 |
23,210 |
23,430 |
25,280 |
28,507 |
|
B (serum) |
21,152 |
22,177 |
24,318 |
26,115 |
26,611 |
26,107 |
25,916 |
23,177 |
|
C/ non-A, non-B¶ |
§ |
§ |
§ |
3,871 |
4,184 |
3,634 |
2,999 |
2,619 |
|
unspecified |
10,975 |
8,564 |
7,149 |
5,531 |
5,517 |
3,940 |
3,102 |
2,470 |
|
Legionellosis |
408 |
654 |
852 |
750 |
830 |
980 |
1,038 |
1,085 |
|
Leptospirosis |
82 |
100 |
61 |
40 |
57 |
41 |
43 |
54 |
|
Lymphogranuloma venereum |
263 |
235 |
335 |
170 |
226 |
396 |
303 |
185 |
|
Malaria |
1,388 |
1,056 |
813 |
1,007 |
1,049 |
1,123 |
944 |
1,099 |
|
Measles |
3,124 |
1,714 |
1,497 |
2,587 |
2,822 |
6,282 |
3,655 |
3,396 |
|
Meningococcal disease, invasive |
3,525 |
3,056 |
2,736 |
2,746 |
2,479 |
2,594 |
2,930 |
2,964 |
|
Mumps |
4,941 |
5,270 |
3,355 |
3,021 |
2,982 |
7,790 |
12,848 |
4,866 |
|
Murine typhus fever |
61 |
58 |
62 |
53 |
37 |
67 |
49 |
54 |
|
Pertussis |
1,248 |
1,895 |
2,463 |
2,276 |
3,589 |
4,195 |
2,823 |
3,450 |
|
Plague |
13 |
19 |
40 |
31 |
17 |
10 |
12 |
15 |
|
Poliomyelitis, total |
10 |
12 |
13 |
9 |
8 |
10 |
9 |
9 |
|
paralytic |
10 |
12 |
13 |
9 |
8 |
10 |
9 |
9 |
|
Psittacosis |
136 |
152 |
142 |
172 |
119 |
224 |
98 |
114 |
|
Rabies |
||||||||
|
animal |
7,118 |
6,212 |
5,878 |
5,567 |
5,565 |
5,504 |
4,658 |
4,651 |
|
human |
2 |
– |
2 |
3 |
1 |
– |
1 |
– |
|
Rheumatic fever, acute |
264 |
137 |
88 |
117 |
90 |
147 |
141 |
158 |
|
Rocky Mountain spotted fever |
1,192 |
976 |
1,126 |
838 |
714 |
760 |
604 |
609 |
|
Rubella |
2,077 |
2,325 |
970 |
752 |
630 |
551 |
306 |
225 |
|
Rubella, congenital syndrome |
19 |
7 |
22 |
5 |
– |
14 |
5 |
6 |
|
Salmonellosis |
39,990 |
40,936 |
44,250 |
40,861 |
65,347 |
49,984 |
50,916 |
48,948 |
|
Shigellosis |
9,859 |
18,129 |
19,719 |
17,371 |
17,057 |
17,138 |
23,860 |
30,617 |
|
Syphilis |
||||||||
|
congenital (age <1 yr) |
287 |
259 |
239 |
305 |
329 |
410 |
480 |
741 |
|
primary and secondary |
31,266 |
33,613 |
32,698 |
28,607 |
27,131 |
27,883 |
35,147 |
40,117 |
|
total, all stages |
72,799 |
75,579 |
74,637 |
69,888 |
67,563 |
68,215 |
86,545 |
103,437 |
|
Tetanus |
72 |
88 |
91 |
74 |
83 |
64 |
48 |
53 |
|
Toxic-shock syndrome |
§ |
§ |
§ |
482 |
384 |
412 |
372 |
390 |
|
Trichinosis |
206 |
115 |
45 |
68 |
61 |
39 |
40 |
45 |
|
Tuberculosis |
27,373 |
25,520 |
23,846 |
22,255 |
22,201 |
22,768 |
22,517 |
22,436 |
|
Tularemia |
288 |
275 |
310 |
291 |
177 |
170 |
214 |
201 |
|
Typhoid fever |
584 |
425 |
507 |
390 |
402 |
362 |
400 |
436 |
|
Varicella |
200,766 |
167,423 |
177,462 |
221,983 |
178,162 |
183,243 |
213,196 |
192,857 |
|
* No cases of yellow fever were reported during 1981–1988. † Acquired immunodeficiency syndrome. § Not nationally notifiable. ¶ The anti-hepatitis C virus antibody test became available in 1990. |
||||||||
|
TABLE 12. Number of deaths from selected nationally notifiable infectious diseases — United States, 2004–2010 |
||||||||
|---|---|---|---|---|---|---|---|---|
|
Cause of death |
ICD-10* |
No. of deaths |
||||||
|
2004 |
2005 |
2006 |
2007 |
2008 |
2009 |
2010 |
||
|
AIDS† |
B20-B24 |
13,063 |
12,543 |
12,133 |
11,295 |
10,285 |
9,406 |
8,369 |
|
Anthrax |
A22 |
0 |
0 |
0 |
0 |
0 |
0 |
0 |
|
Encephalitis, arboviral |
|
|
|
|
|
|
|
|
|
California serogroup virus |
A83.5 |
0 |
1 |
1 |
1 |
0 |
0 |
0 |
|
Eastern equine encephalitis virus |
A83.2 |
2 |
2 |
2 |
0 |
0 |
2 |
3 |
|
Powassan virus |
A84.8 |
0 |
0 |
0 |
0 |
0 |
0 |
0 |
|
St. Louis encephalitis virus |
A83.3 |
2 |
1 |
2 |
1 |
2 |
0 |
3 |
|
Western equine encephalitis virus |
A83.1 |
0 |
0 |
0 |
0 |
0 |
0 |
0 |
|
Botulism, foodborne |
A05.1 |
0 |
5 |
3 |
6 |
4 |
3 |
0 |
|
Brucellosis |
A23 |
0 |
2 |
2 |
1 |
0 |
1 |
0 |
|
Chancroid |
A57 |
0 |
0 |
0 |
0 |
0 |
0 |
0 |
|
Chlamydia trachomatis infections |
A56 |
0 |
0 |
0 |
0 |
0 |
0 |
0 |
|
Cholera |
A00 |
0 |
0 |
0 |
1 |
0 |
1 |
0 |
|
Coccidioidomycosis |
B38 |
100 |
76 |
110 |
99 |
72 |
87 |
92 |
|
Cryptosporidiosis |
A07.2 |
1 |
2 |
2 |
2 |
3 |
2 |
4 |
|
Cyclosporiasis |
A07.8 |
0 |
0 |
0 |
0 |
0 |
0 |
0 |
|
Diphtheria |
A36 |
0 |
0 |
0 |
0 |
0 |
0 |
0 |
|
Ehrlichiosis |
A79.8 |
0 |
0 |
0 |
0 |
0 |
0 |
0 |
|
Giardiasis |
A07.1 |
1 |
0 |
1 |
0 |
1 |
0 |
1 |
|
Gonoccocal infections |
A54 |
2 |
3 |
3 |
6 |
2 |
1 |
2 |
|
Haemophilus influenzae |
A49.2 |
11 |
4 |
4 |
10 |
3 |
7 |
4 |
|
Hansen disease (leprosy) |
A30 |
5 |
1 |
1 |
2 |
2 |
1 |
4 |
|
Hantavirus pulmonary syndrome |
A98.5 |
0 |
0 |
8 |
6 |
2 |
0 |
5 |
|
Hemolytic uremic syndrome, postdiarrheal |
D59.3 |
27 |
30 |
29 |
20 |
32 |
25 |
20 |
|
Hepatitis A, viral, acute |
B15 |
58 |
43 |
34 |
34 |
37 |
26 |
29 |
|
Influenza-associated pediatric mortality |
J10, J11 |
51 |
61 |
62 |
71 |
78 |
165 |
38 |
|
Legionellosis |
A48.1 |
72 |
78 |
91 |
67 |
92 |
104 |
104 |
|
Listeriosis |
A32 |
37 |
31 |
30 |
34 |
28 |
29 |
27 |
|
Lyme disease |
A69.2, L90.4 |
6 |
7 |
5 |
8 |
10 |
12 |
10 |
|
Malaria |
B50-B54 |
8 |
6 |
9 |
5 |
5 |
3 |
10 |
|
Measles |
B05 |
0 |
1 |
0 |
0 |
0 |
2 |
2 |
|
Meningococcal disease |
A39 |
138 |
123 |
105 |
87 |
102 |
99 |
79 |
|
Mumps |
B26 |
0 |
0 |
1 |
0 |
2 |
2 |
1 |
|
Pertussis |
A37 |
16 |
31 |
9 |
9 |
20 |
15 |
26 |
|
Plague |
A20 |
1 |
1 |
3 |
2 |
0 |
1 |
0 |
|
Poliomyelitis |
A80 |
0 |
0 |
0 |
0 |
0 |
0 |
0 |
|
Psittacosis |
A70 |
0 |
0 |
0 |
0 |
0 |
0 |
0 |
|
Q fever |
A78 |
1 |
2 |
2 |
4 |
0 |
1 |
0 |
|
Rabies, human |
A82 |
3 |
1 |
2 |
1 |
2 |
4 |
1 |
|
Rocky Mountain spotted fever |
A77.0 |
5 |
6 |
4 |
4 |
4 |
8 |
8 |
|
Rubella |
B06 |
1 |
0 |
0 |
1 |
0 |
1 |
1 |
|
Rubella congenital syndrome |
P35.0 |
5 |
8 |
2 |
4 |
5 |
4 |
8 |
|
Salmonellosis |
A02 |
30 |
30 |
34 |
30 |
42 |
26 |
28 |
|
Shiga toxin-producing Escherichia coli (STEC) |
A04.0-A04.4 |
4 |
5 |
3 |
3 |
1 |
3 |
8 |
|
Shigellosis |
A03 |
0 |
9 |
3 |
4 |
3 |
4 |
2 |
|
Smallpox |
B03 |
0 |
0 |
0 |
0 |
0 |
0 |
0 |
|
Streptococcal disease, invasive, group A |
A40.0, A49.1 |
121 |
118 |
117 |
144 |
143 |
148 |
163 |
|
Streptococcus pneumoniae, invasive disease |
A40.3, B95.3, J13 |
13 |
12 |
22 |
12 |
20 |
18 |
14 |
|
Syphilis, total, all stages |
A50-A53 |
43 |
47 |
38 |
42 |
34 |
34 |
28 |
|
TABLE 12. (Continued) Number of deaths from selected nationally notifiable infectious diseases — United States, 2004–2010 |
||||||||
|---|---|---|---|---|---|---|---|---|
|
Cause of death |
ICD-10* |
No. of deaths |
||||||
|
2004 |
2005 |
2006 |
2007 |
2008 |
2009 |
2010 |
||
|
Tetanus |
A35 |
4 |
1 |
4 |
5 |
3 |
6 |
3 |
|
Toxic-shock syndrome (other than streptococcal) |
A48.3 |
71 |
55 |
57 |
18 |
20 |
21 |
24 |
|
Trichinellosis |
B75 |
0 |
0 |
1 |
0 |
0 |
0 |
0 |
|
Tuberculosis |
A16-A19 |
657 |
648 |
652 |
554 |
585 |
529 |
569 |
|
Tularemia |
A21 |
1 |
0 |
0 |
2 |
1 |
3 |
0 |
|
Typhoid fever |
A01.0 |
0 |
0 |
0 |
0 |
2 |
0 |
0 |
|
Varicella |
B01 |
19 |
13 |
18 |
14 |
18 |
22 |
16 |
|
Yellow fever§ |
A95 |
0 |
0 |
0 |
0 |
0 |
0 |
0 |
|
Source: CDC. CDC WONDER Compressed Mortality files (http://wonder.cdc.gov/mortSQL.html) provided by the National Center for Health Statistics. National Vital Statistics System, 2003–2009. Underlying causes of death are classified according to ICD 10. Data for 2010–2012 are not available. Data are limited by the accuracy of the information regarding the underlying cause of death indicated on death certificates and reported to the National Vital Statistics System. * World Health Organization. International Statistical Classification of Diseases and Related Health Problems. Tenth Revision, 1992. † Acquired immunodeficiency syndrome. § For one fatality, the cause of death was erroneously reported as yellow fever in the National Center for Health Statistics dataset for 2003. Subsequent investigation has determined that this death did not result from infection with wild-type yellow fever virus, and it is therefore not included. |
||||||||
Selected Reading for 2012
General
Adekoya N. Nationally notifable disease surveillance (NNDSS) and the Healthy People 2010 objectives. The eJournal of the South Carolina Medical Association 2005;101:e68--72.
Armstrong KE, McNabb S, Ferland LD, et al. Capacity of public health surveillance to comply with revised international health regulations, USA. Emerg Infect Dis 2010;5:804--8.
Atlas RM. Bioterriorism: from threat to reality. Annu Rev Microbiol 2002;56:167--85.
Baker MG, Fidler DP. Global public health surveillance under new international health regulations. Emerg Infect Dis 2006;12:1058--65.
Bayer R, Fairchild AL. Public health: surveillance and privacy. Science 2000;290:1898--9.
Beltran VM, Harrison KM, Hall HI, Dean HD. Collection of social determinant of health measures in US national surveillance systems for HIV, viral hepatitis, STDs, and TB. Public Health Rep 2011 Sep--Oct;126 Suppl 3:41--53.
Boehmer TK, Patnaik JL, Burnite SJ, et al. Use of hospital discharge data to evaluate notifiable disease reporting to Colorado’s Electronic Disease Reporting System. Public Health Rep 2011 Jan--Feb;126:100--6.
Brookmeyer R, Stroup DF, eds. Monitoring the health of populations: statistical principles and methods for public health surveillance. New York, NY: Oxford University Press; 2004.
CDC. Automated detection and reporting of notifiable diseases using electronic medical records versus passive surveillance---Massachusetts, June 2006--July 2007. MMWR 2008;57:373--6. Available at http://www.cdc.gov/mmwr/preview/mmwrhtml/mm5714a4.htm?%0As_cid=mm5714a4_e.
CDC. Comparison of provisional with final notifiable disease case counts---National Notifiable Diseases Surveillance System, 2009. MMWR 2013;62;747--751. Available at http://www.cdc.gov/mmwr/preview/mmwrhtml/mm6236a4.htm?s_cid=mm6236a4_w.
CDC. Racial disparities in nationally notifiable diseases---United States, 2002. MMWR 2005;54:9--11. Available at http://www.cdc.gov/mmwr/preview/mmwrhtml/mm5401a4.htm.
CDC. Progress in improving state and local disease surveillance---United States, 2000--2005. MMWR 2005;54:822--5.
CDC. Case definitions for infectious conditions under public health surveillance. MMWR 1997;46(No. RR-10). Available at ftp://ftp.cdc.gov/pub/publications/mmwr/rr/rr4610.pdf.
CDC. Framework for evaluating public health surveillance systems for early detection of outbreaks; recommendations from the CDC working group. MMWR 2004;53(No. RR-5). Available at http://www.cdc.gov/mmwr/preview/mmwrhtml/rr5305a1.htm.
CDC. Framework for program evaluation in public health. MMWR 1999;48(No. RR-11). Available at http://www.cdc.gov/mmwr/PDF/RR/RR4811.pdf.
CDC. Historical perspectives: notifiable disease surveillance and notifiable disease statistics United States, June 1946 and June 1996. MMWR 1996;45:530--6. Available at http://www.cdc.gov/mmwr/preview/mmwrhtml/00042744.htm.
CDC. Manual of procedures for the reporting of nationally notifiable diseases to CDC. Atlanta, GA: US Department of Health and Human Services; CDC.
CDC. Manual for the surveillance of vaccine-preventable diseases 5th Edition. Atlanta, GA: US Department of Health and Human Services; CDC, 2012 Available at http://www.cdc.gov/vaccines/pubs/surv-manual/index.html.
CDC. NCHHSTP Atlas. US Department of Health and Human Services; CDC. Available at http://www.cdc.gov/nchhstp/atlas/.
CDC. National Electronic Disease Surveillance System (NEDSS): a standards-based approach to connect public health and clinical medicine. J Public Health Manag Practice 2001;7:43--50.
CDC. Notice to Readers: Changes in presentation of data from the National Notifiable Diseases Surveillance System---January 13, 2006. MMWR 2006;55:13--14. Available at http://www.cdc.gov/mmwr//preview/mmwrhtml/mm5501a5.htm.
CDC. Public Health Information Network---improving early detection by using a standards-based approach to connecting public health and clinical medicine. MMWR 2004;53 (Suppl):199--202. Available at http://www.cdc.gov/mmwr/preview/mmwrhtml/su5301a36.htm.
CDC. Public Health Information Network: connecting public health. Atlanta, GA: US Department of Health and Human Services; CDC. Available at http://www.cdc.gov/phin/about/index.html.
CDC. Racial disparities in nationally notifiable diseases---United States, 2002. MMWR 2005 14;54:9--11. Available at http://www.cdc.gov/mmwr/preview/mmwrhtml/mm5401a4.htm.
CDC. Reporting race and ethnicity data---National Electronic Telecommunications System for Surveillance, 1994--1997. MMWR 1999;48:305--12. Available at http://www.cdc.gov/mmwr/preview/mmwrhtml/00056960.htm.
CDC. State Electronic Disease Surveillance Systems---United States, 2007 and 2010. MMWR 2011, 60;1421--23. Available at http://www.cdc.gov/mmwr/preview/mmwrhtml/mm6041a3.htm.
CDC. Ten leading nationally notifiable infectious diseases---United States, 1995. MMWR 1996;45:883--4.
CDC. The cornerstone of public health practice: public health surveillance, 1961--2011. MMWR 2011: 60;15--21 Available at http://www.cdc.gov/mmwr/preview/mmwrhtml/su6004a4.htm?s_cid=su6004a4_w.
CDC. Updated guidelines for evaluating public health surveillance systems: recommendations from the Guidelines Working Group. MMWR 2001;50(No. RR-13). Available at http://www.cdc.gov/mmwr/preview/mmwrhtml/rr5013a1.htm.
CDC. Use of race and ethnicity in public health surveillance: summary of the CDC/ATSDR workshop. MMWR 1993;42(No. RR-10).
CDC. Potential effects of electronic laboratory reporting on improving timeliness of infectious disease notification---Florida, 2002--2006. MMWR 2008;57:1325--8.
Chang MH, Glynn MK, Groseclose SL. Endemic, notifiable bioterrorismrelated diseases, United States, 1992--1999. Emerg Infect Dis 2003;9:556--64.
Cronquist AB, Mody RK, Atkinson R, et al. Impacts of culture-independent diagnostic practices on public health surveillance for bacterial enteric pathogens. Clin Infect Dis 2012;54 (Suppl 5):S432--9.
Dato V, Wagner MM, Fapohunda A. How outbreaks of infectious disease are detected: a review of surveillance systems and outbreaks. Public Health Rep 2004 Sep--Oct;119:464--71.
Doyle TJ, Ma H, Groseclose SL, Hopkins RS. PHSkb: a knowledgebase to support notifiable disease surveillance. BMC Med Inform Decis Mak 2005;5:27.
Doyle TJ, Glynn MK, Groseclose SL. Completeness of notifiable infectious disease reporting in the United States: an analytical literature review. Am J Epidemiol 2002;155:866--74.
Effler P, Ching-Lee M, Bogard A, et al. Statewide system of electronic notifiable disease reporting from clinical laboratories: comparing automated reporting with conventional methods. JAMA 1999;282:1845--50.
Frieden TR. A framework for public health action: the health impact pyramid. Am J Public Health 2010;100:590--95.
Freimuth V, Linnan HW, Potter P. Communicating the threat of emerging infections to the public. Emerg Infect Dis 2000;6:337--47.
German R. Sensitivity and predictive value positive measurements for public health surveillance systems. Epidemiology 2000;11:720--7.
Government Accountability Office. Emerging infectious diseases: review of state and federal disease surveillance efforts. Washington, DC: Government Accountability Office; 2004. GAO-04-877. Available at http://www.gao.gov/new.items/d04877.pdf.
Hardiman MC. World Health Organization Perspective on Implementation of International Health Regulations. Emerg Infect Dis 2012;18:1041--6.
Heyman DL, ed. Control of communicable diseases manual. 19th ed. Washington, DC: American Public Health Association; 2008.
Hopkins RS. Design and operation of state and local infectious disease surveillance systems. J Public Health Manag Practice 2005;11:184--90.
Jajosky RA, Groseclose SL. Evaluation of reporting timeliness of public health surveillance systems for infectious diseases. BMC Public Health 2004;4:29.
Jajosky R, Rey A, Park M, et al. Findings from the Council of State and Territorial Epidemiologists’ 2008 assessment of state reportable and nationally notifiable conditions in the United States and considerations for the future. J Public Health Manag Practice 2011;17:255--64.
Kleinman KP, Abrams AM. Assessing the utility of public health surveillance using specificity, sensitivity, and lives saved. Stat Med 2008;27:4057--68.
Koo D, Caldwell B. The role of providers and health plans in infectious disease surveillance. Eff Clin Pract 1999;2:247--52.
Krause G, Brodhun B, Altmann D, Claus H, Benzler J. Reliability of case definitions for public health surveillance assessed by round-robin test methodology. BMC Public Health 2006;6:129.
Lazarus R, Klompas M, Campion F, et al. Electronic support for public health: validated case finding and reporting for notifiable diseases using electronic medical data. J Am Med Inform Assoc 2009;16:18--24.
Lee LM, Teutsch SM, Thacker SB, St Louis ME, eds. Principles and practice of public health surveillance. 3rd ed. New York, NY: Oxford University Press; 2010:1--17.
Lin SS, Kelsey JL. Use of race and ethnicity in epidemiologic research: concepts, methodological issues, and suggestions for research. Epidemiol Rev 2000;22:187--202.
McNabb S, Chungong S, Ryan M, et al. Conceptual framework of public health surveillance and action and its application in health sector reform. BMC Public Health 2002;2:2.
McNabb S, Surdo A, Redmond A, et al. Applying a new conceptual framework to evaluate tuberculosis surveillance and action performance and measure the costs, Hillsborough County, Florida, 2002. Ann Epidemiol 2004;14:640--5.
M’ikanatha NM, Lynfield R, Van Beneden CA, de Valk H. Infectious disease surveillance, 2nd edition. Malden, MA: Wiley; 2013.
Miller MA, Sentz J, Rabaa MA, et al. Global epidemiology of infections due to Shigella, Salmonella serotype Typhi, and enterotoxigenic Escherichia coli. Epidemiol Infect 2008;136:433--5.
Office of the National Coordinator for Health Information Technology (ONC). Federal health information technology strategic plan 2011--2015. Washington, DC: US Department of Health and Human Services; ONC. Available at http://www.healthit.gov/sites/default/files/utility/final-federal-health-it-strategic-plan-0911.pdf.
Overhage JM, Grannis S, McDonald CJ. A comparison of the completeness and timeliness of automated electronic laboratory reporting and spontaneous reporting of notifiable conditions. Am J Public Health 2008;98:344--50.
Panackal AA, M’ikanatha NM, Tsui FC, et al. Automatic electronic laboratory- based reporting of notifiable infectious diseases at a large health system. Emerg Infect Dis 2002;8:685--91.
Perry HN, McDonnell SM, Alemu W, et al. Planning an integrated disease surveillance and response system: a matrix of skills and activities. BMC Med 2007;5:24.
Pinner RW, Jernigan DB, Sutliff SM. Electronic laboratory-based reporting for public health. Mil Med 2000;165(Suppl 2):20--4.
Quandelacy TM, Johns MC, Andraghetti R, et al. The role of disease surveillance in achieving IHR compliance by 2012. Biosecur Bioterror 2011 Dec; 9:408--12.
Roush S, Birkhead G, Koo D, Cobb A, Fleming D. Mandatory reporting of diseases and conditions by health care professionals and laboratories. JAMA 1999;282:164--70.
Roush S, Murphy T. Historical comparisons of morbidity and mortality for vaccine-preventable diseases in the United States. JAMA 2007;298:2155--63.
Scallan E, Hoekstra RM, Angulo FJ, et al. Foodborne illness acquired in the United States---major pathogens. Emerg Infect Dis 2011;17:7--15.
Silk BJ, Berkelman RL. A review of strategies for enhancing the completeness of notifiable disease reporting. J Public Health Manag Pract 2005;11:191--200.
Vogt RL, Spittle R, Cronquist A, Patnaik JL. Evaluation of the timeliness and completeness of a web-based notifiable disease reporting system by a local health department. J Public Health Manag Pract 2006;12:540--4.
Anthrax
Blackburn JK, McNyset KM, Curtis A, Hugh-Jones ME. Modeling the geographic distribution of Bacillus anthracis, the causative agent of anthrax disease, for the contiguous United States using predictive ecological niche modeling. Am J Trop Med Hyg 2007;77:1103--10.
Hendricks KA, Wright ME, Shadomy SV, et al. Centers for Disease Control and Prevention (CDC) expert panel meetings on prevention and treatment of anthrax in adults. Emerg Infect Dis 2014:20.
Domestic Arboviral Disease, Neuroinvasive and Nonneuroinvasive
CDC. West Nile virus disease and other arboviral diseases---United States, 2012. MMWR 2013;62:513--7.
CDC. Fatal West Nile virus infection following probable transfusion-associated transmission---Colorado, 2012. MMWR 2013;64:622--4.
Gibney KB, Colborn J, Baty S, et al. Modifiable risk factors for West Nile virus infection during an outbreak---Arizona, 2010. Am J Trop Med Hyg 2012;86:895--901.
Lindsey NP, Staples JE, Delorey MJ, Fischer M. Lack of evidence of increased West Nile virus disease severity in the United States in 2012. Am J Trop Med Hyg 2014;90:163--8.
Lindsey NP, Staples JE, Lehman JA, Fischer M. Medical risk factors for severe West Nile virus disease, United States, 2008--2010. Am J Trop Med Hyg 2012;87:179--84.
Lindsey NP, Staples JE, Lehman JA, Fischer M. Surveillance for West Nile virus disease---United States, 1999--2008. MMWR 2010;59:(No. SS-2).
Petersen LR, Fischer M. Unpredictable and difficult to control: West Nile virus enters adolescence. N Engl J Med 2012;367:1281--4.
Reimann CA, Hayes EB, DiGuiseppi C, et al. Epidemiology of neuroinvasive arboviral disease in the United States, 1999--2007. Am J Trop Med Hyg 2008;79:974--79.
Weber I, Lindsey N, Bunko-Patterson A, et al. Completeness of West Nile virus testing among patients with meningitis and encephalitis during an outbreak in Arizona. Epidemiol Infect 2012;140:1632--36.
Babesiosis
CDC. Babesiosis surveillance---18 states, 2011. MMWR 2012;61:505--9.
Herwaldt BL, Linden JV, Bosserman E, et al. Transfusion-associated babesiosis in the United States: a description of cases. Ann Intern Med 2011;155:509--19.
Joseph JT, Purtill K, Wong SJ, et al. Vertical transmission of Babesia microti, United States. Emerg Infect Dis 2012;18:1318--21.
Menis M, Anderson SA, Izurieta HS, et al. Babesiosis among elderly Medicare beneficiaries, United States, 2006--2008. Emerg Infect Dis 2012;18:128--31.
Perez Acosta ME, Ender PT, Smith EM, Jahre JA. Babesia microti infection, eastern Pennsylvania, USA. Emerg Infect Dis 2013;19:1105--7.
Vannier E, Krause PJ. Human babesiosis. N Engl J Med 2012;366:2397--407.
Botulism
Arnon SS, Barzilay EJ. Clostridial infections: botulism and infants. In: Pickering LK, Baker CJ, Kimberlin DW, Long SS, eds. The Red Book: 2009 report of the Committee on Infectious Diseases. Elk Grove Village, NY: American Academy of Pediatrics; 2009:259--62.
Barzilay EJ. Botulism and intestinal botulism. In: DL Heymann, ed. Control of communicable diseases manual. Washington, DC: American Public Health Association Press; 2008.
CDC. Infant botulism---New York City, 2001--2002. MMWR 2003;52:21--4.
Fagan RP, McLaughlin JB, Castrodale LJ, et al. Endemic foodborne botulism among Alaska Native persons---Alaska, 1947--2007. Clin Infect Dis 2011;52:585--92.
Newkirk RW, Hedberg CW. Rapid detection of foodborne botulism outbreaks facilitated by epidemiological linking of cases: implications for food defense and public health response. Foodborne Pathog Dis 2012;9:150--5.
Shapiro RL, Hatheway C, Swerdlow DL. Botulism in the United States: a clinical and epidemiologic review. Ann Intern Med 1998;129:221--8.
Shapiro RL, Hatheway C, Becher J, Swerdlow DL. Botulism surveillance and emergency response: a public health strategy for a global challenge. JAMA 1997;278:433--5.
Botulism SJ. Clin Infect Dis 2005;41:1167--73.
Sobel J, Tucker N, McLaughlin J, Maslanka S. Foodborne botulism in the United States, 1990--2000. Emerg Infect Dis 2004;10:1606--12.
Brucellosis
Ashford DA, di Pietra J, Lingappa J, et al. Adverse events in humans associated with accidental exposure to the livestock brucellosis vaccine RB51. Vaccine 2004;22:3435--9.
CDC. Brucellosis (Brucella melitensis, abortus, suis, and canis). Atlanta, GA: US Department of Health and Human Services; 2012.
CDC. Brucellosis. Atlanta, GA: US Department of Health and Human Services, CDC; 2010. Available at http://www.cdc.gov/nczved/divisions/dfbmd/diseases/brucellosis.
CDC. Brucellosis case definition. Atlanta, GA: US Department of Health and Human Services, CDC; 2010. http://wwwn.cdc.gov/nndss/script/casedef.aspx?CondYrID=625&DatePub=1/1/2010%2012:00:00%20AM.
CDC. Brucella suis infection associated with feral swine hunting---three states, 2007--2008. MMWR 2009;58:618--21.
CDC. Public health consequences of a false-positive laboratory test result for Brucella---Florida, Georgia, and Michigan, 2005. MMWR 2008;57:603--5.
CDC. Laboratory-acquired brucellosis---Indiana and Minnesota, 2006. MMWR 2008;57:39--42.
Chomel BB, DeBess EE, Mangiamele DM, et al. Changing trends in the epidemiology of human brucellosis in California from 1973 to 1992: a shift toward foodborne transmission. J Infect Dis 1994;170:1216--23.
Glynn MK, Lynn TV. Brucellosis. J Am Vet Med Assoc 2008;233:900--8.
Traxler RM, Lehman MW, Bosserman EA, Guerra MA, Smith TL. A literature review of laboratory-acquired brucellosis. J Clin Microbiol 2013;51:3055--62.
Yagupsky P, Baron EJ. Laboratory exposures to Brucellae and implications for bioterrorism. Emerg Infect Dis 2005;11:1180--5.
Chlamydia trachomatis infection
CDC. Sexually transmitted disease surveillance, 2012. Atlanta, GA: US Department of Health and Human Services; 2014.
CDC. Sexually transmitted diseases treatment guidelines, 2010. MMWR 2010;59:(No. RR-12).
Datta SP, Torrone E, Kyuszon-Moran D, et al. Chlamydia trachomatis trends in the United States among persons 14 to 19 years of age, 1999 to 2008. Sex Transm Dis 2012;39:92--6.
Satterwhite CL, Torrone E, Meites E, et al. Sexually transmitted infections among US women andmen: prevalence and incidence estimates, 2008. Sex Transm Dis 2013;40:187--93.
Satterwhite CL, Tian LH, Braxton J, Weinstock H. Chlamydia prevalence among women and men entering the National Job Training Program: United States, 2003--2007. Sex Transm Dis 2010;37:63--7.
Cholera
Besser RE, Feikin DR, Eberhart-Phillips JE, Mascola L, Griffin PM. Diagnosis and treatment of cholera in the United States. Are we prepared? JAMA 1994;272:1203--5.
Newton AE, Heiman KE, Schmitz A, et al. Cholera in United States associated with epidemic in Hispaniola. Emerg Infect Dis 2011;17:2166--8.
Siddique AK, Nair GB, Alam M, et al. El Tor cholera with severe disease: a new threat to Asia and beyond. Epidemiol Infect 2010;138:347--52.
Steinberg EB, Greene KD, Bopp CA, et al. Cholera in the United States, 1995--2000: trends at the end of the twentieth century. J Infect Dis 2001;184:799--802.
Tappero J, Tauxe RV. Lessons learned during public health response to cholera epidemic in Haiti and the Dominican Republic. Emerg Infect Dis 2011;17:2087--93.
World Health Organization. Cholera, 2012. Wkly Epidemiol Rec 2013;88:321--36.
Coccidioidomycosis
Chen S, Erhart L, Anderson S, et al. Coccidioidomycosis: knowledge, attitudes, and practices among healthcare providers---Arizona, 2007. Med Mycol 2011;49:649--56.
Huang JY, Bristow B, Shafir S, Sorvillo F. Coccidioidomycosis-associated deaths, United States, 1990--2008. Emerg Infect Dis 2012;18:1723--8.
Marsden-Haug N, Goldoft M, Ralston C, et al. Coccidioidomycosis acquired in Washington State. Clin Infect Dis 2012;56:847--50.
Cryptosporidiosis
CDC. Cryptosporidiosis surveillance---United States, 2009--2010. MMWR 2012;61:1--12.
CDC. Diagnostic procedures for stool specimens. Atlanta, GA: US Department of Health and Human Services, CDC; 2009. Available at http://www.dpd.cdc.gov/dpdx/HTML/DiagnosticProcedures.htm.
Hlavsa MC, Roberts VA, Anderson AR, et al. Surveillance for waterborne disease outbreaks and other health events associated with recreational water---United States, 2007--2008. MMWR 2011;60:1--32.
Roy SL, DeLong SM, Stenzel S, et al. Risk factors for sporadic cryptosporidiosis among immunocompetent persons in the United States from 1999 to 2001. J Clin Microbiol 2004;42:2944--51.
Yoder JS, Beach MJ. Cryptosporidium surveillance and risk factors in the United States. Exp Parasitol 2010;124:31--9.
Cyclosporiasis
Hall RL, Jones JL, Hurd S, et al. Population-based active surveillance for Cyclospora infection---United States, Foodborne Diseases Active Surveillance Network (FoodNet), 1997--2009. Clin Infect Dis 2012;54:S411--7.
Hall RL, Jones JL, Herwaldt BL. Surveillance for laboratory-confirmed sporadic cases of cyclosporiasis---United States, 1997--2008. MMWR 2011;60:(No. SS-2).
Herwaldt BL. The ongoing saga of U.S. outbreaks of cyclosporiasis associated with imported fresh produce: what Cyclospora cayetanensis has taught us and what we have yet to learn. In: Institute of Medicine. Addressing foodborne threats to health: policies, practices, and global coordination. Washington, DC: The National Academies Press; 2006:85--115, 133--40.
Herwaldt BL. Cyclospora cayetanensis: a review, focusing on the outbreaks of cyclosporiasis in the 1990s. Clin Infect Dis 2000;31:1040--57.
Ortega YR, Sanchez R. Update on Cyclospora cayetanensis, a food-borne and waterborne parasite. Clin Microbiol Rev 2010;23:218--34.
Ehrlichiosis and Anaplasmosis
Banatvala N, Griffin PM, Greene KD, et al. The United States prospective hemolytic uremic syndrome study: microbiologic, serologic, clinical, and epidemiologic findings. J Infect Dis 2001;183:1063--70.
CDC. Diagnosis and management of tickborne rickettsial diseases: Rocky Mountain spotted fever, ehrlichioses, and anaplasmosis---United States. MMWR 2006;55:(No. RR-4).
Dahlgren FS, Mandel EJ, Krebs JW, Massung RF, McQuiston JH. Increasing incidence of Ehrlichia chaffeensis and Anaplasma phagocytophilum in the United States, 2000--2007. Am J Trop Med Hyg 2011;85:124--31.
Dumler JS, Madigan JE, Pusterla N, Bakken JS. Ehrlichioses in humans: epidemiology, clinical presentation, diagnosis, and treatment. Clin Infect Dis 2007;45(Suppl 1):545--51.
Regan J, Matthias J, Green-Murphy A, et al. A confirmed Ehrlichia ewingii infection likely acquired through platelet transfusion. Clin Infect Dis 2013;56:E105--7.
Walker D. Rickettsiae and rickettsial infections: the current state of knowledge. Clin Infect Dis 2007;45(Suppl 1):539--44.
Giardiasis
Brunkard JM, Ailes E, Roberts VA, et al. Surveillance for waterborne disease outbreaks associated with drinking water---United States, 2007--2008. MMWR 2011;60:(No. SS-12).
Cantey PT, Roy S, Lee B, et al. Study of nonoutbreak giardiasis: novel findings and implications for research. Am J Med 2011;124:1175.e1--8.
Clinical and Laboratory Standards Institute. Procedures for the recovery and identification of parasites from the intestinal tract; approved guideline. CLSI document M28--A2 Second Edition ed. Wayne, PA: Clinical and Laboratory Standards Institute; 2005.
Yoder JS, Gargano JY, Wallace RM, Beach MJ. Giardiasis surveillance---United States, 2009--2010. MMWR 2012;61:(No. SS-5).
Gonorrhea
CDC. Sexually transmitted disease surveillance, 2012. Atlanta, GA: US Department of Health and Human Services; 2014.
CDC. Update to CDC’s sexually transmitted diseases treatment guidelines, 2010: oral cephalosporins no longer a recommended treatment for gonococcal infections. MMWR 2012;61:590--4.
CDC. Sexually transmitted diseases treatment guidelines, 2010. MMWR 2010;59:(No. RR-12).
Torrone ES, Johnson RE, Tian LH, et al. Prevalence of Neisseria gonorrhoeae among persons 14 to 39 years of age, United States, 1999 to 2008. Sex Transm Dis 2013;40:202--5.
Hansen Disease (leprosy)
Britton WJ, Lockwood NJ. Leprosy. Lancet 2004;363:1209--19.
Bruce S, Schroeder TL, Ellner K, et al. Armadillo exposure and Hansen’s disease: an epidemiologic survey in southern Texas. J Am Acad Dermatol 2000;43:223--8.
Hartzell JD, Zapor M, Peng S, Straight T. Leprosy: a case series and review. South Med J 2004;97:1252--6.
Hastings R, editor. Leprosy. 2nd ed. New York, NY: Churchill Livingstone; 1994.
Joyce MP, Scollard DM. Leprosy (Hansen’s disease). In: Rakel RE, Bope ET, eds. Conn’s current therapy 2004: latest approved methods of treatment for the practicing physician. 56th ed. Philadelphia, PA: Saunders; 2004:100--5.
Ooi WW, Moschella SL. Update on leprosy in immigrants in the United States: status in the year 2000. Clin Infect Dis 2001;32:930--7.
Scollard DM, Adams LB, Gillis TP, et al. The continuing challenges of leprosy. Clin Microbiol Rev 2006;19:338--81.
Hantavirus pulmonary syndrome
CDC. Hantavirus pulmonary syndrome---United States: updated recommendations for risk reduction. MMWR 2002;51:(No. RR-9).
Khan AS, Khabbaz RF, Armstrong LR, et al. Hantavirus pulmonary syndrome---the first 100 US cases. J Infect Dis 1996;173:1297--303.
Knust B, Rollin PE. Twenty-year summary of surveillance for human hantavirus infections, United States. Emerg Infect Dis 2013:1934--7.
MacNeil A, Ksiazek TG, Rollin PE. Hantavirus pulmonary syndrome, United States, 1993--2009. Emerg Infect Dis 2011;17:1195--201.
MacNeil A, Nichol ST, Spiropoulou CF. Hantavirus pulmonary syndrome. Virus Res 2011;162:138--47.
Hepatitis
Klevens RM, Hu D, Jiles R, Holmberg SD. Evolving epidemiology of hepatitis C virus in the United States. Clin Infect Dis 2012;55:S3--9.
Moorman AC, Gordon SC, Rupp LB, et al. Baseline characteristics and mortality among people in care for chronic viral hepatitis: the chronic hepatitis cohort study. Clin Infect Dis 2013;56:40--50.
Holmberg SD. Emerging epidemic of hepatitis C in young nonurban injection drug users (IDU). Presented at: report on technical consultation. Hepatitis C virus infection in young persons who inject drugs. Washington, DC, February 26--27, 2013. Silver Spring, MD: US Department of Health and Human Services, FDA; 2013. Available at http://aids.gov/pdf/hcv-and-young-pwid-consultation-report.pdf.
US Food and Drug Administration. FDA approves rapid test for antibodies to hepatitis C virus. News and events Silver Springs, MD: US Department of Health and Human Services, FDA; 2013. Available at http://www.fda.gov/NewsEvents/Newsroom/PressAnnouncements/ucm217318.htm.
Hemoylitic Uremic Syndrome
Gould L, Demma L, Jones TF, et al. Hemolytic uremic syndrome and death in persons with Escherichia coli O157:H7 infection, Foodborne Diseases Active Surveillance Network Sites, 2000--2006. Clin Infect Dis 2009;49:1480--5.
Mody RK, Luna-Gierke RE, Jones TF, et al. Infections in pediatric postdiarrheal hemolytic uremic syndrome: factors associated with identifying shiga toxin-producing Escherichia coli. Arch Pediatr Adolesc Med 2012;166:902--9.
Ong KL, Apostal M, Comstock N, et al. Strategies for surveillance of pediatric hemolytic uremic syndrome: Foodborne Diseases Active Surveillance Network (FoodNet), 2000--2007. Clin Infect Dis 2012;54(Suppl 5):S424--31.
Tarr PI, Gordon CA, Chandler WL. Shiga toxin-producing Escherichia coli and haemolytic uraemic syndrome. Lancet 2005;365:1073--86.
Influenza-Associated Pediatric Mortality
Bhat N, Wright JG, Broder KR, et al. Influenza-associated deaths among children in the United States, 2003--2004. N Engl J Med 2005;
352:2559--67.
Blanton L, Peacock G, Cox CM, et al. Neurologic disorders among pediatric deaths associated with the 2009 pandemic influenza. Pediatrics 2012;130:390--6.
CDC. Update: Influenza-associated deaths reported among children aged <18 years---United States, 2003--04 influenza season. MMWR 2004;52:1254--5.
CDC. Update: influenza-associated deaths reported among children aged <18 years---United States, 2003--04 influenza season. MMWR 2004;52:1286--8.
CDC. Mid-year addition of influenza-associated pediatric mortality to the list of nationally notifiable diseases, 2004. MMWR 2004;53:951--2.
CDC. Prevention and control of influenza: recommendations of the Advisory Committee on Immunization Practices (ACIP). MMWR 2011;60:1128--32.
Legionellosis
CDC. Legionellosis---United States, 2000--2009. MMWR 2011;60:1083--6.
CDC. Surveillance for waterborne disease outbreaks associated with drinking water and other nonrecreational water---United States, 2009--20010. MMWR 2013;62:714--20.
CDC. Surveillance for waterborne disease outbreaks and other health events associated with recreational water---United States, 2007--2008. MMWR 2011;60:1--32.
CDC. Surveillance for travel-associated legionnaires’ disease---United States, 2005--2006. MMWR 2007;56:1261--3.
European Centre for Disease Prevention and Control. Legionnaires disease in Europe, 2011. Stockholm, Sweden: ECDC; 2013. Available at http://ecdc.europa.eu/en/publications/publications/legionnaires-disease-in-europe-2011.pdf.
European Working Group on Legionella Infections (EWGLI). EWGLI technical guidelines for the investigation, control, and prevention of travel associated Legionnaires’ disease. Stockholm, Sweden: ECDC; 2011. Available at http://ecdc.europa.eu/en/activities/surveillance/ELDSNet/Documents/EWGLI-Technical-Guidelines.pdf.
Fields BS, Benson RF, Besser RE. Legionella and Legionnaires’ disease: 25 years of investigation. Clin Microbiol Rev 2002;15:506--26.
Marston BJ, Lipman HB, Breiman RF. Surveillance for Legionnaires’ disease: risk factors for morbidity and mortality. Arch Intern Med 1994;154:2417--22.
Neil K, Berkelman R. Increasing incidence of legionellosis in the United States: changing epidemiological trends. Clin Infect Dis 2008;47:591--9.
Listeriosis
Cartwright EJ, Jackson KA, Johnson SD, et al. Listeriosis outbreaks and associated food vehicles, United States, 1998--2008. Emerg Infect Dis 2013;19:1--9.
CDC. Vital signs: Listeria illnesses, deaths, and outbreaks---United States, 2009--2011. MMWR 2013;62:448--52.
Gaul LK, Farag FH, Shim T, et al. Hospital-acquired listeriosis outbreak caused by contaminated diced celery---Texas, 2010. Clin Infect Dis 2013;56:20--6.
Jackson KA, Biggerstaff M, Tobin-D’Angelo M, et al. Multistate outbreak of Listeria monocytogenes associated with Mexican-style cheese made from pasteurized milk among pregnant, Hispanic women. J Food Prot 2011;74:949--53.
Jackson KA, Iwamoto M, Swerdlow DL. Pregnancy-associated listeriosis. Epidemiol Infect 2010;138:1503--9.
Laksanalamai P, Joseph LA, Silk BJ, et al. Genomic characterization of Listeria monocytogenes strains involved in a multistate listeriosis outbreak associated with cantaloupe in US. PLoS ONE 2012;7:e42448.
McCollum JT, Cronquist AB, Silk BJ, et al. Multistate outbreak of listeriosis associated with cantaloupe. N Engl J Med 2013;639:944--53.
Pouillot R, Hoelzer K, Jackson KA, et al. Relative risk of listeriosis in Foodborne Diseases Active Surveillance Network (FoodNet) sites according to age, pregnancy, and ethnicity. Clin Infect Dis 2012;54:S396--404.
Scallan E, Hoekstra RM, Angulo FJ, et al. Foodborne illness acquired in the United States---major pathogens. Emerg Infect Dis 2011;17:7--15.
Silk BJ, Date KA, Jackson KA, et al. Invasive listeriosis in the Foodborne Diseases Active Surveillance Network (FoodNet), 2004--2009: further targeted prevention needed for higher-risk groups. Clin Infect Dis 2012;54:S405--10.
Lyme disease
Bacon RM, Kugeler KJ, Mead PS. Surveillance for Lyme disease---United States, 1992--2006. MMWR 2008;57:(No. SS-10).
CDC. Caution regarding testing for Lyme disease. MMWR 2005;54:125.
Connally NP, Durante AJ, Yousey-Hindes KM, et al. Peridomestic Lyme disease prevention: results of a population-based case-control study. Am J Prev Med 2009;37:201--6.
Hayes EG, Piesman J. How can we prevent Lyme disease? N Engl J Med 2003;348:2424--30.
Stafford KC III. Tick management handbook: an integrated guide for homeowners, pest control operators, and public health officials for the prevention of tick-associated disease. New Haven, CT: Connecticut Agricultural Experiment Station; 2004. http://www.ct.gov/caes/lib/caes/documents/publications/bulletins/b1010.pdf.
Wormser GP, Dattwyler RJ, Shapiro ED, et al. The clinical assessment, treatment, and prevention of Lyme disease, human granulocytic, anaplasmosis, and babesiosis: clinical practice guidelines by the Infectious Disease Society of America. Clin Infect Dis 2006;43:1089--134.
Malaria
Abanyie FA, Agguin PM, Gutman J. State of malaria diagnostic testing at clinical laboratories in the United States, 2010: a nationwide survey. Malar J 2011;10:340.
Jensenius M, Han PV, Schlagenhauf P, et al. Acute and potentially life-threatening tropical diseases in western travelers---a GeoSentinel multicenter study, 1996--2011. Am J Trop Med 2013;88:397--404.
Krause G, Schoneberg I, Altmann D, Stark K. Chemoprophylaxis and malaria death rates. Emerg Infect Dis 2006;12:447--51.
Mali S, Kachur SP, Arguin PM. Malaria surveillance---United States, 2010. MMWR 2012;61:(No. SS-2).
Measles
CDC. Hospital-associated measles outbreak---Pennsylvania, March--April 2009. MMWR 2012;61:30--2.
Parker Fiebelkorn A, Uzicanin A. Measles (rubeola). In: The yellow book: CDC health information for international travel, 2012. New York, NY: Oxford University Press; 2012.
Meningococcal disease
CDC. Prevention and control of meningococcal disease: recommendations of the Advisory Committee on Immunization Practices (ACIP). MMWR 2013;62:(No. RR-2).
Cohn AC, MacNeil JR, Harrison LH, et al. Changes in Neisseria meningitidis disease epidemiology in the United States, 1998--2007: implications for prevention of meningococcal disease. Clin Infect Dis 2010;50:184--91.
Rosenstein NE, Perkins BA, Stephens DS, et al. Meningococcal disease. N Engl J Med 2001;334:1378--88.
Mumps
Barskey AE, Schulte C, Rosen JB, et al. Mumps outbreak in Orthodox Jewish communities in the United States. N Engl J Med 2012;367:1704--13.
Pertussis
CDC. Pertussis epidemic---Washington, 2012. MMWR 2012;61:517--22.
CDC. Updated recommendations for use of tetanus toxoid, reduced diphtheria toxoid and acellular pertussis (Tdap) vaccine in adults aged 65 years and older---Advisory Committee on Immunization Practices (ACIP), 2012. MMWR 2012;61:468--70.
CDC. Updated recommendations for use of tetanus toxoid, reduced diphtheria toxoid, and acellular pertussis vaccine (Tdap) in pregnant women---Advisory Committee on Immunization Practices (ACIP), 2012. MMWR 2013;62:131--5.
Clark TA, Messonnier NE, Hadler SC. Pertussis control: time for something new? Trends Microbiol 2012;20:211--3.
Misegades LK, Winter K, Harriman K, et al. Association of childhood pertussis with receipt of 5 doses of pertussis vaccine by time since last vaccine dose, California, 2010. JAMA 2012;308:2126--32.
Plague
CDC. Human plague---four states, 2006. MMWR 2006;55:940--3.
Dennis DT, Gage KL, Gratz N, Poland JD, Tikhomirov E. Plague manual: epidemiology, distribution, surveillance, and control. Geneva, Switzerland: World Health Organization; 1999.
Gould LH, Pape J, Ettestadt P, et al. Dog-associated risk factors for human plague. Zoonoses Public Health 2008;55:448--54.
Inglesby TV, Dennis DT, Henderson DA, et al. Plague as a biological weapon: medical and public health management. Working Group on Civilian Defense. JAMA 2000;283:2281--90.
Tourdjman M, Ibraheem M, Brett M, et al. Misidentification of Yersinia pestis by automated systems resulting in delayed diagnosis of human plague infections---Oregon and New Mexico, 2010--2011. Clin Infect Dis 2012;55:e58--60.
Polio
Alexander JP, Wallace G, Wassilak SG. Poliomyelitis. In: The yellow book: CDC health information for international travel, 2012. New York, NY: Oxford University Press; 2012.
Q Fever
Anderson A, Bijlmer H, Fournier PE, et al. Diagnosis and management of Q Fever---United States, 2013 recommendations from CDC and the Q Fever working group. MMWR 2013;62:1--28.
Angelakis E, Raoult D. Q fever. Vet Micro 2010;140:2--309.
Kersh GJ, Fitzpatrick KA, Self JS, et al. Presence and persistence of Coxiella burnetii in the environments of goat farms associated with a Q fever outbreak. Appl Environ Microbiol 2013;79:1697--703.
McQuiston JH, Holman RC, McCall CL, et al. National surveillance and the epidemiology of Q fever in the United States, 1978--2004. Am J Trop Med Hyg 2006;75:36--40.
Parker N, Barralet J, Bell A. Q fever. Lancet 2006;367:679--88.
Tissot-Dupont D, Raoult D. Q fever. Infect Dis Clin North Am 2008;22:505--14.
Rabies
CDC. Compendium of animal rabies prevention and control, 2011: National Association of State Public Health Veterinarians, Inc. MMWR 2011;60:1--14.
CDC. Use of a reduced (4-dose) vaccine schedule for postexposure prophylaxis to prevent human rabies: recommendations of the Advisory Committee on Immunization Practices. MMWR 2010;59:1--9.
CDC. Human rabies prevention---United States, 2008: recommendation of the Advisory Committee on Immunization Practices (ACIP). MMWR 2008;57:1--28.
Salmonellosis
Chai SJ, White PL, Lathrop SL, et al. Salmonella enterica serotype Enteritidis: increasing incidence of domestically acquired infections. Clin Infect Dis 2012;54(Suppl 5):S488--97.
Cronquist AB, Mody RK, Atkinson R, et al. Impacts of culture-independent diagnostic practices on public health surveillance for bacterial enteric pathogens. Clin Infect Dis 2012;54(Suppl 5):S432--9.
Gaffga NH, Barton Behravesh C, Ettestad PJ, et al. Outbreak of salmonellosis linked to live poultry from a mail-order hatchery. N Engl J Med 2012;366:2065--73.
Guo C, Hoekstra RM, Schroeder CM, et al. Application of Bayesian techniques to model the burden of human salmonellosis attributable to US food commodities at the point of processing: adaptation of a Danish model. Foodborne Pathog Dis 2011;8:509--16.
Jackson BR, Griffin PM, Cole D, Walsh KA, Chai SJ. Outbreak-associated Salmonella enterica serotypes and food Commodities, United States, 1998--2008. Emerg Infect Dis 2013;19:1239--44.
Jones TF, Ingram LA, Cieslak PR, et al. Salmonellosis outcomes differ substantially by serotype. J Infect Dis 2008;198:109--14.
Jones TF, Gerner-Smidt P. Nonculture diagnostic tests for enteric diseases. Emerg Infect Dis 2012;18:513--4.
Majowicz SE, Musto J, Scallan E, et al. The global burden of nontyphoidal Salmonella gastroenteritis. Clin Infect Dis 2010;50:882--9.
Medalla F, Hoekstra RM, Whichard JM, et al. Increase in resistance to ceftriaxone and nonsusceptibility to ciprofloxacin and decrease in multidrug resistance among Salmonella strains, United States, 1996--2009. Foodborne Pathog Dis 2013;10:302--9.
Mody RK, Meyer S, Trees E, et al. Outbreak of Salmonella enterica serotype I 4,5,12:i:- infections: the challenges of hypothesis generation and microwave cooking. Epidemiol Infect 2013;142:1--11.
Olsen SJ, Bishop R, Brenner FW, et al. The changing epidemiology of Salmonella: trends in serotypes isolated from humans in the United States, 1987--1997. J Infect Dis 2001;183:756--61.
Painter JA, Hoekstra RM, Ayers T, et al. Attribution of foodborne illnesses, hospitalizations, and deaths to food commodities by using outbreak data, United States, 1998--2008. Emerg Infect Dis 2013;19:407--15.
Scallan E, Hoekstra RM, Angulo FJ, et al. Foodborne illness acquired in the United States---major pathogens. Emerg Infect Dis 2011;17:7--15.
Scallan E, Mahon BE, Hoekstra RM, Griffin PM. Estimates of illnesses, hospitalizations and deaths caused by major bacterial enteric pathogens in young children in the United States. Pediatr Infect Dis J 2013;32:217--21.
Sjolund-Karlsson M, Howie R, Krueger A, et al. CTX-M-producing non-Typhi Salmonella spp. isolated from humans, United States. Emerg Infect Dis 2011;17:97--9.
Shigellosis
CDC. Notes from the field: emergence of Shigella flexneri 2a resistant to ceftriaxone and ciprofloxacin---South Carolina, October 2010. MMWR 2010;59:1619.
CDC. Notes from the field: outbreak of infections caused by Shigella sonnei with decreased susceptibility to azithromycin---Los Angeles, California, 2012. MMWR 2013;62:171.
Garrett V, Bornschlegel K, Lange D, et al. A recurring outbreak of Shigella sonnei among traditionally observant Jewish children in New York City: the risks of daycare and household transmission. Epidemiol Infect 2006;134:1231--6.
Gupta A, Polyak CS, Bishop RD, Sobel J, Mintz ED. Laboratory-confirmed shigellosis in the United States, 1989--2002: epidemiologic trends and patterns. Clin Infect Dis 2004;38:1372--7.
Folster JP, Pecic G, Bowen A, et al. Decreased susceptibility to ciprofloxacin among Shigella isolates in the United States, 2006 to 2009. Antimicrob Agents Chemother 2011;55:1758--60.
Haley CC, Ong KL, Hedberg K, et al. Risk factors for sporadic shigellosis, FoodNet 2005. Foodborne Pathog Dis 2010;7:741--7.
Howie RL, Folster JP, Bowen A, et al. Reduced azithromycin susceptibility in Shigella sonnei, United States. Microb Drug Resist 2010;16:245--8. Published online 2010 Jul 12.
Nygren B, Schilling K, Blanton E, et al. Foodborne outbreaks of shigellosis in the USA, 1998--2008. Epidemiol Infect 2012;141:1--9.
Scallan E, Mahon BE, Hoekstra RM, Griffin PM. Estimates of illnesses, hospitalizations and deaths caused by major bacterial enteric pathogens in young children in the United States. Pediatr Infect Dis J 2013;32:217--21.
Wallender EK, Ailes EC, Yoder JS, Roberts VA, Brunkard JM. Contributing factors to disease outbreaks associated with untreated groundwater. Ground Water 2013:10.1111/gwat.12121[Epub ahead of print].
Spotted Fever Rickettsiosis (Including Rocky Mountain Spotted Fever)
CDC. Diagnosis and management of tickborne rickettsial diseases: Rocky Mountain spotted fever, ehrlichioses, and anaplasmosis---United States. MMWR 2006;55:(No. RR-4).
Dahlgren FS, Holman RC, Paddock CD, Callinan LS, McQuiston JH. Fatal Rocky Mountain spotted fever in the United States, 1999--2007. Am J Trop Med Hyg 2012;86:713--9.
Demma LJ, Traeger MS, Nicholson WL, et al. Rocky Mountain spotted fever from an unexpected tick reservoir in Arizona. N Engl J Med 2005;353:587--94.
Openshaw JJ, Swerdlow DL, Krebs JW, et al. Rocky Mountain spotted fever in the United States, 2000--2007: interpreting contemporary increases in incidence. Am J Trop Med Hyg 2010;83:174--82.
Walker D. Rickettsiae and rickettsial infections: the current state of knowledge. Clin Infect Dis 2007;45(Suppl 1):539--44.
Zientek J, Dahlgren FS, McQuiston JH, Regan J. Self-reported treatment practices by healthcare providers could lead to death from Rocky Mountain spotted fever. J Pediatr 2013;2014:416--8.
Shiga toxin-producing E. coli
Brooks JT, Sowers EG, Wells JB, et al. Non-O157 Shiga toxin-producing Escherichia coli infections in the United States, 1983--2002. J Infect Dis 2005;192:1422--9.
Cronquist AB, Mody RK, Atkinson R, et al. Impacts of culture-independent diagnostic practices on public health surveillance for bacterial enteric pathogens. Clin Infect Dis 2012;54(Suppl 5):S432--9.
Gould LH, Mody RK, Ong KL; Emerging Infections Program Foodnet Working Group. Increased recognition of non-O157 Shiga toxin-producing Escherichia coli infections in the United States during 2000--2010: epidemiologic features and comparison with E. coli O157 infections. Foodborne Pathog Dis 2013;10:453--60.
Hadler JL, Clogher P, Hurd S, et al. Ten-year trends and risk factors for non-O157 shiga toxin-producing Escherichia coli found through shiga toxin testing, Connecticut, 2000--2009. Clin Infect Dis 2011;53:269--76.
Hale CR, Scallan E, Cronquist AB, et al. Estimates of enteric illness attributable to contact with animals and their environments in the United States. Clin Infect Dis 2012;54(Suppl 5):S472--9.
Hedican EB, Medus C, Besser JM, et al. Characteristics of O157 versus non-O157 shiga toxin-producing Escherichia coli infections in Minnesota, 2000--2006. Clin Infect Dis 2009;49:358--64.
Jones TF, Gerner-Smidt P. Nonculture diagnostic tests for enteric diseases. Emerg Infect Dis 2012r;18:513--4.
Lathrop S, Edge K, Bareta J, et al. Shiga toxin--producing Escherichia coli, New Mexico, USA. Emerg Infect Dis 2004--2007;15:1289.
McCollum JT, Williams NJ, Beam SW, et al. Multistate outbreak of Escherichia coli O157:H7 infections associated with in-store sampling of an aged raw-milk Gouda cheese, 2010. J Food Prot 2012;75:1759--65.
Mody RK, Luna-Gierke RE, Jones TF, et al. Infections in pediatric postdiarrheal hemolytic uremic syndrome: factors associated with identifying shiga toxin-producing Escherichia coli. Arch Pediatr Adolesc Med 2012;166:902--9.
Slayton RB, Turabelidze G, Bennett SD, et al. Outbreak of Shiga toxin-producing Escherichia coli (STEC) O157:H7 associated with romaine lettuce consumption, 2011. PLoS ONE 2013;8:e55300.
Tarr PI, Gordon CA, Chandler WL. Shiga-toxin-producing Escherichia coli and haemolytic uraemic syndrome. Lancet 2005;365:1073--86.
Streptococcal Toxic Shock Syndrome
CDC. Active bacterial core surveillance report, Emerging Infections Program Network, Group A Streptococcus, 2012. Atlanta, GA: US Department of Health and Human Services, CDC; 2012. Available at http://www.cdc.gov/abcs/reports-findings/survreports/gas12.pdf.
CDC. Investigating clusters of group A streptococcal disease. Atlanta, GA: US Department of Health and Human Services, CDC; 2009. Available at www.cdc.gov/strepAcalculator.
Dale JB, Fischetti VA, Carapatis JR, et al. Group A streptococcal vaccines: Paving a path for accelerated development. Vaccine 2013;31S:B216--22.
O’Loughlin RE, Roberson A, Cieslak PR, et al. The epidemiology of invasive group A streptococcal infections and potential vaccine implications, United States, 2000--2004. Clin Infect Dis 2007;45:853--62.
Prevention of Invasive Group A Streptococcal Infections Workshop Participants. Prevention of invasive group A streptococcal disease among household contacts of case patients among postpartum and postsurgical patients: recommendations from the Centers for Disease Control and Prevention. Clin Infect Dis 2002;35:950--9.
Syphilis, Primary and Secondary
CDC. Sexually transmitted disease surveillance, 2012. Atlanta, GA: US Department of Health and Human Services; 2014.
Su JR, Beltrami JF, Zaidi AA, Weinstock HS. Primary and secondary syphilis among black and Hispanic men who have sex with men: case report data from 27 states. Ann Intern Med 2011;155:145--51.
Trichinellosis
Gamble HR, Bessonov AS, Cuperlovic K, et al. International Commission on Trichinellosis: recommendations on methods for the control of Trichinella in domestic and wild animals intended for human consumption. Vet Parasitol 2000;93:393--408.
Gottstein B, Pozio E, Nockler K. Epidemiology, diagnosis, treatment, and control of trichinellosis. Clin Microbiol 2009;22:127--45.
Hall RL, Lindsay A, Hammond C, et al. Outbreak of human trichinellosis in Northern California caused by Trichinella murrelli. Am J Trop Med Hyg 2012;87:297--302.
Kennedy ED, Hall RL, Montgomery SP, Pyburn DG, Jones JL. Trichinellosis surveillance---United States, 2002--2007. MMWR 2009;58:1--7.
Roy SL, Lopez AS, Schantz PM. Trichinellosis surveillance---United States, 1997--2001. MMWR 2003;52:1--8.
Tularemia
CDC. Tularemia---United States, 2001--2010. MMWR 2013;62:963--6.
CDC. Tularemia---United States, 1990--2000. MMWR 2002;51:182--4.
Dennis DT, Inglesby TV, Henderson DA, et al. Tularemia as a biological weapon: medical and public health management. JAMA 2001;285:2763--73.
Kugeler KJ, Mead PS, Janusz AM, et al. Molecular epidemiology of Francisella tularensis in the United States. Clin Infect Dis 2009;48:863--70.
Tarnvik A. WHO Guidelines on Tularemia. Vol. WHO/CDS/EPR/2007.7. Geneva, Switzerland: World Health Organization; 2007.
Weber IB, Turabelidze G, Patrick S, et al. Clinical recognition and management of tularemia in Missouri: a retrospective records review of 121 cases. Clin Infect Dis 2012;55:1283--90.
Typhoid Fever
Loharikar A, Newton A, Rowley P, et al. Typhoid fever outbreak associated with frozen mamey pulp imported from Guatemala to the western United States, 2010. Clin Infect Dis 2012;55:61--6.
Lynch MF, Blanton EM, Bulens S, et al. Typhoid fever in the United States, 1999--2006. JAMA 2009;302:898--9.
Olsen SJ, Bleasdale SC, Magnano AR, et al. Outbreaks of typhoid fever in the United States, 1960--1999. Epidemiol Infect 2003;130:13--21.
Steinberg EB, Bishop RB, Dempsey AF, et al. Typhoid fever in travelers: who should be targeted for prevention? Clin Infect Dis 2004;39:186--91.
Varicella
Bialek SR, Perella D, Zhang J, et al. Impact of a routine two-dose varicella vaccination program on varicella epidemiology. Pediatrics 2013;132:e1134--40.
CDC. Prevention of varicella: recommendations of the Advisory Committee on Immunization Practices (ACIP). MMWR 2007;56:(No. RR-4).
CDC. Evolution of varicella surveillance---selected states, 2000--2010. MMWR 2012;61:609--12.
Lopez AS, Zhang J, Brown C, Bialek S. Varicella-related hospitalizations in the United States, 2000--2006: the 1-dose varicella vaccination era. Pediatrics 2011;127:238--45.
Marin M, Zhang JX, Seward JF. Near elimination of varicella deaths in the US after implementation of the vaccination program. Pediatrics 2011;128:214--20.
Vibriosis
CDC. Vibrio mimicus infection from consuming crayfish---Spokane, Washington. MMWR 2010;59:1374.
Daniels NA, MacKinnon L, Bishop R, et al. Vibrio parahaemolyticus infections in the United States, 1973--1998. J Infect Dis 2000;181:1661--6.
Dechet A, Yu PA, Koram N, Painter J. Nonfoodborne Vibrio infections: an important cause of morbidity and mortality in the United States, 1997--2006. Clin Infect Dis 2008;46:970--6.
McLaughlin JB, DePaola A, Bopp CA, et al. Outbreak of Vibrio parahaemolyticus gastroenteritis associated with Alaskan oysters. N Engl J Med 2005;353:1463--70.
Newton A, Kendall M, Vugia DJ, Henao OL, Mahon BE. Increasing rates of vibriosis in the United States, 1996--2010: review of surveillance data from 2 systems. Clin Infect Dis 2012;54(Suppl 5):S391--5.
Shapiro RL, Altekruse S, Hutwagner L, et al. The role of Gulf Coast oysters in warmer months in Vibrio vulnificus infections in the United States, 1998--1996. J Infect Dis 1998;178:752--9.
Viral Hemorrhagic Fevers
Amorosa V, MacNeil A, McConnell R, et al. Imported Lassa fever, Pennsylvania, USA, 2010. Emerg Infect Dis 2010;16:1598--600.
CDC. Imported case of Marburg Hemorrhagic fever---Colorado, 2008. MMWR 2009;58:1377--81.
Ergonul O. Crimean-Congo Haemorrhagic Fever. Lancet 2006;6:203--14.
Fichet-Calvet E, Rogers DJ. Risk maps of Lassa fever in West Africa. PLoS Negl Trop Dis 2009;3:e388.
Rollin PE, Nichol ST, Zaki S, Ksiazek TG. Arenaviruses and filoviruses. In: Murray PR, Baron EJ, Landry ML, Jorgensen JH, Pfaller MA, eds. Manual of clinical microbiology, 9th edition. Washington, DC: ASM Press; 2007:1510--22.
Use of trade names and commercial sources is for identification only and does not imply endorsement by the U.S. Department of
Health and Human Services.
References to non-CDC sites on the Internet are
provided as a service to MMWR readers and do not constitute or imply
endorsement of these organizations or their programs by CDC or the U.S.
Department of Health and Human Services. CDC is not responsible for the content
of pages found at these sites. URL addresses listed in MMWR were current as of
the date of publication.
All MMWR HTML versions of articles are electronic conversions from typeset documents.
This conversion might result in character translation or format errors in the HTML version.
Users are referred to the electronic PDF version (http://www.cdc.gov/mmwr)
and/or the original MMWR paper copy for printable versions of official text, figures, and tables.
An original paper copy of this issue can be obtained from the Superintendent of Documents, U.S.
Government Printing Office (GPO), Washington, DC 20402-9371;
telephone: (202) 512-1800. Contact GPO for current prices.
**Questions or messages regarding errors in formatting should be addressed to
mmwrq@cdc.gov.
