|
TABLE 1. National surveillance case definitions for cyclosporiasis --- 1996, 1998, and 2010* |
|||
|---|---|---|---|
|
Characteristic |
1996 |
1998 |
2010† |
|
Clinical description |
An illness of variable severity caused by the protozoan Cyclospora cayetanensis and commonly characterized by watery diarrhea, loss of appetite, weight loss, abdominal bloating and cramping, increased flatus, nausea, fatigue, and low-grade fever. Vomiting also may be noted. Relapses and asymptomatic infections can occur. |
(unchanged from 1996) |
An illness of variable severity caused by the protozoan parasite Cyclospora cayetanensis. The most common symptom is watery diarrhea. Other common symptoms include loss of appetite, weight loss, abdominal cramps/bloating, nausea, body aches, and fatigue. Vomiting and low-grade fever also might be noted. |
|
Laboratory criteria for diagnosis |
Demonstration of Cyclospora oocysts (by morphologic criteria or by demonstration of sporulation) or Cyclospora DNA (by polymerase chain reaction) in stool, duodenal/jejunal aspirates, or small-bowel biopsy specimens |
Detection in symptomatic or asymptomatic persons of Cyclospora: • oocysts in stool (by microscopic examination) or in intestinal fluid or small bowel biopsy specimens; or demonstration of sporulation; or • DNA (by polymerase chain reaction) in stool, duodenal/jejunal aspirates, or small bowel biopsy specimens |
Detection of Cyclospora organisms or DNA in stool, intestinal fluid/aspirate, or intestinal biopsy specimens |
|
Case classification |
|||
|
Confirmed |
A case that is laboratory confirmed |
A laboratory-confirmed case that is associated with: • at least one of the symptoms described above (i.e., confirmed, symptomatic); or • none of the above symptoms (i.e., confirmed, asymptomatic) |
A case that meets the clinical description and at least one of the criteria for laboratory confirmation as described above |
|
Probable§ |
A clinically compatible case that is linked epidemiologically to a confirmed case |
A case that meets the clinical description and that is linked epidemiologically to a confirmed case |
|
|
Source: Adapted from CDC. Case definitions for infectious conditions under public health surveillance. Available at http://www.cdc.gov/osels/ph_surveillance/nndss/casedef/index.htm. * The case definitions were developed in collaboration with epidemiologists at CDC and the Council of State and Territorial Epidemiologists (CSTE). On CDC's web site, they are referred to as the 1996, 1998, and 2010 definitions. In June 1998, CSTE voted to add cyclosporiasis to the list of nationally notifiable conditions, effective January 1999. † In June 2009, CSTE approved a revised case definition, which was implemented in January 2010. § The probable category is not applicable for the sporadic cases included in this surveillance summary, all of which were laboratory-confirmed cases not linked to known outbreaks. However, the case counts for outbreaks include probable and confirmed cases, even for outbreaks during the period when the 1998 definition was applicable. |
|||
Persons using assistive technology might not be able to fully access information in this file. For assistance, please send e-mail to: mmwrq@cdc.gov. Type 508 Accommodation and the title of the report in the subject line of e-mail.
Surveillance for Laboratory-Confirmed Sporadic Cases of Cyclosporiasis --- United States, 1997--2008
Corresponding author: Rebecca L. Hall, MPH, Center for Global Health, CDC, 4770 Buford Highway N.E., MS F-22, Atlanta, GA 30341. Telephone: 770-488-7319, Fax: 770-488-7761, E-mail: bqu5@cdc.gov.
Abstract
Problem/Condition: Cyclosporiasis is an enteric disease caused by the parasite Cyclospora cayetanensis. Cyclosporiasis is reported most commonly in tropical and subtropical regions. In the United States, outbreaks of cyclosporiasis associated with various types of imported fresh produce have been documented and described since the mid-1990s. No molecular tools are available for linking C. cayetanensis cases. National data regarding laboratory-confirmed sporadic cases (i.e., cases not linked to documented outbreaks) have not been summarized previously.
Reporting Period: This summary includes laboratory-confirmed sporadic cases that occurred during 1997--2008 and were reported to CDC by 2009.
Description of System: In January 1999, cyclosporiasis became a nationally notifiable disease, and, as of 2008, it was a reportable condition in 37 states, New York City (NYC), and the District of Columbia. For 1997--2008, CDC was notified of laboratory-confirmed cases via two active surveillance systems (the Cyclospora Sentinel Surveillance Network and the Foodborne Diseases Active Surveillance Network), two passive systems (the National Notifiable Diseases Surveillance System and the Public Health Laboratory Information System), and informal mechanisms (e.g., electronic mail).
Results: CDC was notified of 1,110 laboratory-confirmed sporadic cases of cyclosporiasis that occurred during 1997--2008. The overall population-adjusted incidence rates ranged from a low of 0.01 cases per 100,000 persons in 1997 to a high of 0.07 in 2002. Of the 1,110 cases, 849 (76.5%) were reported by seven states: 498 (44.9%) occurred in residents of Florida (228 cases), NYC (200 cases), and elsewhere in New York state (70 cases); and >50 cases were reported by each of five other states (Connecticut, Georgia, Massachusetts, New Jersey, and Pennsylvania). Overall, the case-patients' median age was 44 years (range: 3 months--96 years); 50.5% were female, 47.2% were male, and the sex was unknown for 2.3%. A total of 372 case-patients (33.5%) had a documented history of international travel during the 2-week period before symptom onset or diagnosis, 398 (35.9%) reported no international travel, and 340 (30.6%) had an unknown travel history. Some details about the travel were available for 317 (85.2%) of the case-patients with a known history of international travel; 142 (44.8%) had traveled to Mexico (60 persons), Guatemala (44 persons), or Peru (38 persons). Among the 398 case-patients classified as having domestically acquired cases, 124 persons (31.2%) lived in Florida, and 64 persons (16.1%) lived either in NYC (49 persons) or elsewhere in New York state (15 persons). The majority (278 [69.8%]) of onset or diagnosis dates for domestically acquired cases occurred during April--August.
Interpretation: Approximately one third of cases occurred in persons with a known history of international travel who might have become infected while traveling outside the continental United States. Domestically acquired cases were concentrated in time (spring and summer) and place (eastern and southeastern states): some of these cases probably were outbreak associated but were not linked to other cases, in part because of a lack of molecular tools.
Public Health Action: Surveillance for cases of cyclosporiasis and research to develop molecular methods for linking seemingly sporadic cases should remain U.S. public health priorities, in part to facilitate identification and investigation of outbreaks and to increase understanding of the biology of Cyclospora and the epidemiology of cyclosporiasis. Unidentified, uninvestigated cases and outbreaks represent missed opportunities to identify vehicles of infection, modes of contamination, and preventive measures. Travelers to known areas of endemicity should be advised that food and water precautions for Cyclospora are similar to those for other enteric pathogens, except that this parasite is unlikely to be killed by routine chemical disinfection or sanitizing methods. The diagnosis of cyclosporiasis should be considered for persons with persistent or remitting-relapsing diarrheal illness, and testing for Cyclospora should be requested explicitly.
Introduction
Cyclosporiasis is an enteric disease caused by the parasite Cyclospora cayetanensis, a unicellular, coccidian parasite transmitted by ingestion of infective oocysts (e.g., through contaminated food or water). The most common symptom is watery diarrhea. Although humans are the only known hosts of this Cyclospora species, direct person-to-person transmission is unlikely; the oocysts shed in feces require days to weeks under favorable environmental conditions to become infective (1,2). The need for Cyclospora oocysts to survive long enough both to sporulate and subsequently to be ingested by a susceptible person suggests that the oocysts are quite hardy (1,2) and unlikely to be killed by routine chemical disinfection or sanitizing methods used for food or water (3). The incubation period averages 1 week (range: ~2--14 days). Infection responds to treatment with trimethoprim-sulfamethoxazole, but untreated persons can have prolonged illness, with remitting-relapsing symptoms, for several weeks or months (1).
Cyclosporiasis is reported most commonly in tropical and subtropical regions. In retrospect, the first cases of cyclosporiasis documented in the literature occurred in 1977 and 1978 in Papua New Guinea (4). In the mid-1980s, several cases were described in U.S. travelers returning from Haiti and Mexico (5). In the mid-1990s, Cyclospora emerged as a foodborne pathogen of U.S. public health concern in the context of large, multistate outbreaks in 1996 and 1997, with >1,000 outbreak-associated cases reported in both years (1,2,6,7).
In June 1998, the Council of State and Territorial Epidemiologists (CSTE) voted to add cyclosporiasis to the list of nationally notifiable conditions (NNCs), effective January 1999 (8). As of 2008, cyclosporiasis was an explicitly reportable disease (i.e., it was listed as a specific disease or as a category of diseases on reportable disease lists) in 37 states, New York City (NYC), and the District of Columbia (DC) (9,10).
CDC, in collaboration with jurisdiction public health authorities, analyzes each reported case for epidemiologic evidence of linkage to other cases to facilitate rapid identification and investigation of outbreaks. U.S. clusters of cases have been documented almost every year since 1995. Various types of imported fresh produce (e.g., raspberries and snow peas from Guatemala and mesclun lettuce and basil from Peru) have been implicated (1,2,6,7,11,12). To date, U.S. publications about the epidemiology of cyclosporiasis have focused on outbreaks (1,2,6,7,11--16). This is the first summary of national data regarding laboratory-confirmed cases of cyclosporiasis that were not linked to documented outbreaks.
Methods
Data Sources
For 1997--2008, laboratory-confirmed cases of cyclosporiasis were reported to CDC by jurisdiction health departments via multiple surveillance systems and reporting methods. These included two active surveillance systems (the Cyclospora Sentinel Surveillance Network and the Foodborne Diseases Active Surveillance Network), two passive systems (the National Notifiable Diseases Surveillance System and the Public Health Laboratory Information System), and informal mechanisms (e.g., electronic mail).
In February 1997 (2 years before cyclosporiasis became a NNC), CDC launched the Cyclospora Sentinel Surveillance Network (CSSN). The original network participants were eight of the health departments that reported outbreak-associated cases of cyclosporiasis in 1996* (6). Participating sites collect reports from selected laboratories in their jurisdictions and submit aggregate Cyclospora test results to CDC monthly during September--March and weekly during April--August, when heightened surveillance is conducted.
The Foodborne Diseases Active Surveillance Network (FoodNet) is the foodborne disease component of CDC's Emerging Infections Program (17). Since 1996, FoodNet has conducted laboratory-based surveillance for selected foodborne pathogens of public health importance. Surveillance for cases of Cyclospora infection began in 1997 in four of the five states that were in the network then: Minnesota, Oregon, and selected counties in California and Connecticut (18); Georgia began Cyclospora surveillance in 1998. The number of jurisdictions in the network increased each year through 2004 (18). During 2004--2008, the network included all of the counties in seven states (Connecticut, Georgia, Maryland, Minnesota, New Mexico, Oregon, and Tennessee) and selected counties in three additional states (California, Colorado, and New York state [not including NYC]). Among these 10 states, California is the only one in which cyclosporiasis had not become an explicitly reportable disease as of 2008.
The National Notifiable Diseases Surveillance System (NNDSS) was initiated in 1961, when CDC assumed responsibility for collecting and publishing data regarding NNCs (19). Electronic reporting of cases of NNCs began in 1990, with the launch of the National Electronic Telecommunications System for Surveillance (NETSS) (20).
The Public Health Laboratory Information System (PHLIS), launched in 1989, is a national surveillance system for infectious diseases, which accommodates transmission of various types of data (e.g., laboratory and epidemiologic) from and among multiple entities (e.g., hospitals, laboratories, health departments) and to CDC (21). In 1992, the reporting system was available in 41 state public health laboratories (21).
CDC also is notified of cyclosporiasis cases through informal means, such as electronic mail and telephone calls. If indicated, CDC asks the health department to complete and submit a U.S. cyclosporiasis surveillance case report form (CRF), which is available at http://www.cdc.gov/parasites/cyclosporiasis/health_professionals/index.html. The CRF solicits clinical, demographic, travel, and exposure data, including whether the case-patient attended any events at which food was served (e.g., a wedding or conference) and knew of other ill persons.
Definitions
For the purposes of these analyses, a sporadic case of Cyclospora infection was defined as a laboratory-confirmed case that occurred during 1997--2008, was reported to CDC by 2009, met the surveillance definition applicable at the time (Table 1), and was not linked to a documented outbreak (e.g., an event-associated cluster of cases). The exposure period was defined as the 2-week period before symptom onset or the earliest available alternative date, typically the date of diagnosis or specimen collection; a report date was used to define the exposure period for <2% of cases.
A travel-associated case was defined as a sporadic case in a U.S. resident or recent immigrant (e.g., an adopted infant) who had been outside the United States during all or part of the exposure period†; travel to a U.S. territory was categorized as international. A domestically acquired case was defined as a sporadic case in a U.S. resident who reported not having left the country during the exposure period.
Analyses
An aggregate database was created that incorporated case records from all of the data sources. The mechanisms used to report cases to CDC were recorded. For most reported cases, demographic data (age, sex, and state/county of residence) and one or more dates were available. Such data were used to identify, compare, and merge records that concerned the same case but that were received via different mechanisms. If case records had conflicting data (e.g., different dates), preference was given to the data from the most detailed record (e.g., a completed CRF). Clinical data were available primarily for cases for which a CRF was submitted. At least some data regarding food consumption during the exposure period were available for 27% of cases. Food consumption data were used when cases initially were analyzed for commonalities but are not provided in this report because aggregate, incomplete, and uncontrolled data from sporadic cases spanning years and states cannot be used to generalize or hypothesize about potential vehicles of infection.
Data analyses were conducted by using SAS v 9.2 (SAS Institute, Inc.; Cary, North Carolina). Population data from the U.S. Census Bureau were used to calculate incidence rates. For each of the annual rates, the denominator comprised the aggregate populations of the jurisdictions in which cyclosporiasis was a reportable disease or under surveillance (e.g., via FoodNet), regardless of whether any sporadic cases were reported to CDC that year, and the populations of the jurisdictions that reported case(s), regardless of whether cyclosporiasis was a reportable disease. Trends were evaluated with the Cochran-Armitage test; statistical significance was defined as a two-sided p value <0.05.
Results
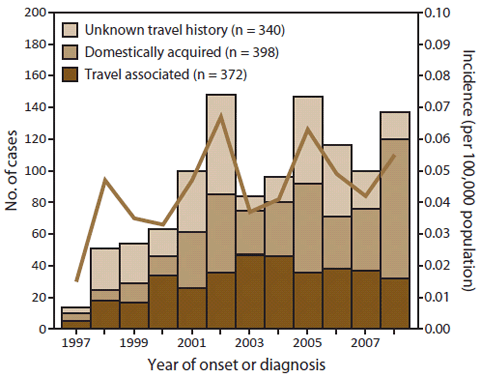
CDC was notified of 1,110 laboratory-confirmed cases of cyclosporiasis that occurred during 1997--2008 and fulfilled all criteria for classification as sporadic cases (Table 2; Figure 1). These cases were reported by 39 jurisdictions: 37 states, including seven in which cyclosporiasis was not an explicitly reportable disease (Tables 3 and 4); NYC; and DC. The annual number of jurisdictions that reported cases ranged from six (in 1997) to 24 (in 2007), with a median of 18 jurisdictions; during 2004--2008, >20 jurisdictions per year reported at least one case. The annual number of reported cases varied (median: 98 cases; range: 14--148); the population-adjusted incidence rates (number of cases per 100,000 persons) ranged from a low of 0.01 in 1997 to a high of 0.07 in 2002 (Table 2; Figure 1).
Of the 1,110 sporadic cases, 498 (44.9%) were in residents of Florida (228 cases), NYC (200 cases), or elsewhere in New York state (70 cases), and >50 cases were reported by each of five other states (Connecticut, Georgia, Massachusetts, New Jersey, and Pennsylvania) (Table 4). Of the 39 jurisdictions that reported at least one case, 19 (48.7%) reported a total of <10 cases.
The case-patients' median age was 44 years (range: 3 months--96 years) (Table 5); 50.5% were female, 47.2% were male, and the sex was unknown for 2.3% (Table 6). Among cases with available data, more cases were in whites and non-Hispanics than in persons of other races and ethnicities (Table 6). Overall, 372 case-patients (33.5%) had a documented history of international travel during at least part of the 2-week exposure period, 398 (35.9%) reported that they had not traveled internationally during this period, and 340 (30.6%) had an unknown travel history. The proportion whose travel history was unknown (e.g., because the case-patient was lost-to-follow-up) varied among jurisdictions (Tables 3 and 4). The annual number of reported cases that were classified as domestically acquired increased significantly (p<0.001), whereas the number of travel-associated cases did not (p=0.1).
Travel-Associated Cases
For the 372 case-patients whose cases were classified as travel associated, 317 case records (85.2%) included the country/region or type of travel; 35 case-patients had traveled to multiple countries (Table 7). Among the 357 country visits for which the geographic region was known, 255 (71.4%) were in the Western Hemisphere, particularly in Central America (n = 79), Mexico (n = 60), the Caribbean (n = 57), or South America (n = 53); 102 visits (28.6%) were in the Eastern Hemisphere, particularly, in Asia (n = 78). The destinations encompassed all continents except Antarctica. Country-level destinations have been listed in descending order by frequency and compared with overall U.S. travel statistics for the same countries during similar periods (Table 7).
The 372 travel-associated cases were reported by 32 jurisdictions (30 states, NYC, and DC) (Tables 3 and 4). Among the 10 jurisdictions that reported ≥10 cases, only one (California) is not eastern or southeastern. NYC and Florida reported the most cases per jurisdiction (76 and 48 cases, respectively). The cases occurred in all 12 months, with the majority (240 [64.5%]) of onset or diagnosis dates during April--July (Figure 2).
Domestically Acquired Cases
By definition, the 398 case-patients classified as having domestically acquired cases had not been outside the United States during the 2-week exposure period. However, not all of them necessarily were exposed where they lived (Figure 3): 82 case-patients (20.6%) reported a history of interstate or interjurisdictional travel, five (1.3%) reported intrastate travel, and six (1.5%) reported both types of domestic travel. Overall, the 398 case-patients lived in a total of 28 jurisdictions (26 states, NYC, and DC); 124 case-patients (31.2%) lived in Florida, and 64 (16.1%) lived either in NYC (49 persons) or elsewhere in New York state (15 persons) (Tables 3 and 4). In total, 152 case-patients (38.2%) either lived in Florida (124 persons) or had traveled there (28 persons). Of the 124 reported domestically acquired sporadic cases in residents of Florida, 61 (49.2%) comprised an unexplained temporal-spatial cluster of cases in the spring of 2008 (Table 2); no common event or vehicle of infection of infection was documented. Overall, among the nine jurisdictions that reported at least 10 domestically acquired cases, only one (Illinois) is not eastern or southeastern. The cases occurred in all 12 months, with the majority (278 [69.8%]) of onset or diagnosis dates during April--August, particularly during May--July (Figure 2).
Clinical Aspects and Intervals to Diagnosis and Reporting
Clinical data were available for 184 case-patients (16.6%), two of whom reportedly were asymptomatic. Overall, diarrhea was the most common symptom (158 of 162 [97.5%]). Other reported symptoms included abdominal cramps (97 of 118 [82.2%]); fatigue (82 of 109 [75.2%]); weight loss (84 of 116 [72.4%]), with a median loss of 4.5 kilograms (range: 1.1--11.8 kg; n = 65); nausea (81 of 117 [69.2%]); anorexia (67 of 103 [65.0%]); fever (42 of 97 [43.3%]), with a median temperature of 100.3°F (37.9°C) (range: 99.0--103.5°F [37.2--39.7°C]; n = 20); and vomiting (31 of 102 [30.4%]). Among the 16 case-patients with available data, the median duration of illness was 17.5 days (range: 10--30 days). Eleven case-patients (6.7% of 165) reported having been hospitalized; their median age was 47 years (range: 9--88 years). No deaths were reported.
Both the onset date and the diagnosis date were available for 452 cases (40.7%); the median interval from onset to diagnosis was 13 days (range: 0--375 days; 25--75% interquartile range [IQR]: 9--19 days) (Table 8). Among the 194 cases (17.5%) with available data, the median interval from diagnosis to notification was 28 days (range: 0--367 days; IQR: 17--59 days). Overall, CDC received a total of 2,134 case reports regarding the 1,110 cases (Table 9); information was obtained via NNDSS for the majority of cases (955 [86.0%]).
Discussion
For 1997--2008, a total of 1,110 laboratory-confirmed cases of cyclosporiasis reported to CDC were classified as sporadic because they were not linked to documented outbreaks. Approximately 3,000 outbreak-associated cases were reported for the same period (1,2,7,11--16; CDC, unpublished data, 2011), which does not include 1996, the year of the first documented large (with >1,000 reported cases) multistate outbreak (1,2,6). Although the annual reported numbers of both outbreak-associated cases and sporadic cases fluctuated, the number of sporadic cases varied less markedly (range: 0--1,448 for outbreak-associated cases compared with 14--148 for sporadic cases).
Overall, approximately one third (33.5%) of the reported sporadic cases occurred in persons with a known history of international travel who might have become infected outside the United States (Figure 1). Because the majority of the case-patients with available data had been in the United States at least 1 day during the 2-week exposure period, the country in which they became infected could not be established definitively, nor could the precise location or mode of transmission.
Guatemala and Peru together accounted for 82 (23%) of the country visits by case-patients but only ~1% of the destinations for U.S. travelers in general (Table 7). Fresh produce from these two countries and Mexico (the most frequent destination both for case-patients and overall) have been linked to outbreaks in North America; indigenous cases also have been described in these countries (1,2,22--24). Several case-patients reported having traveled to Puerto Rico; the first described outbreak of cyclosporiasis in Puerto Rico occurred in 2008 in a rural community and was thought to be waterborne (25). Collection of detailed travel data (including destinations and durations of travel) might serve the dual functions of identifying cases potentially acquired outside the continental United States and of identifying additional foci of endemicity (26).
Another one third (35.9%) of the reported sporadic cases were classified as domestically acquired. These cases, like the travel-associated sporadic cases, as well as the documented U.S. outbreak-associated cases (CDC, unpublished data, 2011), occurred year-round, with the highest case counts during spring and summer months. Although the temporal distribution of cases diagnosed in the United States could reflect in part seasonal differences in considering and testing for Cyclospora, the distribution largely mirrors the to-date unexplained seasonality of infection in some of the source countries of imported produce items implicated in outbreak investigations (1,2,6,7,11,12).
The geographic distribution of the cases, like the temporal distribution, was both broad and concentrated: 28 jurisdictions (26 states, NYC, and DC) notified CDC of domestically acquired cases, whereas the majority of the reported cases were in residents of major cities and surrounding metropolitan areas in Florida, New York, and several other eastern or southeastern states (Figure 3). This seeming geographic focality might reflect in part more frequent recognition and reporting of cases in particular eastern and southeastern jurisdictions, which also reported the majority of the travel-associated cases. The extent to which the focality also reflects a higher overall occurrence of cases is unknown, although some states, most notably Florida (1,2,6,14,15), have figured prominently in outbreaks in multiple years, linked to vehicles from various sources. The occurrence in Florida of an unexplained temporal-spatial cluster of cases in the spring of 2008 (Table 2) underscores the difficulties associated with attempts to document linkage among non-event--associated cases, without the benefits of molecular tools or of sufficient numbers of cases and resources to conduct definitive case-control studies. Many of the documented outbreaks during 1997--2008 affected multiple states, either because of multistate distribution of the implicated produce item or because persons from multiple states attended an event (e.g., a conference); the event-associated clusters have not been limited to eastern and southeastern states. However, generalizing from particular years, states, and outbreaks is complicated by the nonuniform importation, distribution, and consumption of contaminated produce, as well as by the many unknowns regarding such factors and the epidemiology of cyclosporiasis in general (e.g., the incidence of and risk factors for infection in the United States and elsewhere).
The reported sporadic cases of cyclosporiasis have a bell-shaped age distribution, with relatively few cases in the very young and very old (Table 5). In contrast, for giardiasis and cryptosporidiosis, two enteric parasitic diseases that occur quite commonly in the United States, reported cases have a skewed or bimodal age distribution, with the highest proportion occurring among children aged 1--9 years (27,28). The paucity of reported cases of cyclosporiasis among infants and young children is suggestive of an exposure that is more common among adults, which likely applies to the types of fresh produce implicated to date in U.S. outbreak investigations.
The median interval from symptom onset to diagnosis was 13 days (Table 8); this includes the time required to decide to seek care, to be evaluated by a clinician, and to provide and test stool for Cyclospora. Although the median interval from diagnosis to notification of CDC was 28 days, CDC typically did not have information regarding when cases were reported to health departments. Most laboratories do not perform diagnostic testing for Cyclospora without an explicit, billable request for such testing (29); this parasite usually is not detected by a routine examination for ova and parasites. CDC tests specimens that are sent via state public health laboratories for C. cayetanensis. CDC also provides reference diagnostic support through DPDx, a telediagnosis system (available at http://www.dpd.cdc.gov/dpdx) initiated in 1998 that enables laboratory and clinical staff to submit images (e.g., of suspect Cyclospora oocysts) electronically for rapid diagnosis of parasitic diseases. The available clinical data regarding the case-patients' symptoms (e.g., magnitude of weight loss), duration of illness, and hospitalization rate underscore the importance of prompt diagnosis and treatment of this potentially severe infection, as well as the need for preventive measures.
Limitations
Surveillance for cyclosporiasis, like that for other notifiable conditions, is dependent on the completeness and accuracy of the available data. In this context, the findings presented in this report are subject to at least five limitations. First, in general, not all cases of cyclosporiasis are diagnosed and reported (30), cyclosporiasis is not reportable in all jurisdictions, and notifying CDC is voluntary. Second, even for reported cases, the details provided to CDC might be incomplete. For example, the travel history was unknown for approximately one third of the reported sporadic cases (30.6%), and details about the destination and duration of travel were incomplete for many of the cases for which some travel data were reported. Third, reporting might be delayed, which reduces the likelihood of identifying epidemiologic commonalities among cases. The relatively long incubation period for cyclosporiasis (median: 1 week) contributes to delays in detecting, reporting, and investigating cases. Fourth, the lack of molecular tools for linking cases compounds the implications of incomplete and delayed reporting. Finally, the trend analyses regarding the annual number and incidence of cases during the 12-year surveillance period should be interpreted with caution. The optimal denominators to use to calculate incidence rates are unclear, a robust baseline period is not available, and the actual (true) total number of domestically acquired cases in a given year is unknown.
Conclusion
Health-care providers should consider the diagnosis of Cyclospora infection for persons with persistent or remitting-relapsing diarrheal illness, regardless of the season or U.S. region; explicitly request testing for this parasite; and report identified cases to local public health authorities, who, in turn, are encouraged to notify CDC. Vigilant surveillance and innovative research to develop molecular methods for linking seemingly sporadic cases should remain U.S. public health priorities. Unidentified, uninvestigated cases and outbreaks represent missed opportunities to identify vehicles of infection or modes of contamination and to implement evidence-based, targeted, prevention and control measures. Additional information about cyclosporiasis is available at http://www.cdc.gov/parasites/cyclosporiasis.
Acknowledgments
This report is based, in part, on contributions by personnel of state and local health departments, including Daniel Cimini, New York City Department of Health and Mental Hygiene; Roberta Hammond, PhD, Florida Department of Health, Tallahassee, Florida; Sharon Hurd, MPH, Connecticut Emerging Infections Program, New Haven, Connecticut; Saada Soubagleh, BSPH, District of Columbia Department of Health; Michele Hlavsa, MPH, Division of Foodborne, Waterborne, and Environmental Diseases, National Center for Emerging and Zoonotic Infectious Diseases; Adriana Lopez, MPH, Division of Viral Diseases, National Center for Immunization and Respiratory Diseases, CDC.
References
- Herwaldt BL. Cyclospora cayetanensis: a review, focusing on the outbreaks of cyclosporiasis in the 1990s. Clin Infect Dis 2000;31:1040--57.
- Herwaldt BL. The ongoing saga of U.S. outbreaks of cyclosporiasis associated with imported fresh produce: what Cyclospora cayetanensis has taught us and what we have yet to learn. In: Institute of Medicine. Addressing foodborne threats to health: policies, practices, and global coordination. Washington, DC: National Academies Press; 2006:85--115, 133--40.
- Ortega YR, Mann A, Torres MP, Cama V. Efficacy of gaseous chlorine dioxide as a sanitizer against Cryptosporidium parvum, Cyclospora cayetanensis, and Encephalitozoon intestinalis on produce. J Food Prot 2008;71:2410--4.
- Ashford RW. Occurrence of an undescribed coccidian in man in Papua New Guinea. Ann Trop Med Parasitol 1979;73:497--500.
- Soave R, Dubey JP, Ramos LJ, Tummings M. A new intestinal pathogen? [Abstract]. Clin Res 1986;34:533A.
- Herwaldt BL, Ackers ML. An outbreak in 1996 of cyclosporiasis associated with imported raspberries. The Cyclospora Working Group. N Engl J Med 1997;336:1548--56.
- Herwaldt BL, Beach MJ. The return of Cyclospora in 1997: another outbreak of cyclosporiasis in North America associated with imported raspberries. Cyclospora Working Group. Ann Intern Med 1999;130:210--20.
- CDC. Outbreak of cyclosporiasis---Ontario, Canada, May 1998. MMWR 1998;47:806--9.
- Council of State and Territorial Epidemiologists. State reportable conditions assessment, 2008. Atlanta, GA: Council of State and Territorial Epidemiologists; 2008.
- CDC. NNDSS tables have updated N indicators for the year 2009. MMWR 2010;59:632.
- Ho AY, Lopez AS, Eberhart MG, et al. Outbreak of cyclosporiasis associated with imported raspberries, Philadelphia, Pennsylvania, 2000. Emerg Infect Dis 2002;8:783--8.
- CDC. Outbreak of cyclosporiasis associated with snow peas---Pennsylvania, 2004. MMWR 2004;53:876--8.
- Lopez, AS, Dodson DR, Arrowood MJ, et al. Outbreak of cyclosporiasis associated with basil in Missouri in 1999. Clin Infect Dis 2001;32:1010--7.
- Koumans EH, Katz DJ, Malecki, JM, et al. An outbreak of cyclosporiasis in Florida in 1995: a harbinger of multistate outbreaks in 1996 and 1997. Am J Trop Med Hyg 1998;59:235--42.
- Hammond R, Bodager D. Surveillance and investigation of a large statewide Cyclospora foodborne disease outbreak involving an imported stealth ingredient. In: Institute of Medicine. Addressing foodborne threats to health: policies, practices, and global coordination. Washington, DC: National Academies Press; 2006:115--124, 133--40.
- CDC. Surveillance for foodborne disease outbreaks---United States, 2006. MMWR 2009;58:609--15.
- Angulo FJ, Voetsch AC, Vugia D, et al. Determining the burden of human illness from food borne diseases. CDC's emerging infectious disease program Food Borne Diseases Active Surveillance Network (FoodNet). Vet Clin North Am Food Anim Pract 1998;14:165--72.
- Henao OL, Scallan E, Mahon B, Hoekstra RM. Methods for monitoring trends in the incidence of foodborne diseases: Foodborne Diseases Active Surveillance Network 1996--2008. Foodborne Pathog Dis 2010;7:1421--6.
- Koo D, Wetterhall, SF. History and current status of the National Notifiable Diseases Surveillance System. J Public Health Manag Pract 1996;2:4--10.
- CDC. Summary of notifiable diseases---United States, 2006. MMWR 2008;55(No. 53).
- Bean NH, Martin SM, Bradford H Jr. PHLIS: an electronic system for reporting public health data from remote sites. Am J Public Health 1992;82:1273--6.
- Ayala-Gaytan JJ, Diaz-Olachea C, Riojas-Montalvo P, Palacios-Martinez C. [Cyclosporidiosis: clinical and diagnostic characteristics of an epidemic outbreak]. Rev Gastroenterol Mex 2004;69:226--9.
- Diaz E, Mondragon J, Ramirez E, Bernal R. Epidemiology and control of intestinal parasites with nitazoxanide in children in Mexico. Am J Trop Med Hyg 2003;68:384--5.
- Shah L, MacDougall L, Ellis A, Ong C, Shyng S, LeBlanc L. Challenges of investigating community outbreaks of cyclosporiasis, British Columbia, Canada. Emerg Infect Dis 2009;15:1286--8.
- Hassan E, Ramos MR, Claudio S, et al. Outbreak of cyclosporiasis in a rural community in Puerto Rico, 2008 [Abstract]. Council of State and Territorial Epidemiologists Annual Conference, Buffalo, New York; June 7--11, 2009.
- Eberhard ML, Arrowood MJ. Cyclospora spp. Curr Opin Infect Dis 2002;15:519--22.
- Yoder JS, Harral C, Beach MJ. Cryptosporidiosis surveillance---United States, 2006--2008. MMWR 2010;59(No. SS-6):1--14.
- Yoder JS, Harral C, Beach MJ. Giardiasis surveillance---United States, 2006--2008. MMWR 2010;59(No. SS-6):15--25.
- Jones JL, Lopez A, Wahlquist SP, Nadle J, Wilson M. Survey of clinical laboratory practices for parasitic diseases. Clin Infect Dis 2004;38(Suppl 3):S198--202.
- Scallan E, Hoekstra RM, Angulo FJ, et al. Foodborne illness acquired in the United States---major pathogens. Emerg Infect Dis 2011;17:7--15.
* The original participants included Connecticut, Florida, Maryland, Massachusetts, NYC, New York state, Ohio, and South Carolina. These jurisdictions were among the 20 states that reported cases associated with the multistate outbreak in 1996; DC and two Canadian provinces also reported cases (6). The network was formed thereafter, in February 1997, in anticipation of the occurrence of outbreaks in 1997. Formal (as opposed to informal) participation in this sentinel network decreased over time. By 2008, the network consisted of Connecticut and DC.
† In FoodNet surveillance, the question regarding international travel, which has been asked since 2004, inquires about travel "within 15 days" of the onset date, or, if onset date is unavailable, the specimen collection date.
|
TABLE 2. Number,* percentage,† and incidence of reported laboratory-confirmed sporadic cases of cyclosporiasis, by year of symptom onset or diagnosis and by international travel history --- United States, 1997--2008 |
||||||||
|---|---|---|---|---|---|---|---|---|
|
Year |
Travel associated |
Domestically acquired |
Unknown travel history |
Total No. |
Incidence rate§ |
|||
|
No. |
(%) |
No. |
(%) |
No. |
(%) |
|||
|
1997 |
5 |
(35.7) |
5 |
(35.7) |
4 |
(28.6) |
14 |
0.01 |
|
1998 |
18 |
(35.3) |
7 |
(13.7) |
26 |
(51.0) |
51 |
0.05 |
|
1999 |
17 |
(31.5) |
12 |
(22.2) |
25 |
(46.3) |
54 |
0.04 |
|
2000 |
34 |
(54.0) |
12 |
(19.0) |
17 |
(27.0) |
63 |
0.03 |
|
2001 |
26 |
(26.0) |
35 |
(35.0) |
39 |
(39.0) |
100 |
0.05 |
|
2002 |
36 |
(24.3) |
49 |
(33.1) |
63 |
(42.6) |
148 |
0.07 |
|
2003 |
47 |
(56.0) |
28 |
(33.3) |
9 |
(10.7) |
84 |
0.04 |
|
2004 |
46 |
(47.9) |
34 |
(35.4) |
16 |
(16.7) |
96 |
0.04 |
|
2005 |
36 |
(24.5) |
56 |
(38.1) |
55 |
(37.4) |
147 |
0.06 |
|
2006 |
38 |
(32.8) |
33 |
(28.4) |
45 |
(38.8) |
116 |
0.05 |
|
2007 |
37 |
(37.0) |
39 |
(39.0) |
24 |
(24.0) |
100 |
0.04 |
|
2008¶ |
32 |
(23.4) |
88¶ |
(64.2) |
17 |
(12.4) |
137¶ |
0.06 |
|
Total |
372 |
398 |
340 |
1,110 |
||||
|
Sources: Population estimates are from the Population Division, U.S. Census Bureau. State population estimates: annual time series, July 1, 1990 to July 1, 1999 (ST-99-3), available at http://www.census.gov/popest/archives. Annual estimates of the resident population for the United States, regions, states, and Puerto Rico: April 1, 2000 to July 1, 2009 (NST-EST2009-01), available at http://www.census.gov/popest/states. County population estimates and demographic components of population change: annual time series, July 1, 1990 to July 1, 1999 (CO-99-8), available at http://www.census.gov/popest/archives. Annual estimates of the resident population for counties: April 1, 2000 to July 1, 2009 (CO-EST2009-01), available at http://www.census.gov/popest/counties. * N = 1,110. † Percentages (per year) might not total 100% (not shown) because of rounding. § Per 100,000 population on the basis of U.S. population estimates. ¶ In 2008, Florida reported 61 (44.5%) of the 137 total cases, including 52 (59.1%) of the 88 domestically acquired cases. Among these 61 cases, 37 (60.7%) had symptom onset or diagnosis dates in May or June. Overall, for the 12-year surveillance period, Florida accounted for 228 (20.5%) of the 1,110 total cases, including 124 (31.2%) of the 398 domestically acquired cases. The 61 cases Florida reported in 2008 constituted the highest number reported by any jurisdiction during any year of the surveillance period; the next highest was 34 cases, which was the number Florida reported in 2002. |
||||||||
FIGURE 1. Number* and incidence of reported laboratory-confirmed sporadic cases of cyclosporiasis, by year of symptom onset or diagnosis and by international travel history --- United States, 1997--2008
Sources: Population estimates are from the Population Division, U.S. Census Bureau. State population estimates: annual time series, July 1, 1990 to July 1, 1999 (ST-99-3), available at http://www.census.gov/popest/archives. Annual estimates of the resident population for the United States, regions, states, and Puerto Rico: April 1, 2000 to July 1, 2009 (NST-EST2009-01), available at http://www.census.gov/popest/states. County population estimates and demographic components of population change: annual time series, July 1, 1990 to July 1, 1999 (CO-99-8), available at http://www.census.gov/popest/archives. Annual estimates of the resident population for counties: April 1, 2000 to July 1, 2009 (CO-EST2009-01), available at http://www.census.gov/popest/counties.
* N = 1,110.
Alternate Text: The figure shows the number and incidence per 100,000 population of laboratory-confirmed sporadic cases of cyclosporiasis reported in the United States for 1997-2008 by year of symptom onset or diagnosis and by international travel history. Of the 1,110 patients whose cases were reported, 372 were associated with travel, 398 were acquired domestically, and 340 had an unknown travel history.
|
TABLE 3. Number* and percentage† of reported laboratory-confirmed sporadic cases of cyclosporiasis, by state/area of residence* and international travel history --- United States, 1997--2008 |
||||||||
|---|---|---|---|---|---|---|---|---|
|
State/Area* |
Travel associated |
Domestically acquired |
Unknown travel history |
Total |
||||
|
No. |
(%) |
No. |
(%) |
No. |
(%) |
No. |
(%) |
|
|
Alabama§ |
1 |
(0.3) |
0 |
0 |
1 |
(0.1) |
||
|
Alaska |
1 |
(0.3) |
0 |
0 |
1 |
(0.1) |
||
|
Arizona§ |
0 |
1 |
(0.3) |
0 |
1 |
(0.1) |
||
|
Arkansas¶ |
0 |
0 |
0 |
0 |
||||
|
California§ |
14 |
(3.8) |
3 |
(0.8) |
0 |
17 |
(1.6) |
|
|
Colorado |
7 |
(1.9) |
9 |
(2.3) |
10 |
(2.9) |
26 |
(2.3) |
|
Connecticut |
27 |
(7.3) |
32 |
(8.0) |
5 |
(1.5) |
64 |
(5.9) |
|
Delaware |
0 |
1 |
(0.3) |
1 |
(0.3) |
2 |
(0.2) |
|
|
District of Columbia |
26 |
(7.0) |
9 |
(2.3) |
4 |
(1.2) |
39 |
(2.8) |
|
Florida |
48 |
(12.9) |
124 |
(31.2) |
56 |
(16.5) |
228 |
(20.8) |
|
Georgia |
26 |
(7.0) |
38 |
(9.5) |
50 |
(14.7) |
114 |
(10.4) |
|
Hawaii¶ |
0 |
0 |
0 |
0 |
||||
|
Idaho** |
0 |
0 |
0 |
0 |
||||
|
Illinois |
9 |
(2.4) |
13 |
(3.3) |
2 |
(0.6) |
24 |
(2.2) |
|
Indiana |
2 |
(0.5) |
1 |
(0.3) |
0 |
3 |
(0.3) |
|
|
Iowa |
2 |
(0.5) |
0 |
3 |
(0.9) |
5 |
(0.5) |
|
|
Kansas |
0 |
0 |
1 |
(0.3) |
1 |
(0.1) |
||
|
Kentucky** |
0 |
0 |
0 |
0 |
||||
|
Louisiana¶ |
0 |
0 |
0 |
0 |
||||
|
Maine§ |
0 |
1 |
(0.3) |
0 |
1 |
(0.1) |
||
|
Maryland |
6 |
(1.6) |
7 |
(1.8) |
3 |
(0.9) |
16 |
(1.5) |
|
Massachusetts |
26 |
(7.0) |
31 |
(7.8) |
3 |
(0.9) |
60 |
(5.4) |
|
Michigan |
2 |
(0.5) |
4 |
(1.0) |
7 |
(2.1) |
13 |
(1.2) |
|
Minnesota |
2 |
(0.5) |
1 |
(0.3) |
3 |
(0.9) |
6 |
(0.6) |
|
Mississippi** |
0 |
0 |
0 |
0 |
||||
|
Missouri |
0 |
1 |
(0.3) |
2 |
(0.6) |
3 |
(0.3) |
|
|
Montana** |
0 |
0 |
0 |
0 |
||||
|
Nebraska§ |
0 |
1 |
(0.3) |
1 |
(0.3) |
2 |
(0.2) |
|
|
Nevada** |
0 |
0 |
0 |
0 |
||||
|
New Hampshire |
0 |
0 |
1 |
(0.3) |
1 |
(0.09) |
||
|
New Jersey |
27 |
(7.3) |
12 |
(3.0) |
22 |
(6.5) |
61 |
(5.5) |
|
New Mexico |
7 |
(1.9) |
1 |
(0.3) |
0 |
8 |
(0.7) |
|
|
New York state†† |
10 |
(2.7) |
15 |
(3.8) |
45 |
(13.2) |
70 |
(6.4) |
|
New York City |
76 |
(20.4) |
49 |
(12.3) |
75 |
(22.1) |
200 |
(18.0) |
|
North Carolina |
2 |
(0.5) |
3 |
(0.8) |
5 |
(1.5) |
10 |
(0.9) |
|
North Dakota** |
0 |
0 |
0 |
0 |
||||
|
Ohio |
2 |
(0.5) |
0 |
1 |
(0.3) |
3 |
(0.3) |
|
|
Oklahoma¶ |
0 |
0 |
0 |
0 |
||||
|
Oregon |
4 |
(1.1) |
0 |
0 |
4 |
(0.4) |
||
|
Pennsylvania§ |
16 |
(4.3) |
22 |
(5.5) |
14 |
(4.1) |
52 |
(4.8) |
|
Rhode Island |
1 |
(0.3) |
0 |
0 |
1 |
(0.09) |
||
|
South Carolina |
2 |
(0.5) |
0 |
10 |
(2.9) |
12 |
(1.1) |
|
|
South Dakota |
1 |
(0.3) |
0 |
0 |
1 |
(0.09) |
||
|
Tennessee |
6 |
(1.6) |
3 |
(0.8) |
3 |
(0.9) |
12 |
(1.1) |
|
Texas |
3 |
(0.8) |
4 |
(1.0) |
6 |
(1.8) |
13 |
(1.2) |
|
Utah¶ |
0 |
0 |
0 |
0 |
||||
|
Vermont§ |
2 |
(0.5) |
0 |
1 |
(0.3) |
3 |
(0.3) |
|
|
Virginia |
5 |
(1.3) |
7 |
(1.8) |
1 |
(0.3) |
13 |
(1.2) |
|
Washington |
5 |
(1.3) |
2 |
(0.5) |
5 |
(1.5) |
12 |
(1.1) |
|
West Virginia¶ |
0 |
0 |
0 |
0 |
||||
|
Wisconsin |
4 |
(1.1) |
3 |
(0.8) |
0 |
7 |
(0.6) |
|
|
Wyoming¶ |
0 |
0 |
0 |
0 |
||||
|
Total |
372 |
(99.9) |
398 |
(100.7) |
340 |
(100.3) |
1,110 |
(100.6) |
|
* CDC was notified of a total of 1,110 sporadic cases by 37 states and two independent jurisdictions (New York City [NYC] and the District of Columbia) via multiple surveillance systems and reporting methods; no U.S. territories reported sporadic cases. All 50 states are listed regardless of whether they reported any sporadic cases. See footnotes below regarding whether cyclosporiasis was an "explicitly reportable disease" in particular jurisdictions during all or part of the period of interest (1997--2008)---i.e., whether cyclosporiasis was "listed as a specific disease or as a category of diseases on reportable disease lists" (10). See text for the states/areas in the Cyclospora Sentinel Surveillance Network and for those in the Foodborne Diseases Active Surveillance Network (FoodNet). † Percentages might not total 100% because of rounding. § Not an explicitly reportable disease in this state, but sporadic cases were reported to CDC. ¶ An explicitly reportable disease in this state, but no sporadic cases were reported to CDC. ** Not an explicitly reportable disease in this state, and no sporadic cases were reported to CDC. †† New York state exclusive of NYC. |
||||||||
|
TABLE 7. International destinations for U.S. travel-associated laboratory-confirmed sporadic cases of cyclosporiasis, 1997--2008, and estimated percentages of U.S. outbound travel accounted for by these destinations* |
|||||
|---|---|---|---|---|---|
|
Destination* |
Sporadic case-patients *† |
U.S. outbound travel data§ |
|||
|
Country visits |
Also traveled elsewhere† |
||||
|
No. |
(%) |
No. |
Estimated % of all travel |
Period with available data |
|
|
Mexico |
60 |
(16.6) |
6 |
31.5 |
1997--2008 |
|
Guatemala |
44 |
(12.2) |
4 |
0.5 |
2001--2003 |
|
Peru |
38 |
(10.5) |
6 |
0.5 |
1996--2004 |
|
Dominican Republic |
20 |
(5.5) |
2 |
1.8 |
2001--2004 |
|
China |
19 |
(5.3) |
2 |
1.5 |
1997--2008 |
|
Indonesia |
14 |
(3.9) |
1 |
0.2 |
1996--2004 |
|
El Salvador |
12 |
(3.3) |
2 |
0.5 |
2001--2004 |
|
Haiti |
11 |
(3.0) |
1 |
§ |
§ |
|
Bahamas |
9 |
(2.5) |
0 |
1.8 |
1996--2004 |
|
India |
8 |
(2.2) |
3 |
1.0 |
1997--2008 |
|
Costa Rica |
7 |
(1.9) |
2 |
0.8 |
2001--2004 |
|
Honduras |
7 |
(1.9) |
3 |
§ |
§ |
|
Nicaragua |
7 |
(1.9) |
1 |
§ |
§ |
|
Puerto Rico* |
7 |
(1.9) |
0 |
¶ |
¶ |
|
Thailand |
6 |
(1.7) |
5 |
0.7 |
1997--2008 |
|
Other** |
92 |
(25.5) |
¶ |
¶ |
|
|
Total |
361 |
(99.8) |
¶ |
¶ |
|
|
* Among the 372 case-patients with travel-associated cases, some information about the destination (or type) of travel was known for 317 (85.2%). These 317 case-patients had a total of 361 country visits during the 2-week exposure period. For the purposes of these analyses, visits to the Commonwealth of Puerto Rico were considered travel outside the United States. With the exception of the Other category, the destinations are listed in descending order, by the number of country visits; the percentage does not total 100 because of rounding. † Among the 317 case-patients, 35 (11.0%) traveled to multiple countries. § U.S. outbound travel estimates are based on data from the U.S. Department of Commerce, International Trade Administration, Office of Travel and Tourism Industries. U.S. resident travel abroad historical visitation estimates for U.S. outbound 1996--2006 (one or more nights) published in July 2007 (available at http://www.tinet.ita.doc.gov/view/f-2006-11-001/index.html) and U.S. resident travel abroad 1999--2008 revised historical outbound visitation (one or more nights) published in September 2009 (available at http://www.tinet.ita.doc.gov/outreachpages/download_data_table/2008_US_Travel_Abroad.pdf). Travel estimates were unavailable if the sample size for a particular country/year was <400 respondents (for 2005--2008) or <100 (for 1996--2004). The country-specific percentages were calculated by dividing the average of the available annual travel estimates for that country by the average of the annual totals for U.S. outbound travel for the same period. ¶ Not applicable. ** Each of the specified destinations (or types) of travel in this category was associated with fewer than six case-patients. The destinations include 40 countries not listed in the Table. Only region-level data were available for 13 country visits (e.g., Europe or Africa), and only the type of travel was reported for four case-patients (i.e., three Peace Corps volunteers and one person who took a cruise), each of whom was counted as having one country visit. Overall, 255 (71.4%) of the 357 visits with at least region-level data were in the Western Hemisphere, including Central America (n = 79), Mexico (n = 60), the Caribbean (n = 57), South America (n = 53), Canada (n = 5), and Bermuda (n = 1). The other 102 visits (28.6%) were in the Eastern Hemisphere, including Asia (n = 78), Europe (n = 11), Africa (n = 11), and Australia/New Zealand (n = 2). |
|||||
FIGURE 2. Number* of reported laboratory-confirmed sporadic cases of cyclosporiasis, by month of symptom onset or diagnosis† and by international travel history --- United States, 1997--2008
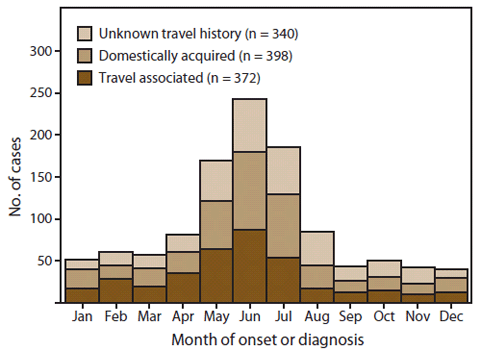
* N = 1,110.
† The month of report was used for 14 cases.
Alternate Text: The figure shows the number of reported laboratory-confirmed sporadic cases of cyclosporiasis reported in the United States for 1997-2008 by month of symptom onset or diagnosis (and for 14 cases, the month of report) and by international travel history. The greatest numbers of cases were reported for May, June, and August.
FIGURE 3. Number* of domestically acquired laboratory-confirmed sporadic cases of cyclosporiasis, by county of residence --- United States, 1997--2008
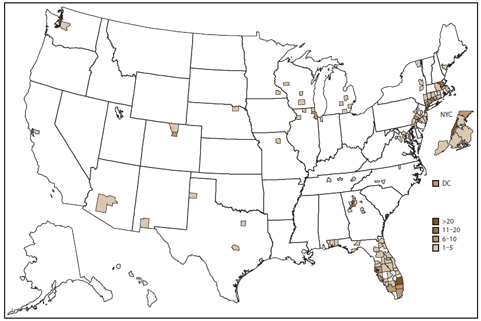
* N = 390. County of residence was unknown or missing for eight case-patients.
Alternate Text: The figure shows a map indicated the counties of residence in the United States for patients with domestically acquired laboratory-confirmed sporadic cases of cyclosporiasis reported for 1997-2008. The majority of cases occurred in the eastern or southeastern regions.
Use of trade names and commercial sources is for identification only and does not imply endorsement by the U.S. Department of
Health and Human Services.
References to non-CDC sites on the Internet are
provided as a service to MMWR readers and do not constitute or imply
endorsement of these organizations or their programs by CDC or the U.S.
Department of Health and Human Services. CDC is not responsible for the content
of pages found at these sites. URL addresses listed in MMWR were current as of
the date of publication.
All MMWR HTML versions of articles are electronic conversions from typeset documents.
This conversion might result in character translation or format errors in the HTML version.
Users are referred to the electronic PDF version (http://www.cdc.gov/mmwr)
and/or the original MMWR paper copy for printable versions of official text, figures, and tables.
An original paper copy of this issue can be obtained from the Superintendent of Documents, U.S.
Government Printing Office (GPO), Washington, DC 20402-9371;
telephone: (202) 512-1800. Contact GPO for current prices.
**Questions or messages regarding errors in formatting should be addressed to
mmwrq@cdc.gov.
