Persons using assistive technology might not be able to fully access information in this file. For assistance, please send e-mail to: mmwrq@cdc.gov. Type 508 Accommodation and the title of the report in the subject line of e-mail.
Giardiasis Surveillance --- United States, 2006--2008
Abstract
Problem/Condition: Giardiasis is a nationally notifiable gastrointestinal illness caused by the protozoan parasite Giardia intestinalis.
Reporting Period: 2006--2008.
System Description: State, commonwealth, territorial, and two metropolitan health departments voluntarily report cases of giardiasis through CDC's National Notifiable Disease Surveillance System.
Results: During 2006--2008, the total number of reported cases of giardiasis increased slightly from 19,239 for 2006 to 19,794 for 2007 and decreased slightly to 19,140 for 2008. During this period, 49 jurisdictions reported giardiasis cases; giardiasis is a reportable condition in 45 states (not reportable in Indiana, Kentucky, Mississippi, North Carolina, and Texas). A greater number of case reports were received for children aged 1--9 years and for adults aged 35--44 years compared with other age groups. Incidence of giardiasis was highest in northern states. Peak onset of illness occurred annually during early summer through early fall.
Interpretation: Transmission of giardiasis occurs throughout the United States, with more frequent diagnosis or reporting occurring in northern states. However, state incidence figures should be compared with caution because individual state surveillance systems have varying capabilities to detect cases. The seasonal peak in age-specific case reports coincides with the summer recreational water season and likely reflects increased outdoor activities and exposures such as camping and use of communal swimming venues (e.g., lakes, rivers, swimming pools, and water parks) by young children.
Public Health Action: Local and state health departments can use giardiasis surveillance data to better understand the epidemiologic characteristics and the disease burden of giardiasis in the United States, design efforts to prevent the spread of disease, and establish research priorities.
Introduction
Giardia intestinalis (also known as G. lamblia and G. duodenalis) is the most common intestinal parasite of humans identified in the United States (1). This flagellated protozoan causes a generally self-limited clinical illness (i.e., giardiasis) typically characterized by diarrhea, abdominal cramps, bloating, weight loss, and malabsorption; asymptomatic infection also occurs frequently (2--4). Case reports have associated giardiasis with the development of chronic enteric disorders, allergies, and reactive arthritis (5--7).
Giardia infection is transmitted by the fecal-oral route and results from the ingestion of Giardia cysts through the consumption of fecally contaminated food or water or through person-to-person (or, to a lesser extent, animal-to-person) transmission. The cysts are infectious immediately upon being excreted in feces. The infectious dose is low; ingestion of 10 cysts has been reported to cause infection (8). Infected persons have been reported to shed 108--109 cysts in their stool per day and to excrete cysts for months (8--10). Effective therapies are available for patients with symptomatic giardiasis, including metronidazole, nitazoxanide, tinidazole, paromomycin, furazolidone, and quinacrine (11).
Giardia is distributed globally and has been detected in nearly all classes of vertebrates, including domestic animals and wildlife (12). Although G. intestinalis infects both humans and animals, the role of zoonotic transmission to humans and the importance of animal contamination of food and water are being re-examined. Recent advances in molecular epidemiology have permitted identification of specialized genetic groups (i.e., assemblages) that are relatively species-specific. Assemblages A and B of G. intestinalis infect primarily humans and primates; assemblages C and D infect dogs, assemblage F infects cats, assemblage E infects hoofstock, and assemblage G infects rodents (13). These findings suggest that G. intestinalis does not have as high a level of zoonotic disease transmission potential as thought previously (13).
Persons at increased risk for infection include 1) travelers to disease-endemic areas, 2) children in child care settings, 3) close contacts of infected persons (e.g., those in the same family or household or in a child care setting), 4) persons who ingest contaminated drinking water, 5) persons who swallow contaminated recreational water (e.g., water in lakes, rivers, and pools), 6) persons taking part in outdoor activities (e.g., backpacking or camping) who consume unfiltered, untreated water or who fail to practice good hygienic behaviors (e.g., hand washing), 7) persons who have contact with infected animals, and 8) men who have sex with men (2,14--18). Giardiasis does not appear to be opportunistic in persons infected with human immunodeficiency virus. The relative contribution of person-to-person, animal-to-person, foodborne, and waterborne transmission to sporadic human giardiasis in the United States is not well understood.
Although giardiasis cases occur sporadically, outbreaks from multiple transmission routes are well documented. During 1997--2006, Giardia was identified as a causal agent of six (3.7%) of 162 reported recreational water-associated gastroenteritis outbreaks and of 15 (10.6%) of 141 reported drinking water-associated gastroenteritis outbreaks in the United States (19--24). Worldwide, it is one of the most frequently identified parasites associated with waterborne disease outbreaks (25). Foodborne outbreaks of giardiasis are reported rarely. During 1998--2007, of 7,650 foodborne outbreaks with an identified etiology, 15 (0.2%) were attributed to Giardia. (26). Improper hygiene practices have contributed to outbreaks of giardiasis associated with food (27), person-to-person transmission in child care centers (28), and communitywide outbreaks with waterborne and person-to-person transmission routes (29). Outbreaks associated with drinking water might be associated with animal contamination of water systems (30,31). However, the zoonotic transmission of giardiasis is not believed to play a major role in human disease (32).
In 1992, the Council of State and Territorial Epidemiologists assigned a reporting number for giardiasis (code 11570) to facilitate transmission of reported giardiasis data to CDC. Surveillance data for 1992--2005 have been published previously (33--35). Reporting of giardiasis as a nationally notifiable disease began in 2002. This report summarizes national giardiasis surveillance data for 2006--2008.
Methods
Case Definition
Confirmed and probable cases of giardiasis are reported voluntarily to CDC. A confirmed case of giardiasis (i.e., one that has a positive laboratory finding) is defined as the detection of Giardia intestinalis
- cysts in stool specimens or trophozoites in stool specimens, duodenal fluid, or small-bowel tissue by microscopic examination using staining methods (e.g., trichrome) or direct fluorescent antibody assays (DFA); or
- antigens in stool specimens by immunodiagnostic testing (e.g., enzyme-linked immunosorbent assay) (36).
A probable case of giardiasis is a clinically compatible case that is linked epidemiologically to a confirmed case (36).
Testing
Because Giardia cysts can be excreted intermittently, multiple stool collections (i.e., three stool specimens collected every other day) increase test sensitivity (37). The use of concentration methods and trichrome staining might not be sufficient to identify Giardia because variability in the concentration of organisms in the stool can make this infection difficult to diagnose. For this reason, fecal immunoassays that are more sensitive and specific should be used (38). Direct fluorescent antibody (DFA) testing is an extremely sensitive and specific detection method and is considered the "gold standard" by many laboratorians; other immunodiagnostic kits that do not require microscopy (e.g., enzyme immunoassay [EIA] testing and rapid immunochromatographic cartridge assays) also are available (38); they do not take the place of routine ova and parasite examination but might be useful in diagnosing Giardia infections. Only molecular testing (e.g., polymerase chain reaction [PRC]) can be used to subtype Giardia; however, no subtyping data are reported to CDC.
Reporting
Health departments in 45 states (all except Indiana, Kentucky, Mississippi, North Carolina, and Texas), the District of Columbia (DC), New York City (NYC), the Commonwealth of Puerto Rico, and Guam voluntarily report laboratory-confirmed and probable cases of giardiasis to CDC through the National Notifiable Disease Surveillance System (NNDSS). Reports include the patient's place of residence (i.e., state and county), age, sex, race, ethnicity (i.e., Hispanic or non-Hispanic), and date of illness onset and indicate whether the case is linked epidemiologically to a known outbreak. Because this report includes probable cases of giardiasis, and because certain data were finalized recently, the number of cases might differ slightly from the number reported in CDC's annual Summary of Notifiable Diseases.
Analysis
Analysis of national giardiasis surveillance data for 2006--2008 was conducted using SAS v.9.1 (SAS Institute, Inc.; Cary, North Carolina) and the Food Safety Information Link (FSI Link). FSI Link is an intranet-based tool available to CDC staff that provides access to NNDSS data and is used to monitor trends in and investigate outbreaks of reportable foodborne and waterborne diseases. Population data from the U.S. Census Bureau were used to calculate incidence rates.
Results
During 2006--2008, the total number of reported cases of giardiasis increased 2.9%, from 19,239 for 2006 to 19,794 for 2007 and then decreased 3.3% to 19,140 for 2008 (Table 1). During this period, 49 jurisdictions (45 states, two cities, Puerto Rico, and Guam) reported giardiasis cases. No reports were received from the five states (Indiana, Kentucky, Mississippi, North Carolina, and Texas) in which giardiasis is not a reportable disease.
For 2008, among jurisdictions reporting cases, incidence of giardiasis per 100,000 population ranged from 2.2 cases in Arizona to 33.8 cases in Vermont (Table 1; Figure 1). Vermont reported the greatest number of cases per 100,000 population for each of the 3 years of the reporting period. Northern states reported more cases annually per 100,000 population than southern states (Table 1; Figure 1).
Surveillance data displayed a bimodal age distribution, with the greatest number of reported cases occurring among children aged 1--4 and 5--9 years and adults aged 35--44 years (Figure 2). When reports for which a patient's sex was missing or unknown were excluded, the percentage of cases reported to have occurred among males remained consistent at 56.2% (10,671 of 18,994) for 2006, 56.5% (11,069 of 19,585) for 2007, and 56.7% (10,786 of 19,019) for 2008 (Table 2).
The majority of cases for which data on race were available for 2006--2008 occurred among whites, followed by blacks, Asians/Pacific Islanders, and American Indians/Alaska Natives (Table 2). However, data on race were not included for 41.2%--43.7% of total annual case reports. Although 7.2%--8.2% of patients for whom data on ethnicity were reported were identified as Hispanic, data on ethnicity were lacking for 49.3%--52.2% of total annual case reports.
A twofold increase in reported giardiasis cases by onset of illness occurred during June--October compared with January--March (Figure 3). Age-specific analysis indicated a twofold increase in onset of illness during June--October among all age groups. This seasonality is particularly evident among children (Figure 4). The highest numbers of giardiasis cases were reported among children aged 1--4 and 5--9 years and adults aged 40--44 years (Figure 4). The incidence of giardiasis has remained relatively stable since it became nationally notifiable in 2002 (Figure 5).
Discussion
National giardiasis surveillance data are used to assess the epidemiologic characteristics and disease burden of giardiasis in the United States. Following a gradual decline in case reports during 1996--2001 (33,34), the number of case reports and disease incidence appears to have stabilized, coinciding with the disease becoming nationally notifiable in 2002 (Figure 5).
Giardiasis is widespread geographically in the United States. The number of cases reported is higher in the northern states (Figure 1). However, because differences in giardiasis surveillance systems among states can affect the capability to detect cases, whether this finding is of biologic significance or only reflects differences in case detection or reporting is difficult to determine.
Although giardiasis affects persons in all age groups, the number of reported cases was highest among children aged 1--9 years and adults aged 35--44 years. These data for younger age groups are consistent with reports published previously of giardiasis incidence being higher among younger children as well as contributing to transmission to their caregivers (e.g., child care facility staff, family members, and other household contacts) (2,33--35,39,40). Giardia was identified frequently as the cause of diarrhea among children examined in outpatient clinics (41), and transmission from ill children to household contacts has been documented in outbreak investigations (29,42).
The marked seasonality in the onset of illness occurring in early summer through early fall is not unexpected. A twofold increase in transmission of giardiasis occurred during the summer, coinciding with increased outdoor activities (e.g., camping and swimming). This increase likely reflects increased use of untreated water for drinking (e.g., lakes and rivers) while outdoors as well as increased use of community swimming (essentially communal bathing) venues by younger children during the summer months. In addition to animal contamination of surface water, transmission through use of surface water (e.g., lakes and rivers) and disinfected venues (e.g., swimming pools and water parks) is facilitated by the substantial number of Giardia cysts that can be shed by a single person (9); the extended periods of time that cysts can be shed (10); the low infectious dose (8); the moderate chlorine tolerance of Giardia (43); the prevalence of improper pool maintenance (i.e., insufficient disinfection, filtration, and recirculation of water), particularly of children's wading pools (44); the prevalence of Giardia in fecal material in pools (45); and documented transmission of Giardia infection among diapered children (28,42,46) who use swimming venues regularly. This seasonal variation also has been noted in state, Canadian provincial, and previous U.S. national surveillance data for giardiasis and cryptosporidiosis (33--35,39,40).
Among patients for whom data on sex were reported, a majority of cases occurred among males (Table 2). This might be attributable in part to sexual contact among men who have sex with men (16). However, the majority of cases occurred in males in nearly every age group (except those aged ≥65 years), which suggests the influence of other factors.
Outbreaks have been linked to drinking water sources contaminated with Giardia. In 2007, a neighborhood outbreak of giardiasis in New Hampshire was linked to contamination of a ground water well used for drinking water by the community (30). Thirty-one confirmed or probable cases were identified and determined to be associated with drinking tap water. One of the groundwater wells supplying the community was dug in close proximity to surface water, a small stream, where evidence of beaver inhabitation was discovered. The well tested positive for fecal coliforms and was disconnected from the water supply, after which the outbreak declined. PCR testing was used to genotype the cases as assemblage B, a subtype that has not been reported previously in humans but has been found in beavers in nearby Massachusetts. Two beavers from the area tested negative for Giardia, but beavers could not be ruled out as the source because shedding of cysts is sporadic.
Although untreated or unfiltered drinking water is a risk factor for giardiasis, contaminated recreational water has also been implicated as a source of illnesses and outbreaks. In a study of sporadic giardiasis in England, swallowing water while swimming and recreational contact with fresh water were both risk factors for contracting Giardia (18). An outbreak in Florida in 2006 at an interactive fountain was caused by Giardia and Cryptosporidium and resulted in illness among 57 persons over a 2-month period (47). Investigation of this outbreak revealed deficiencies in the design, maintenance, and operation of the interactive fountain as well as bather behavior (i.e., swimming while ill with diarrhea) that led to ongoing contamination of the interactive fountain.
Foodborne transmission of Giardia generally occurs by direct contamination by an infected food handler (27), the use of contaminated water in the preparation of food (48), or animal contamination of food (49). In a study of sporadic giardiasis in England, eating lettuce was associated with increased risk for giardiasis (18). The use of reclaimed wastewater for irrigation is associated with the finding of Giardia cysts on fresh produce (50). The importance of food in the transmission of Giardia is highlighted by five giardiasis outbreaks during 2006--2007. In 2006, two confirmed foodborne outbreaks occurred in California and New York (26). In California, 48 ill persons had attended the same church event, and in New York, eight patients became ill after a restaurant-catered lunch at a school. A third suspected outbreak occurred in Florida, where four patients had eaten at the same restaurant. In 2007, two confirmed foodborne outbreaks occurred in Missouri and Vermont (26). In Missouri, 15 attendees at a catered event became ill after eating chicken parmesan and lettuce salads. The caterer was not licensed and worked out of her home (26). In Vermont, 36 boys became ill at a summer camp with no running water or electricity. The source of the outbreak was not identified (26).
The relative importance of zoonotic transmission of Giardia, either directly or indirectly (e.g., through water or food contamination) is unknown. Cattle have been suspected to contribute to the contamination of drinking water with Giardia as a result of farm run-off and the land application of animal waste. In the United States and Australia, livestock are infected predominately with the bovine-specific genetic assemblage E (which is not infective to humans). Assemblage A (which is a human pathogen) can be found in a small proportion of cattle, but investigations of contaminated water supplies typically incriminate effluent from human waste as the source of contamination (12). However, as the New Hampshire outbreak demonstrates, other potential zoonotic sources exist in wildlife. In a molecular study, the same genetic assemblage B was identified in samples from humans, muskrats, beavers, and rabbits, suggesting the potential for zoonotic transmission or water contamination from these species (51).
Household pets also represent a potential source of zoonotic transmission. Giardia is the most prevalent intestinal parasite in otherwise healthy pet dogs in Australia; 9.4% of dogs in a study tested positive on fecal specimens; assemblages C and D were identified most frequently (52). A study in India identified identical assemblages (A and B) in humans and their pet dogs (53). Because of poor hygiene in the village, including the dogs' access to human feces, whether the infection was of zoonotic or anthroponotic transmission was unclear. Ongoing advances in molecular epidemiology will increase understanding of the importance of animals as a risk factor for giardiasis (54).
Despite the zoonotic potential, infected human waste is the greatest known risk factor for infection with Giardia, whether transmission is through direct fecal-oral contact or indirectly through ingestion of fecally contaminated water. In a study of sporadic giardiasis in New Zealand, exposure to human waste was a significant risk factor, specifically exposure to diaper changing and occupational exposure to human waste (55). The study also determined that housewives and nursing mothers were at increased risk for giardiasis compared with other social groups, which is consistent with increased risk for exposure to diapers (55). Children attending child care facilities are at increased risk for giardiasis (15), and outbreaks have occurred in child care facilities, leading to infections among caregivers and household members (28,56,57).
Giardiasis (as with all diseases caused by enteric pathogens) is likely underreported because 1) not all infected persons are symptomatic, 2) those who are symptomatic do not always seek medical care (58,59), 3) health-care providers do not always include laboratory diagnostics in their evaluation of non-bloody diarrheal diseases (58), 4) case reports are not always completed for positive laboratory results or forwarded to public health officials (60), and 5) giardiasis is not a reportable disease in five states.
Its low infectious dose, protracted communicability, and moderate chlorine tolerance make Giardia ideally suited for transmission through drinking and recreational water, food, and person-to-person contact. Strategies to reduce the incidence of giardiasis have focused on reducing waterborne and person-to-person transmission. The Environmental Protection Agency (EPA) enacted the Surface Water Treatment Rule (SWTR) in 1989 and the Interim Enhanced SWTR in 1998 (21). These regulations have decreased the number of giardiasis outbreaks associated with community drinking water systems (20--24). In 2006, EPA finalized the Ground Water Rule to address contamination of public ground water (well) systems, which is likely to reduce the number of groundwater-associated outbreaks of giardiasis. Person-to-person transmission of Giardia is difficult to interrupt in a systematic fashion, particularly in childcare settings (56). Adherence to appropriate infection control (e.g., exclusion of children ill with diarrhea, hand washing, diaper changing, and separation of ill children) policies is recommended for controlling giardiasis, and other enteric pathogens, in these group settings (57).
Limitations
The data provided in this report are subject to several limitations, including likely underreporting of cases, lack of information on race and ethnicity on the majority of case-reports, and absence of information on risk factors or attributable fractions by exposure types. Despite these limitations, the data in this report provide the only national overview of giardiasis available.
Conclusion
Continued efforts to reduce risk and improve diagnosis and reporting of giardiasis are needed to decrease the transmission of giardiasis in the United States. Prevention measures (Box 1) and measures to improve surveillance for giardiasis and increase understanding of its epidemiology and the associated disease burden (Box 2) have been recommended. Additional information about giardiasis is available at http://www.cdc.gov/ncidod/dpd/parasites/giardiasis/factsht_giardia.htm.
Acknowledgments
This report is based, in part, on contributions by jurisdiction surveillance coordinators; Ruth Ann Jajosky, DMD, Office of Surveillance, Epidemiology, and Laboratory Services (proposed), Michele Hlavsa, MPH, Virginia Roberts, MPH, Division of Foodborne, Waterborne, and Environmental Diseases (proposed), National Center for Emerging and Zoonotic Infectious Diseases (proposed), CDC.
References
- Kappus KD, Lundgren RG, Juranek DD, Roberts JM, Spencer HC. Intestinal parasitism in the United States: update on a continuing problem. Am J Trop Med Hyg 1994;50:705--13.
- Thompson RC. Giardiasis as a re-emerging infectious disease and its zoonotic potential. Intl J Parasitol 2000;30:1259--67.
- Hellard ME, Sinclair MI, Hogg GG, Fairley CK. Prevalence of enteric pathogens among community based asymptomatic individuals. Gastroenterol Hepatol 2000;15:290--3.
- Rodriguez-Hernandez J, Canut-Blasco A, Martin-Sanchez AM. Seasonal prevalences of Cryptosporidium and Giardia infections in children attending day care centres in Salamanca (Spain) studied for a period of 15 months. Eur J Epidemiol 1996;12:291--5.
- Tupchong M, Simor A, Dewar C. Beaver fever---a rare cause of reactive arthritis. J Rheumatol 1999;26:2701--2.
- D'Anchino M, Orlando D, De Feudis L. Giardia lamblia infections become clinically evident by eliciting symptoms of irritable bowel syndrome. J Infect 2002;45:169--72.
- Di Prisco MC, Hagel I, Lynch NR, Barrios RM, Alvarez N, López R. Possible relationship between allergic disease and infection by Giardia lamblia. Ann Allergy 1993;70:210--3.
- Rendtorff RC. The experimental transmission of human intestinal protozoan parasites. II. Giardia lamblia cysts given in capsules. Am J Hyg 1954;59:209--20.
- Danciger M, Lopez M. Numbers of Giardia in the feces of infected children. Am J Trop Med Hyg 1975;24:237--42.
- Pickering LK, Woodward WE, DuPont HL, Sullivan P. Occurrence of Giardia lamblia in children in day care centers. J Pediatr 1984;104:522--6.
- The Medical Letter. Giardiasis. In: Abramowicz M, ed. Drugs for parasitic infections. New Rochelle, NY: The Medical Letter; 2007:23.
- Thompson RC. The zoonotic significance and molecular epidemiology of Giardia and giardiasis. Vet Parasitol 2004;126:15--35.
- Xiao L, Fayer R. Molecular characterisation of species and genotypes of Cryptosporidium and Giardia and assessment of zoonotic transmission. Int J Parasitol. 2008;38:1239-55.
- Birkhead G, Vogt RL. Epidemiologic surveillance for endemic Giardia lamblia infection in Vermont. The roles of waterborne and person-to-person transmission. Am J Epidemiol 1989;129:762--8.
- Hoque ME, Hope VT, Scragg R, Kjellstrom T, Lay-Yee R. Nappy handling and risk of giardiasis. Lancet 2001;357:1017--8.
- Esfandiari A, Swartz J, Teklehaimanot S. Clustering of giardiasis among AIDS patients in Los Angeles County. Cell Mol Biol 1997;43:1077--83.
- Welch TP. Risk of giardiasis from consumption of wilderness water in North America: a systematic review of epidemiologic data. Int J Infect Dis 2000;4:100--3.
- Stuart JM, Orr HJ, Warburton FG, et al. Risk factors for sporadic giardiasis: a case-control study in southwestern England. Emerg Infect Dis 2003;9:229--33.
- Yoder JS, Hlavsa MC, Craun GF, et al. Surveillance for waterborne disease and outbreaks associated with recreational water use and other aquatic facility-associated health events---United States, 2005--2006. In: Surveillance Summaries, September 12, 2008. MMWR 2008;57(No. SS-9):1--29.
- Yoder JS, Roberts V, Craun GF, et al. Surveillance for waterborne disease and outbreaks associated with drinking water and water not intended for drinking --- United States, 2005--2006. In: Surveillance Summaries, September 12, 2008. MMWR 2008;57(No. SS-9):39--69.
- Liang JL, Dziuban EJ, Craun GF, et al. Surveillance for waterborne disease and outbreaks associated with drinking water and water not intended for drinking---United States, 2003--2004. In: Surveillance Summaries, December 22, 2006. MMWR 2006;55(No. SS-12):31--65.
- Blackburn B, Craun GF, Yoder JS, et al. Surveillance for waterborne-disease outbreaks associated with drinking water---United States, 2001--2002. In: Surveillance Summaries, October 22, 2004. MMWR 2004; 53(No. SS-8):23--45.
- Lee SH, Levy DA, Craun GF, Beach MJ, Calderon RL. Surveillance for waterborne-disease outbreaks---United States, 1999--2000. In: Surveillance Summaries, November 22, 2002. MMWR 2002;51(No. SS-8):1--48.
- Barwick RS, Levy DA, Craun GF, Beach MJ, Calderon RL. Surveillance for waterborne disease outbreaks---United States, 1997--1998. In: Surveillance Summaries, May 26, 2000. MMWR 2000;49 (No. SS-4):1--35.
- Karanis P, Kourenti C, Smith H. Waterborne transmission of protozoan parasites: a worldwide review of outbreaks and lessons learnt. J Water Health 2007;5:1--38.
- CDC. Annual listing of foodborne disease outbreaks, United States. Atlanta, GA: US Department of Health and Human Services, CDC; 2009. Available at http://www.cdc.gov/outbreaknet/surveillance_data.html. Accessed May 13, 2010.
- Quick R, Paugh K, Addiss D, Kobayashi J, Baron R. Restaurant- associated outbreak of giardiasis. J Infect Dis 1992;166:673--6.
- Ang LH. Outbreak of giardiasis in a daycare nursery. Commun Dis Public Health 2000;3:212--3.
- Katz DE, Heisey-Grove D, Beach MJ, Dicker RC, Matyas BT. Prolonged outbreak of giardiasis with two modes of transmission. Epidemiol Infect 2006;134:935--41.
- Daly ER, Roy SJ, Blahey DD, et al. Outbreak of giardiasis associated with a community drinking water source, New Hampshire, 2007. Epidemiol Infect 2010;138:491--500.
- Navin TR, Juranek DD, Ford M, Minedew DJ, Lippy EC, Pollard RA. Case-control study of waterborne giardiasis in Reno, Nevada. Am J Epidemiol 1985;122:269--75.
- Hunter PR, Thompson RCA. The zoonotic transmission of Giardia and Cryptosporidium. Int J Parasitol 2005;35:1181--90.
- Furness BW, Beach MJ, Roberts JM. Giardiasis surveillance---United States, 1992--1997. In: Surveillance Summaries, August 11, 2000. MMWR 2000;49(No. SS-7):1--13.
- Hlavsa MC, Watson JC, Beach MJ. Giardiasis surveillance---United States, 1998--2002. In: Surveillance Summaries, January 28, 2004. MMWR 2004;54(No. SS-1):9--16.
- Yoder JS, Beach MJ. Giardiasis surveillance---United States, 2003--2005. In: Surveillance Summaries, September 7, 2007. MMWR 2007;56(No. SS-7):11--8.
- CDC. Giardiasis (Giardia lamblia) case definition. Atlanta, GA: US Department of Health and Human Services, CDC; 1997. Available at http://www.cdc.gov/ncphi/disss/nndss/casedef/Giardiasis_current.htm. Accessed May 13, 2010.
- Clinical and Laboratory Standards Institute. Procedures for the recovery and identification of parasites from the intestinal tract; approved guideline. 2nd ed. CLSI document M28-A2. Wayne, PA: Clinical Laboratory Standards Institute; 2005.
- Johnston SP, Ballard MM, Beach MJ, Causer L, Wilkins PP. Evaluation of three commercial assays for detection of Giardia and Cryptosporidium organisms in fecal specimens. J Clin Microbiol 2003;41:623--6.
- Naumova, EN, Chen JT, Griffiths JK, Matyas BT, Estes-Smargiassi SA, Morris RD. Use of passive surveillance data to study temporal and spatial variation in the incidence of giardiasis and cryptosporidiosis. Public Health Rep 2000;115:436--47.
- Greig JD, Michel P, Wilson JB, et al. A descriptive analysis of giardiasis cases reported in Ontario, 1990--1998. Can J Public Health 2001;92:361--5.
- Caeiro JP, Mathewson JJ, Smith MA, et al. Etiology of outpatient pediatric nondysenteric diarrhea: a multicenter study in the United States. Pediatr Infect Dis J 1999;18:94--7.
- Polis MA, Tuazon CU, Alling DW, Talmanis E. Transmission of Giardia lamblia from a day care center to the community. Am J Public Health 1986;76:1142--4.
- Jarroll EL, Bingham AK, Meyer EA. Effect of chlorine on Giardia lamblia cyst viability. Appl Environ Microbiol 1981;41:483--7.
- CDC. Violations identified from routine swimming pool inspections---selected states and counties, United States, 2008. MMWR 2010;59:582--7.
- CDC. Prevalence of parasites in fecal material from chlorinated swimming pools---United States, 1999. MMWR 2001;50:410--2.
- Harter L, Frost F, Grunenfelder G, Perkins-Jones K, Libby J. Giardiasis in an infant and toddler swim class. Am J Public Health 1984;74:155--6.
- Eisenstein L, Bodager D, Ginzl D. Outbreak of giardiasis and cryptosporidiosis associated with a neighborhood interactive water fountain---Florida, 2006. J Environ Health 2008;71:18--22.
- Dawson D. Foodborne protozoan parasites. Int J Food Microbiol 2005;103:207--27.
- Smith HV, Cacciò SM, Cook N, Nichols RA, Tait A. Cryptosporidium and Giardia as foodborne zoonoses. Vet Parasitol 2007;149:29--40.
- Amahmid O, Asmama S, Bouhoum K. The effect of waste water reuse in irrigation on the contamination level of food crops by Giardia cysts and Ascaris eggs. Int J Food Microbiol 1999;49:19--26.
- Sulaiman IM, Fayer R, Bern C, et al. Triosephosphate isomerase gene characterization and potential zoonotic transmission of Giardia duodenalis. Emerg Infect Dis 2003;9:1444--52.
- Palmer CS, Traub RJ, Robertson ID, Devlin G, Rees R, Thompson RC. Determining the zoonotic significance of Giardia and Cryptosporidium in Australian dogs and cats. Vet Parasitol 2008;154:142--7.
- Traub RJ, Monis PT, Robertson I, Irwin P, Mencke N, Thompson RC. Epidemiological and molecular evidence supports the zoonotic transmission of Giardia among humans and dogs living in the same community. Parasitology 2004;128:253--62.
- Thompson RC, Palmer CS, O'Handley R. The public health and clinical significance of Giardia and Cryptosporidium in domestic animals. Vet J 2008;177:18--25.
- Hoque ME, Hope VT, Kjellström T, Scragg R, Lay-Yee R. Risk of giardiasis in Aucklanders: a case-control study. Int J Infect Dis 2002;6:191--7.
- Steketee RW, Reid S, Cheng T, Stoebig JS, Harrington RG, Davis JP. Recurrent outbreaks of giardiasis in a child day care center, Wisconsin. Am J Public Health 1989;79:485--90.
- Pickering LK, Bartlett AV, Woodward WE. Acute infectious diarrhea among children in day care: epidemiology and control. Rev Infect Dis 1986;8:539--47.
- Scallan E, Jones TF, Cronquist A, et al. Factors associated with seeking medical care and submitting a stool sample in estimating the burden of foodborne illness. Foodborne Pathog Dis 2006;3:432--8.
- Voetsch AC, Van Gilder TJ, Angulo FJ, et al. FoodNet estimate of the burden of illness caused by nontyphoidal Salmonella infections in the United States. Clin Infect Dis 2004;38(Suppl):S127--S134.
- Mead PS, Slutsker L, Dietz V, et al. Food-related illness and death in the United States. Emerg Infect Dis 1999;5:607--25.
|
TABLE 1. (Continued) Number and percentage* of giardiasis case reports, by state/area --- National Notifiable Disease Surveillance System, United States, 2006--2008 |
||||||||||||
|---|---|---|---|---|---|---|---|---|---|---|---|---|
|
2006 |
2007 |
2008 |
||||||||||
|
State/Area |
No. |
(%) |
Rate† |
No. outbreak cases§ |
No. |
(%) |
Rate |
No. outbreak cases |
No. |
(%) |
Rate |
No. outbreak cases |
|
Guam |
5 |
(<0.1) |
2.9 |
2 |
(<0.1) |
1.2 |
0 |
|||||
|
Puerto Rico |
276 |
(1.4) |
7.0 |
1 |
371 |
(1.9) |
9.4 |
1 |
227 |
(1.2) |
5.7 |
1 |
|
Total |
19,239 |
(100.0) |
--- |
393 |
19,794 |
(100.0) |
--- |
346 |
19,140 |
(100.0) |
--- |
189 |
|
Sources: Population estimates are from the Population Division, U.S. Census Bureau. Annual estimates of the resident population for the United States, regions, states, and Puerto Rico: April 1, 2001--July 1, 2008 (NST-EST 2008-01) available at http://www.census.gov/popest/states. Estimates of the New York City population are from annual estimates of the population for incorporated places over 100,000, ranked by July 1, 2005 Population: April 1, 2001--July 1, 2008 (SUB-EST 2008-01) available at http://www.census.gov/popest/cities. Estimates of the population of Guam are from International Data Base (IDB) data access--spreadsheet available at http://www.census.gov/ipc/www/idbsprd.html. * Percentages might not total 100% because of rounding. † Per 100,000 population. § Number of cases linked to a known outbreak. ¶ Giardia is not a reputable condition in five states. ** New York State case reports include New York City. |
||||||||||||
FIGURE 1. Incidence* of giardiasis, by state/area --- National Notifiable Disease Surveillance System, United States, 2008
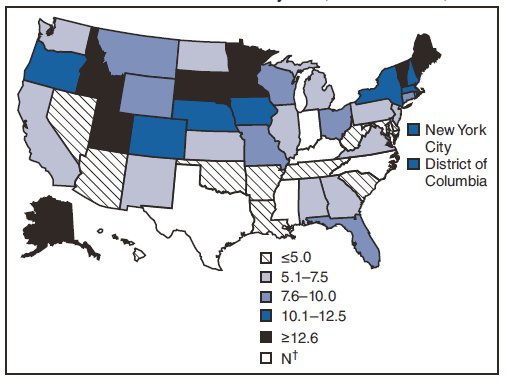
* Per 100,000 population.
† Not a reportable disease in these states.
Alternate Text: The figure shows incidence of giardiasis per 100,000 population by state. Incidence of giardiasis was highest in northern states.
FIGURE 2. Number* of giardiasis case reports, by age group and year --- National Notifiable Disease Surveillance System, United States, 2006--2008
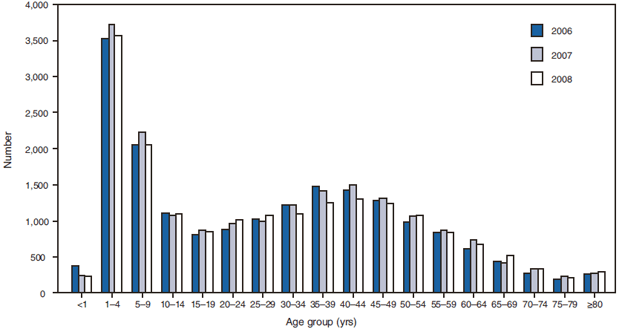
* N = 58,186; age group unknown for 1,083 cases.
Alternate Text: The figure shows the number of giardiasis case reports by age group and year. The number of case reports was highest for children aged 1-4 years and 5-9 years compared with other age groups.
FIGURE 3. Number* of giardiasis case reports, by date of illness onset --- National Notifiable Disease Surveillance System, United States, 2006--2008
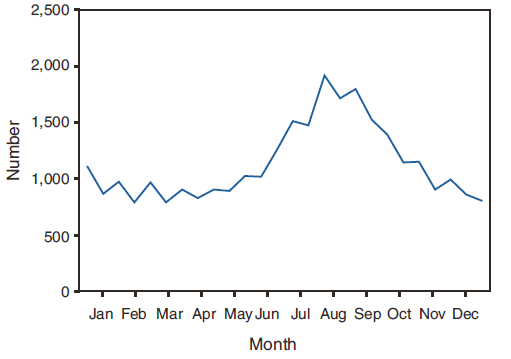
* N = 58,186; onset date was unknown for 28,650 cases.
Alternate Text: The figure shows the number of giardiasis case reports by month. The greatest number of case reports occur during the summer months.
FIGURE 4. Number* of giardiasis case reports, by selected age group† and date of illness onset --- National Notifiable Disease Surveillance System, United States, 2006--2008
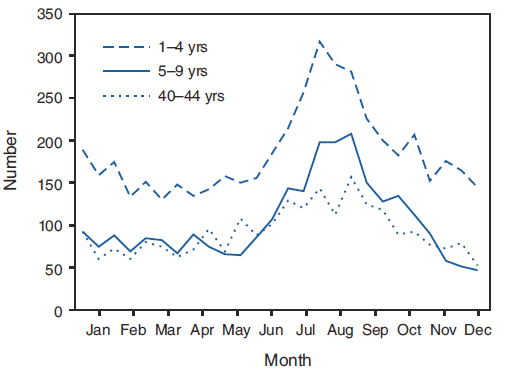
* N = 9,921.
† The three age groups (1--4, 5--9, and 40--44 years) with the highest numbers of giardiasis case reports are presented. All age groups exhibited a twofold or greater increase during summer months.
Alternate Text: The figure shows the number of giardiasis case reports by age group and date of illness onset. The three age groups (1-4, 5-9, and 40-44 years) with the highest numbers of giardiasis case reports are resented. All age groups exhibited a twofold or greater increase during summer months.
FIGURE 5. Incidence* of giardiasis, by year --- National Notifiable Disease Surveillance System, United States, 1993--2008†
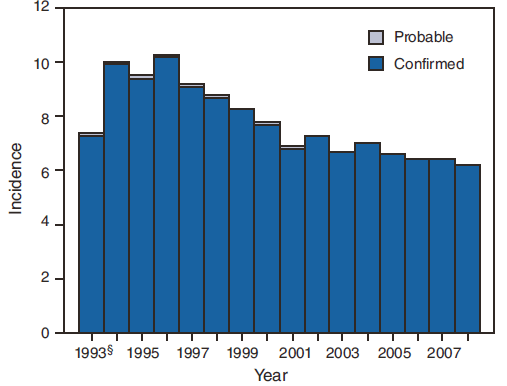
* Per 100,000 population.
† N = 354,385.
§ First year with use of assigned reporting number.
Alternate Text: The figure shows incidence of giardiasis per 100,000 population by year since 1993, the first year with an assigned reporting number for the disease. The incidence of giardiasis has remained relatively stable since 2002.
|
BOX 1. CDC recommendations to prevent and control giardiasis |
|
Practice good hygiene.
Additional information about hygiene is available at http://www.cdc.gov/healthywater/hygiene.
Additional information about recreational water illnesses and how to stop them from spreading is available at http://www.cdc.gov/healthywater/swimming.
Avoid water that might be contaminated.
Information about water filters is available at http://www.cdc.gov/crypto/gen_info/filters.html. Avoid eating food that might be contaminated.
Information about how to prevent illnesses while traveling is available at http://wwwnc.cdc.gov/travel/content/safe-food-water.aspx. Prevent contact and contamination with feces during sex.
|
Use of trade names and commercial sources is for identification only and does not imply endorsement by the U.S. Department of
Health and Human Services.
References to non-CDC sites on the Internet are
provided as a service to MMWR readers and do not constitute or imply
endorsement of these organizations or their programs by CDC or the U.S.
Department of Health and Human Services. CDC is not responsible for the content
of pages found at these sites. URL addresses listed in MMWR were current as of
the date of publication.
All MMWR HTML versions of articles are electronic conversions from typeset documents.
This conversion might result in character translation or format errors in the HTML version.
Users are referred to the electronic PDF version (http://www.cdc.gov/mmwr)
and/or the original MMWR paper copy for printable versions of official text, figures, and tables.
An original paper copy of this issue can be obtained from the Superintendent of Documents, U.S.
Government Printing Office (GPO), Washington, DC 20402-9371;
telephone: (202) 512-1800. Contact GPO for current prices.
**Questions or messages regarding errors in formatting should be addressed to
mmwrq@cdc.gov.
