PART 1 Summaries of Notifiable Diseases in the United States, 2011
Persons using assistive technology might not be able to fully access information in this file. For assistance, please send e-mail to: mmwrq@cdc.gov. Type 508 Accommodation and the title of the report in the subject line of e-mail.
Summary of Notifiable Diseases — United States, 2011
Please note: An erratum has been published for this article. To view the erratum, please click here.
Division of Notifiable Diseases and Healthcare Information, Office of Surveillance, Epidemiology, and Laboratory Services, CDC
Preface
The Summary of Notifiable Diseases — United States, 2011 contains the official statistics, in tabular and graphic form, for the reported occurrence of nationally notifiable infectious diseases in the United States for 2011. Unless otherwise noted, the data are final totals for 2011 reported as of June 30, 2012. These statistics are collected and compiled from reports sent by state health departments and territories to the National Notifiable Diseases Surveillance System (NNDSS), which is operated by CDC in collaboration with the Council of State and Territorial Epidemiologists (CSTE). The Summary is available at http://www.cdc.gov/mmwr/mmwr_nd/index.html. This site also includes Summary publications from previous years.
The Highlights section presents noteworthy epidemiologic and prevention information for 2011 for selected diseases and additional information to aid in the interpretation of surveillance and disease-trend data. Part 1 contains tables showing incidence data for the nationally notifiable infectious diseases reported during 2011.* The tables provide the number of cases reported to CDC for 2011 and the distribution of cases by month, geographic location, and patients' demographic characteristics (e.g., age, sex, race, and ethnicity). Part 2 contains graphs and maps that depict summary data for certain notifiable infectious diseases described in tabular form in Part 1. Part 3 contains tables that list the number of cases of notifiable diseases reported to CDC since 1980. This section also includes a table enumerating deaths associated with specified notifiable diseases reported to CDC's National Center for Health Statistics (NCHS) during 2003–2009. The Selected Reading section presents general and disease-specific references for notifiable infectious diseases. These references provide additional information on surveillance and epidemiologic concerns, diagnostic concerns, and disease-control activities.
Comments and suggestions from readers are welcome. To increase the usefulness of future editions, comments regarding the current report and descriptions of how information is or could be used are invited. Comments should be sent to Data Operations Team–NNDSS at NNDSSweb@cdc.gov.
* No cases of diphtheria; eastern equine encephalitis virus disease, nonneuroinvasive; poliomyelitis, paralytic; poliovirus infection, nonparalytic; rubella, congenital syndrome; severe acute respiratory syndrome–associated coronavirus disease; smallpox; vancomycin-resistant Staphylococcus aureus; western equine encephalitis virus disease, neuroinvasive and non-neuroinvasive; yellow fever; and viral hemorrhagic fevers were reported in 2011. Data on hepatitis B virus, perinatal infection, and chronic hepatitis B and hepatitis C virus infection (past or present) are not included because they are undergoing data quality review.
Background
The infectious diseases designated as notifiable at the national level during 2011 are listed in this section. A notifiable disease is one for which regular, frequent, and timely information regarding individual cases is considered necessary for the prevention and control of the disease. A brief history of the reporting of nationally notifiable infectious diseases in the United States is available at http://wwwn.cdc.gov/nndss/script/history.aspx. In 1961, CDC assumed responsibility for the collection and publication of data on nationally notifiable diseases. NNDSS is neither a single surveillance system nor a method of reporting. Certain NNDSS data are reported to CDC through separate surveillance information systems and through different reporting mechanisms; however, these data are aggregated and compiled for publication purposes.
Notifiable disease reporting at the local level protects the public's health by ensuring the proper identification and follow-up of cases. Public health workers ensure that persons who are already ill receive appropriate treatment; trace contacts who need vaccines, treatment, quarantine, or education; investigate and halt outbreaks; eliminate environmental hazards; and close premises where spread has occurred. Surveillance of notifiable conditions helps public health authorities to monitor the effect of notifiable conditions, measure disease trends, assess the effectiveness of control and prevention measures, identify populations or geographic areas at high risk, allocate resources appropriately, formulate prevention strategies, and develop public health policies. Monitoring surveillance data enables public health authorities to detect sudden changes in disease occurrence and distribution, identify changes in agents and host factors, and detect changes in health-care practices.
The list of nationally notifiable infectious diseases is revised periodically. A disease might be added to the list as a new pathogen emerges, or a disease might be deleted as its incidence declines. Public health officials at state health departments and CDC collaborate in determining which diseases should be nationally notifiable. CSTE, with input from CDC, makes recommendations annually for additions and deletions. Although disease reporting is mandated by legislation or regulation at the state and local levels, state reporting to CDC is voluntary. Reporting completeness of notifiable diseases is highly variable and related to the condition or disease being reported (1). The list of diseases considered notifiable varies by state and year. Current and historic national public health surveillance case definitions used for classifying and enumerating cases consistently across reporting jurisdictions are available at http://wwwn.cdc.gov/nndss/script/casedefDefault.aspx.
Infectious Diseases Designated as Notifiable at the National Level During 2011*
Anthrax
Arboviral diseases, neuroinvasive and nonneuroinvasive†
California serogroup viruses
Eastern equine encephalitis virus
Powassan virus
St. Louis encephalitis virus
West Nile virus
Western equine encephalitis virus
Babesiosis
Botulism
foodborne
infant
other (wound† and unspecified)
Brucellosis
Chancroid
Chlamydia trachomatis infection
Cholera
Coccidioidomycosis
Cryptosporidiosis†
Cyclosporiasis
Dengue virus infections
Dengue Fever
Dengue Hemorrhagic Fever
Dengue Shock Syndrome
Diphtheria
Ehrlichiosis/Anaplasmosis
Ehrlichia chaffeensis
Ehrlichia ewingii
Anaplasma phagocytophilum
Undetermined
Giardiasis
Gonorrhea
Haemophilus influenzae, invasive disease
Hansen disease (leprosy)
Hantavirus pulmonary syndrome
Hemolytic uremic syndrome, post-diarrheal
Hepatitis, viral
Hepatitis A, acute†
Hepatitis B, acute†
Hepatitis B virus, perinatal infection
Hepatitis B, chronic†
Hepatitis C, acute†
Hepatitis C, past or present†
Human Immunodeficiency Virus (HIV) infection diagnosis§
Influenza-associated pediatric mortality
Legionellosis
Listeriosis
Lyme disease†
Malaria
Measles
Meningococcal disease
Mumps
Novel influenza A virus infections
Pertussis
Plague
Poliomyelitis, paralytic
Poliovirus infection, nonparalytic
Psittacosis
Q fever
Acute
Chronic
Rabies
Animal
Human
Rubella
Rubella, congenital syndrome
Salmonellosis
Severe acute respiratory syndrome-associated coronavirus (SARS-CoV) disease
Shiga toxin-producing Escherichia coli (STEC)
Shigellosis
Smallpox
Spotted fever rickettsiosis
Streptococcal toxic-shock syndrome
Streptococcus Pneumoniae, invasive disease
Syphilis
Syphilis, congenital
Tetanus
Toxic-shock syndrome (other than streptococcal)†
Trichinellosis
Tuberculosis
Tularemia
Typhoid fever
Vancomycin-intermediate Staphylococcus aureus (VISA) infection
Vancomycin-resistant Staphylococcus aureus (VRSA) infection
Varicella (morbidity)
Varicella (mortality)
Vibriosis
Viral Hemorrhagic Fever†
Crimean-Congo Hemorrhagic fever virus
Ebola virus
Lassa virus
Lujo virus
Marburg virus
New World Arenaviruses (Guanarito, Machupo, Junin, and Sabia viruses)
Yellow fever
* This list reflects position statements approved in 2010 by the Council of State and Territorial Epidemiologists (CSTE) for national surveillance, which were implemented in January 2011. The following changes were made to the 2011 list of nationally notifiable infectious diseases to create the 2011 list: 1) babesiosis and coccidioidomycosis were added to the list, and 2) Lujo virus was included in the category of viral hemorrhagic fever.
† 2011 reflects a modified surveillance case definition for this condition, per approved 2010 CSTE position statements.
§ AIDS has been reclassified as HIV stage III.
Data Sources
Provisional data concerning the reported occurrence of nationally notifiable infectious diseases are published weekly in MMWR. After each reporting year, staff in state health departments finalize reports of cases for that year with local or county health departments and reconcile the data with reports previously sent to CDC throughout the year. These data are compiled in final form in the Summary.
Notifiable disease reports are the authoritative and archival counts of cases. They are approved by the appropriate chief epidemiologist from each submitting state or territory before being published in the Summary. Data published in MMWR Surveillance Summaries or other surveillance reports produced by CDC programs might differ from data reported in the annual Summary because of differences in the timing of reports, the source of the data, or surveillance methodology.
Data in the Summary were derived primarily from reports transmitted to CDC from health departments in the 50 states, five territories, New York City, and the District of Columbia. Data were reported for MMWR weeks 1–52, which correspond to the period for the week ending January 8, 2011, through the week ending December 31, 2011. More information regarding infectious notifiable diseases, including case definitions, is available at http://wwwn.cdc.gov/nndss/default.aspx. Policies for reporting notifiable disease cases can vary by disease or reporting jurisdiction. The case-status categories used to determine which cases reported to NNDSS are published by disease or condition and are listed in the print criteria column of the 2011 NNDSS event code list (Exhibit).
The print criteria for NNDSS is as follows: for a case report of a nationally notifiable disease to print in the MMWR, the reporting state or territory must have designated the disease reportable in their state or territory for the year corresponding to the year of report to CDC. After the criterion is met, the disease-specific criteria listed in the Exhibit are applied. When the above-listed table indicates that all reports will be earmarked for printing, this means that cases designated with unknown or suspect case confirmation status will print just as probable and confirmed cases will print. Because CSTE position statements are not customarily finalized until July of each year, the NNDSS data for the newly added conditions are not usually available from all reporting jurisdictions until January of the year following the approval of the CSTE position statement.
Final data for certain diseases are derived from the surveillance records of the CDC programs listed below. Requests for further information regarding these data should be directed to the appropriate program.
Office of Surveillance, Epidemiology, and Laboratory Services
National Center for Health Statistics (NCHS)
Office of Vital and Health Statistics Systems (deaths from selected notifiable diseases)
Office of Infectious Diseases
National Center for HIV/AIDS, Viral Hepatitis, STD and TB Prevention
Division of HIV/AIDS Prevention (AIDS and HIV infection), Division of Viral Hepatitis, Division of STD Prevention (chancroid; Chlamydia trachomatis, genital infection; gonorrhea; and syphilis), Division of Tuberculosis Elimination (tuberculosis)
National Center for Immunization and Respiratory Diseases
Influenza Division (influenza-associated pediatric mortality, initial detections of novel influenza A virus infections)
Division of Viral Diseases, (poliomyelitis, varicella [morbidity and mortality], and SARS-CoV)
National Center for Emerging and Zoonotic Infectious Diseases
Division of Vector-Borne Diseases (arboviral diseases)
Division of Viral and Rickettsial Diseases (animal rabies)
NCHS postcensal estimates of the resident population of the United States for July 1, 2010–July 1, 2011, by year, county, single-year of age (range: 0 to ≥85 years), bridged-race, (white, black or African American, American Indian or Alaska Native, Asian or Pacific Islander), Hispanic origin (not Hispanic or Latino, Hispanic or Latino), and sex (Vintage 2010), prepared under a collaborative arrangement with the U.S. Census Bureau. Available at http://www.cdc.gov/nchs/nvss/bridged_race/data_documentation.htm#vintage2010 as of May 31, 2012.
Population estimates for territories are 2010 estimates from the U.S. Census Bureau. The choice of population denominators for incidence reported in MMWR is based on 1) the availability of census population data at the time of preparation for publication and 2) the desire for consistent use of the same population data to compute incidence reported by different CDC programs. Incidence in the Summary is calculated as the number of reported cases for each disease or condition divided by either the U.S. resident population for the specified demographic population or the total U.S. resident population, multiplied by 100,000. When a nationally notifiable disease is associated with a specific age restriction, the same age restriction is applied to the population in the denominator of the incidence calculation. In addition, population data from states in which the disease or condition was not reportable or was not available were excluded from incidence calculations. Unless otherwise stated, disease totals for the United States do not include data for American Samoa, Guam, Puerto Rico, the Commonwealth of the Northern Mariana Islands, or the U.S. Virgin Islands.
Interpreting Data
Incidence data in the Summary are presented by the date of report to CDC as determined by the MMWR week and year assigned by the state or territorial health department, except for the domestic arboviral diseases, which are presented by date of diagnosis. Data are reported by the jurisdiction of the person's "usual residence" at the time of disease onset (http://wwwn.cdc.gov/nndss/document/03-ID-10_residency_rules.pdf). For certain nationally notifiable infectious diseases, surveillance data are reported independently to different CDC programs. For this reason, surveillance data reported by other CDC programs might vary from data reported in the Summary because of differences in 1) the date used to aggregate data (e.g., date of report or date of disease occurrence); 2) the timing of reports; 3) the source of the data; 4) surveillance case definitions; and 5) policies regarding case jurisdiction (i.e., which state should report the case to CDC).
Data reported in the Summary are useful for analyzing disease trends and determining relative disease numbers. However, reporting practices affect how these data should be interpreted. Disease reporting is likely incomplete, and completeness might vary depending on the disease and reporting state. The degree of completeness of data reporting might be influenced by the diagnostic facilities available, control measures in effect, public awareness of a specific disease, and the resources and priorities of state and local officials responsible for disease control and public health surveillance. Finally, factors such as changes in methods for public health surveillance, introduction of new diagnostic tests, or discovery of new disease entities can cause changes in disease reporting that are independent of the actual incidence of disease.
Public health surveillance data are published for selected racial/ethnic populations because these variables can be risk markers for certain notifiable diseases. Race and ethnicity data also can be used to highlight populations for focused prevention programs. However, caution must be used when drawing conclusions from reported race and ethnicity data. Different racial/ethnic populations might have different patterns of access to health care, potentially resulting in data that are not representative of actual disease incidence among specific racial/ethnic populations. Surveillance data reported to NNDSS are in either individual case-specific form or summary form (i.e., aggregated data for a group of cases). Summary data often lack demographic information (e.g., race); therefore, the demographic-specific rates presented in the Summary might be underestimated.
In addition, not all race and ethnicity data are collected or reported uniformly for all diseases, the standards for race and ethnicity have changed over time, and the transition in implementation to the newest race and ethnicity standard has taken varying amounts of time for different CDC surveillance systems. For example, in 1990, the National Electronic Telecommunications System for Surveillance (NETSS) was established to facilitate data collection and submission of case-specific data to CDC's National Notifiable Diseases Surveillance System, except for selected diseases. In 1990, NETSS implemented the 1977 Office of Management and Budget (OMB) standard for race and ethnicity, in which race and ethnicity were collected in one variable. Other surveillance programs implemented two variables for collection of race and ethnicity data. The 1997 OMB race and ethnicity standard, which requires collection of multiple races per person using multiple race variables, should have been implemented by federal programs beginning January 1, 2003. In 2003, the CDC Tuberculosis and HIV/AIDS programs were able to update their surveillance information systems to implement 1997 OMB standards. In 2005, the Sexually Transmitted Diseases Management Information System also was updated to implement the 1997 OMB standards. However other diseases reported to the NNDSS using NETSS were undergoing a major change in the manner in which data were collected and reported to CDC. This change is caused by the transition from NETSS to the National Electronic Disease Surveillance System (NEDSS), which implemented the newer 1997 OMB standard for race and ethnicity. However, the transition from NETSS to NEDSS was slower than originally expected relative to reporting data to CDC using NEDSS; thus, some data are currently reported to CDC using NETSS formats, even if the data in the reporting jurisdictions are collected using NEDSS. Until the transition to NEDSS is complete, race and ethnicity data collected or reported to NETSS using different race and ethnicity standards will need to be converted to one standard. The data are now converted to the 1977 OMB standard originally implemented in NETSS. Although the recommended standard for classifying a person's race or ethnicity is based on self-reporting, this procedure might not always be followed.
Transition in NNDSS Data Collection and Reporting
Before 1990, data were reported to CDC as cumulative counts rather than as individual case reports. In 1990, using NETSS, states began electronically capturing and reporting individual case reports to CDC without personal identifiers. In 2001, CDC launched NEDSS, now a component of the Public Health Information Network, to promote the use of data and information system standards that advance the development of efficient, integrated, and interoperable surveillance information systems at the local, state, and federal levels. One of the objectives of NEDSS is to improve the accuracy, completeness, and timeliness of disease reporting at the local, state, and national levels. CDC has developed the NEDSS Base System (NBS), a public health surveillance information system currently adopted by 18 states and the District of Columbia. A total of 28 states and New York City have a state- or vendor-developed NEDSS-compatible system.The remaining nine jurisdictions, four states and five territories, are either in the process of adopting or changing their NEDSS-compatible system or use a non-NEDSS-compatible system at the time of this publication. A major feature of all NEDSS-compatible solutions, which includes NBS, is the ability to capture data already in electronic form (e.g., electronic laboratory results, which are needed for case confirmation) rather than enter these data manually as in NETSS. In 2011, a total of 18 states and the District of Columbia used NBS to transmit nationally notifiable infectious diseases to CDC, a total of 32 states and New York City used a NEDSS-compatible based system, and the remaining state and territorial jurisdictions continued to use a non-NEDSS–compatible system. Additional information concerning NEDSS is available at http://wwwn.cdc.gov/nndss/script/nedss.aspx.
Methodology for Identifying Which Nationally Notifiable Infectious Diseases Are Reportable
States and jurisdictions are sovereign entities. Reportable conditions are determined by laws and regulations of each state and jurisdiction. It is possible that some conditions deemed nationally notifiable might not be reportable in certain states or jurisdictions. Determining which nationally notifiable infectious diseases are reportable in NNDSS reporting jurisdictions was determined by asking reporting jurisdictions to update previously analyzed results of the 2010 CSTE State Reportable Conditions Assessment (SRCA) individually, because the 2011 SRCA results were not available at the time this report was prepared. The 2010 assessment solicited information from each NNDSS reporting jurisdiction (all 50 U.S. states, the District of Columbia, New York City, and five U.S. territories) regarding which public health conditions were reportable for >6 months in 2010 by clinicians, laboratories, hospitals, or "other" public health reporters, as mandated by law or regulation. To assist in the implementation of SRCA, staff from the NNDSS program provided technical assistance to CSTE for the 2010 SRCA.
In 2007, SRCA was established and became the first collaborative project of such technical magnitude ever conducted by CSTE and CDC. Previously, CDC and CSTE had gathered public health reporting requirements independently. The 2010 SRCA collected information regarding whether each reportable condition was 1) explicitly reportable (i.e., listed as a specific disease or as a category of diseases on reportable disease lists); 2) whether it was implicitly reportable (i.e., included in a general category of the reportable disease list, such as "rare diseases of public health importance"); or 3) not reportable. Only explicitly reportable conditions were considered reportable for the purpose of national public health surveillance and thus reflected in NNDSS. Moreover, to determine whether a condition included in SRCA was reportable in at least one public health reporter category for a specific nationally notifiable infectious disease (NNID) in a reporting jurisdiction, CDC developed and applied an algorithm to analyze the data collected in SRCA. Analyzed results of the 2010 SRCA were used to determine whether a NNID was not reportable in a reporting jurisdiction in 2010 and thus noted with an "N" indicator (for "not reportable") in the front tables of this report. Unanalyzed results from the 2007, 2008, 2009, and 2010 SRCA are available using CSTE's web query tool at http://www.cste.org/group/SRCAQueryRes. Additional background information has been published previously (2).
Revised International Health Regulations
In May 2005, the World Health Assembly adopted revised International Health regulations (IHR) (3) that went into effect in the United States on July 18, 2007. This international legal instrument governs the role of the World Health Organization (WHO) and its member countries, including the United States, in identifying, responding to, and sharing information about Public Health Emergencies of International Concern (PHEIC). A PHEIC is an extraordinary event that 1) constitutes a public health risk to other countries through international spread of disease, and 2) potentially requires a coordinated international response. All WHO member states are required to notify WHO of a potential PHEIC. WHO makes the final determination about the existence of a PHEIC.
The IHR are designed to prevent and protect against the international spread of diseases while minimizing the effect on world travel and trade. Countries that have adopted these rules have a much broader responsibility to detect, respond to, and report public health emergencies that potentially require a coordinated international response in addition to taking preventive measures. The IHR will help countries work together to identify, respond to, and share information about PHEIC.
The revised IHR reflects a conceptual shift from a predefined disease list to a framework of reporting and responding to events on the basis of an assessment of public health criteria, including seriousness, unexpectedness, and international travel and trade implications. A PHEIC ia an event that falls within those criteria (further defined in a decision algorithm in Annex 2 of the revised IHR). Four conditions always constitute a PHEIC and do not require the use of the IHR decision instrument in Annex 2: severe acute respiratory syndrome (SARS), smallpox, poliomyelitis caused by wild-type poliovirus, and human influenza caused by a new subtype. Any other event requires the use of the decision algorithm to determine if it is a potential PHEIC. Examples of events that require the use of the decision instrument include, but are not limited to, cholera, pneumonic plague, yellow fever, West Nile fever, viral hemorrhagic fevers, and meningococcal disease. Other biologic, chemical, or radiologic events might fit the decision algorithm and also must be reportable to WHO.
Health-care providers in the United States are required to report diseases, conditions, or outbreaks as determined by local, state, or territorial law and regulation, and as outlined in each state's list of reportable conditions. All health-care providers should work with their local, state, and territorial health agencies to identify and report events that might constitute a potential PHEIC occurring in their location. U.S. State and Territorial Departments of Health have agreed to report information about a potential PHEIC to the most relevant federal agency responsible for the event. In the case of human disease, the U.S. State or Territorial Departments of Health will notify CDC rapidly through existing formal and informal reporting mechanisms (4). CDC will further analyze the event based on the decision algorithm in Annex 2 of the IHR and notify the U.S. Department of Health and Human Services (DHHS) Secretary's Operations Center (SOC), as appropriate.
DHHS has the lead role in carrying out the IHR, in cooperation with multiple federal departments and agencies. The DHHS SOC is the central body for the United States responsible for reporting potential events to WHO. The United States has 48 hours to assess the risk of the reported event. If authorities determine that a potential PHEIC exists, the WHO member country has 24 hours to report the event to WHO.
An IHR decision algorithm in Annex 2 has been developed to help countries determine whether an event should be reported. If any two of the following four questions can be answered in the affirmative, then a determination should be made that a potential PHEIC exists and WHO should be notified:
- Is the public health impact of the event serious?
- Is the event unusual or unexpected?
- Is there a significant risk of international spread?
- Is there a significant risk of international travel or trade restrictions?
Additional information concerning IHR is available at http://www.who.int/csr/ihr/en, http://www.cdc.gov/globalhealth/ihregulations.htm, and http://c.ymcdn.com/sites/www.cste.org/resource/resmgr/PS/07-ID-06.pdf. At its annual meeting in June 2007, CSTE approved a position statement to support the implementation of IHR in the United States (4). CSTE also approved a position statement in support of the 2005 IHR adding initial detections of novel influenza A virus infections to the list of nationally notifiable diseases reportable to NNDSS, beginning in January 2007 (5).
- Doyle TJ, Glynn MK, Groseclose LS. Completeness of notifiable infectious disease reporting in the United States: an analytical literature review. Am J Epidemiol 2002;155:866–74.
- Jajosky R, Rey A, Park M, et al. Findings from the Council of State and Territorial Epidemiologists' 2008 assessment of state reportable and nationally notifiable conditions in the United States and considerations for the future. Public Health Manag Pract 2011;17:255–64.
- World Health Organization. Third report of Committee A. Annex 2. Geneva, Switzerland: World Health Organization; 2005. Available at http://whqlibdoc.who.int/publications/2008/9789241580410_eng.pdf.
- Council of State and Territorial Epidemiologists. Events that may constitute a public health emergency of international concern. Position statement 07-ID-06. Available at http://c.ymcdn.com/sites/www.cste.org/resource/resmgr/PS/07-ID-06.pdf.
- Council of State and Territorial Epidemiologists. Council of State and Territorial Epidemiologists position statement; 2007. National reporting for initial detections of novel influenza A viruses. Available at http://c.ymcdn.com/sites/www.cste.org/resource/resmgr/PS/07-ID-01.pdf.
|
EXHIBIT. (Continued) Print criteria for conditions reported to the National Notifiable Diseases Surveillance System, 2011 |
||
|---|---|---|
|
Code |
Notifiable Condition |
Print Criteria*,† |
|
11062 |
Novel influenza A virus infections, initial detections of |
Cases with confirmed status and cases reported from CA with unknown status, verified to be confirmed, printed |
|
10190 |
Pertussis |
Cases with confirmed, probable, and unknown case status printed |
|
10440 |
Plague |
All reports printed |
|
10410 |
Poliomyelitis, paralytic |
Confirmed; unknown from CA that are verified as confirmed |
|
10405 |
Poliovirus infection, nonparalytic |
Confirmed; unknown from CA that are verified as confirmed |
|
10057 |
Powassan virus, neuroinvasive disease |
Data for publication received from ArboNET |
|
10063 |
Powassan virus, nonneuroinvasive disease |
Data for publication received from ArboNET |
|
10450 |
Psittacosis (Ornithosis) |
Confirmed and probable; unknown from CA |
|
10257 |
Q fever, acute |
Confirmed and probable; unknown from CA |
|
10258 |
Q fever, chronic |
Confirmed and probable; unknown from CA |
|
10340 |
Rabies, animal |
Confirmed and unknown from CA |
|
10460 |
Rabies, human |
Confirmed; unknown from CA verified as confirmed |
|
10200 |
Rubella |
Cases with confirmed and unknown case status printed |
|
10370 |
Rubella, congenital syndrome |
CSTE VPD print criteria used Cases with confirmed, probable, and unknown case status printed |
|
11000 |
Salmonellosis |
Confirmed and probable; unknown from CA |
|
10575 |
Severe acute respiratory syndrome-associated coronavirus (SARS-CoV) disease |
Confirmed and probable |
|
11563 |
Shiga toxin-producing Escherichia coli (STEC) |
All reports printed |
|
11010 |
Shigellosis |
Confirmed and probable; unknown from CA |
|
11800 |
Smallpox |
Cases with confirmed and probable case status printed |
|
10250 |
Spotted Fever Rickettsiosis |
Confirmed, probable, and unknown |
|
10051 |
St. Louis encephalitis virus, neuroinvasive disease |
Data for publication received from ArboNET |
|
10064 |
St. Louis encephalitis virus, nonneuroinvasive disease |
Data for publication received from ArboNET |
|
11700 |
Streptococcal toxic-shock syndrome |
Confirmed and probable; unknown from CA |
|
11723 |
Streptococcus pneumoniae, invasive disease (IPD) (all ages) |
Confirmed; unknown from CA |
|
10316 |
Syphilis, congenital |
All reports printed |
|
10313 |
Syphilis, early latent |
All reports printed |
|
10314 |
Syphilis, late latent |
All reports printed |
|
10318 |
Syphilis, late with clinical manifestations other than neurosyphilis |
All reports printed |
|
10311 |
Syphilis, primary |
All reports printed |
|
10312 |
Syphilis, secondary |
All reports printed |
|
10310 |
Syphilis, total primary and secondary |
All reports printed |
|
10315 |
Syphilis, unknown latent |
All reports printed |
|
10210 |
Tetanus |
All reports printed |
|
10520 |
Toxic-shock syndrome (staphylococcal) |
Confirmed and probable; unknown from CA |
|
10270 |
Trichinellosis |
Confirmed; unknown from CA |
|
10220 |
Tuberculosis |
Print criteria determined by the CDC Tuberculosis program |
|
10230 |
Tularemia |
Confirmed and probable; unknown from CA |
|
10240 |
Typhoid fever (caused by Salmonella typhi) |
Confirmed and probable; unknown from CA |
|
11663 |
Vancomycin-intermediate Staphylococcus aureus (VISA) |
Confirmed; unknown from CA verified as confirmed |
|
11665 |
Vancomycin-resistant Staphylococcus aureus (VRSA) |
Confirmed; unknown from CA verified as confirmed |
|
10030 |
Varicella (Chickenpox) |
Cases with confirmed, probable, and unknown case status from CA printed |
|
EXHIBIT. (Continued) Print criteria for conditions reported to the National Notifiable Diseases Surveillance System, 2011 |
||
|---|---|---|
|
Code |
Notifiable Condition |
Print Criteria*,† |
|
11545 |
Vibriosis (non-cholera Vibrio species infections) |
Confirmed, probable, and unknown from CA |
|
11647 |
Viral hemorrhagic fever |
Confirmed; footnote to denote the specific virus reported to CDC |
|
10056 |
West Nile virus, neuroinvasive disease |
Data for publication received from ArboNET |
|
10049 |
West Nile virus, nonneuroinvasive disease |
Data for publication received from ArboNET |
|
10052 |
Western equine encephalitis virus, neuroinvasive disease |
Data for publication received from ArboNET |
|
10065 |
Western equine encephalitis virus, nonneuroinvasive disease |
Data for publication received from ArboNET |
|
10660 |
Yellow fever |
Data for publication received from ArboNET |
|
Abbreviations: ArboNET = Software for Arboviral Surveillance and Case Management; CDC = Centers for Disease Control and Prevention; CSTE = Council of State and Territorial Epidemiologists; VPD = Vaccine Preventable Disease. * An unknown case classification status is used when a reporting jurisdiction sends aggregate counts of cases or when the surveillance information system of a reporting jurisdiction does not capture case classification data. In both situations, cases are verified to meet the case classification (e.g., confirmed, probable, and suspected) specified in the print criteria. † Print criteria for the National Notifiable Diseases Surveillance System (NNDSS): for a case report of a nationally notifiable disease to print in the MMWR, the reporting state or territory must have designated the disease reportable in their state or territory for the year corresponding to the year of report to CDC. After this criterion is met, the disease-specific criteria listed in the Exhibit are applied. When the above-listed table indicates that all reports will be earmarked for printing, this means that cases designated with unknown or suspect case confirmation status will print just as probable and confirmed cases will print. Because CSTE position statements customarily are not finalized until July of each year, the NNDSS data for the newly added conditions usually are not available from all reporting jurisdictions until January of the year following the approval of the CSTE position statement. |
||
Highlights for 2011
Below are summary highlights for certain national notifiable diseases. Highlights are intended to assist in the interpretation of major occurrences that affect disease incidence or surveillance trends (e.g., outbreaks, vaccine licensure, or policy changes).
Anthrax
In 2011, public health authorities in Minnesota reported a confirmed case of naturally occurring inhalation anthrax was reported by Minnesota, in a Florida resident who became ill while vacationing in Minnesota and four other northern midwestern states. The patient was hospitalized and was discharged home after appropriate treatment (1). The incident resulted in a joint investigation involving law enforcement officials, state public and animal health agencies, the National Animal Health Laboratory Network, Laboratory Response Network, CDC, and other federal agencies. The investigation revealed that during the 3 weeks of travel before disease onset the patient collected rocks and handled antlers and other animal items, and had been exposed to dust clouds while driving through areas inhabited by herds of animals. No Bacillus anthracis was detected through testing of associated animal products or environmental samples, and public health officials were unable to identify the source of the exposure. Enhanced surveillance was performed in states where the person had traveled, and no other humans or animals infected with the case strain were identified; this case is considered an isolated naturally occurring case. The incidence of anthrax in the United States and U.S. territories remains low, with two or fewer naturally occurring cases reported per year for the past 30 years.
- Minnesota Department of Health. Health officials investigate case of inhalational anthrax from suspected natural environmental exposure. Available at http://www.health.state.mn.us/news/pressrel/2011/anthrax080911.html.
Domestic Arboviral, Neuroinvasive and Nonneuroinvasive
During 2011, West Nile virus (WNV) disease cases were reported from 43 states and the District of Columbia. The reported incidence of neuroinvasive disease was 0.16 cases per 100,000 population. Despite the decline in neuroinvasive disease incidence compared with previous years, the overall morbidity caused by WNV continues to be substantial. Based on previous studies, for every reported case of neuroinvasive disease, approximately 140–350 human WNV infections occur, with approximately 80% of infected persons remaining asymptomatic and 20% developing nonneuroinvasive disease (1–3). Using the 486 reported neuroinvasive disease cases, an estimated 13,600–34,000 cases of nonneuroinvasive disease might have occurred in 2011. However, only 226 nonneuroinvasive disease cases were diagnosed and reported; 1%–2% of the cases estimated to have occurred. Evidence of WNV human disease was detected in all geographic regions of the United States. The states with the highest incidence of neuroinvasive disease were the District of Columbia (1.62 per 100,000 population), Mississippi (1.04), Nebraska (0.76), and Arizona (0.76). Among the neuroinvasive disease cases, 250 (51%) cases were reported from five states: California (110 cases), Arizona (49), Michigan (32), Mississippi (31), and New York (28). California reported 23% of all WNV neuroinvasive disease cases in 2011 (4).
Among the other domestic arboviral diseases in the United States, La Crosse virus remained the most common cause of neuroinvasive disease in children. Eastern equine encephalitis virus disease, although rare, remained the most severe arboviral disease, resulting in three deaths among four patients. More Powassan virus disease cases were reported in 2011 than in any previous year, and included the first case ever reported from Pennsylvania. Wisconsin reported its first Eastern equine encephalitis disease case since 1984.
- Mostashari F, Bunning ML, Kitsutani PT, et al. Epidemic West Nile encephalitis, New York, 1999: results of a household-based seroepidemiological survey. Lancet 2001;358:261–4.
- Busch MP, Wright DJ, Custer B, et al. West Nile virus infections projected from blood donor screening data, United States, 2003. Emerg Infect Dis 2006;12:395–402.
- Carson PJ, Borchardt SM, Custer B, et al. Neuroinvasive disease and West Nile virus infection, North Dakota, USA, 1999–2008. Emerg Infect Dis 2012;18:684–6.
- CDC. West Nile virus disease and other arboviral diseases—United States, 2011. MMWR 2012;61:510–4.
Babesiosis
Babesiosis, a tickborne parasitic disease, became a nationally notifiable condition in 2011. Babesiosis is caused by protozoan parasites of the genus Babesia that infect red blood cells. Babesia infection can range from asymptomatic to life threatening. Clinical manifestations can include fever, chills, other nonspecific influenza-like symptoms, and hemolytic anemia. Babesia parasites usually are tickborne, but they also are transmissible via blood transfusion or congenitally (1). In recent years, reports of tickborne and transfusion-associated cases have increased in number and geographic distribution (1).
In 2011, public health authorities in seven states (Connecticut, Massachusetts, Minnesota, New Jersey, New York, Rhode Island, and Wisconsin) reported the majority (97%) of babesiosis cases, with 1,092 of 1,128 cases. The median age of patients was 62 years (range: age <1–98 years); 62% (n = 700) were male, 34% (n = 386) were female, and the sex was unknown for 4% (n = 42) of patients. Among the patients for whom data were available, 82% (717 of 879) had symptom onset dates during June–August (2).
- Herwaldt BL, Linden JV, Bosserman E, et al. Transfusion-associated babesiosis in the United States: a description of cases. Ann Intern Med 2011;155:509–19.
- CDC. Babesiosis surveillance—18 states, 2011. MMWR 2012;61:505–9.
Botulism
Botulism is a severe paralytic illness caused by toxins produced by Clostridium botulinum. Exposure to the toxin can occur by ingestion (foodborne botulism), by in situ production from C. botulinum colonization of a wound (wound botulism) or the gastrointestinal tract (infant botulism and adult intestinal colonization botulism), or overdose of botulinum toxin used for cosmetic or therapeutic purposes (1). Infant botulism continues to be the most frequently observed transmission category. During 2011, eight persons located in a prison acquired foodborne botulism after consuming pruno, an illicitly brewed alcoholic beverage.
All states maintain 24-hour telephone services for reporting of botulism and other public health emergencies. Health-care providers should report suspected botulism cases immediately to their state health departments. CDC maintains intensive surveillance for cases of botulism in the United States and provides consultation to clinicians and antitoxin for suspected cases. State health departments can reach the CDC botulism duty officer on call 24 hours a day, 7 days a week, via the CDC Emergency Operations Center (telephone: 770-488-7100).
- Sobel J. Botulism. Clin Infect Dis 2005;41:1167–73.
Brucellosis
Brucellosis is an infectious disease that can be acquired by persons who come into contact with infected animals or animal products contaminated with the bacteria. The number of brucellosis cases reported in 2011 decreased by 31%, from 115 cases in 2010 to 79 cases in 2011. The five states (California, Florida, Georgia, Illinois, and Texas) reported 45 cases, accounting for approximately 57% of all cases. No cases were reported from any U.S. territories.
In 2011, the U.S. Department of Health and Human Services approved a revised brucellosis case report form. Health departments and providers are strongly encouraged to use the approved form to report brucellosis cases to CDC's Bacterial Special Pathogens Branch. This mechanism will ensure collection of standardized data needed to assess risk factors and trends associated with brucellosis better so that targeted preventive strategies can be implemented. A fillable PDF version of the form is available at http://www.cdc.gov/nczved/divisions/dfbmd/diseases/brucellosis/case-report-form.pdf. The form also can be requested via e-mail (bspb@cdc.gov) or by telephone (404-639-1711). Patient identifiers such as full name, address, phone number, hospital name, and chart number should not be included in forms sent to CDC. Instructions for completion and submission of the form are included in pages 1 and 2 of the form.
Chlamydia
In 2011, approximately 1.4 million cases of Chlamydia trachomatis infections were reported, the largest number of cases ever reported to CDC for any condition (1). This case count corresponds to a rate of 457.6 cases per 100,000 population, an increase of 8% compared with the rate in 2010. Rates of reported chlamydial infections among women have been increasing annually since the late 1980s, when public programs for screening and treatment of women were established to avert pelvic inflammatory disease and related complications. The continued increase in chlamydia case reports in 2011 likely represents a continued increase in screening for this usually asymptomatic infection, expanded use of more sensitive tests, and more complete national reporting; however, it also might reflect an increase in morbidity.
- CDC. Sexually transmitted disease surveillance 2011. Atlanta, GA: US Department of Health and Human Services; 2012.
Cholera
Cholera continues to be rare in the United States and is acquired most often during travel in countries where toxigenic Vibrio cholerae O1 or O139 is circulating (1). Since epidemic cholera emerged in Haiti in October 2010, cases have continued to be reported in the United States among travelers who have arrived recently from Hispaniola. Of the 42 cholera infections reported in the United States in 2011, a total of 39 were travel associated; 22 patients had arrived recently from Haiti, 11 from the Dominican Republic, and six from other cholera-affected countries. Until the cholera epidemic in Hispaniola wanes, associated cases are expected to continue to occur in the United States (2). Cholera remains a global threat to health, particularly in areas with poor access to improved water and sanitation, such as Haiti and sub-Saharan Africa (3,4).
- Steinberg EB, Greene KD, Bopp CA, et al. Cholera in the United States, 1995–2000: trends at the end of the Twentieth Century. J Infect Dis 2001;184:799–802.
- Newton AE, Heiman KE, Schmitz A, et al. Cholera in United States associated with epidemic in Hispaniola. Emerg Infect Dis 2011;17:2166–8.
- Tappero J, Tauxe RV. Lessons learned during public health response to cholera epidemic in Haiti and the Dominican Republic. Emerg Infect Dis 2011;17:2087–93.
- Mintz ED, Guerrant RL. A lion in our village—the unconscionable tragedy of cholera in Africa. New Engl J Med 2009;360:1061–3.
Coccidioidomycosis
Coccidioidomycosis is a fungal infection caused by inhalation of airborne Coccidioides spp. spores that are present in the arid soil of the southwestern United States, California, and parts of Central and South America. The incidence of coccidioidomycosis increased in 2011, for the second consecutive year in California, Arizona, and other states. Coccidioidomycosis was not a nationally notifiable condition during 2010, although many states reported cases. In 2011, coccidioidomycosis incidence increased among all age groups, although rates remain highest among persons aged ≥60 years. Since 2009, the majority of cases have occurred among women in Arizona, whereas the majority of cases have occurred among men elsewhere in the United States. The 16,467 cases reported from Arizona and 5,697 cases from California during 2011 represent a 61% and 129% increase, respectively, compared with 2009. Coccidioidomycosis is currently the second most commonly reported condition in Arizona, and the fourth in California.
The morbidity of this disease in Arizona is considerable (1). Enhanced surveillance conducted during 2007–2008 demonstrated a self-reported median duration of illness of 42 days among persons who had recovered at the time of the interview and 157 days among those who had not; a total of 200 (41%) patients were hospitalized for coccidioidomycosis; a total of 67 (74%) employed persons and 37 (59%) students were unable to attend work or school (1).
Whether the recent increase is related to changes in surveillance methodology is not known. In 2009, one of the major commercial laboratories in Arizona changed its reporting practices to conform to the CSTE laboratory case definition, which was revised in 2007 to include cases with a single positive enzyme immunoassay result (2). The majority of laboratories in endemic areas perform testing using an enzyme immunoassay, the specificity of which is controversial (3).
Physicians, particularly in areas where the disease is endemic, should continue to maintain a high suspicion for acute coccidioidomycosis, especially among patients with an influenza-like illness or pneumonia who live in or have visited areas in which the disease is endemic.
- Tsang CA, Anderson SM, Imholte SB, et al. Enhanced surveillance of coccidioidomycosis, Arizona, USA, 2007–2008. Emerg Infect Dis 2010;11:1738–44.
- Council of State and Territorial Epidemiologists. Revision of the surveillance case definition for coccidioidomycosis. Position statement 07-ID-13. Atlanta, GA: Council of State and Territorial Epidemiologists; 2007. Available at http://c.ymcdn.com/sites/www.cste.org/resource/resmgr/PS/07-ID-13.pdf.
- Kuberski T, Herrig J, Pappagianis D. False-positive IgM serology in coccidioidomycosis. J Clin Microbiol 2010;48:2047–9.
Cryptosporidiosis
Cryptosporidiosis is a nationally notifiable gastrointestinal illness caused by chlorine-tolerant protozoa of the genus Cryptosporidium. Cryptosporidium is transmitted by the fecal-oral route with the ingestion of Cryptosporidium oocysts through the consumption of fecally contaminated food or water or through direct person-to-person or animal-to-person contact.
Although cryptosporidiosis affects persons in all age groups, cases are reported most frequently in children (1). A substantial increase in transmission of Cryptosporidium in children occurs during summer through early fall, coinciding with increased use of recreational water, which is a known risk factor for cryptosporidiosis. Cryptosporidium has emerged as the leading cause of reported recreational water-associated outbreaks (2). Transmission through recreational water is facilitated by the substantial number of Cryptosporidium oocysts that can be shed by a single person, the extended time that oocysts can be shed (3), the low infectious dose (4), and the extreme tolerance of Cryptosporidium oocysts to chlorine (5).
To reduce the number of cryptosporidiosis cases associated with recreational water, enhanced public health prevention measures are needed. In the United States, pool codes are reviewed and approved by state or local public health officials; no federal agency regulates the design, construction, and operation of treated recreational water venues. This lack of uniform national standards has been identified as a barrier to the prevention and control of outbreaks associated with treated recreational water. To provide support to state and local health departments, CDC is sponsoring development of the Model Aquatic Health Code (MAHC) (http://www.cdc.gov/mahc). MAHC is a collaborative effort between local, state, and federal public health agencies and the aquatics sector to develop a data-driven, knowledge-based resource for state and local jurisdictions reviewing and updating their existing pool codes to optimally prevent and control recreational water-associated illness, including cryptosporidiosis.
- CDC. Cryptosporidiosis surveillance—United States, 2009–2010. MMWR 2012;61(No. SS-5):1–12.
- CDC. Surveillance for waterborne disease outbreaks and other health events associated with recreational water—United States, 2007–2008. MMWR 2011;60(No. SS-12):1–32.
- Chappell CL, Okhuysen PC, Sterling CR, DuPont HL. Cryptosporidium parvum: intensity of infection and oocyst excretion patterns in healthy volunteers. J Infect Dis 1996;173:232–6.
- Chappell CL, Okhuysen PC, Langer-Curry R, et al. Cryptosporidium hominis: experimental challenge of healthy adults. Am J Trop Med Hyg 2006;75:851–7.
- Shields JM, Hill VR, Arrowood MJ, Beach MJ. Inactivation of Cryptosporidium parvum under chlorinated recreational water conditions. J Water Health 2008;6:513–20.
Dengue
With more than one third of the world's population living in areas at risk for transmission, dengue infection is a leading cause of illness and death in the tropics and subtropics. As many as 100 million persons are infected yearly. Dengue is caused by any one of four related viruses transmitted by mosquitoes.
Dengue in the United States occurs among persons living in subtropical and tropical areas where the disease is endemic, among U.S. travelers returning from endemic areas worldwide, and occasionally among persons living in U.S. areas that are not endemic for dengue but that are experiencing an outbreak. In 2011, a total of 1,541 dengue cases were reported to the national arbovirus surveillance network (ArboNET) from the Commonwealth of Puerto Rico and 254 cases were reported from 31 U.S. states. This represents a decrease in reported cases from Puerto Rico, and the U.S. states in 2010 (1). The overall decrease in 2011 in reported dengue cases both from U.S. areas that are and are not endemic for dengue was considered to be because of the cyclical nature of this disease worldwide and the decrease in global dengue cases (2–5).
Dengue is endemic in Puerto Rico, the U.S. Virgin Islands, and the U.S.-affiliated Pacific Islands (USAPI); (i.e., the U.S.-territories of Guam and American Samoa, the Commonwealth of the Northern Mariana Islands, the Republic of Palau, the Republic of the Marshall Islands [RMI], and the Federated States of Micronesia [FSM]). Although dengue is a notifiable disease in most U.S. territories and USAPIs, only Puerto Rico reports dengue cases to ArboNET (6). Puerto Rico did not experience an outbreak year in 2011; however, dengue outbreaks occurred in RMI and FSM. During September–December 2011, a total of 1,408 suspected cases were reported to the RMI Ministry of Health, and 1,017 suspected cases were reported from Yap state to the FSM Department of Health Services. Dengue virus (DENV)-2 and DENV-4 transmission was confirmed during the Yap and RMI outbreaks, respectively. Both outbreaks continued for several months into 2012.
Travel-associated dengue is the leading source of dengue in the U.S. areas that are not endemic for the disease, with 243 cases reported in 2011. Travel-associated dengue cases from residents of the U.S. areas that are not endemic resulted from travel to the following 42 foreign countries or U.S. territories: Puerto Rico (31), Bahamas (27), India (27), Bangladesh (16), Philippines (16), Haiti (14), Dominican Republic (10), Brazil (eight), Cuba (seven), Trinidad (seven), Costa Rica (five), and <5 cases from the Antilles, Aruba, Bermuda, Bolivia, Colombia, Curacao, Ecuador, El Salvador, Ghana, Granada, Guatemala, Guyana, Indonesia, Jamaica, Kenya, Laos, Malaysia, Mexico, Nicaragua, Pakistan, Panama, Peru, Singapore, Sri Lanka, Saint Lucia, Sudan, Thailand, Turks and Caicos, U.S. Virgin Islands, Venezuela, and Vietnam.
Although dengue is not endemic in the 50 U.S. states, an outbreak and locally acquired dengue cases were reported in Hawaii and Florida, respectively, in 2011. During February–March 2011, the Hawaii Department of Health (HI-DOH) detected laboratory-confirmed cases of dengue in five residents of Pearl City on the island of O'ahu. The first case was laboratory-confirmed in an O'ahu resident who travelled to Wisconsin in late February. After being notified by the Wisconsin Department of Health, the HI-DOH conducted case finding activities, which included a serosurvey in the index case household and neighborhood. After exhibiting dengue-like symptoms in late February, two laboratory-confirmed cases were found among the index patient's family members, and one laboratory-confirmed case was found in the neighboring household. None of these persons had travelled outside of the United States in the 2 weeks before illness onset and the virus DENV-1 was identified in two of these patients. The investigation also revealed that the likely source of virus transmission was an unrelated Pearl City resident who developed an acute febrile illness soon after returning in early February from a trip to the Philippines. In 2011, the Florida Department of Health reported cases occurring in seven persons with locally acquired dengue who had no reported travel outside of the United States in the 2 weeks before illness onset. The patients resided in Hillsborough (one patient), Martin (one), Miami-Dade (three), and Palm Beach (two) counties.
- CDC. Summary of notifiable diseases—United States, 2010. MMWR 2012;59(No. SS-3):1–111.
- World Health Organization (WHO)—Western Pacific Region Office (WPRO). WPRO Dengue situation update; 2012. Available at http://www.wpro.who.int/emerging_diseases/12_Jan2012DengueBiWeekly.pdf.
- World Health Organization—Pan American Health Organization. Number of reported cases of dengue and severe dengue in the Americas by country: Figures for 2010; 2010. Available at http://new.paho.org/hq/dmdocuments/2010/dengue_cases_2010_december_10_2%20.pdf.
- World Health Organization—Pan American Health Organizatin. Number of reported cases of dengue and dengue severe in the Americas by country: Figures for 2011; 2011. Available at http://new.paho.org/hq/dmdocuments/2011/dengue_cases_2011_January_21_EW_3.pdf.
- Dash AP. From the editor's desk. Dengue Bulletin 2011;35:i–i.
- Council of State and Territorial Epidemiologists. State reportable conditions query results, 2012. Available at http://www.cste.org/group/SRCAQueryRes.
Ehrlichiosis and Anaplasmosis
Ehrlichiosis and anaplasmosis are rickettsial tickborne diseases. The number of reported cases of anaplasmosis increased by approximately 50%, from 1,761 cases in 2010 to 2,575 cases in 2011, the largest reported incidence since anaplasmosis became notifiable in 1998. The number of reported cases of ehrlichiosis increased by 15%, from 740 cases in 2010 to 850 cases in 2011. A case of Ehrlichia ewingii was reported for the first time from Georgia, Maryland, and Virginia. Reports of undetermined ehrlichiosis or anaplasmosis increased by approximately 40% from 104 cases in 2010 to 148 cases in 2011. The overall increase in reported incidence of all four categories of ehrlichiosis and anaplasmosis from 2010 to 2011 might indicate an increase in tick populations, expansion of tick vector range, and an increase in the use of diagnostic assays.
Giardiasis
Giardia is transmitted through the fecal-oral route with the ingestion of Giardia cysts through the consumption of fecally contaminated water or through person-to-person (or, to a lesser extent, animal-to-person) transmission. The disease normally is characterized by diarrhea, abdominal cramps, bloating, weight losss, and malabsorption.
Although giardiasis is the most common enteric parasitic infection in the United States and no declines in incidence have occurred in recent years, knowledge of its epidemiology remains incomplete. Giardiasis symptomatology is variable; infected persons can shed Giardia for several weeks, and recent studies indicate a potential for chronic sequelae from giardiasis (1,2). New epidemiologic studies are needed to identify effective public health prevention measures.
Most data on giardiasis transmission come from outbreak investigations; however, the overwhelming majority of reported giardiasis cases are not linked to known outbreaks. During 2009–2010, <1% of reported giardiasis cases were associated with outbreaks (3). The relative contributions of person-to-person, animal-to-person, foodborne, and waterborne transmission to sporadic human giardiasis in the United States are not well understood.
Until recently, no reliable serologic assays for Giardia have been available, and no population studies of Giardia seroprevalence have been conducted. With recent laboratory advances (4), such studies might now be feasible and would contribute substantially to understanding the prevalence of giardiasis in the United States. Enhanced genotyping methods would increase knowledge of the molecular epidemiology of Giardia, including elucidating species-specific subassemblages (5). These tools, combined with traditional epidemiology and surveillance, would improve understanding of giardiasis risk factors, enable researchers to identify outbreaks by linking cases currently classified as sporadic infections, and provide risk factor information needed to inform prevention strategies.
- Cantey PT, Roy S, Lee B, et al. Study of nonoutbreak giardiasis: novel findings and implications for research. Am J Med 2011;124:1175.e1–8.
- Wensaas KA, Langeland N, Hanevik K, et al. Irritable bowel syndrome and chronic fatigue 3 years after acute giardiasis: historic cohort study. Gut 2012;61:214–9.
- CDC. Giardiasis surveillance—United States, 2009–2010. MMWR 2012;61 (No. SS-5):13–23.
- Priest JW, Moss DM, Visvesvara GS, et al. Multiplex assay detection of immunoglobulin G antibodies that recognize Giardia intestinalis and Cryptosporidium parvum antigens. Clin Vaccine Immunol 2010;17:1695–707.
- Feng Y, Xiao L. Zoonotic potential and molecular epidemiology of Giardia species and giardiasis. Clin Microbiol Rev 2011;24:110–40.
Gonorrhea
After a 79% decline in the rate of reported gonorrhea during 1975–2009, and after reaching the lowest gonorrhea rate recorded in 2009, the national gonorrhea rate increased in 2011 for the second consecutive year. During 2009–2011, the national rate of gonorrheal infection increased by 6% to 104 cases per 100,000 population. In 2011, the rate increased among men and women, among all racial/ethnic groups, and in all four regions of the United States (West, Midwest, Northeast, and South). As in previous years, the highest rates were observed among persons aged 15–24 years, among blacks, and in the South. In 2011, the gonorrhea rate among blacks was 17 times higher than the rate among whites (427 cases in blacks per 100,000 population compared with 25 cases in whites per 100,000 population) (1).
Treatment for gonorrhea is complicated by antimicrobial resistance. Most recently, declining susceptibility to cefixime resulted in a change in the CDC treatment guidelines; dual therapy with ceftriaxone and either azithromycin or doxycycline is now the only CDC-recommended treatment regimen for gonorrhea (2). In 2011, no isolates with decreased susceptibility to ceftriaxone were identified in CDC's sentinel surveillance system, the Gonococcal Isolate Surveillance Project (GISP); the percentage of isolates with elevated cefixime minimum inhibitory concentrations remain unchanged. Three isolates with decreased susceptibility to cefixime were identified within GISP from three different regions of the United States in 2011 (1).
- CDC. Sexually transmitted disease surveillance 2011. Atlanta, GA: US Department of Health and Human Services; 2012.
- CDC. Update to CDC's sexually transmitted diseases treatment guidelines, 2010: oral cephalosporins no longer a recommended treatment for gonococcal infections. MMWR 2012;61:590–4.
Hansen Disease (Leprosy)
The number of reported cases decreased by 16%, from 98 cases in 2010 to 82 cases in 2011. The geographic distribution of cases reported in 2011 was the same as that reported in 2010, with Florida, Texas, California, and Hawaii reporting 61 cases and accounting for the majority (approximately 75%) of 82 reported cases. No cases were reported from any U.S. territories.
Hantavirus Pulmonary Syndrome
Hantavirus Pulmonary Syndrome (HPS) is a severe, sometimes fatal, respiratory disease in humans caused by infection with a hantavirus. Anyone who comes into contact with rodents that carry hantavirus is at risk for HPS. Rodent infestation in and around the home remains the primary risk for hantavirus exposure.
In 2011, HPS was confirmed in a rural Maine resident. This was the first person to have developed HPS from exposure to mice in Maine. Also in 2011, a fatal case of HPS occurred in a Long Island, New York, resident. This was the second case of HPS in a New York resident since 1995, and the fourth case in a person potentially exposed to rodents in the state. Although 517 (>95%) of 538 HPS cases have occurred west of the Mississippi river (1), the deer mouse (Peromyscus maniculatus, reservoir for Sin Nombre virus) and the white-footed mouse (Peromyscus leucopus, reservoir for the New York virus) are distributed widely throughout North America, and the potential for hantavirus infection is present wherever persons come into contact with an infected rodent (2).
- Knust B, MacNeil A, Rollin PE. Hantavirus pulmonary syndrome clinical findings: evaluating a surveillance case definition. Vector Borne Zoonotic Dis 2012;12:393–9.
- Mills JN, Amman BR, Glass GE. Ecology of hantaviruses and their hosts in North America. Vector Borne Zoonotic Dis 2009;10:563–74.
Influenza-Associated Pediatric Mortality
In June 2004, the Council of State and Territorial Epidemiologists added influenza-associated pediatric mortality (i.e., among persons aged <18 years) to the list of conditions reportable to the National Notifiable Diseases Surveillance System. Cumulative year-to-date incidence data are published each week in MMWR Table 1 for low-incidence nationally notifiable diseases. MMWR counts of deaths are by date of report in a calendar year and not by date of occurrence. A total of 118 influenza-associated pediatric deaths reported to CDC during 2011. Although all deaths occurred during the 2010–2011 influenza season, 10 of these deaths occurred in 2010, and were reported several months later in 2011. A total of 108 deaths occurred in 2011. This compares with a mean of 68 deaths (range: 43–90) per year that have been reported for seasonal influenza during 2005–2010. A total of 358 deaths were reported from April 15, 2009 to September 30, 2010, coinciding with the 2009 pandemic virus influenza A (H1N1)(pH1N1).
Of the 118 influenza-associated pediatric deaths reported to CDC during 2011, a total of 117 occurred between November 2010 and April 2011, and one occurred during August 2011. Seventy-three (62%) deaths were associated with influenza A viruses and 45 (38%) with influenza B viruses. Among the 73 influenza A virus-associated deaths, a subtype was determined for 54 (74%); 31 were influenza A (H1N1) (pH1N1) and 23 were A (H3N2) viruses.
In 2011, the median age at the time of death was 5.7 years (range: 25 days–17.9 years). This is similar to that observed (4–7.5 years) before the 2009 A (H1N1) pandemic for the years 2005–2008 and January–April 2009 but lower than that seen when pH1N1 viruses circulated widely during May–December 2009 (9.3 years) and 2010 (8.2 years). Sixteen children (14%) were aged <6 months; 18 (15%) were aged 6–23 months; 21 (18%) were aged 24–59 months; 17 (14%) were aged 5–8 years; 17 (14%) were aged 9–12 years; and the remaining 29 (25%) were aged 13–17 years. The overall influenza-associated death rate for children aged <18 years for 2011 was 0.16 per 100,000 population. The rates by age group were 0.63 per 100,000 population for children aged <1 year, 0.19 for children ≥1 year and <5 years, and 0.12 for children ≥5 and <18 years.
Information on the location of death was available for 117 of 118 children. Seventy-three children (62%) died after being admitted to the hospital (63 were admitted to an intensive care unit); 21 (18%) died in the emergency room; and 23 (20%) died outside the hospital. Information on underlying or chronic medical condition was reported for 116 (98%) children: 59 (51%) children had one or more underlying or chronic medical conditions, placing them at increased risk for influenza-associated complications (1). The most common group of underlying conditions were neurologic (e.g., moderate to severe developmental delay, seizure disorder, mitochondrial disorder, cerebral palsy, a neuromuscular disorder, or other neurological condition). These neurologic conditions were reported for 34 of 116 children for whom previous health status was known and 18 of 116 children were reported to have had a chronic pulmonary condition (e.g., asthma, cystic fibrosis, or other chronic pulmonary disease). Of 60 children who had specimens collected for bacterial culture from normally sterile sites, 23 (38%) had positive cultures. Staphylococcus aureus was detected in seven of 23 (30%) of the positive cultures; five were methicillin-resistant and two were methicillin-sensitive. Five cultures (16%) were positive for Streptococcus pneumoniae and four (20%) were positive for Group A Streptococcus. Other streptococcus species, Pseudomonas aeruginosa and Enterobacter cloacae, were identified less frequently. Of the 72 fatal cases among children aged ≥6 months for whom seasonal vaccination status was known, 19 (26%) were vaccinated against influenza as recommended by the Advisory Committee on Immunization Practices (ACIP) for 2011(2). Continued surveillance of influenza-associated mortality is important to monitor both the effects of seasonal and novel influenza and the impact of interventions in children.
- CDC. Post-censal estimates of the resident population of the United States for July 1, 2010–July 1, 2011, by year, county, single year of age (0, 1, 12...85 years and over), bridged race, Hispanic origin, sex. Atlanta, GA: CDC, National Center for Health Statistics, 2011. Available at http://www.cdc.gov/nchs/nvss/bridged_race/data_documentation.htm#vintage2011.
- CDC. Prevention and control of influenza with vaccines: recommendations of the Advisory Committee on Immunization Practices (ACIP) 2011. MMWR 2011;60:1128–32.
Listeriosis
Listeria monocytogenes infection (listeriosis) is rare but causes severe invasive disease (e.g., bacteremia, meningitis, and fetal death). Listeriosis has been nationally notifiable since 2000. Listeriosis is acquired predominately through contaminated food and occurs most frequently among pregnant women and their newborns, older adults, and persons with certain immunocompromising conditions. Pregnancy-associated listeriosis is usually a mild illness but can be associated with fetal death and severe neonatal disease.
In 2011, the incidence of reported listeriosis in the United States was 0.28 infections per 100,000 population. Progress toward the Healthy People 2020 (objective no. FS-1.3) of 0.20 infections per 100,000 population (1) is measured through the Foodborne Diseases Active Surveillance Network (FoodNet), which conducts active surveillance for listeriosis in 10 U.S. states. FoodNet reported a preliminary annual incidence of Listeria monocytogenes in 2011 of 0.24 infections per 100,000 population, similar to the rate reported to NNDSS (2).
The Listeria Initiative is an enhanced surveillance system designed to aid public health authorities in the rapid investigation of listeriosis outbreaks by combining molecular subtyping results with epidemiologic data collected by state and local health departments (3). As part of the Listeria Initiative, CDC recommends that all clinical isolates of L. monocytogenes be forwarded routinely to a public health laboratory for pulsed-field gel electrophoresis (PFGE) subtyping, and submission of these PFGE patterns to PulseNet, the National Molecular Subtyping Network for Foodborne Disease Surveillance (4). In addition, communicable disease programs are asked to interview all listeriosis patients promptly using the standard Listeria Initiative case form, available at in English and Spanish at http://www.cdc.gov/listeria/surveillance.html.
The Listeria Initiative has allowed for timely identification and removal of contaminated food during outbreaks, including a large outbreak in 2011 linked to whole cantaloupes from a single farm (5) that resulted in 147 illnesses, 143 hospitalizations, 33 deaths, and one miscarriage (6). A second outbreak of listeriosis in 2011 was linked to ackawi and chive cheeses made from pasteurized milk; these cheeses were produced by a single manufacturer. In addition, illnesses associated with consumption of blue cheese made from unpasteurized milk were investigated (7).
- US Department of Health and Human Services. Healthy People 2020 objectives. Available at http://www.healthypeople.gov/2020/topicsobjectives2020/objectiveslist.aspx?topicId=14.
- CDC. Foodborne diseases active surveillance network. Available at http://www.cdc.gov/foodnet/data/trends/tables/table2a-b.html#table-2b.
- CDC. The listeria initiative surveillance overview. Available at http://www.cdc.gov/listeria/pdf/ListeriaInitiativeOverview_508.pdf.
- CDC. PulseNet. Available at http://www.cdc.gov/pulsenet.
- CDC. Multistate outbreak of listeriosis associated with Jensen Farms cantaloupe—United States, August–September, 2011. MMWR 2011;60:1357–8.
- CDC. Multi-state outbreak of listeriosis linked to whole cantaloupe in Jenson Farms, Colorado. Available at http://www.cdc.gov/listeria/outbreaks/cantaloupes-jensen-farms/082712/index.html.
- CDC. National listeria surveillance annual summary, 2011. Atlanta, Georgia. US Department of Health and Human Services, CDC, 2013.
Lyme disease
National surveillance for Lyme disease was implemented in the United States in 1991 using a case definition based on clinical and laboratory findings. CSTE revised the case definition, effective 2008, to standardize laboratory criteria for confirmation and allow reporting of "probable" cases.
The number of confirmed and probable Lyme disease cases reported to CDC increased by 2,939 (9.7%) in 2011 over 2010. Nevertheless, the total number of reported cases remained substantially lower than in either 2008 or 2009. Unlike 2010, when reported cases decreased in nearly all Northeastern and mid-Atlantic states, no consistent regional trend was apparent in 2011.
Measles
The elimination of endemic measles has been achieved in the United States (1); however, measles continues to be imported, resulting in substantial morbidity and expenditure of local, state, and federal public health resources (2,3). Although measles incidence in the United States remains low, the number of cases reported during 2011 was the highest since 1996.
A total of 191 cases accounted for the majority (87%) of persons with measles, which were unvaccinated or had unknown vaccination status; an estimated 68 (36%) were known to claim vaccine exemption based on personal, religious, or philosophical beliefs (PBEs). A total of 196 cases accounted for the majority (89%) of cases in 2011, which were import-associated. The World Health Organization, European Region, where approximately 30,000 cases occurred in 2011, accounted for the majority of imported cases (41%) among U.S. residents who acquired measles while traveling. Imported genotypes were identified in all 16 outbreaks, with 12 (75%) of the outbreaks being caused by D4 genotype virus, known to be circulating in Europe.
Seven outbreaks occurred after unvaccinated U.S. residents acquired infection abroad with onset of symptoms after returning to the United States. These outbreaks (range: 3–21 cases) accounted for 58 cases. A total of 38 (65%) persons claimed PBEs, seven (12%) were infants aged <12 months; for one child aged 12 months, measles vaccination had been delayed intentionally by parents until the child was older.
Cases in U.S. residents who were unvaccinated or who had unknown vaccine status, who had no medical contraindication to vaccination, and who were either born after 1957 or were aged ≥12 months (without prior documentation of presumptive evidence of immunity to measles), or were aged 6–11 months, with recent history of international travel, are considered vaccine-preventable. During 2011, a total of 48 of 57 imported cases occurred among unvaccinated U.S. residents who were vaccine-eligible: nine traveler cases occurred in infants aged 6–11 months; nine in infants aged 12–15 months; five in children aged 16 months–4 years; seven in persons aged 5–19 years; and 18 in persons aged 20–53 years. Among persons aged 20–53 years (median: 28 years), 44% held PBEs.
To prevent measles among U.S. residents, health-care providers should follow ACIP vaccination recommendations (4), ensuring that travelers are vaccinated, particularly infants aged 6–11 months, and that 2 doses are administered for those aged ≥12 months. In addition, parents should be educated about the risk for measles associated with international travel. Information on vaccination recommendations for travelers is available from CDC at http://www.cdc.gov/travel.
- Katz SL, Hinman AR. Summary and conclusions: measles elimination meeting, 16–17 March 2000. J Infect Dis 2004;189(Suppl 1):S43–7.
- CDC. Epidemiology of measles—United States, 2001–2003. MMWR 2004;53:713–6.
- Dayan GH, Ortega-Sanchez IR, LeBaron CW. The cost of containing one case of measles: the economic impact on the public health infrastructure, Iowa, 2004. Pediatrics 2005;116:1–4.
- CDC. Measles, mumps, and rubella—vaccine use and strategies for elimination of measles, rubella, and congenital rubella syndrome and control of mumps: recommendations of the Advisory Committee on Immunization Practices (ACIP). MMWR 1998;47(No. RR-8):38–9.
Meningoccocal Disease, Invasive
Neisseria meningitidis is a major cause of bacterial meningitis and sepsis in the United States. The highest incidence of meningococcal disease occurred among infants aged <1 year with a second peak occurring in adolescents and young adults (1,2). Among infants, disease incidence peaks within the first 6 months of life and the majority of cases in this age group are caused by serogroup B (2). Rates of meningococcal disease are at historic lows in the United States, but meningococcal disease continues to cause substantial morbidity and mortality in persons of all ages.
The Advisory Committee on Immunization Practices recommends routine use of quadrivalent (A, C, Y, W-135) meningococcal conjugate vaccine in adolescents and others at increased risk for disease (1). In October 2010, a booster dose was recommended for adolescents at age 16 years (3). In 2011, coverage with 1 dose of meningococcal conjugate vaccine was approximately 70% among 23,564 adolescents aged 13–17 years in the United States (4).
- CDC. Prevention and control of meningococcal disease: recommendations of the Advisory Committee on Immunization Practices (ACIP). MMWR 2005;54(No. RR-7).
- Cohn AC, MacNeil JR, Harrison LH, et al. Changes in Neisseria meningitidis disease epidemiology in the United States, 1998–2007: implications for prevention of meningococcal disease. Clin Infect Dis 2010:50:184–91.
- CDC. Updated recommendations for use of meningococcal conjugate vaccines—Advisory Committee on Immunization Practices (ACIP), 2010. MMWR 2011;60:72–6.
- CDC. National and state vaccination coverage among adolescents aged 13–17 years—United States, 2011. MMWR 2012:61:671–7.
Novel Influenza A
In 2007, CSTE added human infection with a novel influenza A virus to the list of conditions reportable to NNDSS (1). Novel influenza A virus infections are human infections with influenza A viruses that are different from currently circulating human seasonal influenza viruses. These viruses include those that are subtyped as nonhuman in origin and those that cannot be subtyped with standard methods and reagents used for currently circulating influenza viruses.
During 2005–2011, all cases of human infection with novel influenza A viruses involved swine-origin viruses (now called variant influenza viruses when detected in humans [2]), rather than avian-origin influenza viruses. Although most persons identified with variant influenza infection report contact with swine preceding their illness, limited human-to-human transmission of these viruses has occurred. Because the implications of sustained, ongoing transmission of these viruses between humans are potentially severe, prompt and thorough investigation of sporadic human infections with nonhuman influenza viruses is needed to reduce the risk for sustained transmission (2). In 2011, cases of variant influenza virus infection likely from human-to-human transmission were identified, but efficient, sustained transmission did not occur.
In 2011, a total of 14 cases of human infection with novel influenza A viruses were reported from seven states (Indiana [two], Iowa [three], Maine [two], Minnesota [one], Pennsylvania [three], West Virginia [two], and Wisconsin [one]) (3,4). One case (Wisconsin) was associated with an influenza A (H1N1) variant virus (H1N1v), one case (Minnesota) was associated with an influenza A (H1N2) variant virus (H1N2v), and the other 12 cases were associated with influenza A (H3N2) variant viruses (H3N2v). The H1N1v and H1N2v viruses were similar to viruses detected in cases previously reported (5). All 12 H3N2v viruses were similar to viruses previously identified in swine (6); however, these viruses had acquired the matrix (M) gene from the influenza A (H1N1)pdm09 virus, which has been hypothesized to contribute to increased transmissibility in animal models (7,8).
One case occurred in July (Indiana), three cases in August (Pennsylvania), four cases in October (Maine [two], Minnesota [one] and Indiana [one]), and six cases in November (Iowa [three], West Virginia [two], and Wisconsin [one]). Twelve out of 14 patients reported influenza-like illness (e.g., fever with cough and/or sore throat) and two patients (both with H3N2v virus infection) reported fever only. Three of the 14 patients (all with H3N2v virus infection) were hospitalized for influenza; all 14 fully recovered from their illness. Six patients with H3N2v virus infection and the two patients with H1N1v and H1N2v virus infection reported either direct contact (touching or handling) or indirect contact (walking through an area or coming within 6 feet) with swine in the week preceding illness onset. The remaining six patients with H3N2v infection had no known exposure to swine before illness onset, indicating likely human-to-human spread. Five cases occurred in two distinct clusters. In one cluster, illness onset occurred in three patients who were exposed to one another over a 4-day period; in the second cluster, illness onset was reported for two cases within a 10-day period. The patients in the second cluster attended a daycare center where multiple attendees had influenza-like illness during this 10-day period. The sixth patient without exposure to swine had a caretaker who was not ill, but reported contact with swine.
Transmission of variant influenza A viruses to humans usually occurs among persons in direct contact with pigs or in those who have visited places where pigs were present (e.g., agricultural fairs, farms, and petting zoos). CDC conducts surveillance for human infections with novel influenza A viruses in conjunction with state and local public health laboratories. Any specimen with results suggestive of the presence of a novel influenza A virus or that cannot be subtyped using standard methods and reagents at a public health laboratory is immediately submitted to CDC for further testing. Surveillance for human infections with novel influenza A viruses is essential, and early identification and intensive investigation of these cases are critical to evaluate the extent of outbreaks, and the potential for human-to-human transmission.
- Council of State and Territorial Epidemiologists. List of Nationally Notifiable Conditions. 2011. Available at http://www.c.ymcdn.com/sites/www.cste.org/resource/resmgr.
- CDC. Update: Influenza A (H3N2)v transmission and guidelines—five states, 2011. MMWR 2012;60:1741–4.
- CDC. Update: influenza activity—United States, 2010–11 season, and composition of the 2011–12 influenza vaccine. MMWR 2011;60:705–12.
- CDC. Update: influenza activity—United States, 2011–12 season, and composition of the 2012–13 influenza vaccine. MMWR 2011;60:705–12.
- Shinde V, Bridges CB, Uyeki TM, et al. Triple-reassortant swine influenza A (H1) in humans in the United States, 2005–2009. N Engl J Med 2009;360:2616–25.
- Vincent AL, Ma W, Lager KM, Janke BH, Richt JA. Swine influenza viruses: a North American perspective. Adv Virus Res 2008;72:127–54.
- Chou YY, Albrecht RA, Pica N, et al. The M segment of the 2009 new pandemic H1N1 influenza virus is critical for its high transmission efficiency in the guinea pig model. J Virol 2011;85:11235–41.
- Lakdawala SS, Lamirande EW, Suguitan AL, Jr., et al. Eurasian-origin gene segments contribute to the transmissibility, aerosol release, and morphology of the 2009 pandemic H1N1 influenza virus. PLoS Pathogens 2011;7:e1002443.
Pertussis
After the 2010 peak in reported pertussis (incidence: 8.9 per 100,000 population), reports of disease declined in 2011 (6.1 per 100,000 population). Consistent with previous years, age-specific rates are highest among infants aged <1 year (70.9 per 100,000 population). Similar to trends observed in 2009 and 2010, children aged 7–10 years continue to contribute the second highest rates of disease nationally (20.0 per 100,000 population). Rates of disease among adolescents remained lower than those observed before the introduction of three vaccines: tetanus, diptheria, and acellular pertussis (Tdap) in 2005 (24.5 per 100,000 population in 2004; 10.3 per 100,000 in 2011), and Tdap coverage continues to improve among adolescents aged 13–17 years (68.7% in 2010 to 78.2% in 2011) (1–3). Increasing Tdap coverage among adults continues to be a priority, and ACIP expanded Tdap recommendations to include vaccination of pregnant women in June of 2011 (4).
- CDC. Preventing tetanus, diphtheria, and pertussis among adolescents; use of tetanus toxoid, reduced diphtheria toxoid, and acellular pertussis vaccines: recommendations of the Advisory Committee on Immunization Practices (ACIP). MMWR 2006;55(No. RR–3).
- CDC. Vaccination coverage among adolescents aged 13–17 years—United States, 2010. MMWR 2011;60:1117–23.
- CDC. Vaccination coverage among adolescents aged 13–17 years—United States, 2011. MMWR 2012;61:671–7.
- CDC. Updated recommendations for use of tetanus toxoid, reduced diphtheria toxoid and acellular pertussis vaccine (Tdap) in pregnant women and persons who have or anticipate having close contact with an infant aged <12 months—Advisory Committee on Immunization Practices (ACIP), 2011. MMWR 2011;60:1424–6.
Q fever
Q fever is a worldwide disease with acute and chronic stages caused by the bacteria Coxiella burnetii. Cattle, sheep, and goats are the primary reservoirs for Q fever, although a variety of species can be infected. In 2008, the case definition for Q fever was further specified into acute and chronic cases.
Two outbreaks of Q fever were of particular note in 2011. A cluster of five persons had serologic or clinical evidence of infection with Coxiella burnetii, the causative agent of Q fever, in Michigan. Upon investigation, exposure was linked to habitual consumption of raw cow's milk from the same dairy farm (1). This was the first report of transmission by ingestion of raw milk products in the state of Michigan. The second outbreak was one of the largest ever reported in the United States. Twenty cases of Q fever were identified in Montana and Washington between January and July 2011 (2). These cases were linked epidemiologically to exposure to goats that originated from a single farm in eastern Washington state.
- Signs KA, Stobierski MG, Gandhi TN. Q fever cluster among raw milk drinkers, Michigan, 2011. Clin Infect Dis 2012;55:1387–9.
- CDC. Notes from the field: Q fever outbreak associated with goat farms—Washington and Montana, 2011. MMWR 2011;60:1393.
Rabies
During 2011, six cases of human rabies were reported in the United States, the most reported in a single year since 2004. Three cases reported from Massachusetts, New Jersey, and New York were associated with canine rabies virus variants acquired outside the United States (1,2). Two domestically acquired cases from Massachusetts and South Carolina were associated with bat rabies virus variants. The remaining case reported from California occurred in a person who survived; however, no rabies virus was isolated, and a definitive source of infection was not determined (3).
The recent decline in animals submitted for rabies diagnosis continued during 2011. A total of 99,905 suspected rabid animals were tested in 2011, compared with 104,647 in 2010, a decline of 4.5%. Despite this decline, substantial increases in reported rabid animals were observed among some reservoir species, most notably skunks (4).
- CDC. Imported human rabies—New Jersey, 2011. MMWR 2012;60;1734–6.
- CDC. Imported human rabies in a U.S. Army soldier—New York, 2011. MMWR 2012;61:302–5.
- CDC. Recovery of a patient from clinical rabies—California, 2011. MMWR 2012;61:61–5.
- Blanton JD, Dyer J, McBrayer J, Rupprecht CE. Rabies surveillance in the United States during 2011. J Am Vet Med Assoc 2012;241:712–22.
Salmonellosis
During 2011, as in previous years, the age group with the highest incidence of salmonellosis was children aged <5 years. Salmonellosis is reported most frequently in late summer and early fall; in 2011, this seasonality was again evident, with most reports during July–October. Salmonella infections have not declined over the past 10 years. In 2011, the incidence in the United States (16.8 infections per 100,000 population) was nearly one and a half times the 2020 national health objective target of 11.4 infections per 100,000 population (1). Data from the Foodborne Diseases Active Surveillance Network (FoodNet), which conducts active surveillance for salmonellosis in 10 U.S. states, are used to measure progress toward Healthy People 2020 objectives. FoodNet reported a preliminary annual incidence of Salmonella in 2011 of 16.5 infections per 100,000 population, similar to the rate reported to the National Notifiable Diseases Surveillance System (2).
Salmonella causes an estimated 1.2 million illnesses annually in the United States, approximately 1 million of which are transmitted by food consumed in the United States (3). Salmonella can contaminate a wide range of foods, and different serotypes tend to have different animal reservoirs and food sources, making control challenging. During 2011, multistate outbreaks of Salmonella infection were linked to fresh produce: cantaloupe (serotype Panama), alfalfa and spicy sprouts (serotype Enteritidis), and whole, fresh, imported papayas (serotype Agona); meat and poultry: ground beef (serotype Typhimurium), turkey burgers (serotype Hadar), ground turkey (serotype Heidelberg), kosher broiled chicken livers (serotype Heidelberg); other foods: Turkish pine nuts (serotype Enteritidis); and contact with animals: African dwarf frogs (serotype Typhimurium), frozen rodents used as reptile feed (serotype I, 4,[5],12:i:-), and chicks and ducklings (serotypes Altona and Johannesburg) (4).
- US Department of Health and Human Services. Healthy People 2020 objectives. Available at http://www.healthypeople.gov/2020/topicsobjectives2020/objectiveslist.aspx?topicId=14.
- CDC. Foodborne diseases active surveillance network. Available at http://www.cdc.gov/foodnet/data/trends/tables/table2a-b.html#table-2b.
- Scallan E, Hoekstra RM, Angulo FJ, et al. Foodborne illness acquired in the United States—major pathogens. Emerg Infect Dis 2011;17:7–15.
- CDC. Reports of selected Salmonella outbreak investigations. Available at http://www.cdc.gov/salmonella/outbreaks.html.
Shigellosis
In 2011, the incidence of reported shigellosis in the United States was 4.3 infections per 100,000 population. Accounting for underdiagnosis, Shigella causes an estimated 494,000 illnesses annually in the United States, approximately 131,000 of which are transmitted by food consumed in the United States (1). Shigella infections have not declined over the past 10 years. During 1999–2009, a total of 97,864 out of 116,191 (84%) of Shigella infection with a known species were caused by S. sonnei (2). During 2011, as in previous years, the age group with the highest incidence of shigellosis was children aged <10 years. S. sonnei infections generally account for approximately 75% of shigellosis in the United States (2). Shigellosis does not demonstrate marked seasonality, likely reflecting the importance of person-to-person transmission.
Shigella often is spread directly from one person to another, including through sexual contact between MSM, and also can be transmitted by contaminated food or by contaminated water used for drinking or recreational purposes (3). Some cases of shigellosis also are acquired during international travel (4,5). Daycare-associated outbreaks are common and are often difficult to control (6). During 2011, outbreaks of S. sonnei infection were reported within traditionally observant Jewish communities in several northeastern and midwestern states. Outbreaks in such communities have occurred before (7). Resistance to ampicillin and trimethoprim-sulfamethoxazole among S. sonnei strains in the United States remains common, and resistance to quinolones, including ciprofloxacin, is emerging and cause for concern (8).
- Scallan E, Hoekstra RM, Angulo FJ, et al. Foodborne illness acquired in the United States—major pathogens. Emerg Infect Dis 2011;17:7–15.
- CDC. National Shigella surveillance annual summary, 2009. Atlanta, GA: US Department of Health and Human Services, CDC; 2012. Available at http://www.cdc.gov/ncezid/dfwed/PDFs/shigella-annual-summary-2009-508c.pdf.
- Gupta A, Polyak CS, Bishop RD, Sobel J, Mintz ED. Laboratory confirmed shigellosis in the United States, 1989–2002: epidemiologic trends and patterns. Clin Infect Dis 2004;38:1372–7.
- Ram PK, Crump JA, Gupta SK, Miller MA, Mintz ED. Review article: part II. Analysis of data gaps pertaining to Shigella infections in low and medium human development index countries, 1984–2005. Epidemiol Infect 2008;136:577–603.
- Gupta SK, Strockbine N, Omondi M, et al. Short report: emergence of Shiga toxin 1 genes within Shigella dysenteriae Type 4 isolates from travelers returning from the island of Hispaniola. Am J Trop Med Hyg 2007;76:1163–5.
- Arvelo W, Hinkle J, Nguyen TA, et al. Transmission risk factors and treatment of pediatric shigellosis during a large daycare center-associated outbreak of multidrug resistant Shigella sonnei. Pediatr Infect Dis J 2009;11:976–80.
- Garrett V, Bornschlegel K, Lange D, et al. A recurring outbreak of Shigella sonnei among traditionally observant Jewish children in New York City: the risks of daycare and household transmission. Epidemiol Infect 2006;134:1231–6.
- CDC. National Antimicrobial Resistance Monitoring System (NARMS) for enteric bacteria: human isolates final report, 2010. Atlanta, GA: US Department of Health and Human Services, CDC; 2012. Available at http://www.cdc.gov/narms.
Spotted Fever Rickettsiosis
Spotted fever rickettsioses are a group of tickborne infections caused by some members of the genus Rickettsia. More cases of spotted fever rickettsiosis were reported in 2011 than in any year since 1920, when spotted fever rickettsiosis became a reportable condition. Similarly, 18 states reported more cases in 2011 than any year in the last decade. Although the increase in reported cases might be influenced by testing and reporting practices, high tick vector activity and increased human exposure to infected ticks in 2011 might have resulted in an increased incidence of spotted fever rickettsiosis.
Shiga Toxin-Producing Escherichia coli (STEC)
During 2011, as in previous years, the age group with the highest incidence of Shiga toxin-producing Escherichia coli (STEC) infections was children aged <5 years. STEC infection is reported most frequently in late summer and early fall. In 2011, this seasonality was evident, with the highest number of reports in July, August, September, and October. During 2011, several multistate outbreaks of STEC O157 infection were linked to foods (e.g., romaine lettuce, Lebanon bologna, and hazelnuts). In addition, six cases of STEC O104:H4 were linked to travel to Germany during a large outbreak associated with sprouts (1).
Accounting for underdiagnosis, an estimated 96,000 illnesses are caused by STEC O157, and 168,000 illnesses are caused by non-O157 STEC each year (2). Escherichia coli O157:H7 infection has been nationally notifiable since 1994 (3). STEC infection caused by any serotype was made nationally notifiable in 2001, originally using the nomenclature "enterohemorrhagic E. coli (EHEC)" and changing to STEC in 2006 (4).
Public health actions to monitor, prevent, and control STEC infections are made on the basis of serogroup characterization. Development of postdiarrheal hemolytic uremic syndrome, a severe complication of STEC infection, is most strongly associated with STEC O157. Non-O157 STEC, a diverse group that varies in virulence, comprises 50 other serogroups. In the United States, STEC O157 is the most commonly reported serogroup of STEC causing human infection (5); however, increased use of assays for the detection of Shiga toxins in clinical laboratories in recent years has led to increased reporting of non-O157 STEC infection (6). Stool specimens from patients with community-acquired diarrhea submitted to clinical laboratories should be tested routinely both by culture for STEC O157 and by an assay that detects Shiga toxins (7). Detection of Shiga toxin alone is inadequate for outbreak detection; characterizing STEC isolates by serogroup and by pulsed-field gel electrophoresis pattern is important to detect, investigate, and control outbreaks.
- CDC. Reports of selected E. coli outbreak investigations. Available at http://www.cdc.gov/ecoli/outbreaks.html.
- Scallan E, Hoekstra RM, Angulo FJ, et al. Foodborne illness acquired in the United States—major pathogens. Emerg Infect Dis 2011;17:7–15.
- Mead PS, Griffin PM. Escherichia coli O157:H7. Lancet 1998;352:1207–12.
- Council of State and Territorial Epidemiologists. Revision of the Enterohemorrhagic Escherichia coli (EHEC) condition name to Shiga toxin-producing Escherichia coli (STEC) and adoption of serotype specific national reporting for STEC. Position statement 05-ID-07. Atlanta, GA: Council of State and Territorial Epidemiologists; 2005. Available at http://c.ymcdn.com/sites/www.cste.org/resource/resmgr/PS-05-ID-07.
- CDC. National shiga toxin-producing Escherichia coli (STEC) surveillance annual summary, 2009. Atlanta, GA: US Department of Health and Human Services, CDC, 2012. Available at http://www.cdc.gov/ncezid/dfwed/PDFs/national-stec-surv-summ-2009-508c.pdf.
- Hoefer D, Hurd S, Medis C, et al. Laboratory practices for the identification of Shiga toxin-producing Escherichia coli in the United States, FoodNet Sites, 2007. Foodborne Pathog Dis 2011;8:555–60.
- CDC. Recommendations for diagnosis of Shiga toxin-producing Escherichia coli infections by clinical laboratories, 2009. MMWR 2009;58:1–14.
Primary and Secondary Syphilis
During 2011, overall rates of primary and secondary syphilis remained unchanged compared with 2010. Rates among women continued to decrease (33% compared with 2008), but increased among men for the eleventh consecutive year. Rates were highest among men aged approximately 20–24 years and 25–29 years for the fourth consecutive year. Notably, cases among MSM increased each year during 2007–2011 in 33 states and in areas reporting sex of partner data for approximately 70% of cases of primary and secondary syphilis each year during this period. During 2007–2011, rates among black men aged 20–24 years increased from 54.9 to 96.2 cases per 100,000 population (75%); the magnitude of this increase (41.3 cases per 100,000 population) was the greatest reported regardless of age, sex, or race/ethnicity (1). Analyses showing recent trends of increasing primary and secondary syphilis among black MSM are consistent with these data (2).
- CDC. Sexually transmitted disease surveillance 2011. Atlanta, GA: US Department of Health and Human Services; 2012.
- Su JR, Beltrami JF, Zaidi AA, Weinstock HS. Primary and secondary syphilis among black and Hispanic men who have sex with men: case report data from 27 states. Ann Intern Med 2011;155:145–51.
Typhoid Fever
Typhoid fever is rare in the United States. During 1999–2006, 1,439 out of 1,902 patients reported foreign travel within 30 days of illness, which accounted for approximately 79% of cases associated with international travel (1). The risk for infection is highest for travelers visiting friends and relatives in countries where typhoid fever is endemic, perhaps because they are less likely than other travelers to seek pretravel vaccination and to observe strict safe water and food practices. The risk also is higher for travelers who visit areas where disease is most highly endemic, such as the Indian subcontinent, even for a short time (2). CDC recently removed pretravel typhoid vaccination recommendations for 26 low-risk destinations; pretravel vaccination guidelines can be found at http://www.cdc.gov/travel (3).
During 1960–1999, a total of 60 outbreaks of typhoid fever were reported in the United States (4). The first domestically acquired outbreak of typhoid fever in more than a decade occurred in 2010. Twelve cases were identified, and illness was linked to consumption of imported frozen mamey fruit (5). Mamey from the same producer in Guatemala also was implicated in the last domestic typhoid fever outbreak, which occurred in 1999 (5). No outbreaks were reported in 2011.
- Lynch MF, Blanton EM, Bulens S, et al. Typhoid fever in the United States, 1999–2006. JAMA 2009;302:898–9
- Steinberg EB, Bishop RB, Dempsey AF, et al. Typhoid fever in travelers: who should be targeted for prevention? Clin Infect Dis 2004;39:186–91.
- Johnson KJ, Gallagher NM, Mintz ED, et al. From the CDC: New country-specific recommendations for pre-travel typhoid vaccination. J Travel Med 2011;18:430–3.
- Olsen SJ, Bleasdale SC, Magnano AR, et al. Outbreaks of typhoid fever in the United States, 1960–1999. Epidemiol Infect 2003;130:13–21.
- Loharikar A, Newton A, Rowley P, et al. Typhoid fever outbreak associated with frozen mamey pulp imported from Guatemala to the western United States, 2010. Clin Infect Dis 2012;55:61–6.
Varicella
As varicella incidence has declined with implementation of the varicella vaccination program (1,2), more states are able to conduct varicella surveillance. Thus, varicella surveillance data reported to CDC through the National Notifiable Diseases Surveillance System (NNDSS) are now adequate for monitoring trends in varicella incidence (3).
The number of states reporting varicella data to CDC through NNDSS continued to increase, from 38 in 2010 to 39 in 2011. Varicella incidence continues to decline during the 2-dose varicella vaccination era; varicella incidence in the 31 states meeting criteria for adequate and consistent reporting (3) decreased 73.6% from 31.4 per 100,000 in 2006 to 8.3 per 100,000 in 2011. Among children aged 5–9 years, which includes children targeted for the second dose of varicella vaccine, age-specific incidence decreased 85.7%, from 261 per 100,000 in 2006 to 37.2 per 100,000 in 2011.
CDC encourages all states to move toward case-based varicella surveillance to allow for effective monitoring of the impact of the 2-dose varicella vaccination program. States are encouraged to collect standard demographic, clinical, and epidemiologic data, in addition to the previously requested information on disease severity (e.g., number of lesions and hospitalizations), vaccination status (e.g., whether the person received varicella-containing vaccine and the number of doses), and ages of persons to help with the continued monitoring of the impact of the 2-dose varicella vaccination recommendation.
- CDC. Prevention of varicella: recommendations of the Advisory Committee on Immunization Practices (ACIP). MMWR 2007;56 (No. RR-4).
- Guris D, Jumaan AO, Mascola L, et al. Changing varicella epidemiology in active surveillance sites—United States, 1995–2005. J Infect Dis 2008;197 (Suppl 2):S71–5.
- CDC. Evolution of varicella surveillance—selected states, 2000–2010. MMWR 2012;61:609–12.
Vibriosis
Vibriosis became a nationally notifiable condition in 2007 (1). Three states (California, Florida, and Texas) report the largest numbers of cases. Vibrio parahaemolyticus, V. vulnificus, and V. alginolyticus account for the largest proportion of reported infections. The incidence of vibriosis, both overall and for each of the three most commonly reported species has increased over the past 15 years (2). In 2011, an outbreak of toxigenic (i.e., producing cholera toxin) V. cholerae O75 infection was associated with consumption of raw oysters harvested from Apalachicola Bay.
- Council of State and Territorial Epidemiologists. National reporting for non-cholera Vibrio infections (vibriosis). Position statement 06-ID-05. Atlanta, GA: Council of State and Territorial Epidemiologists; 2006.
- Newton A, Kendall M, Vugia DJ, et al. Increasing rates of vibriosis in the United States, 1996–2010: review of surveillance data from 2 systems. Clin Infect Dis 2012;545:S391–5.
Abbreviations and Symbols Used in Tables
U Data not available.
N Not reportable (i.e., report of disease is not required in that jurisdiction).
— No reported cases.
Notes: Rates <0.01 after rounding are listed as 0.
Data in the MMWR Summary of Notifiable Diseases — United States, 2011 might differ from data in other CDC surveillance reports because of differences in the timing of reports, the source of the data, the use of different case definitions, and print criteria.
|
TABLE 1. (Continued) Reported cases of notifiable diseases,* by month — United States, 2011 |
||||||||||||||
|---|---|---|---|---|---|---|---|---|---|---|---|---|---|---|
|
Name |
Jan. |
Feb. |
Mar. |
Apr. |
May |
June |
July |
Aug. |
Sept. |
Oct. |
Nov. |
Dec. |
Month not stated |
Total |
|
Mumps |
22 |
44 |
26 |
28 |
23 |
14 |
20 |
25 |
34 |
81 |
32 |
55 |
— |
404 |
|
Novel influenza A virus infection |
— |
— |
— |
— |
— |
— |
1 |
1 |
2 |
2 |
4 |
4 |
— |
14 |
|
Pertussis |
1,438 |
1,412 |
1,219 |
1,325 |
970 |
975 |
1,507 |
1,333 |
1,393 |
1,919 |
1,947 |
3,281 |
— |
18,719 |
|
Plague |
— |
— |
— |
1 |
1 |
— |
— |
— |
1 |
— |
— |
— |
— |
3 |
|
Psittacosis |
— |
— |
1 |
— |
— |
— |
— |
— |
1 |
— |
— |
— |
— |
2 |
|
Q fever, total |
— |
6 |
4 |
10 |
6 |
20 |
10 |
11 |
12 |
10 |
11 |
34 |
— |
134 |
|
acute |
— |
4 |
2 |
8 |
6 |
18 |
10 |
8 |
10 |
8 |
9 |
27 |
— |
110 |
|
chronic |
— |
2 |
2 |
2 |
— |
2 |
— |
3 |
2 |
2 |
2 |
7 |
— |
24 |
|
Rabies |
||||||||||||||
|
animal |
170 |
304 |
268 |
448 |
411 |
404 |
461 |
440 |
424 |
424 |
296 |
307 |
— |
4,357 |
|
human |
— |
— |
— |
1 |
— |
1 |
— |
— |
1 |
— |
— |
3 |
— |
6 |
|
Rubella |
— |
— |
— |
— |
2 |
1 |
— |
— |
— |
— |
1 |
— |
— |
4 |
|
Salmonellosis |
1,947 |
1,807 |
2,029 |
3,401 |
3,572 |
4,415 |
7,195 |
6,777 |
6,143 |
6,223 |
3,905 |
4,473 |
— |
51,887 |
|
Shiga toxin-producing E. coli (STEC) |
171 |
166 |
238 |
394 |
363 |
567 |
943 |
898 |
625 |
732 |
426 |
524 |
— |
6,047 |
|
Shigellosis |
671 |
600 |
609 |
923 |
917 |
1,298 |
1,406 |
1,213 |
1,179 |
1,530 |
1,314 |
1,692 |
— |
13,352 |
|
Spotted fever rickettsiosis, total |
23 |
24 |
29 |
64 |
135 |
191 |
542 |
482 |
305 |
324 |
181 |
502 |
— |
2,802 |
|
confirmed |
8 |
— |
6 |
14 |
14 |
23 |
59 |
39 |
20 |
21 |
14 |
16 |
— |
234 |
|
probable |
15 |
24 |
22 |
49 |
121 |
168 |
480 |
443 |
285 |
302 |
167 |
486 |
— |
2,562 |
|
Streptococcal toxic-shock syndrome |
15 |
19 |
24 |
19 |
14 |
9 |
13 |
6 |
3 |
9 |
10 |
27 |
— |
168 |
|
Streptococcus pneumoniae, invasive disease |
||||||||||||||
|
all ages |
1,786 |
1,870 |
1,952 |
2,153 |
1,445 |
1,014 |
755 |
556 |
668 |
1,222 |
1,308 |
2,409 |
— |
17,138 |
|
age <5 yrs |
118 |
125 |
177 |
198 |
113 |
78 |
70 |
49 |
72 |
124 |
133 |
202 |
— |
1,459 |
|
Syphilis, total, all stages**,†† |
3,128 |
3,507 |
3,690 |
4,550 |
3,654 |
3,663 |
4,363 |
3,642 |
3,502 |
4,538 |
3,067 |
4,738 |
— |
46,042 |
|
congenital (age <1 yr)** |
35 |
47 |
27 |
27 |
28 |
26 |
36 |
32 |
28 |
19 |
28 |
27 |
— |
360 |
|
primary and secondary** |
905 |
1,043 |
1,099 |
1,369 |
1,032 |
1,074 |
1,306 |
1,119 |
1,114 |
1,423 |
970 |
1,516 |
— |
13,970 |
|
Tetanus |
1 |
2 |
— |
4 |
5 |
1 |
5 |
3 |
5 |
2 |
4 |
4 |
— |
36 |
|
Toxic-shock syndrome (other than streptococcal) |
6 |
6 |
6 |
5 |
5 |
7 |
3 |
9 |
5 |
8 |
5 |
13 |
— |
78 |
|
Trichinellosis |
1 |
2 |
1 |
5 |
1 |
1 |
— |
— |
— |
1 |
— |
3 |
— |
15 |
|
Tuberculosis§§ |
510 |
631 |
890 |
860 |
849 |
992 |
786 |
904 |
886 |
956 |
807 |
1,457 |
— |
10,528 |
|
Tularemia |
— |
— |
1 |
6 |
26 |
27 |
30 |
18 |
16 |
18 |
13 |
11 |
— |
166 |
|
Typhoid fever |
23 |
37 |
30 |
41 |
35 |
39 |
24 |
35 |
45 |
30 |
18 |
33 |
— |
390 |
|
Vancomycin-intermediate Staphylococcus aureus (VISA) |
4 |
4 |
4 |
9 |
5 |
5 |
10 |
7 |
9 |
9 |
6 |
10 |
— |
82 |
|
Varicella (Chickenpox) |
||||||||||||||
|
morbidity |
1,121 |
1,089 |
1,382 |
1,677 |
1,406 |
952 |
744 |
629 |
1,002 |
1,679 |
1,230 |
1,602 |
— |
14,513 |
|
mortality¶¶ |
— |
2 |
— |
— |
— |
— |
1 |
— |
1 |
1 |
— |
— |
— |
5 |
|
Vibriosis |
11 |
14 |
20 |
55 |
53 |
65 |
144 |
146 |
117 |
97 |
47 |
63 |
— |
832 |
|
* No cases of diphtheria; eastern equine encephalitis virus disease, nonneuroinvasive; poliomyelitis, paralytic; poliovirus infection, nonparalytic; rubella, congenital syndrome; severe acute respiratory syndrome-associated coronavirus (SARS-CoV) disease; smallpox; vancomycin resistant staphylococcus aureus; western equine encephalitis virus disease, neuroinvasive and nonneuroinvasive; yellow fever; and viral hemorrhagic fevers were reported in the United States during 2011. Data on Hepatitis B virus, perinatal infection, and chronic hepatitis B and hepatitis C virus infection (past or present) are not included because they are undergoing data quality review. † Totals reported to the Division of Vector-Borne Diseases (DVBD), National Center for Emerging and Zoonotic Infectious Diseases (NCEZID) (ArboNET Surveillance), as of June 1, 2012. § Total number of HIV diagnoses case counts was reported to the Division of HIV/AIDS Prevention, National Center for HIV/AIDS, Viral Hepatitis, STD, and TB Prevention (NCHHSTP) through December 31, 2011. ¶ Totals reported to the Division of Influenza, National Center for Immunization and Respiratory Diseases (NCIRD), as of December 31, 2011. ** Totals reported to the Division of STD Prevention, National Center for HIV/AIDS, Viral Hepatitis, STD, and TB Prevention (NCHHSTP), as of June 7, 2012. †† Includes the following categories: primary, secondary, latent (including early latent, late latent, and latent syphilis of unknown duration), neurosyphilis, late (including late syphilis with clinical manifestations other than neurosyphilis), and congenital syphilis. Totals reported to the Division of STD Prevention, NCHHSTP, as of June 7, 2012. §§ Totals reported to the Division of Tuberculosis Elimination, NCHHSTP, as of June 25, 2012. ¶¶ Totals reported to the Division of Viral Diseases, NCIRD, as of June 30, 2012. |
||||||||||||||
|
TABLE 2. (Continued) Reported cases of notifiable diseases,* by geographic division and area — United States, 2011 |
||||||||
|
Area |
Babesiosis |
Botulism |
Brucellosis |
Chancroid§ |
Chlamydia trachomatis infection§ |
|||
|---|---|---|---|---|---|---|---|---|
|
Total |
Foodborne |
Infant |
Other† |
|||||
|
United States |
1,128 |
153 |
24 |
97 |
32 |
79 |
8 |
1,412,791 |
|
New England |
378 |
— |
— |
— |
— |
1 |
2 |
48,146 |
|
Connecticut |
74 |
— |
— |
— |
— |
— |
— |
13,649 |
|
Maine |
9 |
— |
— |
— |
— |
— |
— |
3,094 |
|
Massachusetts |
208 |
— |
— |
— |
— |
1 |
2 |
22,764 |
|
New Hampshire |
13 |
— |
— |
— |
— |
— |
— |
3,010 |
|
Rhode Island |
73 |
— |
— |
— |
— |
— |
— |
4,146 |
|
Vermont |
1 |
— |
— |
— |
— |
— |
— |
1,483 |
|
Mid. Atlantic |
584 |
29 |
2 |
27 |
— |
7 |
— |
181,856 |
|
New Jersey |
166 |
11 |
— |
11 |
— |
1 |
— |
26,209 |
|
New York (Upstate) |
361 |
2 |
1 |
1 |
— |
— |
— |
37,494 |
|
New York City |
57 |
4 |
1 |
3 |
— |
3 |
— |
65,269 |
|
Pennsylvania |
N |
12 |
— |
12 |
— |
3 |
— |
52,884 |
|
E.N. Central |
80 |
3 |
2 |
1 |
— |
10 |
1 |
219,580 |
|
Illinois |
N |
— |
— |
— |
— |
8 |
— |
64,939 |
|
Indiana |
— |
1 |
1 |
— |
— |
— |
— |
27,801 |
|
Michigan |
— |
— |
— |
— |
— |
1 |
1 |
49,568 |
|
Ohio |
N |
2 |
1 |
1 |
— |
1 |
— |
52,653 |
|
Wisconsin |
80 |
— |
— |
— |
— |
— |
— |
24,619 |
|
W.N. Central |
74 |
2 |
— |
1 |
1 |
1 |
— |
78,726 |
|
Iowa |
N |
— |
— |
— |
— |
1 |
— |
10,705 |
|
Kansas |
N |
1 |
— |
1 |
— |
— |
— |
10,598 |
|
Minnesota |
73 |
1 |
— |
— |
1 |
— |
— |
16,902 |
|
Missouri |
N |
— |
— |
— |
— |
— |
— |
27,887 |
|
Nebraska |
— |
— |
— |
— |
— |
— |
— |
6,780 |
|
North Dakota |
1 |
— |
— |
— |
— |
— |
— |
2,445 |
|
South Dakota |
N |
— |
— |
— |
— |
— |
— |
3,409 |
|
S. Atlantic |
5 |
9 |
1 |
8 |
— |
13 |
2 |
293,101 |
|
Delaware |
1 |
2 |
— |
2 |
— |
— |
— |
4,508 |
|
District of Columbia |
N |
— |
— |
— |
— |
— |
— |
6,585 |
|
Florida |
N |
— |
— |
— |
— |
6 |
— |
76,033 |
|
Georgia |
— |
1 |
1 |
— |
— |
5 |
— |
54,403 |
|
Maryland |
4 |
2 |
— |
2 |
— |
1 |
— |
27,212 |
|
North Carolina |
N |
2 |
— |
2 |
— |
— |
— |
54,819 |
|
South Carolina |
N |
— |
— |
— |
— |
1 |
2 |
28,932 |
|
Virginia |
N |
2 |
— |
2 |
— |
— |
— |
36,314 |
|
West Virginia |
N |
— |
— |
— |
— |
— |
— |
4,295 |
|
E.S. Central |
2 |
7 |
— |
7 |
— |
4 |
— |
98,576 |
|
Alabama |
1 |
— |
— |
— |
— |
1 |
— |
29,626 |
|
Kentucky |
N |
2 |
— |
2 |
— |
— |
— |
16,629 |
|
Mississippi |
N |
2 |
— |
2 |
— |
1 |
— |
21,216 |
|
Tennessee |
1 |
3 |
— |
3 |
— |
2 |
— |
31,105 |
|
W.S. Central |
— |
6 |
1 |
4 |
1 |
15 |
1 |
187,144 |
|
Arkansas |
N |
— |
— |
— |
— |
3 |
— |
16,052 |
|
Louisiana |
N |
— |
— |
— |
— |
— |
— |
31,614 |
|
Oklahoma |
N |
1 |
1 |
— |
— |
1 |
— |
14,596 |
|
Texas |
N |
5 |
— |
4 |
1 |
11 |
1 |
124,882 |
|
Mountain |
— |
26 |
10 |
15 |
1 |
10 |
1 |
90,226 |
|
Arizona |
N |
5 |
2 |
3 |
— |
3 |
1 |
29,251 |
|
Colorado |
N |
4 |
— |
3 |
1 |
— |
— |
21,811 |
|
Idaho |
N |
2 |
— |
2 |
— |
2 |
— |
4,699 |
|
Montana |
— |
— |
— |
— |
— |
— |
— |
3,406 |
|
Nevada |
N |
1 |
— |
1 |
— |
— |
— |
10,507 |
|
New Mexico |
N |
2 |
— |
2 |
— |
2 |
— |
11,374 |
|
Utah |
N |
12 |
8 |
4 |
— |
3 |
— |
7,086 |
|
Wyoming |
— |
— |
— |
— |
— |
— |
— |
2,092 |
|
Pacific |
5 |
71 |
8 |
34 |
29 |
18 |
1 |
215,436 |
|
Alaska |
N |
6 |
6 |
— |
— |
— |
— |
5,739 |
|
California |
4 |
58 |
1 |
30 |
27 |
15 |
1 |
166,773 |
|
Hawaii |
N |
— |
— |
— |
— |
1 |
— |
6,001 |
|
Oregon |
1 |
2 |
1 |
1 |
— |
1 |
— |
13,643 |
|
Washington |
— |
5 |
— |
3 |
2 |
1 |
— |
23,280 |
|
Territories |
||||||||
|
American Samoa |
— |
— |
— |
— |
— |
— |
— |
— |
|
C.N.M.I. |
— |
— |
— |
— |
— |
— |
— |
— |
|
Guam |
— |
— |
— |
— |
— |
— |
— |
1,071 |
|
Puerto Rico |
N |
— |
— |
— |
N |
— |
— |
5,634 |
|
U.S. Virgin Islands |
N |
— |
— |
— |
— |
— |
— |
820 |
|
N: Not reportable U: Unavailable — : No reported cases C.N.M.I.: Commonwealth of Northern Mariana Islands. * No cases of diphtheria; eastern equine encephalitis virus disease, nonneuroinvasive; poliomyelitis, paralytic; poliovirus infection, nonparalytic; rubella, congenital syndrome; severe acute respiratory syndrome-associated coronavirus (SARS-CoV) disease; smallpox; vancomycin-resistant Staphylococcus aureus; western equine encephalitis virus disease, neuroinvasive and nonneuroinvasive; yellow fever; and viral hemorrhagic fevers were reported in the United States during 2011. Data on hepatitis B virus, perinatal infection, and chronic hepatitis B and hepatitis C virus infection (past or present) are not included because they are undergoing data quality review. † Includes cases reported as wound and unspecified botulism. § Totals reported to the Division of STD Prevention, NCHHSTP, as of June 7, 2012. |
||||||||
|
TABLE 2. (Continued) Reported cases of notifiable diseases,* by geographic division and area — United States, 2011 |
||||||||
|
Area |
Cholera |
Coccidioidomycosis |
Cryptosporidiosis |
Cyclosporiasis |
Dengue virus infection† |
|||
|---|---|---|---|---|---|---|---|---|
|
Total |
Confirmed |
Probable |
Dengue fever |
Dengue hemorrhagic fever |
||||
|
United States |
40 |
22,634 |
9,250 |
6,130 |
3,120 |
151 |
251 |
3 |
|
New England |
4 |
2 |
418 |
358 |
60 |
12 |
4 |
— |
|
Connecticut |
— |
N |
71 |
71 |
— |
10 |
1 |
— |
|
Maine |
— |
N |
51 |
19 |
32 |
N |
— |
— |
|
Massachusetts |
4 |
— |
168 |
168 |
— |
2 |
— |
— |
|
New Hampshire |
— |
1 |
68 |
40 |
28 |
— |
— |
— |
|
Rhode Island |
— |
1 |
12 |
12 |
— |
— |
— |
— |
|
Vermont |
— |
N |
48 |
48 |
— |
N |
3 |
— |
|
Mid. Atlantic |
14 |
6 |
904 |
824 |
80 |
38 |
69 |
— |
|
New Jersey |
1 |
N |
56 |
55 |
1 |
8 |
— |
— |
|
New York (Upstate) |
2 |
N |
234 |
226 |
8 |
11 |
8 |
— |
|
New York City |
10 |
N |
86 |
86 |
— |
19 |
45 |
— |
|
Pennsylvania |
1 |
6 |
528 |
457 |
71 |
N |
16 |
— |
|
E.N. Central |
2 |
56 |
2,676 |
1,476 |
1,200 |
7 |
21 |
2 |
|
Illinois |
1 |
N |
213 |
31 |
182 |
— |
6 |
2 |
|
Indiana |
— |
N |
261 |
79 |
182 |
— |
2 |
— |
|
Michigan |
1 |
36 |
358 |
325 |
33 |
7 |
6 |
— |
|
Ohio |
— |
20 |
1,106 |
303 |
803 |
— |
2 |
— |
|
Wisconsin |
— |
— |
738 |
738 |
— |
— |
5 |
— |
|
W.N. Central |
1 |
130 |
1,563 |
714 |
849 |
3 |
13 |
— |
|
Iowa |
— |
N |
364 |
61 |
303 |
1 |
5 |
— |
|
Kansas |
1 |
N |
42 |
42 |
— |
— |
1 |
— |
|
Minnesota |
— |
104 |
309 |
309 |
— |
— |
6 |
— |
|
Missouri |
— |
18 |
495 |
156 |
339 |
1 |
— |
— |
|
Nebraska |
— |
8 |
175 |
124 |
51 |
1 |
— |
— |
|
North Dakota |
— |
N |
32 |
1 |
31 |
N |
1 |
— |
|
South Dakota |
— |
N |
146 |
21 |
125 |
— |
— |
— |
|
S. Atlantic |
13 |
5 |
1,239 |
791 |
448 |
69 |
92 |
1 |
|
Delaware |
— |
— |
7 |
7 |
— |
1 |
2 |
— |
|
District of Columbia |
— |
— |
N |
— |
— |
N |
— |
— |
|
Florida |
11 |
N |
437 |
203 |
234 |
58 |
66 |
— |
|
Georgia |
1 |
N |
307 |
307 |
— |
6 |
6 |
— |
|
Maryland |
— |
5 |
70 |
66 |
4 |
1 |
6 |
— |
|
North Carolina |
— |
N |
115 |
69 |
46 |
1 |
4 |
— |
|
South Carolina |
— |
N |
132 |
66 |
66 |
— |
1 |
— |
|
Virginia |
1 |
N |
140 |
54 |
86 |
2 |
7 |
1 |
|
West Virginia |
— |
N |
31 |
19 |
12 |
— |
— |
— |
|
E.S. Central |
2 |
— |
457 |
301 |
156 |
2 |
11 |
— |
|
Alabama |
— |
N |
138 |
16 |
122 |
N |
4 |
— |
|
Kentucky |
2 |
N |
177 |
160 |
17 |
N |
4 |
— |
|
Mississippi |
— |
N |
50 |
50 |
— |
N |
— |
— |
|
Tennessee |
— |
N |
92 |
75 |
17 |
2 |
3 |
— |
|
W.S. Central |
1 |
3 |
712 |
579 |
133 |
15 |
10 |
— |
|
Arkansas |
— |
N |
32 |
32 |
— |
— |
— |
— |
|
Louisiana |
— |
3 |
87 |
87 |
— |
1 |
3 |
— |
|
Oklahoma |
— |
N |
89 |
2 |
87 |
— |
— |
— |
|
Texas |
1 |
N |
504 |
458 |
46 |
14 |
7 |
— |
|
Mountain |
1 |
16,712 |
641 |
552 |
89 |
1 |
6 |
— |
|
Arizona |
— |
16,467 |
46 |
42 |
4 |
— |
2 |
— |
|
Colorado |
— |
N |
147 |
126 |
21 |
— |
— |
— |
|
Idaho |
— |
N |
111 |
79 |
32 |
N |
— |
— |
|
Montana |
— |
5 |
77 |
77 |
— |
N |
— |
— |
|
Nevada |
— |
104 |
17 |
3 |
14 |
N |
1 |
— |
|
New Mexico |
1 |
75 |
134 |
134 |
— |
1 |
2 |
— |
|
Utah |
— |
58 |
63 |
62 |
1 |
— |
1 |
— |
|
Wyoming |
— |
3 |
46 |
29 |
17 |
— |
— |
— |
|
Pacific |
2 |
5,720 |
640 |
535 |
105 |
4 |
25 |
— |
|
Alaska |
1 |
N |
12 |
12 |
— |
N |
— |
— |
|
California |
1 |
5,697 |
332 |
332 |
— |
— |
5 |
— |
|
Hawaii |
— |
N |
1 |
1 |
— |
— |
11 |
— |
|
Oregon |
— |
13 |
207 |
179 |
28 |
— |
— |
— |
|
Washington |
— |
10 |
88 |
11 |
77 |
4 |
9 |
— |
|
Territories |
||||||||
|
American Samoa |
— |
N |
N |
— |
— |
N |
— |
— |
|
C.N.M.I. |
— |
— |
— |
— |
— |
— |
— |
— |
|
Guam |
— |
— |
— |
— |
— |
— |
— |
— |
|
Puerto Rico |
1 |
N |
N |
— |
— |
N |
1,507 |
34 |
|
U.S. Virgin Islands |
— |
— |
— |
— |
— |
— |
— |
— |
|
N: Not reportable U: Unavailable — : No reported cases C.N.M.I.: Commonwealth of Northern Mariana Islands. * No cases of diphtheria; eastern equine encephalitis virus disease, nonneuroinvasive; poliomyelitis, paralytic; poliovirus infection, nonparalytic; rubella, congenital syndrome; severe acute respiratory syndrome-associated coronavirus (SARS-CoV) disease; smallpox; vancomycin-resistant Staphylococcus aureus; western equine encephalitis virus disease, neuroinvasive and nonneuroinvasive; yellow fever; and viral hemorrhagic fevers were reported in the United States during 2011. Data on hepatitis B virus, perinatal infection, and chronic hepatitis B and hepatitis C virus infection (past or present) are not included because they are undergoing data quality review. † Total number of reported laboratory-positive dengue cases including all confirmed cases (by anti-dengue virus [DENV] molecular diagnostic methods or seroconversion of anti-DENV IgM) and all probable cases (by a single, positive anti-DENV IgM). Totals reported to the Division of Vector-Borne Diseases (DVBD), National Center for Emerging and Zoonotic Infectious Diseases (NCEZID) (ArboNET Surveillance), as of April 17, 2012. |
||||||||
|
TABLE 2. (Continued) Reported cases of notifiable diseases,* by geographic division and area — United States, 2011 |
||||||
|
Area |
Ehrlichiosis/Anaplasmosis |
Giardiasis |
Gonorrhea† |
|||
|---|---|---|---|---|---|---|
|
Anaplasma phagocytophilum |
Ehrlichia chaffeensis |
Ehrlichia ewingii |
Undetermined |
|||
|
United States |
2,575 |
850 |
13 |
148 |
16,747 |
321,849 |
|
New England |
461 |
4 |
— |
2 |
1,594 |
5,612 |
|
Connecticut |
152 |
— |
— |
— |
233 |
2,449 |
|
Maine |
26 |
1 |
— |
— |
171 |
272 |
|
Massachusetts |
172 |
— |
— |
— |
758 |
2,353 |
|
New Hampshire |
31 |
1 |
— |
1 |
130 |
130 |
|
Rhode Island |
72 |
2 |
— |
1 |
79 |
360 |
|
Vermont |
8 |
— |
— |
— |
223 |
48 |
|
Mid. Atlantic |
482 |
108 |
— |
25 |
3,293 |
41,824 |
|
New Jersey |
126 |
60 |
— |
7 |
437 |
7,348 |
|
New York (Upstate) |
314 |
41 |
— |
11 |
1,144 |
6,240 |
|
New York City |
36 |
4 |
— |
— |
917 |
14,466 |
|
Pennsylvania |
6 |
3 |
— |
7 |
795 |
13,770 |
|
E.N. Central |
710 |
42 |
— |
58 |
2,657 |
58,022 |
|
Illinois |
11 |
25 |
— |
— |
407 |
17,037 |
|
Indiana |
— |
— |
— |
18 |
324 |
6,569 |
|
Michigan |
— |
4 |
— |
5 |
550 |
12,901 |
|
Ohio |
9 |
6 |
— |
1 |
799 |
16,726 |
|
Wisconsin |
690 |
7 |
— |
34 |
577 |
4,789 |
|
W.N. Central |
808 |
178 |
6 |
25 |
1,769 |
16,420 |
|
Iowa |
N |
N |
N |
N |
271 |
1,920 |
|
Kansas |
6 |
18 |
— |
1 |
139 |
2,209 |
|
Minnesota |
770 |
7 |
1 |
10 |
672 |
2,284 |
|
Missouri |
25 |
151 |
5 |
13 |
344 |
7,802 |
|
Nebraska |
1 |
1 |
— |
1 |
179 |
1,352 |
|
North Dakota |
3 |
— |
— |
— |
54 |
251 |
|
South Dakota |
3 |
1 |
— |
— |
110 |
602 |
|
S. Atlantic |
72 |
272 |
6 |
16 |
2,756 |
79,089 |
|
Delaware |
1 |
15 |
2 |
— |
34 |
827 |
|
District of Columbia |
N |
N |
N |
N |
56 |
2,569 |
|
Florida |
11 |
15 |
— |
— |
1,255 |
19,689 |
|
Georgia |
11 |
23 |
1 |
3 |
651 |
16,428 |
|
Maryland |
7 |
33 |
2 |
— |
291 |
6,458 |
|
North Carolina |
21 |
83 |
— |
1 |
N |
17,454 |
|
South Carolina |
— |
2 |
— |
1 |
117 |
8,350 |
|
Virginia |
21 |
100 |
1 |
9 |
290 |
6,518 |
|
West Virginia |
— |
1 |
— |
2 |
62 |
796 |
|
E.S. Central |
15 |
78 |
1 |
14 |
171 |
27,134 |
|
Alabama |
4 |
5 |
— |
— |
171 |
9,132 |
|
Kentucky |
— |
16 |
— |
— |
N |
4,521 |
|
Mississippi |
1 |
3 |
— |
— |
N |
5,814 |
|
Tennessee |
10 |
54 |
1 |
14 |
N |
7,667 |
|
W.S. Central |
20 |
167 |
— |
1 |
349 |
49,001 |
|
Arkansas |
8 |
53 |
— |
— |
123 |
4,687 |
|
Louisiana |
1 |
— |
— |
1 |
226 |
9,169 |
|
Oklahoma |
9 |
110 |
— |
— |
— |
4,215 |
|
Texas |
2 |
4 |
— |
— |
N |
30,930 |
|
Mountain |
1 |
— |
— |
5 |
1,326 |
11,336 |
|
Arizona |
— |
— |
— |
4 |
133 |
4,564 |
|
Colorado |
N |
N |
N |
N |
445 |
2,363 |
|
Idaho |
N |
N |
N |
N |
178 |
162 |
|
Montana |
N |
N |
N |
N |
86 |
85 |
|
Nevada |
— |
— |
— |
— |
79 |
2,000 |
|
New Mexico |
N |
N |
N |
N |
108 |
1,839 |
|
Utah |
— |
— |
— |
1 |
256 |
277 |
|
Wyoming |
1 |
— |
— |
— |
41 |
46 |
|
Pacific |
6 |
1 |
— |
2 |
2,832 |
33,411 |
|
Alaska |
N |
N |
N |
N |
101 |
984 |
|
California |
— |
— |
— |
2 |
1,728 |
27,516 |
|
Hawaii |
N |
N |
N |
N |
38 |
685 |
|
Oregon |
6 |
— |
— |
— |
436 |
1,489 |
|
Washington |
— |
1 |
— |
— |
529 |
2,737 |
|
Territories |
||||||
|
American Samoa |
N |
N |
N |
N |
— |
— |
|
C.N.M.I. |
— |
— |
— |
— |
— |
— |
|
Guam |
N |
N |
N |
N |
— |
96 |
|
Puerto Rico |
N |
N |
N |
N |
84 |
341 |
|
U.S. Virgin Islands |
— |
— |
— |
— |
— |
139 |
|
N: Not reportable U: Unavailable — : No reported cases C.N.M.I.: Commonwealth of Northern Mariana Islands. * No cases of diphtheria; eastern equine encephalitis virus disease, nonneuroinvasive; poliomyelitis, paralytic; poliovirus infection, nonparalytic; rubella, congenital syndrome; severe acute respiratory syndrome-associated coronavirus (SARS-CoV) disease; smallpox; vancomycin-resistant Staphylococcus aureus; western equine encephalitis virus disease, neuroinvasive and nonneuroinvasive; yellow fever; and viral hemorrhagic fevers were reported in the United States during 2011. Data on hepatitis B virus, perinatal infection, and chronic hepatitis B and hepatitis C virus infection (past or present) are not included because they are undergoing data quality review. † Totals reported to the Division of STD Prevention, NCHHSTP, as of June 7, 2012. |
||||||
|
TABLE 2. (Continued) Reported cases of notifiable diseases,* by geographic division and area — United States, 2011 |
|||||||
|
Area |
Haemophilus influenza, invasive disease |
Hansen disease (leprosy) |
Hantavirus pulmonary syndrome |
Hemolytic uremic syndrome, postdiarrheal |
|||
|---|---|---|---|---|---|---|---|
|
All ages, serotypes |
Age <5 years |
||||||
|
Serotype b |
Nonserotype b |
Unknown serotype |
|||||
|
United States |
3,539 |
14 |
145 |
226 |
82 |
23 |
290 |
|
New England |
252 |
— |
9 |
6 |
3 |
— |
12 |
|
Connecticut |
65 |
— |
— |
4 |
— |
N |
2 |
|
Maine |
26 |
— |
1 |
— |
N |
— |
2 |
|
Massachusetts |
121 |
— |
7 |
— |
2 |
— |
5 |
|
New Hampshire |
17 |
— |
1 |
1 |
— |
— |
— |
|
Rhode Island |
16 |
— |
— |
— |
1 |
— |
2 |
|
Vermont |
7 |
— |
— |
1 |
N |
— |
1 |
|
Mid. Atlantic |
771 |
— |
13 |
45 |
4 |
1 |
21 |
|
New Jersey |
123 |
— |
— |
9 |
— |
— |
4 |
|
New York (Upstate) |
195 |
— |
8 |
1 |
N |
1 |
13 |
|
New York City |
187 |
— |
— |
15 |
4 |
— |
4 |
|
Pennsylvania |
266 |
— |
5 |
20 |
— |
— |
N |
|
E.N. Central |
645 |
3 |
30 |
28 |
3 |
— |
36 |
|
Illinois |
188 |
— |
6 |
8 |
— |
— |
7 |
|
Indiana |
117 |
1 |
9 |
— |
1 |
— |
— |
|
Michigan |
72 |
— |
— |
14 |
— |
— |
9 |
|
Ohio |
173 |
2 |
15 |
— |
2 |
— |
5 |
|
Wisconsin |
95 |
— |
— |
6 |
— |
— |
15 |
|
W.N. Central |
224 |
2 |
4 |
23 |
2 |
2 |
49 |
|
Iowa |
3 |
— |
— |
— |
— |
1 |
13 |
|
Kansas |
23 |
— |
— |
3 |
— |
— |
4 |
|
Minnesota |
71 |
1 |
3 |
— |
— |
— |
12 |
|
Missouri |
80 |
— |
— |
13 |
2 |
— |
20 |
|
Nebraska |
30 |
1 |
1 |
4 |
— |
— |
— |
|
North Dakota |
16 |
— |
— |
3 |
N |
— |
— |
|
South Dakota |
1 |
— |
— |
— |
— |
1 |
— |
|
S. Atlantic |
783 |
2 |
25 |
46 |
14 |
— |
24 |
|
Delaware |
6 |
— |
— |
— |
— |
— |
— |
|
District of Columbia |
1 |
— |
— |
— |
— |
N |
N |
|
Florida |
232 |
— |
— |
23 |
11 |
— |
4 |
|
Georgia |
140 |
— |
10 |
10 |
— |
— |
7 |
|
Maryland |
95 |
1 |
7 |
1 |
2 |
— |
2 |
|
North Carolina |
85 |
— |
— |
8 |
— |
— |
5 |
|
South Carolina |
79 |
— |
2 |
3 |
— |
— |
3 |
|
Virginia |
108 |
1 |
5 |
— |
1 |
— |
3 |
|
West Virginia |
37 |
— |
1 |
1 |
N |
— |
— |
|
E.S. Central |
225 |
3 |
14 |
7 |
1 |
— |
25 |
|
Alabama |
57 |
1 |
5 |
— |
— |
N |
9 |
|
Kentucky |
41 |
— |
1 |
4 |
— |
— |
N |
|
Mississippi |
19 |
1 |
1 |
— |
1 |
N |
1 |
|
Tennessee |
108 |
1 |
7 |
3 |
— |
— |
15 |
|
W.S. Central |
163 |
— |
9 |
13 |
19 |
— |
41 |
|
Arkansas |
35 |
— |
5 |
— |
2 |
— |
12 |
|
Louisiana |
53 |
— |
— |
13 |
1 |
— |
— |
|
Oklahoma |
73 |
— |
4 |
— |
N |
— |
7 |
|
Texas |
2 |
— |
N |
N |
16 |
— |
22 |
|
Mountain |
294 |
3 |
31 |
16 |
2 |
16 |
25 |
|
Arizona |
95 |
1 |
13 |
2 |
— |
3 |
5 |
|
Colorado |
67 |
— |
5 |
— |
— |
3 |
6 |
|
Idaho |
21 |
— |
2 |
1 |
— |
1 |
3 |
|
Montana |
3 |
— |
— |
— |
— |
2 |
1 |
|
Nevada |
17 |
— |
— |
3 |
1 |
2 |
2 |
|
New Mexico |
47 |
— |
2 |
10 |
— |
5 |
2 |
|
Utah |
42 |
2 |
9 |
— |
1 |
— |
5 |
|
Wyoming |
2 |
— |
— |
— |
— |
— |
1 |
|
Pacific |
182 |
1 |
10 |
42 |
34 |
4 |
57 |
|
Alaska |
26 |
— |
— |
11 |
— |
N |
N |
|
California |
44 |
— |
— |
27 |
14 |
— |
42 |
|
Hawaii |
32 |
— |
— |
4 |
20 |
— |
1 |
|
Oregon |
72 |
— |
3 |
— |
N |
2 |
14 |
|
Washington |
8 |
1 |
7 |
— |
N |
2 |
— |
|
Territories |
|||||||
|
American Samoa |
— |
— |
— |
— |
— |
N |
N |
|
C.N.M.I. |
— |
— |
— |
— |
— |
— |
— |
|
Guam |
— |
— |
— |
— |
— |
N |
— |
|
Puerto Rico |
— |
— |
— |
— |
— |
— |
N |
|
U.S. Virgin Islands |
N |
— |
— |
— |
— |
N |
N |
|
N: Not reportable U: Unavailable — : No reported cases C.N.M.I.: Commonwealth of Northern Mariana Islands. * No cases of diphtheria; eastern equine encephalitis virus disease, nonneuroinvasive; poliomyelitis, paralytic; poliovirus infection, nonparalytic; rubella, congenital syndrome; severe acute respiratory syndrome-associated coronavirus (SARS-CoV) disease; smallpox; vancomycin-resistant Staphylococcus aureus; western equine encephalitis virus disease, neuroinvasive and nonneuroinvasive; yellow fever; and viral hemorrhagic fevers were reported in the United States during 2011. Data on hepatitis B virus, perinatal infection, and chronic hepatitis B and hepatitis C virus infection (past or present) are not included because they are undergoing data quality review. |
|||||||
|
TABLE 2. (Continued) Reported cases of notifiable diseases,* by geographic division and area — United States, 2011 |
|||||||
|
Area |
Hepatitis, viral, acute |
HIV diagnoses† |
Influenza-associated pediatric mortality§ |
Legionellosis |
Listeriosis |
||
|---|---|---|---|---|---|---|---|
|
A |
B |
C |
|||||
|
United States |
1,398 |
2,903 |
1,229 |
35,266 |
118 |
4,202 |
870 |
|
New England |
77 |
97 |
88 |
1,003 |
4 |
406 |
61 |
|
Connecticut |
18 |
19 |
47 |
305 |
1 |
81 |
18 |
|
Maine |
6 |
8 |
12 |
46 |
1 |
18 |
4 |
|
Massachusetts |
39 |
67 |
23 |
523 |
1 |
240 |
32 |
|
New Hampshire |
— |
3 |
N |
40 |
— |
26 |
4 |
|
Rhode Island |
8 |
U |
U |
88 |
— |
29 |
3 |
|
Vermont |
6 |
— |
6 |
1 |
1 |
12 |
— |
|
Mid. Atlantic |
252 |
291 |
140 |
5,628 |
15 |
1,353 |
158 |
|
New Jersey |
79 |
73 |
53 |
812 |
4 |
235 |
33 |
|
New York (Upstate) |
47 |
54 |
44 |
1,301 |
2 |
400 |
48 |
|
New York City |
66 |
80 |
8 |
2,246 |
3 |
216 |
30 |
|
Pennsylvania |
60 |
84 |
35 |
1,269 |
6 |
502 |
47 |
|
E.N. Central |
214 |
353 |
143 |
3,641 |
19 |
864 |
116 |
|
Illinois |
73 |
85 |
6 |
1,351 |
7 |
151 |
34 |
|
Indiana |
24 |
70 |
84 |
434 |
2 |
71 |
11 |
|
Michigan |
70 |
91 |
32 |
610 |
6 |
187 |
29 |
|
Ohio |
39 |
90 |
6 |
987 |
1 |
386 |
29 |
|
Wisconsin |
8 |
17 |
15 |
259 |
3 |
69 |
13 |
|
W.N. Central |
59 |
124 |
35 |
1,085 |
9 |
122 |
62 |
|
Iowa |
8 |
15 |
— |
116 |
— |
11 |
5 |
|
Kansas |
4 |
15 |
8 |
126 |
— |
14 |
14 |
|
Minnesota |
27 |
20 |
17 |
283 |
3 |
29 |
6 |
|
Missouri |
13 |
60 |
8 |
481 |
1 |
55 |
21 |
|
Nebraska |
5 |
12 |
2 |
46 |
— |
8 |
9 |
|
North Dakota |
— |
— |
— |
12 |
1 |
3 |
6 |
|
South Dakota |
2 |
2 |
— |
21 |
4 |
2 |
1 |
|
S. Atlantic |
222 |
775 |
284 |
10,925 |
22 |
640 |
111 |
|
Delaware |
2 |
13 |
U |
99 |
— |
24 |
— |
|
District of Columbia |
— |
— |
— |
495 |
— |
N |
N |
|
Florida |
87 |
213 |
64 |
4,890 |
2 |
185 |
38 |
|
Georgia |
27 |
142 |
53 |
1,431 |
4 |
55 |
9 |
|
Maryland |
26 |
62 |
35 |
851 |
— |
143 |
19 |
|
North Carolina |
31 |
109 |
60 |
1,439 |
10 |
83 |
21 |
|
South Carolina |
11 |
39 |
1 |
771 |
— |
25 |
6 |
|
Virginia |
30 |
84 |
25 |
857 |
5 |
93 |
15 |
|
West Virginia |
8 |
113 |
46 |
92 |
1 |
32 |
3 |
|
E.S. Central |
48 |
519 |
248 |
2,191 |
2 |
180 |
22 |
|
Alabama |
8 |
119 |
23 |
592 |
— |
29 |
9 |
|
Kentucky |
10 |
151 |
142 |
233 |
2 |
53 |
4 |
|
Mississippi |
7 |
57 |
U |
552 |
— |
14 |
4 |
|
Tennessee |
23 |
192 |
83 |
814 |
— |
84 |
5 |
|
W.S. Central |
157 |
423 |
97 |
4,967 |
16 |
165 |
79 |
|
Arkansas |
3 |
57 |
— |
199 |
— |
14 |
6 |
|
Louisiana |
5 |
62 |
7 |
1,281 |
1 |
25 |
7 |
|
Oklahoma |
11 |
100 |
53 |
262 |
4 |
15 |
15 |
|
Texas |
138 |
204 |
37 |
3,225 |
11 |
111 |
51 |
|
Mountain |
129 |
88 |
85 |
1,410 |
12 |
147 |
98 |
|
Arizona |
77 |
14 |
U |
494 |
4 |
46 |
8 |
|
Colorado |
21 |
23 |
28 |
362 |
3 |
41 |
51 |
|
Idaho |
6 |
2 |
12 |
16 |
— |
9 |
5 |
|
Montana |
3 |
— |
9 |
17 |
— |
1 |
3 |
|
Nevada |
5 |
29 |
10 |
320 |
3 |
16 |
5 |
|
New Mexico |
7 |
10 |
14 |
111 |
1 |
12 |
15 |
|
Utah |
8 |
10 |
10 |
76 |
1 |
18 |
5 |
|
Wyoming |
2 |
— |
2 |
14 |
— |
4 |
6 |
|
Pacific |
240 |
233 |
109 |
4,416 |
19 |
325 |
163 |
|
Alaska |
4 |
3 |
— |
25 |
— |
— |
— |
|
California |
186 |
157 |
48 |
3,679 |
16 |
261 |
123 |
|
Hawaii |
8 |
6 |
— |
50 |
1 |
5 |
12 |
|
Oregon |
11 |
32 |
20 |
213 |
1 |
22 |
9 |
|
Washington |
31 |
35 |
41 |
449 |
1 |
37 |
19 |
|
Territories |
|||||||
|
American Samoa |
— |
— |
— |
— |
— |
N |
N |
|
C.N.M.I. |
— |
— |
— |
— |
— |
— |
— |
|
Guam |
43 |
120 |
70 |
1 |
— |
— |
— |
|
Puerto Rico |
21 |
28 |
N |
436 |
— |
9 |
— |
|
U.S. Virgin Islands |
— |
5 |
— |
22 |
— |
1 |
— |
|
N: Not reportable U: Unavailable — : No reported cases C.N.M.I.: Commonwealth of Northern Mariana Islands. * No cases of diphtheria; eastern equine encephalitis virus disease, nonneuroinvasive; poliomyelitis, paralytic; poliovirus infection, nonparalytic; rubella, congenital syndrome; severe acute respiratory syndrome-associated coronavirus (SARS-CoV) disease; smallpox; vancomycin-resistant Staphylococcus aureus; western equine encephalitis virus disease, neuroinvasive and nonneuroinvasive; yellow fever; and viral hemorrhagic fevers were reported in the United States during 2011. Data on hepatitis B virus, perinatal infection, and chronic hepatitis B and hepatitis C virus infection (past or present) are not included because they are undergoing data quality review. † Total number of HIV cases reported to the Division of HIV/AIDS Prevention, National Center for HIV/AIDS, Viral Hepatitis, STD, and TB Prevention (NCHHSTP) through December 31, 2011. § Totals reported to the Division of Influenza, National Center for Immunization and Respiratory Diseases (NCIRD), as of December 31, 2011. |
|||||||
|
TABLE 2. (Continued) Reported cases of notifiable diseases,* by geographic division and area — United States, 2011 |
|||||||
|
Area |
Lyme disease |
Malaria |
Measles |
||||
|---|---|---|---|---|---|---|---|
|
Total |
Confirmed |
Probable |
Total |
Indigenous |
Imported† |
||
|
United States |
33,097 |
24,364 |
8,733 |
1,724 |
220 |
140 |
80 |
|
New England |
8,602 |
6,080 |
2,522 |
109 |
28 |
18 |
10 |
|
Connecticut |
3,039 |
2,004 |
1,035 |
20 |
1 |
— |
1 |
|
Maine |
1,006 |
801 |
205 |
6 |
— |
— |
— |
|
Massachusetts |
2,476 |
1,801 |
675 |
68 |
24 |
17 |
7 |
|
New Hampshire |
1,299 |
887 |
412 |
3 |
1 |
— |
1 |
|
Rhode Island |
159 |
111 |
48 |
6 |
1 |
— |
1 |
|
Vermont |
623 |
476 |
147 |
6 |
1 |
1 |
— |
|
Mid. Atlantic |
14,114 |
11,255 |
2,859 |
438 |
49 |
35 |
14 |
|
New Jersey |
4,262 |
3,398 |
864 |
97 |
4 |
3 |
1 |
|
New York (Upstate) |
3,759 |
2,678 |
1,081 |
53 |
7 |
4 |
3 |
|
New York City |
731 |
440 |
291 |
227 |
25 |
16 |
9 |
|
Pennsylvania |
5,362 |
4,739 |
623 |
61 |
13 |
12 |
1 |
|
E.N. Central |
4,094 |
2,808 |
1,286 |
174 |
21 |
15 |
6 |
|
Illinois |
194 |
194 |
— |
66 |
3 |
1 |
2 |
|
Indiana |
94 |
81 |
13 |
14 |
14 |
13 |
1 |
|
Michigan |
104 |
89 |
15 |
34 |
2 |
1 |
1 |
|
Ohio |
53 |
36 |
17 |
41 |
— |
— |
— |
|
Wisconsin |
3,649 |
2,408 |
1,241 |
19 |
2 |
— |
2 |
|
W.N. Central |
2,291 |
1,304 |
987 |
109 |
34 |
30 |
4 |
|
Iowa |
100 |
72 |
28 |
22 |
1 |
— |
1 |
|
Kansas |
17 |
11 |
6 |
10 |
6 |
6 |
— |
|
Minnesota |
2,124 |
1,185 |
939 |
46 |
26 |
23 |
3 |
|
Missouri |
8 |
5 |
3 |
21 |
— |
— |
— |
|
Nebraska |
11 |
7 |
4 |
8 |
— |
— |
— |
|
North Dakota |
27 |
22 |
5 |
— |
1 |
1 |
— |
|
South Dakota |
4 |
2 |
2 |
2 |
— |
— |
— |
|
S. Atlantic |
3,637 |
2,720 |
917 |
478 |
20 |
7 |
13 |
|
Delaware |
873 |
767 |
106 |
7 |
1 |
1 |
— |
|
District of Columbia |
N |
— |
— |
18 |
N |
— |
— |
|
Florida |
115 |
78 |
37 |
99 |
8 |
3 |
5 |
|
Georgia |
32 |
32 |
— |
91 |
— |
— |
— |
|
Maryland |
1,351 |
938 |
413 |
128 |
2 |
— |
2 |
|
North Carolina |
88 |
18 |
70 |
49 |
2 |
— |
2 |
|
South Carolina |
37 |
24 |
13 |
7 |
— |
— |
— |
|
Virginia |
1,023 |
756 |
267 |
78 |
7 |
3 |
4 |
|
West Virginia |
118 |
107 |
11 |
1 |
— |
— |
— |
|
E.S. Central |
69 |
20 |
49 |
41 |
4 |
1 |
3 |
|
Alabama |
24 |
9 |
15 |
9 |
— |
— |
— |
|
Kentucky |
3 |
3 |
— |
10 |
1 |
— |
1 |
|
Mississippi |
5 |
3 |
2 |
1 |
— |
— |
— |
|
Tennessee |
37 |
5 |
32 |
21 |
3 |
1 |
2 |
|
W.S. Central |
78 |
31 |
47 |
121 |
6 |
5 |
1 |
|
Arkansas |
— |
— |
— |
7 |
— |
— |
— |
|
Louisiana |
2 |
1 |
1 |
2 |
— |
— |
— |
|
Oklahoma |
2 |
2 |
— |
10 |
— |
— |
— |
|
Texas |
74 |
28 |
46 |
102 |
6 |
5 |
1 |
|
Mountain |
52 |
32 |
20 |
67 |
20 |
13 |
7 |
|
Arizona |
15 |
8 |
7 |
21 |
2 |
— |
2 |
|
Colorado |
— |
— |
— |
24 |
— |
— |
— |
|
Idaho |
4 |
3 |
1 |
2 |
— |
— |
— |
|
Montana |
11 |
9 |
2 |
2 |
— |
— |
— |
|
Nevada |
5 |
3 |
2 |
8 |
1 |
— |
1 |
|
New Mexico |
6 |
2 |
4 |
5 |
4 |
1 |
3 |
|
Utah |
9 |
6 |
3 |
5 |
13 |
12 |
1 |
|
Wyoming |
2 |
1 |
1 |
— |
— |
— |
— |
|
Pacific |
160 |
114 |
46 |
187 |
38 |
16 |
22 |
|
Alaska |
11 |
9 |
2 |
5 |
— |
— |
— |
|
California |
92 |
79 |
13 |
129 |
31 |
12 |
19 |
|
Hawaii |
N |
N |
N |
7 |
— |
— |
— |
|
Oregon |
38 |
9 |
29 |
22 |
3 |
2 |
1 |
|
Washington |
19 |
17 |
2 |
24 |
4 |
2 |
2 |
|
Territories |
|||||||
|
American Samoa |
N |
— |
— |
1 |
— |
— |
— |
|
C.N.M.I. |
— |
— |
— |
— |
— |
— |
— |
|
Guam |
— |
— |
— |
— |
— |
— |
— |
|
Puerto Rico |
N |
— |
— |
1 |
— |
— |
— |
|
U.S. Virgin Islands |
N |
— |
— |
— |
— |
— |
— |
|
N: Not reportable U: Unavailable — : No reported cases C.N.M.I.: Commonwealth of Northern Mariana Islands. * No cases of diphtheria; eastern equine encephalitis virus disease, nonneuroinvasive; poliomyelitis, paralytic; poliovirus infection, nonparalytic; rubella, congenital syndrome; severe acute respiratory syndrome-associated coronavirus (SARS-CoV) disease; smallpox; vancomycin-resistant Staphylococcus aureus; western equine encephalitis virus disease, neuroinvasive and nonneuroinvasive; yellow fever; and viral hemorrhagic fevers were reported in the United States during 2011. Data on hepatitis B virus, perinatal infection, and chronic hepatitis B and hepatitis C virus infection (past or present) are not included because they are undergoing data quality review. † Imported cases include only those directly related to importation from other countries. |
|||||||
|
TABLE 2. (Continued) Reported cases of notifiable diseases,* by geographic division and area — United States, 2011 |
|||||||
|
Area |
Meningococcal disease |
Mumps |
Novel influenza A virus infections |
||||
|---|---|---|---|---|---|---|---|
|
All serogroups |
Serogroup A, C, Y, and W-135 |
Serogroup B |
Serogroup other |
Serogroup unknown |
|||
|
United States |
759 |
257 |
159 |
20 |
323 |
404 |
14 |
|
New England |
29 |
18 |
7 |
2 |
2 |
12 |
2 |
|
Connecticut |
3 |
2 |
— |
— |
1 |
— |
— |
|
Maine |
5 |
3 |
2 |
— |
— |
2 |
2 |
|
Massachusetts |
14 |
8 |
3 |
2 |
1 |
4 |
— |
|
New Hampshire |
1 |
1 |
— |
— |
— |
— |
— |
|
Rhode Island |
1 |
— |
1 |
— |
— |
5 |
— |
|
Vermont |
5 |
4 |
1 |
— |
— |
1 |
— |
|
Mid. Atlantic |
92 |
20 |
5 |
1 |
66 |
55 |
3 |
|
New Jersey |
13 |
— |
— |
— |
13 |
13 |
— |
|
New York (Upstate) |
23 |
18 |
4 |
1 |
— |
10 |
— |
|
New York City |
31 |
— |
— |
— |
31 |
29 |
— |
|
Pennsylvania |
25 |
2 |
1 |
— |
22 |
3 |
3 |
|
E.N. Central |
115 |
59 |
44 |
6 |
6 |
110 |
3 |
|
Illinois |
35 |
19 |
12 |
1 |
3 |
78 |
— |
|
Indiana |
25 |
12 |
12 |
1 |
— |
3 |
2 |
|
Michigan |
12 |
4 |
6 |
1 |
1 |
9 |
— |
|
Ohio |
24 |
13 |
7 |
2 |
2 |
16 |
— |
|
Wisconsin |
19 |
11 |
7 |
1 |
— |
4 |
1 |
|
W.N. Central |
63 |
15 |
15 |
3 |
30 |
35 |
4 |
|
Iowa |
14 |
6 |
6 |
1 |
1 |
8 |
3 |
|
Kansas |
5 |
— |
— |
— |
5 |
4 |
— |
|
Minnesota |
15 |
6 |
8 |
1 |
— |
2 |
1 |
|
Missouri |
15 |
— |
— |
— |
15 |
11 |
— |
|
Nebraska |
11 |
3 |
1 |
1 |
6 |
6 |
— |
|
North Dakota |
— |
— |
— |
— |
— |
4 |
— |
|
South Dakota |
3 |
— |
— |
— |
3 |
— |
— |
|
S. Atlantic |
135 |
42 |
23 |
4 |
66 |
46 |
2 |
|
Delaware |
1 |
— |
— |
— |
1 |
— |
— |
|
District of Columbia |
1 |
— |
— |
— |
1 |
2 |
— |
|
Florida |
51 |
— |
— |
— |
51 |
11 |
— |
|
Georgia |
14 |
10 |
1 |
2 |
1 |
5 |
— |
|
Maryland |
15 |
10 |
4 |
1 |
— |
2 |
— |
|
North Carolina |
15 |
10 |
4 |
— |
1 |
9 |
— |
|
South Carolina |
9 |
5 |
4 |
— |
— |
3 |
— |
|
Virginia |
18 |
3 |
8 |
— |
7 |
13 |
— |
|
West Virginia |
11 |
4 |
2 |
1 |
4 |
1 |
2 |
|
E.S. Central |
31 |
13 |
10 |
2 |
6 |
6 |
— |
|
Alabama |
11 |
4 |
5 |
— |
2 |
2 |
— |
|
Kentucky |
8 |
3 |
1 |
1 |
3 |
— |
— |
|
Mississippi |
3 |
1 |
1 |
1 |
— |
3 |
— |
|
Tennessee |
9 |
5 |
3 |
— |
1 |
1 |
— |
|
W.S. Central |
70 |
25 |
20 |
1 |
24 |
76 |
— |
|
Arkansas |
12 |
5 |
5 |
— |
2 |
4 |
— |
|
Louisiana |
16 |
— |
— |
— |
16 |
— |
— |
|
Oklahoma |
12 |
7 |
4 |
1 |
— |
4 |
— |
|
Texas |
30 |
13 |
11 |
— |
6 |
68 |
— |
|
Mountain |
55 |
32 |
17 |
— |
6 |
11 |
— |
|
Arizona |
16 |
7 |
5 |
— |
4 |
— |
— |
|
Colorado |
9 |
5 |
4 |
— |
— |
7 |
— |
|
Idaho |
7 |
6 |
1 |
— |
— |
2 |
— |
|
Montana |
4 |
— |
4 |
— |
— |
— |
— |
|
Nevada |
5 |
3 |
1 |
— |
1 |
— |
— |
|
New Mexico |
3 |
2 |
— |
— |
1 |
1 |
— |
|
Utah |
11 |
9 |
2 |
— |
— |
— |
— |
|
Wyoming |
— |
— |
— |
— |
— |
1 |
— |
|
Pacific |
169 |
33 |
18 |
1 |
117 |
53 |
— |
|
Alaska |
2 |
— |
— |
— |
2 |
1 |
— |
|
California |
110 |
— |
— |
— |
110 |
43 |
— |
|
Hawaii |
4 |
1 |
— |
1 |
2 |
3 |
— |
|
Oregon |
31 |
22 |
6 |
— |
3 |
4 |
— |
|
Washington |
22 |
10 |
12 |
— |
— |
2 |
— |
|
Territories |
|||||||
|
American Samoa |
— |
— |
— |
— |
— |
— |
— |
|
C.N.M.I. |
— |
— |
— |
— |
— |
— |
— |
|
Guam |
— |
— |
— |
— |
— |
3 |
— |
|
Puerto Rico |
— |
— |
— |
— |
— |
4 |
— |
|
U.S. Virgin Islands |
— |
— |
— |
— |
— |
— |
— |
|
N: Not reportable U: Unavailable — : No reported cases C.N.M.I.: Commonwealth of Northern Mariana Islands. * No cases of diphtheria; eastern equine encephalitis virus disease, nonneuroinvasive; poliomyelitis, paralytic; poliovirus infection, nonparalytic; rubella, congenital syndrome; severe acute respiratory syndrome-associated coronavirus (SARS-CoV) disease; smallpox; vancomycin-resistant Staphylococcus aureus; western equine encephalitis virus disease, neuroinvasive and nonneuroinvasive; yellow fever; and viral hemorrhagic fevers were reported in the United States during 2011. Data on hepatitis B virus, perinatal infection, and chronic hepatitis B and hepatitis C virus infection (past or present) are not included because they are undergoing data quality review. |
|||||||
|
TABLE 2. (Continued) Reported cases of notifiable diseases,* by geographic division and area — United States, 2011 |
||||||||
|
Area |
Pertussis |
Plague |
Psittacosis |
Q fever |
Rabies |
|||
|---|---|---|---|---|---|---|---|---|
|
Total |
Acute |
Chronic |
Animal |
Human |
||||
|
United States |
18,719 |
3 |
2 |
134 |
110 |
24 |
4,357 |
6 |
|
New England |
870 |
— |
— |
2 |
1 |
1 |
344 |
2 |
|
Connecticut |
68 |
— |
N |
— |
— |
— |
195 |
— |
|
Maine |
205 |
— |
— |
2 |
1 |
1 |
66 |
— |
|
Massachusetts |
271 |
— |
— |
— |
— |
— |
— |
2 |
|
New Hampshire |
170 |
— |
— |
— |
N |
N |
25 |
— |
|
Rhode Island |
62 |
— |
— |
— |
— |
— |
27 |
— |
|
Vermont |
94 |
— |
— |
— |
N |
N |
31 |
— |
|
Mid. Atlantic |
2,305 |
— |
1 |
14 |
11 |
3 |
835 |
2 |
|
New Jersey |
312 |
— |
— |
6 |
6 |
— |
— |
1 |
|
New York (Upstate) |
928 |
— |
— |
5 |
2 |
3 |
370 |
1 |
|
New York City |
323 |
— |
— |
1 |
1 |
— |
13 |
— |
|
Pennsylvania |
742 |
— |
1 |
2 |
2 |
— |
452 |
— |
|
E.N. Central |
4,526 |
— |
1 |
20 |
16 |
4 |
195 |
— |
|
Illinois |
1,509 |
— |
— |
4 |
4 |
— |
51 |
— |
|
Indiana |
367 |
— |
— |
1 |
1 |
— |
28 |
— |
|
Michigan |
691 |
— |
1 |
10 |
8 |
2 |
65 |
— |
|
Ohio |
767 |
— |
— |
1 |
1 |
— |
51 |
— |
|
Wisconsin |
1,192 |
— |
— |
4 |
2 |
2 |
N |
— |
|
W.N. Central |
1,636 |
— |
— |
5 |
3 |
2 |
197 |
— |
|
Iowa |
232 |
— |
— |
— |
N |
N |
25 |
— |
|
Kansas |
145 |
— |
— |
— |
— |
— |
31 |
— |
|
Minnesota |
658 |
— |
— |
1 |
1 |
— |
56 |
— |
|
Missouri |
438 |
— |
— |
1 |
— |
1 |
29 |
— |
|
Nebraska |
56 |
— |
— |
2 |
1 |
1 |
33 |
— |
|
North Dakota |
70 |
— |
— |
— |
— |
— |
23 |
— |
|
South Dakota |
37 |
— |
— |
1 |
1 |
— |
— |
— |
|
S. Atlantic |
1,506 |
— |
— |
18 |
15 |
3 |
1,147 |
1 |
|
Delaware |
29 |
— |
— |
— |
— |
— |
— |
— |
|
District of Columbia |
9 |
— |
— |
— |
N |
N |
— |
— |
|
Florida |
312 |
— |
— |
3 |
3 |
— |
120 |
— |
|
Georgia |
179 |
— |
— |
2 |
2 |
— |
— |
— |
|
Maryland |
123 |
— |
— |
2 |
2 |
— |
305 |
— |
|
North Carolina |
198 |
— |
— |
5 |
5 |
— |
— |
— |
|
South Carolina |
156 |
— |
— |
2 |
1 |
1 |
N |
1 |
|
Virginia |
399 |
— |
— |
3 |
1 |
2 |
618 |
— |
|
West Virginia |
101 |
— |
— |
1 |
1 |
— |
104 |
— |
|
E.S. Central |
481 |
— |
— |
2 |
— |
2 |
162 |
— |
|
Alabama |
143 |
— |
— |
1 |
— |
1 |
83 |
— |
|
Kentucky |
179 |
— |
— |
1 |
— |
1 |
16 |
— |
|
Mississippi |
49 |
— |
— |
— |
— |
— |
— |
— |
|
Tennessee |
110 |
— |
— |
— |
— |
— |
63 |
— |
|
W.S. Central |
1,140 |
— |
— |
27 |
24 |
3 |
1,144 |
— |
|
Arkansas |
80 |
— |
— |
5 |
5 |
— |
60 |
— |
|
Louisiana |
31 |
— |
— |
— |
— |
— |
6 |
— |
|
Oklahoma |
68 |
— |
— |
3 |
3 |
— |
60 |
— |
|
Texas |
961 |
— |
N |
19 |
16 |
3 |
1,018 |
— |
|
Mountain |
2,574 |
2 |
— |
21 |
18 |
3 |
75 |
— |
|
Arizona |
867 |
— |
— |
2 |
1 |
1 |
N |
— |
|
Colorado |
416 |
— |
— |
3 |
2 |
1 |
— |
— |
|
Idaho |
192 |
— |
— |
— |
— |
— |
6 |
— |
|
Montana |
134 |
— |
— |
15 |
14 |
1 |
N |
— |
|
Nevada |
34 |
— |
— |
— |
— |
— |
17 |
— |
|
New Mexico |
273 |
2 |
— |
— |
— |
— |
19 |
— |
|
Utah |
645 |
— |
— |
— |
— |
— |
7 |
— |
|
Wyoming |
13 |
— |
— |
1 |
1 |
— |
26 |
— |
|
Pacific |
3,681 |
1 |
— |
25 |
22 |
3 |
258 |
1 |
|
Alaska |
27 |
— |
— |
— |
— |
— |
14 |
— |
|
California |
2,319 |
— |
— |
16 |
16 |
— |
216 |
1 |
|
Hawaii |
59 |
— |
— |
— |
— |
— |
— |
— |
|
Oregon |
314 |
1 |
— |
1 |
— |
1 |
17 |
— |
|
Washington |
962 |
— |
— |
8 |
6 |
2 |
11 |
— |
|
Territories |
||||||||
|
American Samoa |
— |
— |
N |
— |
N |
N |
N |
N |
|
C.N.M.I. |
— |
— |
— |
— |
— |
— |
— |
— |
|
Guam |
7 |
— |
— |
— |
— |
N |
— |
— |
|
Puerto Rico |
8 |
— |
N |
— |
— |
— |
47 |
— |
|
U.S. Virgin Islands |
— |
— |
— |
— |
— |
— |
— |
— |
|
N: Not reportable U: Unavailable — : No reported cases C.N.M.I.: Commonwealth of Northern Mariana Islands. * No cases of diphtheria; eastern equine encephalitis virus disease, nonneuroinvasive; poliomyelitis, paralytic; poliovirus infection, nonparalytic; rubella, congenital syndrome; severe acute respiratory syndrome-associated coronavirus (SARS-CoV) disease; smallpox; vancomycin-resistant Staphylococcus aureus; western equine encephalitis virus disease, neuroinvasive and nonneuroinvasive; yellow fever; and viral hemorrhagic fevers were reported in the United States during 2011. Data on hepatitis B virus, perinatal infection, and chronic hepatitis B and hepatitis C virus infection (past or present) are not included because they are undergoing data quality review. |
||||||||
|
TABLE 2. (Continued) Reported cases of notifiable diseases,* by geographic division and area — United States, 2011 |
|||||||
|
Area |
Rubella |
Salmonellosis |
Shiga toxin-producing E. coli (STEC)† |
Shigellosis |
Spotted fever rickettsiosis§ |
||
|---|---|---|---|---|---|---|---|
|
Total |
Confirmed |
Probable |
|||||
|
United States |
4 |
51,887 |
6,047 |
13,352 |
2,802 |
234 |
2,562 |
|
New England |
1 |
2,106 |
212 |
271 |
10 |
2 |
8 |
|
Connecticut |
— |
466 |
57 |
41 |
— |
— |
— |
|
Maine |
— |
134 |
28 |
32 |
1 |
— |
1 |
|
Massachusetts |
1 |
1,049 |
80 |
179 |
4 |
— |
4 |
|
New Hampshire |
— |
178 |
22 |
4 |
3 |
2 |
1 |
|
Rhode Island |
— |
194 |
8 |
9 |
2 |
— |
2 |
|
Vermont |
— |
85 |
17 |
6 |
— |
— |
— |
|
Mid. Atlantic |
— |
5,649 |
663 |
1,430 |
179 |
4 |
175 |
|
New Jersey |
— |
1,222 |
143 |
481 |
136 |
2 |
134 |
|
New York (Upstate) |
— |
1,423 |
221 |
378 |
12 |
2 |
10 |
|
New York City |
— |
1,132 |
90 |
448 |
12 |
— |
12 |
|
Pennsylvania |
— |
1,872 |
209 |
123 |
19 |
— |
19 |
|
E.N. Central |
— |
5,119 |
1,023 |
925 |
120 |
8 |
106 |
|
Illinois |
— |
1,694 |
241 |
262 |
51 |
— |
51 |
|
Indiana |
— |
634 |
132 |
88 |
33 |
3 |
24 |
|
Michigan |
— |
854 |
152 |
190 |
4 |
— |
4 |
|
Ohio |
— |
1,187 |
183 |
314 |
21 |
3 |
18 |
|
Wisconsin |
— |
750 |
315 |
71 |
11 |
2 |
9 |
|
W.N. Central |
— |
3,001 |
1,021 |
381 |
301 |
21 |
280 |
|
Iowa |
— |
448 |
189 |
18 |
7 |
— |
7 |
|
Kansas |
— |
463 |
108 |
72 |
— |
— |
— |
|
Minnesota |
— |
717 |
285 |
87 |
11 |
— |
11 |
|
Missouri |
— |
900 |
282 |
182 |
270 |
13 |
257 |
|
Nebraska |
— |
252 |
103 |
14 |
10 |
5 |
5 |
|
North Dakota |
— |
59 |
13 |
2 |
2 |
2 |
— |
|
South Dakota |
— |
162 |
41 |
6 |
1 |
1 |
— |
|
S. Atlantic |
1 |
15,305 |
624 |
3,921 |
751 |
128 |
623 |
|
Delaware |
— |
175 |
16 |
6 |
20 |
— |
20 |
|
District of Columbia |
— |
92 |
6 |
35 |
4 |
1 |
3 |
|
Florida |
— |
5,923 |
103 |
2,635 |
12 |
3 |
9 |
|
Georgia |
— |
2,645 |
122 |
670 |
88 |
88 |
— |
|
Maryland |
— |
1,010 |
71 |
94 |
29 |
3 |
26 |
|
North Carolina |
1 |
2,519 |
155 |
225 |
327 |
16 |
311 |
|
South Carolina |
— |
1,567 |
18 |
142 |
36 |
12 |
24 |
|
Virginia |
— |
1,208 |
123 |
107 |
231 |
5 |
226 |
|
West Virginia |
— |
166 |
10 |
7 |
4 |
— |
4 |
|
E.S. Central |
— |
4,364 |
296 |
1,025 |
370 |
15 |
355 |
|
Alabama |
— |
1,266 |
74 |
322 |
79 |
5 |
74 |
|
Kentucky |
— |
606 |
75 |
252 |
4 |
3 |
1 |
|
Mississippi |
— |
1,438 |
37 |
241 |
24 |
1 |
23 |
|
Tennessee |
— |
1,054 |
110 |
210 |
263 |
6 |
257 |
|
W.S. Central |
— |
8,333 |
655 |
3,397 |
955 |
21 |
934 |
|
Arkansas |
— |
848 |
61 |
96 |
558 |
10 |
548 |
|
Louisiana |
— |
1,440 |
20 |
487 |
10 |
— |
10 |
|
Oklahoma |
— |
827 |
88 |
275 |
335 |
8 |
327 |
|
Texas |
— |
5,218 |
486 |
2,539 |
52 |
3 |
49 |
|
Mountain |
— |
2,599 |
706 |
880 |
103 |
32 |
71 |
|
Arizona |
— |
886 |
126 |
434 |
77 |
31 |
46 |
|
Colorado |
— |
522 |
169 |
89 |
3 |
— |
3 |
|
Idaho |
— |
143 |
117 |
17 |
2 |
— |
2 |
|
Montana |
— |
120 |
37 |
124 |
1 |
— |
1 |
|
Nevada |
— |
175 |
42 |
36 |
2 |
— |
2 |
|
New Mexico |
— |
341 |
43 |
123 |
— |
— |
— |
|
Utah |
— |
338 |
142 |
55 |
8 |
1 |
7 |
|
Wyoming |
— |
74 |
30 |
2 |
10 |
— |
10 |
|
Pacific |
2 |
5,411 |
847 |
1,122 |
13 |
3 |
10 |
|
Alaska |
— |
54 |
N |
5 |
N |
— |
— |
|
California |
— |
4,072 |
504 |
908 |
8 |
2 |
6 |
|
Hawaii |
— |
332 |
9 |
48 |
N |
N |
N |
|
Oregon |
— |
364 |
136 |
57 |
1 |
— |
1 |
|
Washington |
2 |
589 |
198 |
104 |
4 |
1 |
3 |
|
Territories |
|||||||
|
American Samoa |
— |
— |
— |
1 |
N |
— |
— |
|
C.N.M.I. |
— |
— |
— |
— |
— |
— |
— |
|
Guam |
2 |
19 |
— |
16 |
N |
— |
— |
|
Puerto Rico |
— |
468 |
— |
6 |
N |
— |
— |
|
U.S. Virgin Islands |
— |
6 |
— |
— |
N |
— |
— |
|
N: Not reportable U: Unavailable — : No reported cases C.N.M.I.: Commonwealth of Northern Mariana Islands. * No cases of diphtheria; eastern equine encephalitis virus disease, nonneuroinvasive; poliomyelitis, paralytic; poliovirus infection, nonparalytic; rubella, congenital syndrome; severe acute respiratory syndrome-associated coronavirus (SARS-CoV) disease; smallpox; vancomycin-resistant Staphylococcus aureus; western equine encephalitis virus disease, neuroinvasive and nonneuroinvasive; yellow fever; and viral hemorrhagic fevers were reported in the United States during 2011. Data on hepatitis B virus, perinatal infection, and chronic hepatitis B and hepatitis C virus infection (past or present) are not included because they are undergoing data quality review. † Includes Escherichia coli O157:H7; shiga toxin-positive, serogroup non-O157; and shiga toxin positive, not serogrouped. § Total case count includes six unknown case status reports. |
|||||||
|
TABLE 2. (Continued) Reported cases of notifiable diseases,* by geographic division and area — United States, 2011 |
||||||||
|---|---|---|---|---|---|---|---|---|
|
Area |
Streptococcal toxic-shock syndrome |
Streptococcus pneumoniae, invasive disease† |
Syphilis§ |
Tetanus |
Toxic-shock syndrome |
|||
|
All ages |
Age <5 years |
All stages¶ |
Congenital (age <2 yr) |
Primary and secondary |
||||
|
United States |
168 |
17,138 |
1,459 |
46,042 |
360 |
13,970 |
36 |
78 |
|
New England |
25 |
807 |
54 |
1,110 |
— |
416 |
1 |
3 |
|
Connecticut |
N |
354 |
14 |
189 |
— |
65 |
— |
N |
|
Maine |
12 |
136 |
4 |
24 |
— |
12 |
— |
— |
|
Massachusetts |
6 |
38 |
19 |
770 |
— |
266 |
— |
2 |
|
New Hampshire |
— |
110 |
5 |
33 |
— |
18 |
— |
1 |
|
Rhode Island |
— |
97 |
5 |
84 |
— |
46 |
1 |
— |
|
Vermont |
7 |
72 |
7 |
10 |
— |
9 |
— |
— |
|
Mid. Atlantic |
54 |
2,598 |
138 |
6,882 |
23 |
1,688 |
1 |
13 |
|
New Jersey |
23 |
680 |
43 |
971 |
5 |
232 |
— |
1 |
|
New York (Upstate) |
25 |
1,183 |
56 |
881 |
13 |
194 |
— |
4 |
|
New York City |
— |
735 |
39 |
3,905 |
— |
889 |
— |
— |
|
Pennsylvania |
6 |
N |
N |
1,125 |
5 |
373 |
1 |
8 |
|
E.N. Central |
37 |
3,283 |
262 |
4,812 |
37 |
1,845 |
8 |
16 |
|
Illinois |
— |
N |
76 |
2,426 |
18 |
881 |
1 |
5 |
|
Indiana |
13 |
819 |
40 |
468 |
— |
173 |
— |
2 |
|
Michigan |
6 |
694 |
36 |
762 |
6 |
286 |
4 |
5 |
|
Ohio |
18 |
1,278 |
83 |
954 |
13 |
440 |
1 |
— |
|
Wisconsin |
— |
492 |
27 |
202 |
— |
65 |
2 |
4 |
|
W.N. Central |
— |
835 |
112 |
982 |
1 |
330 |
4 |
10 |
|
Iowa |
— |
N |
N |
70 |
— |
20 |
— |
1 |
|
Kansas |
— |
N |
N |
76 |
— |
24 |
1 |
1 |
|
Minnesota |
— |
580 |
47 |
367 |
— |
139 |
1 |
3 |
|
Missouri |
— |
N |
35 |
414 |
1 |
136 |
2 |
2 |
|
Nebraska |
— |
121 |
12 |
36 |
— |
10 |
— |
3 |
|
North Dakota |
— |
91 |
4 |
5 |
— |
1 |
— |
— |
|
South Dakota |
— |
43 |
14 |
14 |
— |
— |
— |
— |
|
S. Atlantic |
30 |
4,009 |
376 |
10,619 |
72 |
3,448 |
6 |
14 |
|
Delaware |
1 |
52 |
— |
124 |
— |
27 |
— |
— |
|
District of Columbia |
— |
55 |
6 |
552 |
1 |
165 |
— |
— |
|
Florida |
N |
1,324 |
138 |
4,142 |
32 |
1,257 |
3 |
N |
|
Georgia |
— |
1,173 |
94 |
1,895 |
10 |
678 |
2 |
10 |
|
Maryland |
N |
587 |
51 |
1,278 |
24 |
452 |
— |
N |
|
North Carolina |
15 |
N |
N |
1,254 |
5 |
431 |
— |
1 |
|
South Carolina |
2 |
452 |
29 |
639 |
— |
221 |
1 |
3 |
|
Virginia |
7 |
N |
33 |
726 |
— |
213 |
— |
N |
|
West Virginia |
5 |
366 |
25 |
9 |
— |
4 |
— |
— |
|
E.S. Central |
5 |
1,408 |
121 |
2,866 |
26 |
826 |
3 |
4 |
|
Alabama |
N |
42 |
10 |
758 |
10 |
228 |
2 |
— |
|
Kentucky |
5 |
226 |
23 |
335 |
2 |
129 |
— |
2 |
|
Mississippi |
N |
148 |
14 |
748 |
6 |
191 |
1 |
N |
|
Tennessee |
— |
992 |
74 |
1,025 |
8 |
278 |
— |
2 |
|
W.S. Central |
— |
2,090 |
229 |
8,946 |
142 |
1,882 |
6 |
1 |
|
Arkansas |
— |
228 |
14 |
464 |
15 |
182 |
1 |
1 |
|
Louisiana |
— |
259 |
25 |
2,043 |
18 |
447 |
3 |
— |
|
Oklahoma |
N |
N |
37 |
270 |
2 |
84 |
— |
N |
|
Texas |
N |
1,603 |
153 |
6,169 |
107 |
1,169 |
2 |
N |
|
Mountain |
17 |
1,963 |
155 |
2,036 |
17 |
648 |
4 |
6 |
|
Arizona |
— |
767 |
55 |
906 |
14 |
274 |
2 |
2 |
|
Colorado |
— |
494 |
38 |
367 |
— |
133 |
— |
2 |
|
Idaho |
— |
N |
5 |
42 |
— |
13 |
1 |
— |
|
Montana |
N |
20 |
N |
9 |
— |
7 |
— |
N |
|
Nevada |
1 |
124 |
6 |
430 |
3 |
136 |
— |
1 |
|
New Mexico |
— |
329 |
24 |
212 |
— |
71 |
— |
— |
|
Utah |
16 |
206 |
27 |
64 |
— |
14 |
— |
1 |
|
Wyoming |
— |
23 |
— |
6 |
— |
— |
1 |
— |
|
Pacific |
— |
145 |
12 |
7,789 |
42 |
2,887 |
3 |
11 |
|
Alaska |
— |
138 |
10 |
11 |
— |
5 |
— |
N |
|
California |
N |
N |
N |
6,782 |
40 |
2,443 |
3 |
11 |
|
Hawaii |
— |
7 |
2 |
32 |
— |
14 |
— |
N |
|
Oregon |
N |
N |
N |
252 |
— |
97 |
— |
N |
|
Washington |
N |
N |
N |
712 |
2 |
328 |
— |
N |
|
Territories |
||||||||
|
American Samoa |
N |
N |
— |
— |
— |
— |
— |
N |
|
C.N.M.I. |
— |
— |
— |
— |
— |
— |
— |
— |
|
Guam |
— |
— |
— |
26 |
— |
5 |
— |
— |
|
Puerto Rico |
N |
— |
— |
671 |
2 |
254 |
1 |
N |
|
U.S. Virgin Islands |
— |
— |
— |
7 |
— |
— |
— |
— |
|
N: Not reportable U: Unavailable — : No reported cases C.N.M.I.: Commonwealth of Northern Mariana Islands. * No cases of diphtheria; eastern equine encephalitis virus disease, nonneuroinvasive; poliomyelitis, paralytic; poliovirus infection, nonparalytic; rubella, congenital syndrome; severe acute respiratory syndrome-associated coronavirus (SARS-CoV) disease; smallpox; vancomycin-resistant Staphylococcus aureus; western equine encephalitis virus disease, neuroinvasive and nonneuroinvasive; yellow fever; and viral hemorrhagic fevers were reported in the United States during 2011. Data on hepatitis B virus, perinatal infection, and chronic hepatitis B and hepatitis C virus infection (past or present) are not included because they are undergoing data quality review. † The previous categories of invasive pneumococcal disease among children aged <5 years and invasive, drug-resistant Streptococcus pneumoniae were eliminated. All cases of invasive S. pneumoniae disease, regardless of age or drug resistance are reported under a single disease code. § Includes the following categories: primary, secondary, latent (including early latent, late latent, and latent syphilis of unknown duration), neurosyphilis, late (including late syphilis with clinical manifestations other than neurosyphilis), and congenital syphilis. ¶ Totals reported to the Division of STD Prevention, NCHHSTP, as of June 7, 2012. |
||||||||
|
TABLE 2. (Continued) Reported cases of notifiable diseases,* by geographic division and area — United States, 2011 |
|||||
|---|---|---|---|---|---|
|
Area |
Trichinellosis |
Tuberculosis† |
Tularemia |
Typhoid fever |
Vancomycin-intermediate Staphylococcus aureus |
|
United States |
15 |
10,528 |
166 |
390 |
82 |
|
New England |
1 |
334 |
8 |
29 |
6 |
|
Connecticut |
— |
83 |
— |
5 |
1 |
|
Maine |
1 |
9 |
— |
— |
— |
|
Massachusetts |
— |
196 |
8 |
24 |
5 |
|
New Hampshire |
— |
11 |
— |
— |
N |
|
Rhode Island |
— |
27 |
— |
— |
— |
|
Vermont |
— |
8 |
— |
— |
— |
|
Mid. Atlantic |
2 |
1,501 |
4 |
93 |
35 |
|
New Jersey |
1 |
331 |
3 |
39 |
4 |
|
New York (Upstate) |
1 |
221 |
— |
15 |
23 |
|
New York City |
— |
689 |
— |
26 |
4 |
|
Pennsylvania |
— |
260 |
1 |
13 |
4 |
|
E.N. Central |
2 |
844 |
8 |
45 |
14 |
|
Illinois |
— |
359 |
5 |
28 |
3 |
|
Indiana |
1 |
100 |
1 |
4 |
N |
|
Michigan |
— |
170 |
— |
6 |
5 |
|
Ohio |
1 |
145 |
1 |
3 |
5 |
|
Wisconsin |
— |
70 |
1 |
4 |
1 |
|
W.N. Central |
2 |
356 |
49 |
15 |
3 |
|
Iowa |
— |
40 |
3 |
4 |
N |
|
Kansas |
— |
36 |
11 |
4 |
N |
|
Minnesota |
2 |
137 |
— |
3 |
2 |
|
Missouri |
— |
98 |
21 |
1 |
1 |
|
Nebraska |
— |
23 |
4 |
3 |
— |
|
North Dakota |
— |
7 |
2 |
— |
— |
|
South Dakota |
— |
15 |
8 |
— |
— |
|
S. Atlantic |
3 |
2,029 |
7 |
52 |
11 |
|
Delaware |
— |
21 |
1 |
— |
— |
|
District of Columbia |
— |
56 |
— |
— |
N |
|
Florida |
— |
754 |
— |
8 |
3 |
|
Georgia |
N |
347 |
— |
9 |
— |
|
Maryland |
— |
233 |
— |
17 |
2 |
|
North Carolina |
— |
244 |
— |
8 |
1 |
|
South Carolina |
— |
140 |
— |
1 |
3 |
|
Virginia |
2 |
221 |
6 |
9 |
2 |
|
West Virginia |
1 |
13 |
— |
— |
— |
|
E.S. Central |
— |
479 |
4 |
— |
1 |
|
Alabama |
— |
161 |
— |
— |
— |
|
Kentucky |
N |
71 |
1 |
— |
N |
|
Mississippi |
— |
91 |
— |
— |
1 |
|
Tennessee |
— |
156 |
3 |
— |
— |
|
W.S. Central |
3 |
1,671 |
52 |
31 |
9 |
|
Arkansas |
N |
85 |
37 |
2 |
— |
|
Louisiana |
1 |
167 |
— |
1 |
3 |
|
Oklahoma |
— |
94 |
15 |
2 |
— |
|
Texas |
2 |
1,325 |
— |
26 |
6 |
|
Mountain |
1 |
527 |
18 |
13 |
3 |
|
Arizona |
1 |
255 |
— |
3 |
2 |
|
Colorado |
— |
70 |
3 |
5 |
N |
|
Idaho |
— |
12 |
2 |
— |
N |
|
Montana |
— |
8 |
3 |
— |
N |
|
Nevada |
— |
95 |
1 |
4 |
— |
|
New Mexico |
— |
49 |
7 |
1 |
N |
|
Utah |
— |
34 |
1 |
— |
1 |
|
Wyoming |
— |
4 |
1 |
— |
— |
|
Pacific |
1 |
2,787 |
16 |
112 |
— |
|
Alaska |
— |
67 |
— |
— |
N |
|
California |
1 |
2,323 |
6 |
96 |
N |
|
Hawaii |
— |
123 |
— |
1 |
— |
|
Oregon |
— |
74 |
5 |
6 |
N |
|
Washington |
— |
200 |
5 |
9 |
N |
|
Territories |
|||||
|
American Samoa |
N |
3 |
— |
2 |
N |
|
C.N.M.I. |
— |
27 |
— |
— |
— |
|
Guam |
— |
78 |
— |
— |
— |
|
Puerto Rico |
N |
50 |
— |
— |
— |
|
U.S. Virgin Islands |
1 |
— |
— |
— |
— |
|
N: Not reportable U: Unavailable — : No reported cases C.N.M.I.: Commonwealth of Northern Mariana Islands. * No cases of diphtheria; eastern equine encephalitis virus disease, nonneuroinvasive; poliomyelitis, paralytic; poliovirus infection, nonparalytic; rubella, congenital syndrome; severe acute respiratory syndrome-associated coronavirus (SARS-CoV)disease; smallpox; vancomycin-resistant Staphylococcus aureus; western equine encephalitis virus disease, neuroinvasive and nonneuroinvasive; yellow fever; and viral hemorrhagic fevers were reported in the United States during 2011. Data on hepatitis B virus, perinatal infection, and chronic hepatitis B and hepatitis C virus infection (past or present) are not included because they are undergoing data quality review. † Totals reported to the Division of Tuberculosis Elimination, NCHHSTP, as of June 25, 2012. |
|||||
|
TABLE 2. (Continued) Reported cases of notifiable diseases,* by geographic division and area — United States, 2011 |
|||
|---|---|---|---|
|
Area |
Varicella |
Vibriosis |
|
|
Morbidity |
Mortality† |
||
|
United States |
14,513 |
5 |
832 |
|
New England |
1,360 |
— |
32 |
|
Connecticut |
304 |
— |
25 |
|
Maine |
226 |
— |
4 |
|
Massachusetts |
513 |
N |
— |
|
New Hampshire |
158 |
— |
1 |
|
Rhode Island |
42 |
— |
2 |
|
Vermont |
117 |
N |
— |
|
Mid. Atlantic |
1,567 |
— |
63 |
|
New Jersey |
466 |
— |
28 |
|
New York (Upstate) |
N |
N |
N |
|
New York City |
— |
— |
26 |
|
Pennsylvania |
1,101 |
— |
9 |
|
E.N. Central |
3,679 |
1 |
40 |
|
Illinois |
881 |
— |
16 |
|
Indiana |
293 |
— |
2 |
|
Michigan |
1,036 |
— |
9 |
|
Ohio |
1,047 |
1 |
7 |
|
Wisconsin |
422 |
— |
6 |
|
W.N. Central |
819 |
— |
14 |
|
Iowa |
N |
N |
N |
|
Kansas |
418 |
— |
N |
|
Minnesota |
1 |
— |
9 |
|
Missouri |
248 |
— |
3 |
|
Nebraska |
20 |
— |
— |
|
North Dakota |
65 |
— |
2 |
|
South Dakota |
67 |
N |
N |
|
S. Atlantic |
1,905 |
— |
286 |
|
Delaware |
11 |
— |
6 |
|
District of Columbia |
12 |
— |
1 |
|
Florida |
861 |
— |
155 |
|
Georgia |
33 |
— |
33 |
|
Maryland |
N |
— |
35 |
|
North Carolina |
N |
N |
15 |
|
South Carolina |
13 |
— |
11 |
|
Virginia |
549 |
N |
30 |
|
West Virginia |
426 |
— |
N |
|
E.S. Central |
294 |
— |
35 |
|
Alabama |
279 |
N |
8 |
|
Kentucky |
N |
N |
2 |
|
Mississippi |
15 |
N |
13 |
|
Tennessee |
N |
— |
12 |
|
W.S. Central |
3,005 |
1 |
135 |
|
Arkansas |
347 |
— |
N |
|
Louisiana |
100 |
N |
54 |
|
Oklahoma |
N |
N |
2 |
|
Texas |
2,558 |
1 |
79 |
|
Mountain |
1,737 |
2 |
42 |
|
Arizona |
660 |
1 |
26 |
|
Colorado |
447 |
N |
6 |
|
Idaho |
N |
N |
N |
|
Montana |
163 |
— |
N |
|
Nevada |
N |
N |
6 |
|
New Mexico |
65 |
1 |
2 |
|
Utah |
389 |
— |
1 |
|
Wyoming |
13 |
N |
1 |
|
Pacific |
147 |
1 |
185 |
|
Alaska |
64 |
N |
— |
|
California |
39 |
— |
100 |
|
Hawaii |
44 |
— |
33 |
|
Oregon |
N |
N |
7 |
|
Washington |
N |
1 |
45 |
|
Territories |
|||
|
American Samoa |
N |
N |
N |
|
C.N.M.I. |
— |
— |
— |
|
Guam |
102 |
N |
1 |
|
Puerto Rico |
444 |
— |
N |
|
U.S. Virgin Islands |
1 |
— |
— |
|
N: Not reportable U: Unavailable — : No reported cases C.N.M.I.: Commonwealth of Northern Mariana Islands. * No cases of diphtheria; eastern equine encephalitis virus disease, nonneuroinvasive; poliomyelitis, paralytic; poliovirus infection, nonparalytic; rubella, congenital syndrome; severe acute respiratory syndrome-associated coronavirus (SARS-CoV) disease; smallpox; vancomycin-resistant Staphylococcus aureus; western equine encephalitis virus disease, neuroinvasive and nonneuroinvasive; yellow fever; and viral hemorrhagic fevers were reported in the United States during 2011. Data on hepatitis B virus, perinatal infection, and chronic hepatitis B and hepatitis C virus infection (past or present) are not included because they are undergoing data quality review. † Totals reported to the Division of Viral Diseases, National Center for Immunization and Respiratory Diseases (NCIRD), as of June 30, 2012. |
|||
|
TABLE 3. (Continued) Reported cases and incidence* of notifiable diseases,† by age group — United States, 2011 |
||||||||||||||||
|---|---|---|---|---|---|---|---|---|---|---|---|---|---|---|---|---|
|
Disease |
<1 yr |
1–4 yrs |
5–14 yrs |
15–24 yrs |
25–39 yrs |
40–64 yrs |
>65 yrs |
Age not stated |
Total |
|||||||
|
No. |
Rate |
No. |
Rate |
No. |
Rate |
No. |
Rate |
No. |
Rate |
No. |
Rate |
No. |
Rate |
|||
|
Meningococcal disease, invasive, all serogroups |
70 |
(1.69) |
69 |
(0.40) |
43 |
(0.11) |
142 |
(0.33) |
107 |
(0.17) |
169 |
(0.17) |
153 |
(0.38) |
6 |
759 |
|
serogroup A, C, Y,and W-135 |
14 |
(0.34) |
14 |
(0.08) |
12 |
(0.03) |
45 |
(0.10) |
27 |
(0.04) |
66 |
(0.07) |
77 |
(0.19) |
2 |
257 |
|
serogroup B |
32 |
(0.77) |
28 |
(0.16) |
14 |
(0.03) |
37 |
(0.09) |
22 |
(0.04) |
19 |
(0.02) |
5 |
(0.01) |
2 |
159 |
|
other serogroup |
1 |
(0.02) |
3 |
(0.02) |
1 |
(0.00) |
4 |
(0.01) |
1 |
(0.00) |
3 |
(0.00) |
6 |
(0.01) |
1 |
20 |
|
serogroup unknown |
23 |
(0.55) |
24 |
(0.14) |
16 |
(0.04) |
56 |
(0.13) |
57 |
(0.09) |
81 |
(0.08) |
65 |
(0.16) |
1 |
323 |
|
Mumps |
3 |
(0.07) |
41 |
(0.24) |
69 |
(0.17) |
123 |
(0.28) |
67 |
(0.11) |
82 |
(0.08) |
18 |
(0.04) |
1 |
404 |
|
Novel influenza A virus infection |
— |
(0.00) |
7 |
(0.04) |
5 |
(0.01) |
— |
(0.00) |
— |
(0.00) |
2 |
(0.00) |
— |
(0.00) |
— |
14 |
|
Pertussis |
2,772 |
(66.85) |
2,642 |
(15.44) |
7,176 |
(17.62) |
1,502 |
(3.47) |
1,602 |
(2.58) |
2,292 |
(2.26) |
559 |
(1.38) |
174 |
18,719 |
|
Plague |
— |
(0.00) |
— |
(0.00) |
— |
(0.00) |
— |
(0.00) |
1 |
(0.00) |
1 |
(0.00) |
1 |
(0.00) |
— |
3 |
|
Psittacosis |
— |
(0.00) |
— |
(0.00) |
— |
(0.00) |
— |
(0.00) |
1 |
(0.00) |
1 |
(0.00) |
— |
(0.00) |
— |
2 |
|
Q fever, total |
— |
(0.00) |
1 |
(0.01) |
4 |
(0.01) |
2 |
(0.00) |
26 |
(0.04) |
74 |
(0.07) |
26 |
(0.06) |
1 |
134 |
|
Acute |
— |
(0.00) |
1 |
(0.01) |
4 |
(0.01) |
2 |
(0.00) |
18 |
(0.03) |
64 |
(0.06) |
20 |
(0.05) |
1 |
110 |
|
Chronic |
— |
(0.00) |
— |
(0.00) |
— |
(0.00) |
— |
(0.00) |
8 |
(0.01) |
10 |
(0.01) |
6 |
(0.02) |
— |
24 |
|
Rabies, human |
— |
(0.00) |
— |
(0.00) |
1 |
(0.00) |
— |
(0.00) |
— |
(0.00) |
1 |
(0.00) |
1 |
(0.00) |
3 |
6 |
|
Rubella |
— |
(0.00) |
— |
(0.00) |
— |
(0.00) |
1 |
(0.00) |
2 |
(0.00) |
— |
(0.00) |
— |
(0.00) |
1 |
4 |
|
Salmonellosis |
5,524 |
(133.21) |
8,886 |
(51.92) |
6,770 |
(16.62) |
4,756 |
(10.98) |
6,561 |
(10.59) |
11,755 |
(11.61) |
6,905 |
(17.03) |
730 |
51,887 |
|
Shiga toxin-producing E. coli (STEC) |
220 |
(5.32) |
1,549 |
(9.07) |
1,114 |
(2.74) |
986 |
(2.28) |
691 |
(1.12) |
863 |
(0.85) |
511 |
(1.26) |
113 |
6,047 |
|
Shigellosis |
248 |
(5.98) |
4,105 |
(23.98) |
4,204 |
(10.32) |
930 |
(2.15) |
1,698 |
(2.74) |
1,583 |
(1.56) |
430 |
(1.06) |
154 |
13,352 |
|
Spotted fever rickettsiosis, total |
5 |
(0.12) |
48 |
(0.28) |
182 |
(0.45) |
244 |
(0.57) |
476 |
(0.77) |
1,223 |
(1.22) |
612 |
(1.52) |
12 |
2,802 |
|
confirmed |
1 |
(0.02) |
13 |
(0.08) |
26 |
(0.06) |
14 |
(0.03) |
37 |
(0.06) |
100 |
(0.10) |
43 |
(0.11) |
— |
234 |
|
probable |
4 |
(0.10) |
35 |
(0.21) |
156 |
(0.38) |
230 |
(0.53) |
438 |
(0.71) |
1,118 |
(1.11) |
569 |
(1.41) |
12 |
2,562 |
|
Streptococcal toxic-shock syndrome |
1 |
(0.04) |
3 |
(0.03) |
8 |
(0.03) |
4 |
(0.01) |
27 |
(0.07) |
68 |
(0.10) |
54 |
(0.21) |
3 |
168 |
|
Streptococcus pneumoniae, invasive disaease |
||||||||||||||||
|
all ages |
368 |
(13.70) |
909 |
(8.20) |
525 |
(1.98) |
416 |
(1.49) |
1,392 |
(3.48) |
7,046 |
(10.67) |
6,385 |
(23.91) |
97 |
17,138 |
|
age <5 years |
419 |
(13.47) |
1,040 |
(8.11) |
— |
(0.00) |
— |
(0.00) |
— |
(0.00) |
— |
(0.00) |
— |
(0.00) |
— |
1,459 |
|
Syphilis, total, all stages**,¶¶ |
— |
(0.00) |
— |
(0.00) |
— |
(0.00) |
10,441 |
(24.11) |
18,152 |
(29.29) |
15,859 |
(15.67) |
1,142 |
(2.82) |
12 |
46,042 |
|
congenital (age <1 yr)** |
— |
(0.00) |
— |
(0.00) |
— |
(0.00) |
— |
(0.00) |
— |
(0.00) |
— |
(0.00) |
— |
(0.00) |
— |
360 |
|
primary and secondary** |
— |
(0.00) |
— |
(0.00) |
— |
(0.00) |
3,851 |
(8.89) |
5,774 |
(9.32) |
4,180 |
(4.13) |
138 |
(0.34) |
2 |
13,970 |
|
Tetanus |
1 |
(0.02) |
— |
(0.00) |
— |
(0.00) |
2 |
(0.00) |
6 |
(0.01) |
6 |
(0.01) |
12 |
(0.03) |
9 |
36 |
|
Toxic-shock syndrome (other than streptococcal) |
— |
(0.00) |
2 |
(0.02) |
18 |
(0.06) |
34 |
(0.11) |
8 |
(0.02) |
11 |
(0.01) |
4 |
(0.01) |
1 |
78 |
|
Trichinellosis |
— |
(0.00) |
1 |
(0.01) |
4 |
(0.01) |
1 |
(0.00) |
2 |
(0.00) |
6 |
(0.01) |
1 |
(0.00) |
— |
15 |
|
Tuberculosis*** |
72 |
(1.74) |
278 |
(1.62) |
227 |
(0.56) |
1,033 |
(2.38) |
2,548 |
(4.11) |
4,118 |
(4.07) |
2,247 |
(5.56) |
5 |
10,528 |
|
Tularemia |
— |
(0.00) |
12 |
(0.07) |
27 |
(0.07) |
7 |
(0.02) |
26 |
(0.04) |
63 |
(0.06) |
22 |
(0.05) |
9 |
166 |
|
Typhoid fever |
3 |
(0.07) |
54 |
(0.32) |
90 |
(0.22) |
52 |
(0.12) |
112 |
(0.18) |
53 |
(0.05) |
13 |
(0.03) |
13 |
390 |
|
Vancomycin-intermediate Staphylococcus aureus (VISA) infection |
— |
(0.00) |
1 |
(0.01) |
— |
(0.00) |
1 |
(0.00) |
5 |
(0.01) |
36 |
(0.05) |
33 |
(0.11) |
6 |
82 |
|
Vibriosis |
1 |
(0.03) |
36 |
(0.23) |
70 |
(0.19) |
61 |
(0.15) |
137 |
(0.24) |
281 |
(0.30) |
146 |
(0.40) |
100 |
832 |
|
* Per 100,000 population. † No cases of diphtheria; eastern equine encephalitis virus disease, nonneuroinvasive; poliomyelitis, paralytic; poliovirus infection, nonparalytic; rubella, congenital syndrome; severe acute respiratory syndrome-associated coronavirus (SARS-CoV) disease; smallpox; vancomycin resistant staphylococcus aureus; western equine encephalitis virus disease, neuroinvasive and nonneuroinvasive; yellow fever; and viral hemorrhagic fevers were reported in the United States during 2011. Data on hepatitis B virus, perinatal infection, and chronic hepatitis B and hepatitis C virus infection (past or present) are not included because they are undergoing data quality review. § Totals reported to the Division of Vector-Borne Diseases (DVBD), National Center for Emerging and Zoonotic Infectious Diseases (NCEZID) (ArboNET Surveillance), as of April 17, 2012. ¶ Notifiable in <25 states. ** Cases among persons aged <15 years are not shown because some might not be caused by sexual transmission; these cases are included in the totals. Totals reported to the Division of STD Prevention, NCHHSTP, as of June 7, 2012. †† Total number of HIV diagnoses case counts was reported to the Division of HIV/AIDS Prevention, National Center for HIV/AIDS, Viral Hepatitis, STD, and TB Prevention (NCHHSTP) through December 31, 2011. §§ Totals reported to the Division of Influenza, National Center for Immunization and Respiratory Diseases (NCIRD), as of December 31, 2011. ¶¶ Includes the following categories: primary, secondary, latent (including early latent, late latent, and latent syphilis of unknown duration), neurosyphilis, late (including late syphilis with clinical manifestations other than neurosyphilis), and congenital syphilis. *** Totals reported to the Division of Tuberculosis Elimination, NCHHSTP, as of June 25, 2012. |
||||||||||||||||
|
TABLE 4. (Continued) Reported cases and incidence* of notifiable diseases,† by sex — United States, 2011 |
||||||
|---|---|---|---|---|---|---|
|
Disease |
Male |
Female |
Sex not stated |
Total |
||
|
No. |
Rate |
No. |
Rate |
|||
|
Meningococcal disease, invasive, all serogroup |
383 |
(0.25) |
374 |
(0.24) |
2 |
759 |
|
serogroup A, C, Y, and W-135 |
119 |
(0.08) |
138 |
(0.09) |
— |
257 |
|
serogroup B |
85 |
(0.06) |
73 |
(0.05) |
1 |
159 |
|
serogroup other |
10 |
(0.01) |
10 |
(0.01) |
— |
20 |
|
serogroup unknown |
169 |
(0.11) |
153 |
(0.10) |
1 |
323 |
|
Mumps |
236 |
(0.15) |
168 |
(0.11) |
— |
404 |
|
Novel influenza A virus infection |
8 |
(0.01) |
6 |
(0.00) |
— |
14 |
|
Pertussis |
8,302 |
(5.44) |
10,308 |
(6.59) |
109 |
18,719 |
|
Plague |
3 |
(0.00) |
— |
(0.00) |
— |
3 |
|
Psittacosis |
— |
(0.00) |
2 |
(0.00) |
— |
2 |
|
Q fever, total |
99 |
(0.06) |
34 |
(0.02) |
1 |
134 |
|
acute |
79 |
(0.05) |
30 |
(0.02) |
1 |
110 |
|
chronic |
20 |
(0.01) |
4 |
(0.00) |
— |
24 |
|
Rabies, human |
3 |
(0.00) |
3 |
(0.00) |
— |
6 |
|
Rubella |
3 |
(0.00) |
1 |
(0.00) |
— |
4 |
|
Salmonellosis |
24,774 |
(16.22) |
26,749 |
(17.11) |
364 |
51,887 |
|
Shiga toxin-producing E. coli (STEC) |
2,671 |
(1.75) |
3,324 |
(2.13) |
52 |
6,047 |
|
Shigellosis |
6,620 |
(4.33) |
6,689 |
(4.28) |
43 |
13,352 |
|
Spotted fever rickettsiosis, total |
1,751 |
(1.15) |
1,033 |
(0.66) |
18 |
2,802 |
|
confirmed |
141 |
(0.09) |
91 |
(0.06) |
2 |
234 |
|
probable |
1,604 |
(1.05) |
942 |
(0.61) |
16 |
2,562 |
|
Streptococcal toxic-shock syndrome |
82 |
(0.09) |
86 |
(0.09) |
— |
168 |
|
Streptococcus pneumoniae, invasive disease |
||||||
|
all ages |
8,685 |
(8.76) |
8,377 |
(8.22) |
76 |
17,138 |
|
age <5 yrs |
634 |
(7.79) |
500 |
(6.42) |
325 |
1,459 |
|
Syphilis, total, all stages**,¶¶ |
36,265 |
(23.75) |
9,712 |
(6.21) |
65 |
46,042 |
|
congenital (age <1 yr)** |
199 |
(9.39) |
150 |
(7.40) |
11 |
360 |
|
primary and secondary** |
12,453 |
(8.15) |
1,501 |
(0.96) |
16 |
13,970 |
|
Tetanus |
23 |
(0.02) |
13 |
(0.01) |
— |
36 |
|
Toxic-shock syndrome (other than streptococcal) |
15 |
(0.01) |
63 |
(0.05) |
— |
78 |
|
Trichinellosis |
11 |
(0.01) |
4 |
(0.00) |
— |
15 |
|
Tuberculosis*** |
6,413 |
(4.20) |
4,112 |
(2.63) |
3 |
10,528 |
|
Tularemia |
101 |
(0.07) |
61 |
(0.04) |
4 |
166 |
|
Typhoid fever |
213 |
(0.14) |
176 |
(0.11) |
1 |
390 |
|
Vancomycin, intermediate Staphlococcus aureus (VISA) infection |
53 |
(0.05) |
28 |
(0.02) |
1 |
82 |
|
Vibriosis |
569 |
(0.41) |
256 |
(0.18) |
7 |
832 |
|
* Per 100,000 population. † No cases of diphtheria; eastern equine encephalitis virus disease, nonneuroinvasive; poliomyelitis, paralytic; poliovirus infection, nonparalytic; rubella, congenital syndrome; severe acute respiratory syndrome-associated coronavirus (SARS-CoV) disease; smallpox; vancomycin resistant staphylococcus aureus; western equine encephalitis virus disease, neuroinvasive and nonneuroinvasive; yellow fever; and viral hemorrhagic fevers were reported in the United States during 2011. Data on hepatitis B virus, perinatal infection, and chronic hepatitis B and hepatitis C virus infection (past or present) are not included because they are undergoing data quality review. § Totals reported to the Division of Vector-Borne Diseases (DVBD), National Center for Emerging and Zoonotic Infectious Diseases (NCEZID) (ArboNET Surveillance), as of April 17, 2012. ¶ Notifiable in <25 states. ** Cases among persons aged <15 years are not shown because some might not be caused by sexual transmission; these cases are included in the totals. Totals reported to the Division of STD Prevention, National Center for HIV/AIDS, Viral Hepatitis, STD, and TB Prevention (NCHHSTP), as of June 7, 2012. †† Total number of HIV cases was reported to the Division of HIV/AIDS Prevention, National Center for HIV/AIDS, Viral Hepatitis, STD, and TB Prevention (NCHHSTP) through December 31, 2011. §§ Totals reported to the Division of Influenza, National Center for Immunization and Respiratory Diseases (NCIRD), as of December 31, 2011. ¶¶ Includes the following categories: primary, secondary, latent (including early latent, late latent, and latent syphilis of unknown duration), neurosyphilis, late (including late syphilis with clinical manifestations other than neurosyphilis), and congenital syphilis. *** Totals reported to the Division of Tuberculosis Elimination, NCHHSTP, as of June 25, 2012. |
||||||
|
TABLE 5. (Continued) Reported cases and incidence* of notifiable diseases,† by race — United States, 2011 |
|||||||||||
|---|---|---|---|---|---|---|---|---|---|---|---|
|
Disease |
American Indian or Alaska Native |
Asian or Pacific Islander |
Black |
White |
Other |
Race not stated |
Total |
||||
|
No. |
Rate |
No. |
Rate |
No. |
Rate |
No. |
Rate |
||||
|
Salmonellosis |
322 |
(9.02) |
1,266 |
(7.97) |
4,500 |
(10.85) |
30,579 |
(12.32) |
1,259 |
13,961 |
51,887 |
|
Shiga toxin-producing E. coli (STEC) |
33 |
(0.96) |
89 |
(0.56) |
260 |
(0.63) |
3,834 |
(1.55) |
141 |
1,690 |
6,047 |
|
Shigellosis |
164 |
(4.60) |
189 |
(1.19) |
2,610 |
(6.29) |
7,018 |
(2.83) |
506 |
2,865 |
13,352 |
|
Spotted fever rickettsiosis, total |
146 |
(4.24) |
15 |
(0.10) |
89 |
(0.21) |
1,697 |
(0.69) |
40 |
815 |
2,802 |
|
confirmed |
29 |
(0.81) |
1 |
(0.01) |
12 |
(0.03) |
144 |
(0.06) |
6 |
42 |
234 |
|
probable |
117 |
(3.29) |
14 |
(0.09) |
77 |
(0.19) |
1,550 |
(0.63) |
34 |
770 |
2,562 |
|
Streptococcal toxic-shock syndrome |
0 |
(0.00) |
2 |
(0.03) |
19 |
(0.07) |
129 |
(0.08) |
0 |
18 |
168 |
|
Streptococcus pneumoniae, invasive disease |
|||||||||||
|
all ages |
186 |
(8.76) |
140 |
(1.75) |
2,681 |
(8.95) |
9,922 |
(6.16) |
194 |
4,015 |
17,138 |
|
age <5 yr |
18 |
(7.00) |
28 |
(3.80) |
244 |
(8.29) |
559 |
(4.66) |
33 |
577 |
1,459 |
|
Syphilis, all stages**,¶¶ |
266 |
(7.45) |
1,005 |
(6.33) |
20,605 |
(49.67) |
18,799 |
(7.58) |
2,627 |
2,740 |
46,042 |
|
congenital (age <1 yr)** |
2 |
(2.75) |
15 |
(6.52) |
209 |
(30.08) |
118 |
(3.75) |
12 |
4 |
360 |
|
primary and secondary** |
80 |
(2.24) |
267 |
(1.68) |
6,177 |
(14.89) |
6,281 |
(2.53) |
618 |
547 |
13,970 |
|
Tetanus |
0 |
(0.00) |
0 |
(0.00) |
5 |
(0.01) |
29 |
(0.01) |
1 |
1 |
36 |
|
Toxic-shock syndrome (other than streptococcal) |
0 |
(0.00) |
4 |
(0.03) |
4 |
(0.01) |
51 |
(0.03) |
2 |
17 |
78 |
|
Tuberculosis*** |
150 |
(4.20) |
3,165 |
(19.93) |
2,478 |
(5.97) |
4,515 |
(1.82) |
126 |
94 |
10,528 |
|
Tularemia |
13 |
(0.36) |
4 |
(0.03) |
4 |
(0.01) |
105 |
(0.04) |
2 |
38 |
166 |
|
Typhoid fever |
2 |
(0.06) |
207 |
(1.30) |
17 |
(0.04) |
36 |
(0.01) |
31 |
97 |
390 |
|
Vancomycin-intermediate Staphylococcus aureus (VISA) |
0 |
(0.00) |
0 |
(0.00) |
19 |
(0.05) |
34 |
(0.02) |
2 |
27 |
82 |
|
Vibriosis |
5 |
(0.15) |
34 |
(0.22) |
58 |
(0.15) |
538 |
(0.24) |
15 |
182 |
832 |
|
* Per 100,000 population. Diseases for which <25 cases were reported are not included in this table. † No cases of diphtheria; eastern equine encephalitis virus disease, nonneuroinvasive; poliomyelitis, paralytic; poliovirus infection, nonparalytic; rubella, congenital syndrome; severe acute respiratory syndrome-associated coronavirus (SARS-CoV) disease; smallpox; vancomycin resistant staphylococcus aureus; western equine encephalitis virus disease, neuroinvasive and nonneuroinvasive; yellow fever; and viral hemorrhagic fevers were reported in the United States during 2011. Data on hepatitis B virus, perinatal infection, and chronic hepatitis B and hepatitis C virus infection (past or present) are not included because they are undergoing data quality review. § Totals reported to the Division of Vector-Borne Diseases (DVBD), National Center for Emerging and Zoonotic Infectious Diseases (NCEZID) (ArboNET Surveillance), as of June 1, 2012. ¶ Notifiable in <25 states. ** Cases with unknown race have not been redistributed. For this reason, the total number of cases reported here might differ slightly from totals reported in other surveillance summaries. †† Total number of HIV cases reported to the Division of HIV/AIDS Prevention, National Center for HIV/AIDS, Viral Hepatitis, STD, and TB Prevention (NCHHSTP) through December 31, 2011. §§ Totals reported to the Division of Influenza, National Center for Immunization and Respiratory Diseases (NCIRD), as of December 31, 2011. ¶¶ Includes the following categories: primary, secondary, latent (including early latent, late latent, and latent syphilis of unknown duration), neurosyphilis, late (including late syphilis with clinical manifestations other than neurosyphilis), and congenital syphilis. *** Totals reported to the Division of Tuberculosis Elimination, NCHHSTP, as of June 25, 2012. |
|||||||||||
|
TABLE 6. (Continued) Reported cases and incidence* of notifiable diseases,† by ethnicity — United States, 2011 |
||||||
|---|---|---|---|---|---|---|
|
Disease |
Hispanic |
Non-Hispanic |
Ethnicity not stated |
Total |
||
|
No. |
Rate |
No. |
Rate |
|||
|
Streptococcal toxic-shock syndrome |
5 |
(0.03) |
108 |
(0.06) |
55 |
168 |
|
Streptococcus pneumoniae, invasive disease, all ages |
1,108 |
(3.77) |
8,788 |
(5.12) |
7,242 |
17,138 |
|
age <5 yrs |
177 |
(4.09) |
564 |
(3.83) |
718 |
1,459 |
|
Syphilis, total, all stages**,¶¶ |
9,848 |
(19.88) |
32,788 |
(12.63) |
3,406 |
46,042 |
|
congenital (age <1 yr)** |
79 |
(7.36) |
268 |
(8.72) |
13 |
360 |
|
primary and secondary** |
2,331 |
(4.70) |
10,935 |
(4.21) |
704 |
13,970 |
|
Tetanus |
2 |
(0.00) |
24 |
(0.01) |
10 |
36 |
|
Toxic-shock syndrome (other than streptococcal) |
4 |
(0.01) |
45 |
(0.02) |
29 |
78 |
|
Tuberculosis*** |
3,008 |
(6.07) |
7,500 |
(2.89) |
20 |
10,528 |
|
Tularemia |
3 |
(0.01) |
108 |
(0.04) |
55 |
166 |
|
Typhoid fever |
37 |
(0.07) |
264 |
(0.10) |
89 |
390 |
|
Vancomycin-intermediate Staphylococcus aureus (VISA) |
5 |
(0.02) |
31 |
(0.02) |
46 |
82 |
|
Vibriosis |
96 |
(0.20) |
507 |
(0.21) |
229 |
832 |
|
* Per 100,000 population. Diseases for which <25 cases were reported are not included in this table. † No cases of diphtheria; eastern equine encephalitis virus disease, nonneuroinvasive; poliomyelitis, paralytic; poliovirus infection, nonparalytic; rubella, congenital syndrome; severe acute respiratory syndrome-associated coronavirus (SARS-CoV) disease; smallpox; vancomycin resistant Staphylococcus aureus; western equine encephalitis virus disease, neuroinvasive and nonneuroinvasive; yellow fever; and viral hemorrhagic fevers were reported in the United States during 2011. Data on Hepatitis B virus, perinatal infection, and chronic hepatitis B and hepatitis C virus infection (past or present) are not included because they are undergoing data quality review. § Totals reported to the Division of Vector-Borne Diseases (DVBD), National Center for Emerging and Zoonotic Infectious Diseases (NCEZID) (ArboNET Surveillance), as of June 1, 2012. ¶ Notifiable in <25 states. ** Cases with unknown race have not been redistributed. For this reason, the total number of cases reported here might differ slightly from totals reported in other surveillance summaries. †† Total number of HIV diagnoses case counts was reported to the Division of HIV/AIDS Prevention, National Center for HIV/AIDS, Viral Hepatitis, STD, and TB Prevention (NCHHSTP) through December 31, 2011. §§ Totals reported to the Division of Influenza, National Center for Immunization and Respiratory Diseases (NCIRD), as of December 31, 2011. ¶¶ Includes the following categories: primary, secondary, latent (including early latent, late latent, and latent syphilis of unknown duration), neurosyphilis, late (including late syphilis with clinical manifestations other than neurosyphilis), and congenital syphilis. *** Totals reported to the Division of Tuberculosis Elimination, NCHHSTP, as of June 25, 2012. |
||||||
PART 2
Graphs and Maps for Selected Notifiable Diseases in the United States, 2011
Abbreviations and Symbols Used in Graphs and Maps
U Data not available.
N Not reportable (i.e., report of disease not required in that jurisdiction).
DC District of Columbia
NYC New York City
AS American Samoa
CNMI Commonwealth of Northern Mariana Islands
GU Guam
PR Puerto Rico
VI U.S. Virgin Islands
Anthrax. Number of reported cases, by year — United States, 1956–2011
* One epizootic-associated cutaneous case was reported in 2001 from Texas.
The confirmed case of inhalation anthrax that was reported in the United States in 2011 is considered to be an isolated naturally occurring case, with no other related human or animal cases detected. The occurrence of naturally occurring human anthrax cases has remained stable during the past 30 years with no more than two cases reported per year.
Alternate Text: This figure is a line graph that presents the number of anthrax cases by year in the United States from 1956 to 2011.
ARBOVIRAL DISEASES. Number* of reported cases of neuroinvasive disease, by year — United States, 2002–2011
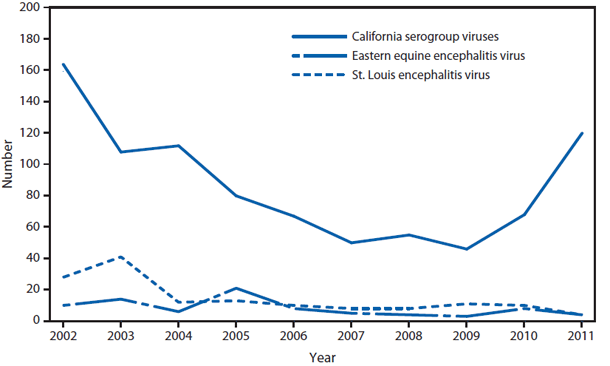
* Data from the Division of Vector-Borne Diseases, National Center for Emerging and Zoonotic Infectious Diseases (ArboNET Surveillance). Only reported cases of neuroinvasive disease are shown.
The most common arthropod-borne viruses (arboviruses) that cause neuroinvasive disease in humans in the United States are West Nile virus (WNV), La Crosse virus (LACV), St. Louis encephalitis virus (SLEV), and eastern equine encephalitis virus (EEEV). LACV is the most common California serogroup virus in the United States. LACV causes neuroinvasive disease primarily among children. In 2011, a total of 120 cases of California serogroup viruses neuroinvasive disease, including 116 cases caused by LACV, were reported from 16 states (Alabama, Arizona, Florida, Georgia, Illinois, Indiana, Kentucky, Michigan, Minnesota, Mississippi, North Carolina, Ohio, South Carolina, Tennessee, Wisconsin, and West Virginia); 114 (95%) of the cases occurred among children aged <18 years. During 2002–2011, a median of 71 (range: 46–167) cases per year were reported in the United States. EEEV disease in humans is associated with high mortality rates (>20%) and severe neurologic sequelae. In 2011, four cases of EEEV neuroinvasive disease cases were reported from four states (Massachusetts, Missouri, New York, and Wisconsin). Three (75%) of the four reported cases were fatal. During 2002–2011, a median of seven (range: 3–21) cases per year were reported in the United States. Before the introduction of WNV, SLEV was the leading cause of arboviral encephalitis in the United States, with periodic large outbreaks with hundreds to thousands of cases. In 2011, four cases of SLEV neuroinvasive disease were reported from two states (Alabama and Arkansas). During 2002–2011, a median of eight (range: 4–43) cases per year were reported in the United States. It is not known if the recent decline in the number of reported SLEV disease cases is related to normal periodicity in viral activity, surveillance artifact, or possible competitive displacement of SLEV by WNV.
Alternate Text: This figure is a line graph that presents the number of cases of neuroinvasive disease, broken down by California serogroup viruses, Eastern equine encephalitis virus, and St. Louis encephalitis virus, from 2002 to 2011.
ARBOVIRAL DISEASES, WEST NILE VIRUS. Incidence* of reported cases of neuroinvasive disease, by state — United States, 2011
* Per 100,000 population. Data from the Division of Vector-Borne Diseases, National Center for Emerging and Zoonotic Infectious Diseases (ArboNET Surveillance).
In 2011, the states with the highest reported incidence of West Nile virus (WNV) neuroinvasive disease were the District of Columbia (1.62 per 100,000), Mississippi (1.04), Nebraska (0.76), and Arizona (0.76). Five states reported 51% of WNV neuroinvasive disease cases: California (110), Arizona (49), Michigan (32), Mississippi (31), and New York (28).
Alternate Text: This figure is a map that presents the incidence of reported cases per 100,000 population of neuroinvasive disease in each state 2011.
ARBOVIRAL DISEASES, WEST NILE VIRUS. Incidence* of reported cases of neuroinvasive disease, by year — United States, 2002–2011
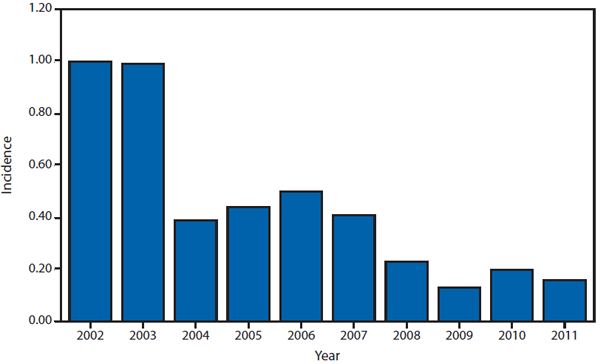
* Per 100,000 population. Data from the Division of Vector-Borne Diseases, National Center for Emerging and Zoonotic Infectious Diseases (ArboNET Surveillance).
West Nile virus (WNV) was first detected in the United States in 1999. Despite substantial geographic spread of the virus from 1999 through 2001, WNV neuroinvasive disease incidence remained low until 2002, when large outbreaks occurred in the Midwest and Great Plains. The national incidence of WNV neuroinvasive disease peaked in 2002 and 2003, and was relatively stable from 2004 through 2007. WNV had appeared to reach a stable incidence, but incidence decreased in 2008 and continued to decline in 2009. However, in 2010 the number of reported WNV neuroinvasive disease cases increased 62% from that reported in 2009. The reported incidence of WNV neuroinvasive disease in the United States in 2011 was 0.16 per 100,000 population, which is consistent with incidence rates during 2008–2010.
Alternate Text: This figure is a bar graph that presents the incidence per 100,000 population of reported cases of neuroinvasive disease from 2002 to 2011.
ARBOVIRAL DISEASES, WEST NILE VIRUS. Incidence* of reported cases of neuroinvasive disease, by age group — United States, 2011
* Per 100,000 population. Data from the Division of Vector-Borne Diseases, National Center for Emerging and Zoonotic Infectious Diseases (ArboNET Surveillance).
In 2011, the median age of patients with West Nile virus neuroinvasive disease was 57 years (range: 7–96 years), with increasing incidence among older age groups.
Alternate Text: This figure is a bar graph that presents the incidence of reported cases per 100,000 population of neuroinvasive disease in 2011.
BABESIOSIS. Number of reported cases — United States and U.S. territories, 2011
Babesiosis, a tickborne parasitic infection, became nationally notifiable in 2011. Approximately 97% of cases were reported from the Northeast and Upper Midwest.
Alternate Text: This figure is a map that presents the number of reported cases in each state and U.S. territory in 2011.
BOTULISM, FOODBORNE. Number of reported cases, by year — United States, 1991–2011
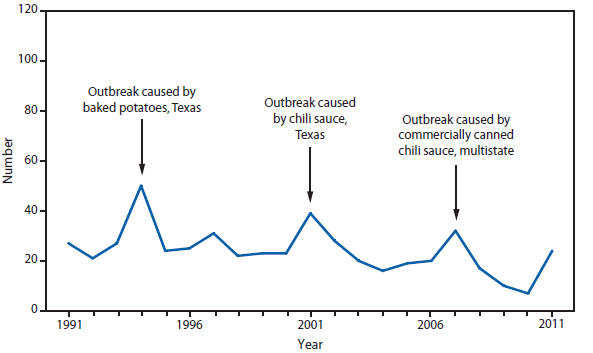
Foodborne botulism is typically associated with home-canned or Alaska Native foods. In 2011, an outbreak of eight cases of foodborne botulism occurred in a Utah prison, associated with consumption of pruno, an illicit alcoholic brew.
Alternate Text: This figure is a line graph that presents the number of foodborne-related botulism cases in the United States from 1991 to 2011.
BOTULISM, INFANT. Number of reported cases, by year — United States, 1991–2011
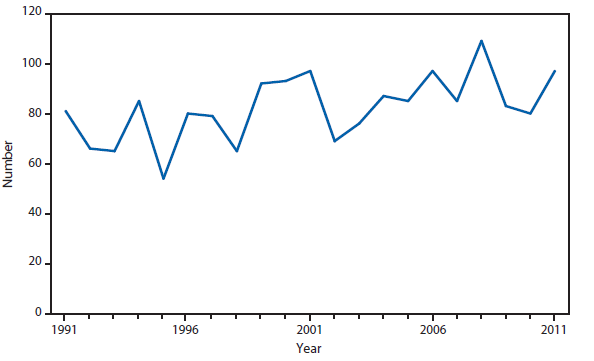
Infant botulism remains the most common transmission category of botulism in the United States and accounted for the majority of botulism cases in 2011.
Alternate Text: This figure is a line graph that presents the number of botulism cases in U.S. infants from 1991 to 2011.
BOTULISM, OTHER. Number* of reported cases, by year — United States, 2001–2011
* Includes wound and unspecified.
Annual numbers of wound and unspecified forms of botulism have remained generally stable during the past decade.
Alternate Text: This figure is a line graph that presents the number of wound-related and unspecified botulism cases in the United States from 2001 to 2011.
Brucellosis. Number of reported cases, by year — United States, 1981–2011
Reported cases for 2011 declined 31% compared with 2009 and 2010.
Alternate Text: This figure is a line graph that presents the number of brucellosis cases in the United States from 1981 to 2011.
Brucellosis. Number of reported cases — United States and U.S. territories, 2011
Cases from California, Florida, Georgia, Illinois, and Texas accounted for approximately 57% of all reported cases.
Alternate Text: This figure is a map of the United States and U.S. territories that presents the number of brucellosis cases in each state and territory in 2010.
Chlamydia. Incidence* among women — United States and U.S. territories, 2011
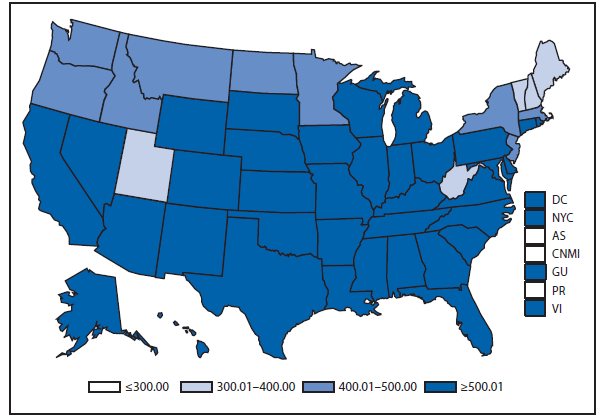
* Per 100,000 population.
In 2011, the chlamydia rate among women in the United States and U. S. territories (Guam, Puerto Rico, and the Virgin Islands) was 644.1 cases per 100,000 population.
Alternate Text: This figure is a map of the United States and U.S. territories that presents the incidence per 100,000 population of chlamydia among women in 2011.
Cholera. Number of reported cases — United States and U.S. territories, 2011
In 2011, as in 2010, the majority of cholera cases reported in the United States occurred among travelers who had recently arrived from Hispaniola. Of the 42 cholera infections reported in the United States, 39 were travel-associated (22 with travel to Haiti, 11 to the Dominican Republic, and 6 to other cholera-affected countries).
Alternate Text: This figure is a map of the United States and U.S. territories that presents the number of cholera cases in each state and territory in 2011.
COCCIDIOIDOMYCOSIS. Number of reported cases — United States* and U.S. territories, 2011
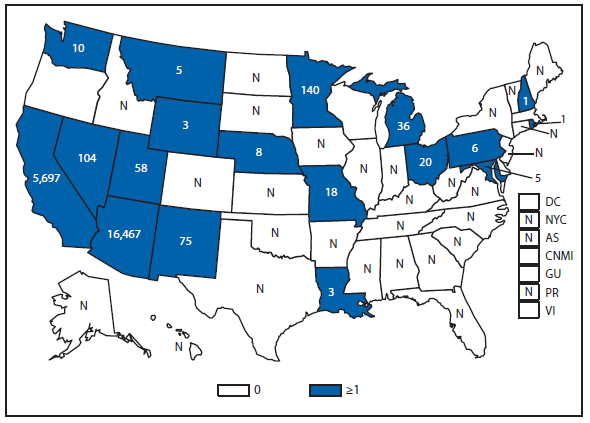
* In the United States, coccidioidomycosis is endemic to the southwestern states. However, cases have been reported in other states, usually among travelers returning from areas in which the disease is endemic.
Alternate Text: This figure is a map of the United States and U.S. territories that presents the number of reported cases in each state and territory in 2011.
Cryptosporidiosis. Incidence,* by year — United States, 2000–2011
* Per 100,000 population.
Alternate Text: This figure is a bar chart that presents the incidence per 100,000 population of cryptosporidiosis cases in the United States from 2000 to 2011.
Cryptosporidiosis incidence remains historically elevated relative to the baseline observed before 2005. Whether the changes in cryptosporidiosis reporting reflect a real change in cryptosporidiosis incidence or changing diagnosis, testing, or reporting patterns is unclear.
Cryptosporidiosis. Incidence* — United States and U.S. territories, 2011
* Per 100,000 population.
Cryptosporidiosis is widespread geographically in the United States. Although incidence appears to be consistently higher in certain states, differences in reported incidence among states might reflect differences in risk factors; the number of cases associated with outbreaks; or in the capacity to detect, investigate, and report cases. Incidence categories have been modified to reflect the recent increase in incidence.
Alternate Text: This figure is a map of the United States and U.S. territories that presents the incidence range per 100,000 population of cryptosporidiosis cases in each state and territory in 2011.
DENGUE VIRUS INFECTION. Number* of reported cases, by age group — United States, 2011
* Data from the Division of Vector-Borne Diseases, National Center for Emerging and Zoonotic Infectious Diseases (ArboNET Surveillance).
This bar graph represents the number of travel and locally acquired cases of dengue fever and dengue hemorrhagic fever with illness onset in 2011 reported from the 50 U.S. states and stratified by age group. The median age of persons with dengue fever was 19 years (range: 1–94 years); most cases occurred in persons aged 50–59 years. The median age for persons with dengue hemorrhagic fever was 40.5 years (range: 28–65 years).
Alternate Text: This figure is a bar chart of the number of reported cases of dengue virus infection by age group in the United States in 2011.
DENGUE fever and dengue hemorrhagic fever. Number of reported cases, by location of residence* — United States and U.S. territories, 2011
* Data from the Division of Vector-Borne Diseases, National Center for Emerging and Zoonotic Infectious Diseases (ArboNET Surveillance).
† New York City reported cases 45/0.
§ Puerto Rico locally acquired cases 1,507/34.
The numbers on this map represent the number of dengue fever and dengue hemorrhagic fever cases with illness onset in 2011, by residence. Both travel-associated and locally acquired cases are presented. Florida, New York City, and Pennsylvania had the highest number of travel-associated cases. The U.S. territory of Puerto Rico (n = 1,541), Florida (n = seven), and Hawaii (n = four) were the only jurisdictions reporting locally acquired dengue cases.
Alternate Text: This figure is a map of the United States that presents the number of cases of dengue fever and dengue hemorrhagic fever in the United States and its territories in 2011.
EHRLICHIOSIS, ANAPLASMA PHAGOCYTOPHILUM. Number of reported cases, by county — United States, 2011
Anaplasmosis is caused by infection with Anaplasma phagocytophilum. Cases are reported primarily from the upper Midwest and coastal New England, reflecting both the range of the primary tick vector species, Ixodes scapularis — also known to transmit Lyme disease and babesiosis—and the range of preferred animal hosts for tick feeding.
Alternate Text: This figure is a map of the United States that presents the number of ehrlichiosis (anaplasma phagocytophilum) cases by county in 2011.
EHRLICHIOSIS, EHRLICHIA CHAFFEENSIS. Number of reported cases, by county — United States, 2011
Ehrlichia chaffeensis is the most common type of ehrlichiosis infection in the United States. This tick-borne pathogen is transmitted by Amblyomma americanum, the lonestar tick. The majority of cases of E. chaffeensis are reported from the Midwest and New York.
Alternate Text: This figure is a map of the United States that presents the number of Ehrlichiosis (Ehrlichia chaffeensis) cases by county in 2011.
EHRLICHIOSIS, EhRLICHIA EWINGII. Number of reported cases, by county — United States, 2011
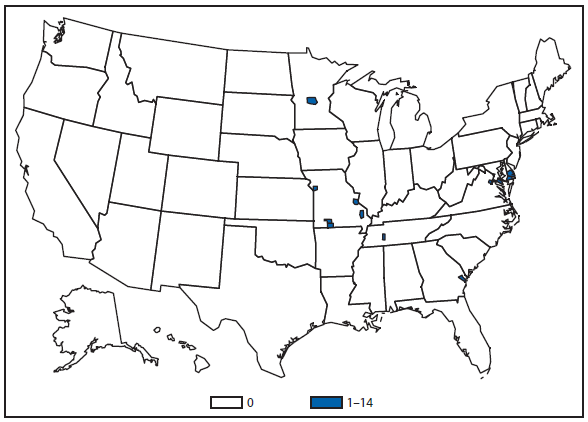
Ehrlichiosis ewingii is the less common cause of ehrlichiosis. E. ewingii is carried by Amblyomma americanum, the lonestar tick, which is the same vector that transmits E. chaffeensis. Currently, no serologic tests are used to distinguish between the two species, and differentiation can only be made by molecular genotyping.
Alternate Text: This figure is a map of the United States that presents the number of Ehrlichiosis (Ehrlichia ewingii) cases in by county in 2011.
EHRLICHIOSIS, undetermined. Number of reported cases, by county — United States, 2011
Cases of ehrlichiosis and anaplasmosis, caused by an undetermined species are reported across the United States, but are more likely to be found in the Midwest and Eastern Atlantic regions. This reporting category is used to report new Ehrlichia or Anaplasma species, including the newly recognized Ehrlichia muris-like organism, which was recently confirmed in some patients from Minnesota and Wisconsin. However, this classification is most often used in geographic areas where no clear geographic boundary separates the individual tick vectors. Because ehrlichiosis and anaplasmosis elicit some cross reactivity in antibody detection, this category can also be used when single, inappropriate diagnostic tests are performed.
Alternate Text: This figure is a map of the United States that presents the number of Ehrlichiosis (undetermined) cases by county in 2011.
GIARDIASIS. Incidence* — United States and U.S. territories, 2011
* Per 100,000 population.
Giardiasis is widespread geographically in the United States, with varying reported rates in certain states and regions. Whether these differences are of true biologic significance or reflect differences in giardiasis case detection and reporting among states is unclear.
Alternate Text: This figure is a map of the United States and U.S. territories that presents the incidence range per 100,000 population of giardiasis cases in each state and territory in 2011.
Gonorrhea. Incidence* — United States and U.S. territories, 2011
* Per 100,000 population.
In 2011, the gonorrhea rate in the United States and U.S. territories (Guam, Puerto Rico, and the Virgin Islands) was 103.1 cases per 100,000 population, an increase from the rate in 2010.
Alternate Text: This figure is a map of the United States and U.S. territories that presents the incidence range per 100,000 population of gonorrhea cases in each state and territory in 2011.
Gonorrhea. Incidence,* by sex — United States, 1996–2011
* Per 100,000 population.
For the tenth year in a row, the gonorrhea rate among women was slightly higher than the rate among men.
Alternate Text: This figure is a line graph that presents the incidence per 100,000 population of gonorrhea cases in the United States, with separate lines for men and women, from 1996 to 2011.
Gonorrhea. Incidence,* by race/ethnicity — United States, 1996–2011
* Per 100,000 population.
† Y-axis is log scale.
Gonorrhea incidence among blacks decreased considerably during the 1990s but continues to be the highest among all races/ethnicities. In 2011, incidence among non-Hispanic blacks was approximately 17 times greater than that for non-Hispanic whites.
Alternate Text: This figure is a line graph that presents the incidence per 100,000 population of gonorrhea cases in the United States by race/ethnicity, with separate lines for black non-Hispanic, white non-Hispanic, American Indian/Alaska Native non-Hispanic, Asian/Pacific Islander non-Hispanic, and Hispanic, from 1996 to 2011.
Haemophilus influenzae, Invasive Disease. Incidence,* by serotype among persons aged <5 years — United States, 1998–2011
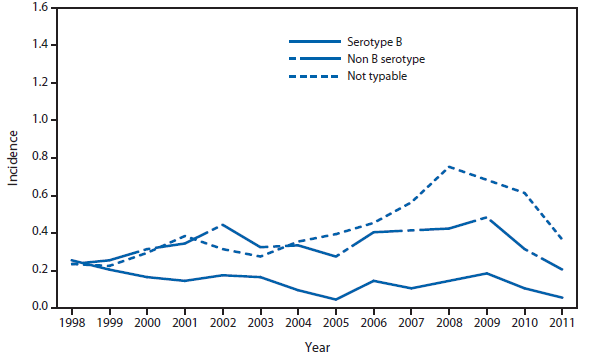
* Per 100,000 population.
This figure shows incidence rates for all invasive Haemophilus influenzae (serotype b (Hib), non-b, and nontypeable) among children aged <5 years. The epidemiology of invasive Haemophilus influenzae disease has changed in the United States in the post vaccine era. Since the introduction of conjugate Hib vaccines in 1987, the incidence of invasive Hib disease among children aged <5 years decreased by 99% to <1 case per 100,000 children. Nontypeable Haemophilus influenzae now causes the majority of invasive disease in all age groups. To ensure appropriate chemophrophylaxis measures for contacts of invasive Hib disease and to detect emergence of invasive non-Hib disease, serotyping of all Haemophilus influenzae isolates in children <5 years, and thorough and timely investigation of all cases of Hib disease are essential.
Alternate Text: This figure is a line graph that presents the incidence rates for all invasive Haemophilus influenzae (serotype b (Hib), non-b, and nontypeable) in the United States among persons aged <5 years, from 1998 to 2011.
Haemophilus influenzae, Invasive Disease. Incidence,* by serotype among persons aged ≥5 years — United States, 1998–2011
* Per 100,000 population.
This figure shows incidence rates for all invasive Haemophilus influenzae (serotype b (Hib), non-b, and nontypeable) among children aged <5 years. The epidemiology of invasive Haemophilus influenzae disease has changed in the United States in the post vaccine era. Since the introduction of conjugate Hib vaccines in 1987, the incidence of invasive Hib disease among children aged <5 years decreased by 99% to less than one case per 100,000 children. Nontypeable Haemophilus influenzae now causes the majority of invasive disease in all age groups. To ensure appropriate chemophrophylaxis measures for contacts of invasive Hib disease and to detect emergence of invasive non-Hib disease, serotyping of all Haemophilus influenzae isolates in children <5 years and through timely investigation of all cases of Hib disease are essential.
Alternate Text: This figure is a line graph that presents the incidence of invasive Haemophilus influenzae (serotype b (Hib), non-b, and nontypeable) in the United States, with separate lines for persons aged ≥5 years, from 1998 to 2011.
Hansen Disease (Leprosy). Number of reported cases, by year — United States, 1991–2011
During 2011, reported Hansen disease cases decreased 16.3% compared with 2010.
Alternate Text: This figure is a line graph that presents the number of Hansen disease cases, also known as leprosy, in the United States from 1991 to 2011.
Hemolytic Uremic Syndrome, Postdiarrheal. Number of reported cases — United States and U.S. territories, 2011
In 2011, cases continued to be reported from all regions of the country. Most cases of postdiarrheal hemolytic uremic syndrome (HUS) are caused by Shiga toxin-producing Escherichia coli (STEC), with STEC O157:H7 being the most common serotype identified in patients with HUS (based on data collected in the FoodNet surveillance system). During 2011, four cases of postdiarrheal HUS in the United States occurred in adults with recent travel to Germany whose illnesses were part of a large European outbreak associated with sprouts; STEC O104:H4 was isolated from each patient.
Alternate Text: This figure is a map of the United States and U.S. territories that presents the number of hemolytic uremic, postdiarrheal cases in each state and territory in 2011.
Hepatitis, Viral. Incidence,* by year — United States, 1981–2011
* Per 100,000 population.
† Hepatitis A vaccine was first licensed in 1995.
§ Hepatitis B vaccine was first licensed in June 1982.
¶ An anti-hepatitis C virus (HCV) antibody test first became available in May 1990.
Since 1995, NNDSS data have shown declining rates of acute hepatitis A and B. The decline in incidence of hepatitis A is in part because of routine vaccination of children with hepatitis A vaccine. The decline in incidence of hepatitis B is primarily because of routine vaccination of infants. The number of cases and rates of acute hepatitis C have been relatively stable from 2003 through 2010. However, the rate for acute hepatitis C increased by 33.3% from 2010 to 2011. Additionally, a substantial burden of hepatitis disease remains as a result of the prevalence of both chronic hepatitis B and chronic hepatitis C.
Alternate Text: This figure is a line graph that presents the incidence per 100,000 population of viral hepatitis, with separate lines for hepatitis A, B, and C, in the United States from 1981 to 2011.
Hepatitis A. Incidence,* by county — United States, 2011
* Per 100,000 population.
Since 1999, rates of infection with hepatitis A virus have declined in all regions, with western states showing the greatest decline. This decline is because of routine vaccination of children, beginning in 1996 in 11 states that had consistently elevated rates of disease and becoming universal for all children in 2006. Hepatitis A virus infection rates are the lowest ever reported and are similar across regions.
Alternate Text: This figure is a map of the United States that presents the incidence range per 100,000 population of hepatitis A by county in 2011.
HUMAN IMMUNODEFICIENCY VIRUS DIAGNOSES. Percentage of diagnosed cases, by race/ethnicity — United States, 2011
Of persons diagnosed with HIV infection in 2011, the greatest percentage was among blacks/African Americans, followed by whites, Hispanics/Latinos, Asians/Pacific Islanders, persons of multiple races, and American Indians/Alaska Natives.
Alternate Text: This figure is a pie chart that presents the percentage of diagnosed cases of HIV by race/ethnicity in the United States in 2011. The race/ethnicities included are black non-Hispanic, white, non-Hispanic, Asian/Pacific Islanders non-Hispanics, American Indian/Alaska Native non-Hispanic, and Hispanic.
HUMAN IMMUNODEFICIENCY VIRUS DIAGNOSES. Diagnoses rates* — United States and U.S. territories, 2011
* Per 100,000 population.
The highest rates (i.e., ≥15 diagnoses per 100,000 population) of diagnoses of HIV infection were observed in certain states in the Southeast and Northeast. A rate ≥15 diagnoses per 100,000 population also was observed in the District of Columbia.
Alternate Text: This figure is a map of the United States and U.S. territories that presents the rates per 100,000 population of diagnosed HIV cases in each state and territory in 2011.
INFLUENZA–ASSOCIATED PEDIATRIC MORTALITY. Incidence* — United States and U.S. territories, 2011
* Per 100,000 population.
During 2011, a total of 34 states and New York City reported 118 influenza-associated pediatric deaths to CDC for an overall incidence rate in the United States of 0.16 deaths per 100,000 children aged <18 years. This represents an increase in the overall rate when compared with 2010 (0.08 deaths per 100,000 children aged <18 years) and a substantial decrease in the rate compared with 2009 (0.48 deaths per 100,000 children aged <18 years) when three peaks in influenza-associated deaths were seen: one from seasonal influenza activity, a small peak during the summer months because of the initial pandemic 2009 A(H1N1) activity, followed by a much larger peak associated with pandemic activity in the fall of 2009. The state-to-state variations in rates are more likely related to the small numbers of deaths in each state rather than true differences in disease burden.
Alternate Text: This figure is a map of the United States and U.S. territories that presents the incidence range per 100,000 population of influenza-associated pediatric deaths in each state and territory in 2011.
LEGIONELLOSIS. Incidence,* by year — United States, 1996–2011
* Per 100,000 population.
The incidence of legionellosis increased again in 2011, continuing a general increase that began in 2003. Factors contributing to this increase might include increased diagnostic testing or a true increase in disease transmission.
Alternate Text: This figure is a line graph that presents the incidence per 100,000 population of legionellosis cases in the United States from 1996 to 2011.
LISTERIOSIS. Incidence* — United States and U.S. territories, 2011
* Per 100,000 population.
In 2011, whole cantaloupe from a single farm was associated with the largest listeriosis outbreak in U.S. history, with 147 cases, 143 hospitalizations, and 33 deaths in 28 states. Colorado, Texas, New Mexico, Oklahoma, and Kansas reported the highest numbers of cases in this outbreak.
Alternate Text: This figure is a map of the United States and U.S. territories that presents the incidence range per 100,000 population of listeriosis cases in each state and territory in 2011.
LYME DISEASE. Incidence* of reported confirmed cases, by county — United States, 2011
* Per 100,000 population.
Approximately 95% of confirmed Lyme disease cases were reported from states in the Northeast, mid-Atlantic, and upper Midwest. A rash that can be confused with early Lyme disease sometimes occurs following bites of the lone star tick (Amblyomma americanum). These ticks, which do not transmit the Lyme disease bacterium, are common human-biting ticks in the southern and southeastern United States.
Alternate Text: This figure is a map of the United States that presents the incidence per 100,000 population of lyme disease cases in each county in 2011.
Malaria. Incidence,* by year — United States, 1997–2011
* Per 100,000 population.
Malaria in the United States is primarily a disease of travelers, for whom protective prophylaxis is recommended. The rate of malaria infection steadily decreased from 1997 to 2008. With an increase in the number of cases beginning in 2008, the 2010 and 2011 rates of malaria infection returned to levels not seen in a decade.
Alternate Text: This figure is a line graph that presents the incidence per 100,000 population of malaria cases in the United States from 1997 to 2011.
MEASLES. Incidence,* by year — United States, 1976–2011
* Per 100,000 population.
Measles vaccine was licensed in 1963. Evidence suggests that measles is no longer endemic in the United States.
Alternate Text: This figure is a line graph that presents the incidence per 100,000 population of measles cases in the United States from 1976 to 2011.
Meningococcal DISEASE. Incidence,* by year — United States, 1981–2011
* Per 100,000 population.
Meningococcal disease incidence remained low in 2011, but it continues to cause significant morbidity and mortality in the United States. The highest incidence of meningococcal disease occurs among infants, with a second peak occurring in late adolescence. In 2005, a quadrivalent (A, C, Y, W-135) meningococcal conjugate vaccine was licensed and recommended for adolescents and others at increased risk for disease. In October 2010, a booster dose was added to recommendations for adolescents at age 16 years.
Alternate Text: This figure is a line graph that presents the incidence per 100,000 population of meningococcal disease cases in the United States from 1981 to 2011.
MUMPS. Incidence,* by year — United States, 1986–2011
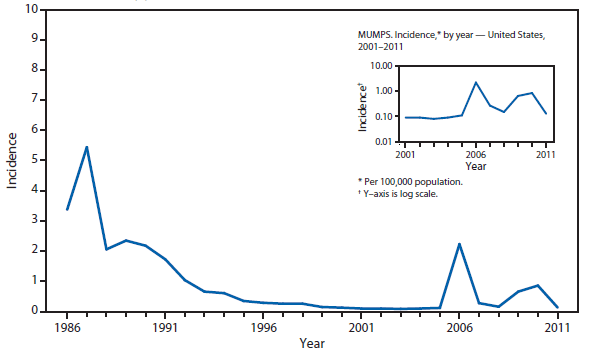
* Per 100,000 population.
The widespread use of a second dose of mumps vaccine, beginning in 1989, was followed by historically low morbidity until 2006, when the United States experienced the largest mumps outbreak in 2 decades. The 2006 outbreak of more than 6,000 cases primarily affected college students aged 18–24 years in the Midwest. A second large outbreak occurring during 2010–2011 affected Orthodox Jewish communities in the Northeast.
Alternate Text: This figure is a line graph that presents the incidence per 100,000 population of mumps cases in the United States from 1986 to 2011.
PERTUSSIS. Incidence,* by year — United States, 1981–2011
* Per 100,000 population.
Pertussis continues to have cyclic peaks every 3 to 5 years. Incidence in 2011 declined 32% following the peak in 2010.
Alternate Text: This figure is a line graph that presents the incidence per 100,000 population of pertussis cases in the United States from 1981 to 2011.
PERTUSSIS. Number of reported cases,* by age group — United States, 2011
* Of 18,719 cases, age was reported as unknown for 174 persons.
Infants, especially those who are too young to be fully vaccinated, are at greatest risk for severe disease and death from pertussis, and continue to have the highest numbers of reported disease. Similar to recent years, a large proportion of reported cases continue to be observed among school-aged children and adolescents.
Alternate Text: This figure is a bar chart that presents the number of pertussis cases, broken down by age group from <1 year to >60 years, in the United States in 2011.
Q FEVER, ACUTE AND CHRONIC. Number of reported cases* — United States and U.S. territories, 2011
* Number of Q fever acute cases/number of Q fever chronic cases.
Q fever, caused by Coxiella burnetii, is reported throughout the United States. Human cases of Q fever most often result from contact with infected livestock, especially sheep, goats, and cattle. Increased number of cases reported from Montana and Washington reflect an outbreak linked to goat farms beginning in January 2011.
Alternate Text: This figure is a map of the United States and U.S. territories that presents the number of acute and chronic Q fever cases in each state and territory in 2011.
RABIES, ANIMAL. Number* of reported cases, by county — United States, 2011
* Data from the National Center for Emerging and Zoonotic Infectious Diseases, Division of High-consequence Pathogens and Pathology.
Several rabies virus variants associated with distinct reservoir species have been identified in the United States. The circulation of rabies virus variants associated with raccoons (eastern United States), skunks (central United States and California), and foxes (Texas, Arizona, and Alaska) occur over defined geographic areas. Several distinct rabies virus variants associated with different bat species are broadly distributed across the contiguous United States. Hawaii is the only state considered free of rabies.
Alternate Text: This figure is a map of the United States that presents the number of rabies cases, by county, among wild and domestic animals in the United States in 2011.
RUBELLA. Incidence,* by year — United States, 1981–2011
* Per 100,000 population.
Rubella vaccine was licensed in 1969. Evidence suggests that rubella is no longer endemic in the United States.
Alternate Text: This figure is a line graph that presents the incidence per 100,000 population of rubella cases in the United States from 1981 to 2011.
SALMONELLOSIS AND SHIGELLOSIS. Incidence,* by year — United States, 1981–2011
* Per 100,000 population.
The incidence of reported salmonellosis has remained relatively stable during the past 2 decades. During 2011, multistate outbreaks of salmonellosis were linked to fresh produce, meat and poultry, other foods, and contact with animals. The incidence of reported shigellosis has gradually decreased over the past decade.
Alternate Text: This figure is a line graph that presents the number of salmonellosis and shigellosis cases in the United States from 1981 to 2011.
SHIGA TOXIN-PRODUCING ESCHERICHIA COLI (STEC). Number of reported cases — United States and U.S. territories, 2011
More cases of STEC infection were reported in 2011 than any other year, likely at least in part because of increasing use of Shiga toxin tests in clinical labs that help detect non-O157 STEC.
Alternate Text: This figure is a map of the United States and U.S. territories that presents the number of Shiga-toxin producing Escherichia coli cases in each state and territory in 2011.
SPOTTED FEVER RICKETTSIOSIS. Number of reported cases, by county — United States, 2011
In the United States the majority of cases of spotted fever group rickettsiosis are attributed to infection with Rickettsia ricketsii, the causative agent of Rocky Mountain spotted fever (RMSF), but might also be from other agents such as Rickettsia parkeri and Rickettsia species 364D. RMSF is ubiquitous across the United States, which represents the widespread nature of the three tick vectors known to transmit RMSF: Dermacentor variabilis in the East and Dermacentor andersonii in the West, and Rhipicephalus sanguineus, recently recognized as a new tick vector in parts of Arizona. Historically, much of the incidence of RMSF has been in the Central Atlantic region and parts of the Midwest; however, continued transmission of RMSF in Arizona communities has led to substantial increases in cases reported.
Alternate Text: The figure is a map that presents the number of spotted fever rickettsiosis cases by county in the United States in 2011.
SYPHILIS, CONGENITAL. Incidence* among infants, by year of birth — United States, 1981–2011
* Per 100,000 live births.
Following a decline in the incidence of congenital syphilis since 1991, overall congenital syphilis rates decreased from 2010 to 2011, from 9.1 to 8.5 cases per 100,000 live births.
Alternate Text: This figure is a line graph that presents the incidence per 100,000 population of congenital syphilis cases among infants aged <1 year in the United States in 2011.
SYPHILIS, PRIMARY AND SECONDARY. Incidence* — United States and U.S. Territories, 2011
* Per 100,000 population.
In 2011, the primary and secondary syphilis rate in the United States and U.S. territories (Guam, Puerto Rico, and the Virgin Islands) was 4.5 cases per 100,000 population.
Alternate Text: This figure is a map of the United States and U.S. territories that presents the incidence per 100,000 population of primary and secondary syphilis cases in each state and territory in 2011.
SYPHILIS, PRIMARY AND SECONDARY. Incidence*, by sex — United States, 1996–2011
* Per 100,000 population.
During 2010–2011, the incidence of primary and secondary syphilis in the United States remained constant at 4.5 cases (women: decreased from 1.1 to 1.0; men: increased from 7.9 to 8.2) per 100,000 population.
Alternate Text: This figure is a line graph that presents the incidence per 100,000 population of primary and secondary syphilis cases among men and women in the United States from 1996 to 2011.
Syphilis, Primary and Secondary. Incidence,* by race/ethnicity — United States, 1996–2011
* Per 100,000 population.
† Y-axis is log scale.
During 2010–2011, incidence of primary and secondary syphilis increased among all races/ethnicities except non-Hispanic blacks. Incidence per 100,000 population increased from 2.1 to 2.3 among non-Hispanic whites; from 4.4 to 4.6 among Hispanics; from 2.5 to 2.7 among American Indians/Alaska Natives; from 1.2 to 1.6 among Asians/Pacific Islanders; and decreased from 16.6 to 15.5 among non-Hispanic blacks.
Alternate Text: This figure is a line graph that presents the incidence per 100,000 population of primary and secondary syphilis cases by race/ethnicity in the United States from 1996 to 2011. The race/ethnicities include black non-Hispanic, white non-Hispanic, American Indian/Alaska Native non-Hispanic, Asian/Pacific Islander non-Hispanic, and Hispanic.
Trichinellosis. Number of reported cases, by year — United States, 1981–2011
In 2011, one outbreak of trichinellosis was reported involving two members of a family of six, all of whom consumed meat from a boar that was hunted on a wild game preserve in a neighboring state. Wild game preserves offer a unique alternative to traditional hunting, but as evidenced here, can be venues for the transmission of Trichinella infection to humans. Owners and patrons should be aware that animals procured from these establishments also are at risk for disease, and this risk should be included in public health messages regarding food safety.
Alternate Text: This figure is a line graph that presents the number of trichinellosis cases in the United States from 1981 to 2011.
Tuberculosis. Incidence* — United States and U.S. territories, 2011
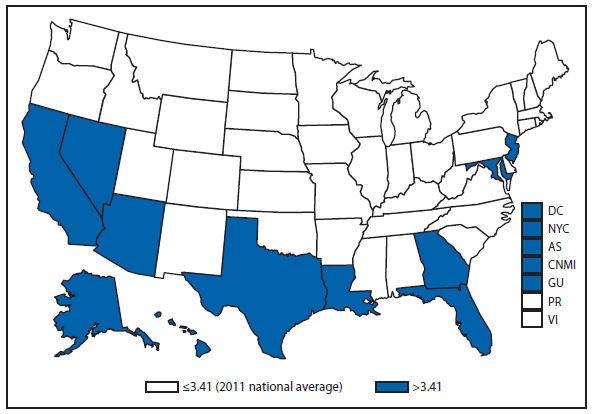
* Per 100,000 population. Data from the Division of Tuberculosis Elimination, National Center for HIV/AIDS, Viral Hepatitis, STD, and TB Prevention.
For the first time, the national incidence rate has fallen below the interim goal of 3.5 cases. Eleven states, New York City, and the District of Columbia continue to have an incidence rate above the national average.
Alternate Text: This figure is a map of the United States and U.S. territories that presents the incidence range per 100,000 population of tuberculosis cases in each state and territory in 2011.
Tuberculosis. Number of reported cases among U.S.-born and foreign-born persons,* by year — United States, 2001–2011
* Cases in U.S.-born tuberculosis (TB) patients continue to decline, continuing a trend begun in 1993.
† In thousands. Data from the Division of Tuberculosis Elimination, National Center for HIV/AIDS, Viral Hepatitis, STD, and TB Prevention.
After years of relative stability in the number of foreign-born TB cases, in 2011 the number of cases declined significantly and continues to decrease.
Alternate Text: This figure is a line graph that presents the number of cases of tuberculosis cases, separated by U.S.-born and foreign-born persons, in the United States from 2001 to 2011.
Tuberculosis. Incidence,* by race/ethnicity† — United States, 2001–2011
* Per 100,000 population.
† Data from the Division of Tuberculosis Elimination, National Center for HIV/AIDS, Viral Hepatitis, STD, and TB Prevention.
Tuberculosis incidence rates have declined for all races/ethnicities. TB incidence among Asians/Pacific Islanders continues to be much higher than for other ethnicities and has declined at a slower rate since 2001.
Alternate Text: This figure is a line graph that presents the incidence per 100,000 population of tuberculosis cases by race/ethnicity in the United States from 2001 to 2011. The race/ethnicities include black non-Hispanic, white non-Hispanic, American Indian/Alaska Natives non-Hispanic, Asian/Pacific Islanders non-Hispanic, and non-Hispanic.
Tularemia. Number of reported cases — United States and U.S. territories, 2011
To better define the geographic distribution of Francisella tularensis subspecies, CDC requests that isolates be forwarded to the CDC laboratory in Fort Collins, Colorado.
Alternate Text: This figure is a map of the United States and U.S. territories that presents the number of tularemia cases in each state and territory in 2011.
Typhoid fever. Number of reported cases, by year — United States, 1981–2011
Typhoid fever in the United States remains primarily a disease of travelers to countries where typhoid fever is endemic; CDC recommends vaccination against typhoid fever for travelers to endemic areas. CDC recently removed pretravel typhoid vaccination recommendations for 26 low-risk destinations; the most recent pretravel vaccination guidelines can be found at www.cdc.gov/travel.
Alternate Text: This figure is a line graph that presents the number of cases of typhoid fever in the United States from 1980 to 2010.
Varicella (ChickenPox). Number of reported cases — Illinois, Michigan, Texas, and West Virginia, 1995–2011
* In thousands.
In four states (Illinois, Michigan, Texas, and West Virginia), the number of cases reported in 2011 was 16% lower than 2010 and 94% less than the number reported during the prevaccine years 1993–1995.
Alternate Text: This figure is a line graph that presents the number of cases of varicella, also know as chickenpox, in Illinois, Michigan, Texas, and West Virginia from 1995 to 2011.
Vibriosis. Number of reported cases — United States and U.S. territories, 2011
Consumption of raw or undercooked seafood, especially molluscan shellfish, is a risk factor for vibriosis. In 2011, a multistate outbreak of toxigenic (i.e., producing cholera toxin) V. cholerae O75 infections was associated with consumption of raw oysters harvested from Apalachicola Bay, Florida.
Alternate Text: This figure is a map of the United States and U.S. territories that presents the number of cases of virbriosis in each state and territory in 2011.
PART 3
Historical Summaries of Notifiable Diseases in the United States, 1980–2011
Abbreviations and Symbols Used in Tables
NA Data not available.
— No reported cases.
Notes: Rates <0.01 after rounding are listed as 0.
Data in the MMWR Summary of Notifiable Diseases — United States, 2011 might differ from data in other CDC surveillance reports because of differences in the timing of reports, the source of the data, the use of different case definitions, and print criteria.
|
TABLE 7. (Continued) Reported incidence* of notifiable diseases — United States, 2001–2011 |
|||||||||||
|---|---|---|---|---|---|---|---|---|---|---|---|
|
Disease |
2001 |
2002 |
2003 |
2004 |
2005 |
2006 |
2007 |
2008 |
2009 |
2010 |
2011 |
|
Haemophilus influenzae, invasive disease |
|||||||||||
|
all ages, serotypes |
0.57 |
0.62 |
0.70 |
0.72 |
0.78 |
0.82 |
0.85 |
0.96 |
0.99 |
1.03 |
1.15 |
|
age<5 yrs |
|||||||||||
|
serotype b |
§ |
0.18 |
0.16 |
0.03 |
0.04 |
0.14 |
0.11 |
0.14 |
0.18 |
0.11 |
0.06 |
|
nonserotype b |
§ |
0.75 |
0.59 |
0.04 |
0.67 |
0.86 |
0.97 |
1.18 |
1.17 |
0.94 |
0.57 |
|
unknown serotype |
§ |
0.80 |
1.15 |
0.97 |
1.08 |
0.88 |
0.88 |
0.79 |
0.79 |
1.05 |
0.89 |
|
Hansen disease (leprosy) |
0.03 |
0.04 |
0.03 |
0.04 |
0.03 |
0.03 |
0.04 |
0.03 |
0.04 |
0.04 |
0.03 |
|
Hantavirus pulmonary syndrome |
0 |
0.01 |
0.01 |
0.01 |
0.01 |
0.01 |
0.01 |
0.01 |
0.01 |
0.01 |
0.01 |
|
Hemolytic uremic syndrome, postdiarrheal |
0.08 |
0.08 |
0.06 |
0.07 |
0.08 |
0.11 |
0.10 |
0.12 |
0.09 |
0.09 |
0.10 |
|
Hepatitis, viral, acute |
|||||||||||
|
A |
3.77 |
3.13 |
2.66 |
1.95 |
1.53 |
1.21 |
1.00 |
0.86 |
0.65 |
0.54 |
0.45 |
|
B |
2.79 |
2.84 |
2.61 |
2.14 |
1.78 |
1.62 |
1.51 |
1.34 |
1.12 |
1.10 |
0.94 |
|
C |
1.41 |
0.65 |
0.38 |
0.31 |
0.23 |
0.26 |
0.28 |
0.29 |
0.27 |
0.29 |
0.42 |
|
HIV diagnoses† |
— |
— |
— |
— |
— |
— |
— |
— |
12.13 |
11.64 |
11.32 |
|
Influenza–associated pediatric mortality |
§ |
§ |
§ |
§ |
0.02 |
0.07 |
0.10 |
0.12 |
0.48 |
0.08 |
0.17 |
|
Legionellosis |
0.42 |
0.47 |
0.78 |
0.71 |
0.78 |
0.96 |
0.91 |
1.05 |
1.16 |
1.09 |
1.36 |
|
Listeriosis |
0.22 |
0.24 |
0.24 |
0.32 |
0.31 |
0.30 |
0.27 |
0.25 |
0.28 |
0.27 |
0.28 |
|
Lyme disease, total¶¶ |
6.05 |
8.44 |
7.39 |
6.84 |
7.94 |
6.75 |
9.21 |
11.67 |
12.71 |
9.86 |
10.78 |
|
confirmed |
¶¶ |
¶¶ |
¶¶ |
¶¶ |
¶¶ |
¶¶ |
¶¶ |
9.59 |
9.85 |
7.38 |
7.92 |
|
probable |
¶¶ |
¶¶ |
¶¶ |
¶¶ |
¶¶ |
¶¶ |
¶¶ |
2.08 |
2.80 |
2.49 |
2.84 |
|
Malaria |
0.55 |
0.51 |
0.49 |
0.51 |
0.51 |
0.50 |
0.47 |
0.42 |
0.48 |
0.58 |
0.56 |
|
Measles |
0.04 |
0.02 |
0.02 |
0.01 |
0.02 |
0.02 |
0.01 |
0.05 |
0.02 |
0.02 |
0.06 |
|
Meningococcal disease, invasive |
|||||||||||
|
all serogroups |
0.83 |
0.64 |
0.61 |
0.47 |
0.42 |
0.40 |
0.36 |
0.39 |
0.32 |
0.27 |
0.25 |
|
serogroup A, C, Y, & W—135 |
*** |
*** |
*** |
*** |
0.10 |
0.11 |
0.11 |
0.11 |
0.10 |
0.09 |
0.08 |
|
serogroup B |
*** |
*** |
*** |
*** |
0.05 |
0.07 |
0.06 |
0.06 |
0.06 |
0.04 |
0.05 |
|
other serogroup |
*** |
*** |
*** |
*** |
0.01 |
0.01 |
0.01 |
0.01 |
0.01 |
0 |
0.01 |
|
serogroup unknown |
*** |
*** |
*** |
*** |
0.26 |
0.22 |
0.18 |
0.20 |
0.16 |
0.13 |
0.10 |
|
Mumps |
0.10 |
0.10 |
0.08 |
0.09 |
0.11 |
2.22 |
0.27 |
0.15 |
0.65 |
0.85 |
0.13 |
|
Novel influenza A virus infections |
§ |
§ |
§ |
§ |
§ |
§ |
0 |
0 |
14.37 |
0 |
0 |
|
Pertussis |
2.69 |
3.47 |
4.04 |
8.88 |
8.72 |
5.27 |
3.49 |
4.40 |
5.54 |
8.97 |
6.06 |
|
Plague |
0 |
0 |
0 |
0 |
0 |
0.01 |
0 |
0 |
0 |
0 |
0 |
|
Poliomyelitis, paralytic |
0 |
0 |
0 |
0 |
0 |
0 |
— |
— |
0 |
— |
— |
|
Poliovirus infection, nonparalytic |
§ |
§ |
§ |
§ |
§ |
§ |
— |
— |
— |
— |
— |
|
Psittacosis |
0.01 |
0.01 |
0 |
0 |
0.01 |
0.01 |
0 |
0 |
0 |
0 |
0 |
|
Q fever††† |
0.01 |
0.02 |
0.02 |
0.03 |
0.05 |
0.06 |
0.06 |
0.04 |
0.04 |
0.04 |
0.04 |
|
acute |
††† |
††† |
††† |
††† |
††† |
††† |
††† |
0.04 |
0.03 |
0.04 |
0.04 |
|
chronic |
††† |
††† |
††† |
††† |
††† |
††† |
††† |
0 |
0.01 |
0.01 |
0.01 |
|
Rabies, human |
0 |
0 |
0 |
0 |
0 |
0 |
0 |
0 |
0 |
0 |
0 |
|
Rubella |
0.01 |
0.01 |
0 |
0 |
0 |
0 |
0 |
0.01 |
0 |
0 |
0 |
|
Rubella, congenital syndrome |
0 |
0 |
0 |
0 |
0 |
0 |
— |
— |
0 |
— |
|
|
Salmonellosis |
14.39 |
15.73 |
15.16 |
14.47 |
15.43 |
15.45 |
16.03 |
16.92 |
16.18 |
17.73 |
16.79 |
|
SARS–CoV§§§ |
§ |
§ |
0 |
— |
— |
— |
— |
— |
— |
— |
— |
|
Shiga toxin–producing Escherichia coli (STEC) |
§ |
§ |
§ |
§ |
§ |
1.71 |
1.62 |
1.76 |
1.53 |
1.78 |
1.96 |
|
Shigellosis |
7.19 |
8.37 |
8.19 |
4.99 |
5.51 |
5.23 |
6.60 |
7.50 |
5.24 |
4.82 |
4.32 |
|
Spotted fever rickettsiosis, total¶¶¶ |
0.25 |
0.39 |
0.38 |
0.60 |
0.66 |
0.80 |
0.77 |
0.85 |
0.60 |
0.65 |
0.91 |
|
confirmed |
¶¶¶ |
¶¶¶ |
¶¶¶ |
¶¶¶ |
¶¶¶ |
¶¶¶ |
¶¶¶ |
0.06 |
0.05 |
0.05 |
0.08 |
|
probable |
¶¶¶ |
¶¶¶ |
¶¶¶ |
¶¶¶ |
¶¶¶ |
¶¶¶ |
¶¶¶ |
0.78 |
0.55 |
0.60 |
0.83 |
|
Smallpox |
§ |
§ |
§ |
— |
— |
— |
— |
— |
— |
— |
— |
|
Streptococcal disease, invasive, group A |
1.60 |
1.69 |
2.04 |
1.82 |
2.00 |
2.24 |
1.89 |
2.30 |
2.13 |
§ |
§ |
|
Streptococcal, toxic shock syndrome |
0.04 |
0.05 |
0.06 |
0.06 |
0.07 |
0.06 |
0.06 |
0.07 |
0.08 |
0.07 |
0.09 |
|
Streptococcus pneumoniae, invasive disease(IPD)**** |
|||||||||||
|
all ages |
**** |
**** |
**** |
**** |
**** |
**** |
**** |
**** |
**** |
8.83 |
8.52 |
|
age <5 yrs |
**** |
**** |
**** |
**** |
**** |
**** |
**** |
**** |
**** |
14.15 |
7.64 |
|
Streptococcus pneumoniae, invasive disease |
|||||||||||
|
drug resistant, all ages |
2.11 |
1.14 |
0.99 |
1.49 |
1.42 |
2.19 |
1.49 |
1.60 |
1.75 |
**** |
**** |
|
age <5 yrs |
— |
— |
— |
— |
— |
— |
3.73 |
3.51 |
4.54 |
**** |
**** |
|
non–drug resistant, age <5 yrs |
1.03 |
3.62 |
8.86 |
8.22 |
8.21 |
11.93 |
13.59 |
13.36 |
12.93 |
**** |
**** |
|
Syphilis, congenital, age <1 yr |
12.52 |
11.44 |
10.56 |
9.12 |
8.24 |
9.07 |
10.46 |
10.12 |
9.90 |
8.85 |
8.68 |
|
TABLE 7. (Continued) Reported incidence* of notifiable diseases — United States, 2001–2011 |
|||||||||||
|---|---|---|---|---|---|---|---|---|---|---|---|
|
Disease |
2001 |
2002 |
2003 |
2004 |
2005 |
2006 |
2007 |
2008 |
2009 |
2010 |
2011 |
|
Syphilis, primary and secondary |
2.17 |
2.44 |
2.49 |
2.71 |
2.97 |
3.29 |
3.83 |
4.48 |
4.60 |
4.49 |
4.52 |
|
Syphilis, total, all stages |
11.45 |
11.68 |
11.90 |
11.94 |
11.33 |
12.46 |
13.67 |
15.34 |
14.74 |
14.93 |
14.90 |
|
Tetanus |
0.01 |
0.01 |
0.01 |
0.01 |
0.01 |
0.01 |
0.01 |
0.01 |
0.01 |
0.01 |
0.01 |
|
Toxic–shock syndrome |
0.05 |
0.05 |
0.05 |
0.04 |
0.04 |
0.05 |
0.04 |
0.03 |
0.03 |
0.04 |
0.03 |
|
Trichinellosis |
0.01 |
0.01 |
0 |
0 |
0.01 |
0.01 |
0 |
0.01 |
0 |
0 |
0.01 |
|
Tuberculosis |
5.68 |
5.36 |
5.17 |
5.09 |
4.80 |
4.65 |
4.44 |
4.28 |
3.80 |
3.64 |
3.41 |
|
Tularemia |
0.05 |
0.03 |
0.04 |
0.05 |
0.05 |
0.03 |
0.05 |
0.04 |
0.03 |
0.04 |
0.05 |
|
Tyhoid fever |
0.13 |
0.11 |
0.12 |
0.11 |
0.11 |
0.12 |
0.14 |
0.15 |
0.13 |
0.15 |
0.13 |
|
Vancomycin–intermediate Staphylococcus aureus |
§ |
§ |
§ |
— |
0 |
0 |
0.02 |
0.03 |
0.03 |
0.04 |
0.04 |
|
Vancomycin–resistant Staphylococcus aureus |
§ |
§ |
§ |
0 |
0 |
0 |
0 |
0 |
0 |
0 |
— |
|
Varicella (chickenpox)†††† |
19.51 |
10.27 |
7.27 |
18.41 |
19.64 |
28.65 |
18.68 |
13.56 |
8.71 |
6.46 |
5.79 |
|
Vibriosis |
§ |
§ |
§ |
§ |
§ |
§ |
0.25 |
0.24 |
0.30 |
0.30 |
0.29 |
|
Viral hemorrhagic fevers |
§ |
§ |
§ |
§ |
§ |
§ |
§ |
§ |
§ |
0 |
0 |
|
Yellow fever |
0 |
0 |
— |
— |
— |
— |
— |
— |
— |
— |
— |
|
* Per 100,000 population. † In 2008, CDC published a revised HIV case definition. This combined separate surveillance case definitions for HIV infection and AIDS into a single case definition for HIV infection that includes AIDS (and incorporates the HIV infection classification system). The revised HIV case definition provides a more complete presentation of the HIV epidemic on a population level. See CDC. Revised surveillance case definitions for HIV infection among adults, adolescents, and children aged <18 months and for HIV infection and AIDS among children aged 18 months to <13 years—United States, 2008. MMWR 2008;57(No.RR-10):1–12. These case counts can be found under HIV Diagnoses in this table. The total number of HIV Diagnoses includes all cases reported to the Division of HIV/AIDS Prevention, National Center for HIV/AIDS, Viral Hepatitis, STD, and TB Prevention (NCHHSTP), through December 31, 2011. AIDS: Acquired Immunodeficiency Syndrome. HIV: Human Immunodeficiency Virus. § Not nationally notifiable. ¶ Revision of National Surveillance Case Definition distinguishing between confirmed and probable cases. ** As of January 1, 2008, these categories were replaced with codes for Anaplasma phagocytophilum. Refer to Ehrlichiosis/Anaplasmosis. †† Data for ehrlichiosis attributable to other or unspecified agents were being withheld from publication pending the outcome of discussions concerning the reclassification of certain Ehrlichia species, which will probably affect how data in this category were reported. §§ See also "Arboviral Diseases" incidence rates. In 2005, the arboviral disease surveillance case definitions and categories were revised. The nationally notifiable arboviral encephalitis and meningitis conditions continued to be nationally notifiable in 2005 and 2006, but under the category of arboviral neuroinvasive disease. In addition, in 2005, nonneuroinvasive domestic arboviral disesases for the six domestic arboviruses listed above were added to the list of nationally notifiable diseases. ¶¶ National surveillance case definition revised in 2008; probable cases not previously reported. *** To help public health specialists monitor the impact of the new meningococcal conjugate vaccine (Menactra(r), licensed in the United States in January 2005), the data display for meningococcal disease was modified to differentiate the fraction of the disease that is vaccine preventable (serogroups A,C,Y, W-135) from the nonpreventable fraction of disease (serogroup B and others). ††† In 2008, Q fever acute and chronic reporting categories were recognized as a result of revision to the Q fever case definition. Before that time, case counts were not differentiated relative to acute and chronic Q fever cases. ¶¶¶ Revision of National Surveillance Case Definition distinguishing between confirmed and probable cases; total case count includes two case reports with unknown case status. §§§ Severe acute respiratory syndrome-associated coronavirus disease. **** The previous categories of invasive pneumococcal disease among children less than 5 years and invasive, drug-resistant Streptococcus pneumoniae were eliminated. All cases of invasive Streptococcus pneumoniae disease, regardless of age or drug resistance are reported under a single disease code. †††† Varicella became a nationally notifiable disease in 2003. |
|||||||||||
|
TABLE 8. (Continued) Reported cases of notifiable diseases — United States, 2004–2011 |
||||||||
|---|---|---|---|---|---|---|---|---|
|
Disease |
2004 |
2005 |
2006 |
2007 |
2008 |
2009 |
2010 |
2011 |
|
Haemophilus influenzae, invasive disease |
||||||||
|
all ages, serotypes |
2,085 |
2,304 |
2,496 |
2,541 |
2,886 |
3,022 |
3,151 |
3,539 |
|
age <5 yrs |
||||||||
|
serotype b |
19 |
9 |
29 |
22 |
30 |
38 |
23 |
14 |
|
nonserotype b |
135 |
135 |
175 |
199 |
244 |
245 |
200 |
145 |
|
unknown serotype |
177 |
217 |
179 |
180 |
163 |
166 |
223 |
226 |
|
Hansen disease (leprosy) |
105 |
87 |
66 |
101 |
80 |
103 |
98 |
82 |
|
Hantavirus pulmonary syndrome |
24 |
26 |
40 |
32 |
18 |
20 |
20 |
23 |
|
Hemolytic uremic syndrome, postdiarrheal |
200 |
221 |
288 |
292 |
330 |
242 |
266 |
290 |
|
Hepatitis, viral, acute††† |
||||||||
|
A |
5,683 |
4,488 |
3,579 |
2,979 |
2,585 |
1,987 |
1,670 |
1,398 |
|
B |
6,212 |
5,119 |
4,713 |
4,519 |
4,033 |
3,405 |
3,374 |
2,903 |
|
C |
720 |
652 |
766 |
845 |
877 |
782 |
849 |
1,229 |
|
HIV diagnoses† |
— |
— |
— |
— |
— |
36,870 |
35,741 |
35,266 |
|
Influenza-associated pediatric mortality§§§ |
¶ |
45 |
43 |
77 |
90 |
358 |
61 |
118 |
|
Legionellosis |
2,093 |
2,301 |
2,834 |
2,716 |
3,181 |
3,522 |
3,346 |
4,202 |
|
Listeriosis |
753 |
896 |
884 |
808 |
759 |
851 |
821 |
870 |
|
Lyme disease, total¶¶¶ |
19,804 |
23,305 |
19,931 |
27,444 |
35,198 |
38,468 |
30,158 |
33,097 |
|
confirmed |
¶¶¶ |
¶¶¶ |
¶¶¶ |
¶¶¶ |
28,921 |
29,959 |
22,561 |
24,364 |
|
probable |
¶¶¶ |
¶¶¶ |
¶¶¶ |
¶¶¶ |
6,277 |
8,509 |
7,597 |
8,733 |
|
Malaria |
1,458 |
1,494 |
1,474 |
1,408 |
1,255 |
1,451 |
1,773 |
1,724 |
|
Measles |
37 |
66 |
55 |
43 |
140 |
71 |
63 |
220 |
|
Meningococcal disease, invasive**** |
||||||||
|
all serogroups |
1,361 |
1,245 |
1,194 |
1,077 |
1,172 |
980 |
833 |
759 |
|
serogroup A, C, Y, & W-135 |
— |
297 |
318 |
325 |
330 |
301 |
280 |
257 |
|
serogroup B |
— |
156 |
193 |
167 |
188 |
174 |
135 |
159 |
|
other serogroup |
— |
27 |
32 |
35 |
38 |
23 |
12 |
20 |
|
serogroup unknown |
— |
765 |
651 |
550 |
616 |
482 |
406 |
323 |
|
Mumps |
258 |
314 |
6,584 |
800 |
454 |
1,991 |
2,612 |
404 |
|
Novel influenza A virus infections |
¶ |
¶ |
¶ |
4 |
2 |
43,696 |
4 |
14 |
|
Pertussis |
25,827 |
25,616 |
15,632 |
10,454 |
13,278 |
16,858 |
27,550 |
18,719 |
|
Plague |
3 |
8 |
17 |
7 |
3 |
8 |
2 |
3 |
|
Poliomyelitis, paralytic†††† |
— |
1 |
— |
— |
— |
1 |
— |
— |
|
Poliovirus infection, nonparalytic |
— |
— |
— |
— |
— |
— |
— |
— |
|
Psittacosis |
12 |
16 |
21 |
12 |
8 |
9 |
4 |
2 |
|
Q fever§§§§ |
70 |
136 |
169 |
171 |
120 |
113 |
131 |
134 |
|
acute |
§§§§ |
§§§§ |
§§§§ |
§§§§ |
106 |
93 |
106 |
110 |
|
chronic |
§§§§ |
§§§§ |
§§§§ |
§§§§ |
14 |
20 |
25 |
24 |
|
Rabies |
||||||||
|
animal |
6,345 |
5,915 |
5,534 |
5,862 |
4,196 |
5,343 |
4,331 |
4,357 |
|
human |
7 |
2 |
3 |
1 |
2 |
4 |
2 |
6 |
|
Rubella |
10 |
11 |
11 |
12 |
16 |
3 |
5 |
4 |
|
Rubella, congenital syndrome |
— |
1 |
1 |
— |
— |
2 |
— |
|
|
Salmonellosis |
42,197 |
45,322 |
45,808 |
47,995 |
51,040 |
49,192 |
54,424 |
51,887 |
|
SARS-CoV¶¶¶¶ |
— |
— |
— |
— |
— |
— |
— |
— |
|
Shiga toxin–producing Escherichia coli (STEC) |
¶ |
¶ |
4,432 |
4,847 |
5,309 |
4,643 |
5,476 |
6,047 |
|
Shigellosis |
14,627 |
16,168 |
15,503 |
19,758 |
22,625 |
15,931 |
14,786 |
13,352 |
|
Spotted fever rickettsiosis, total***** |
1,713 |
1,936 |
2,288 |
2,221 |
2,563 |
1,815 |
1,985 |
2,802 |
|
confirmed |
***** |
***** |
***** |
***** |
190 |
151 |
156 |
234 |
|
probable |
***** |
***** |
***** |
***** |
2,367 |
1,662 |
1,835 |
2,562 |
|
Streptococcal disease, invasive, group A |
4,395 |
4,715 |
5,407 |
5,294 |
5,674 |
5,279 |
¶ |
¶ |
|
Streptococcal toxic-shock syndrome |
132 |
129 |
125 |
132 |
157 |
161 |
142 |
168 |
|
Streptococcus pneumoniae invasive disease |
||||||||
|
all ages |
††††† |
††††† |
††††† |
††††† |
††††† |
††††† |
16,569 |
17,138 |
|
age <5 yrs |
††††† |
††††† |
††††† |
††††† |
††††† |
††††† |
2,186 |
1,459 |
|
Streptococcus pneumoniae invasive disease, |
||||||||
|
drug resistant, all ages |
2,590 |
2,996 |
3,308 |
3,329 |
3,448 |
3,370 |
††††† |
††††† |
|
age <5 yrs |
— |
— |
— |
563 |
532 |
583 |
††††† |
††††† |
|
non-drug resistant age <5 yrs |
1,162 |
1,495 |
1,861 |
2,032 |
1,998 |
1988 |
††††† |
††††† |
|
Syphilis, all stages** |
33,401 |
33,278 |
36,935 |
40,920 |
46,277 |
44,828 |
45,834 |
46,042 |
|
congenital (age <1 yr) |
375 |
339 |
382 |
430 |
431 |
427 |
377 |
360 |
|
primary and secondary |
7,980 |
8,724 |
9,756 |
11,466 |
13,500 |
13,997 |
13,774 |
13,970 |
|
Tetanus |
34 |
27 |
41 |
28 |
19 |
18 |
26 |
36 |
|
TABLE 8. (Continued) Reported cases of notifiable diseases — United States, 2004–2011 |
||||||||
|---|---|---|---|---|---|---|---|---|
|
Disease |
2004 |
2005 |
2006 |
2007 |
2008 |
2009 |
2010 |
2011 |
|
Toxic-shock syndrome |
95 |
90 |
101 |
92 |
71 |
74 |
82 |
78 |
|
Trichinellosis |
5 |
16 |
15 |
5 |
39 |
13 |
7 |
15 |
|
Tuberculosis§§§§§ |
14,517 |
14,097 |
13,779 |
13,299 |
12,904 |
11,545 |
11,182 |
10,528 |
|
Tularemia |
134 |
154 |
95 |
137 |
123 |
93 |
124 |
166 |
|
Typhoid fever |
322 |
324 |
353 |
434 |
449 |
397 |
467 |
390 |
|
Vancomycin-intermediate Staphylococcus aureus |
— |
3 |
6 |
37 |
63 |
78 |
91 |
82 |
|
Vancomycin-resistant Staphylococcus aureus |
1 |
2 |
1 |
2 |
— |
1 |
2 |
|
|
Varicella (chickenpox)¶¶¶¶¶ |
32,931 |
32,242 |
48,445 |
40,146 |
30,386 |
20,480 |
15,427 |
14,513 |
|
Varicella (deaths)****** |
9 |
3 |
— |
6 |
2 |
2 |
4 |
5 |
|
Vibriosis (noncholera Vibrio species infections) |
¶ |
¶ |
¶ |
549 |
588 |
789 |
846 |
832 |
|
Viral hemorrhagic fever |
¶ |
¶ |
¶ |
¶ |
¶ |
¶ |
1 |
|
|
Yellow fever†††††† |
— |
— |
— |
— |
— |
— |
— |
|
|
* Acquired Immunodeficiency syndrome (AIDS). The total number of AIDS cases includes all cases reported to the Division of HIV/AIDS Prevention, National Center for HIV/AIDS, Viral Hepatitis, STD, and TB Prevention (NCHHSTP). † In 2008, CDC published a revised HIV case definition. This combined separate surveillance case definitions for HIV infection and AIDS into a single case definition for HIV infection that includes AIDS (and incorporates the HIV infection classification system). The revised HIV case definition provides a more complete presentation of the HIV epidemic on a population level. See CDC. Revised surveillance case definitions for HIV infection among adults, adolescents, and children aged <18 months and for HIV infection and AIDS among children aged 18 months to <13 years — United States, 2008. MMWR 2008;57(No.RR-10):1–12. These case counts can be found under "HIV Diagnoses" in this table. The total number of HIV Diagnoses includes all cases reported to the Division of HIV/AIDS Prevention, National Center for HIV/AIDS, Viral Hepatitis, STD, and TB Prevention (NCHHSTP), through December 31, 2009. HIV: Human Immunodeficiency Virus. § Totals reported to the Division of Vector-Borne Diseases (DVBD), National Center for Emerging and Zoonotic Infectious Diseases (NCEZID) (ArboNET Surveillance), as of April 17, 2012. ¶ Not nationally notifiable ** Totals reported to the Division of STD Prevention, NCHHSTP, as of June 7, 2012. †† Revision of national surveillance case definition distinguishing between confirmed and probable cases. §§ As of January 1, 2008, these categories were replaced with codes for Anaplasma phagocytophilum. Refer to Ehrlichiosis/Anaplasmosis. ¶¶ Data for Ehrlichiosis attributable to other or unspecified agents were being withheld from publication pending the outcome of discussions concerning the reclassification of certain Ehrlichia species, which will probably affect how data in this category were reported. *** See also "Arboviral Diseases" incidence rates. In 2005, the Arboviral disease surveillance case definitions and categories were revised. The nationally notifiable Arboviral encephalitis and meningitis conditions continued to be nationally notifiable in 2005 and 2006, but under the category of Arboviral neuroinvasive disease. In addition, in 2005, nonneuroinvasive domestic Arboviral diseases for the six domestic arboviruses listed above were added to the list of nationally notifiable diseases. ††† The antihepatitis C virus antibody test became available in May 1990. Data on hepatitis B, perinatal infection, hepatitis B chronic, and hepatitis C virus infection (past or present) are not included because they are undergoing data quality review. §§§ Totals reported to the Division of Influenza, National Center for Immunization and Respiratory Diseases (NCIRD), as of December 31, 2011. ¶¶¶ National surveillance case definition revised in 2008; probable cases not previously reported. **** To help public health specialists monitor the impact of the new meningococcal conjugate vaccine (Menactra(r), licensed in the United States in January 2005), the data display for meningococcal disease was modified to differentiate the fraction of the disease that is potentially vaccine preventable (serogroups A, C, Y, W-135) from the nonvaccine preventable fraction of disease (serogroup B and others). †††† Cases of vaccine-associated paralytic poliomyelitis caused by polio vaccine virus. Numbers might not reflect changes based on retrospective case evaluations or late reports (CDC. Poliomyelitis United States, 1975–1984. MMWR 1986;35:180–2). §§§§ In 2008, Q fever acute and chronic reporting categories were recognized as a result of revision to the Q fever case definition. Before that time, case counts were not differentiated relative to acute and chronic Q fever cases. ¶¶¶¶ Severe acute respiratory syndrome–associated coronavirus disease (SARS-CoV). The total number of SARS–CoV cases includes all cases reported to the Division of Viral Diseases, National Center for Immunization and Respiratory Disease (NCIRD). ***** Revision of national surveillance case definition distinguishing between confirmed and probable cases; total case count includes two case reports with unknown case status. ††††† The previous categories of invasive pneumococcal disease among children <5 years and invasive, drug-resistant Streptococcus pneumoniae were eliminated. All cases of invasive Streptococcus pneumoniae disease, regardless of age or drug resistance, are reported under a single disease code. §§§§§ Totals reported to the Division of Tuberculosis Elimination, NCHHSTP, as of July 25, 2012. ¶¶¶¶¶ Varicella was removed from the nationally notifiable disease list in 1981. Varicella became nationally notifiable again in 2003. ****** Totals reported to the Division of Viral Diseases, National Center for Immunization and Respiratory Diseases (NCIRD), as of June 30, 2012. †††††† The last indigenous case of yellow fever was reported in 1911; all other case reports since 1911 have been imported. |
||||||||
|
TABLE 9. (Continued) Reported cases of notifiable diseases — United States, 1996–2003 |
||||||||
|---|---|---|---|---|---|---|---|---|
|
Disease |
1996 |
1997 |
1998 |
1999 |
2000 |
2001 |
2002 |
2003 |
|
Shigellosis |
25,978 |
23,117 |
23,626 |
17,521 |
22,922 |
20,221 |
23,541 |
23,581 |
|
Spotted Fever Rickettsiosis |
831 |
409 |
365 |
579 |
495 |
695 |
1,104 |
1,091 |
|
Streptococcal disease, invasive, Group A |
1,445 |
1,973 |
2,260 |
2,667 |
3,144 |
3,750 |
4,720 |
5,872 |
|
Streptococcal toxic-shock syndrome |
19 |
33 |
58 |
65 |
83 |
77 |
118 |
161 |
|
Streptococcus pneumoniae, invasive disease, |
||||||||
|
drug-resistant, all ages |
1,514 |
1,799 |
2,823 |
4,625 |
4,533 |
2,896 |
2,546 |
2,356 |
|
non-drug resistant, age <5 yrs |
§ |
§ |
§ |
§ |
§ |
498 |
513 |
845 |
|
Syphilis total, all stages§ |
52,976 |
46,540 |
37,977 |
35,628 |
31,575 |
32,221 |
32,871 |
34,270 |
|
congenital (age <1 yr) |
1,282 |
1,081 |
843 |
579 |
580 |
504 |
460 |
432 |
|
primary and secondary |
11,387 |
8,550 |
6,993 |
6,657 |
5,979 |
6,103 |
6,862 |
7,177 |
|
Tetanus |
36 |
50 |
41 |
40 |
35 |
37 |
25 |
20 |
|
Toxic-shock syndrome |
145 |
157 |
138 |
113 |
135 |
127 |
109 |
133 |
|
Trichinellosis |
11 |
13 |
19 |
12 |
16 |
22 |
14 |
6 |
|
Tuberculosis†† |
21,337 |
19,851 |
18,361 |
17,531 |
16,377 |
15,989 |
15,075 |
14,874 |
|
Tularemia |
§ |
§ |
§ |
§ |
142 |
129 |
90 |
129 |
|
Typhoid fever |
396 |
365 |
375 |
346 |
377 |
368 |
321 |
356 |
|
Varicella (chickenpox)§§ |
83,511 |
98,727 |
82,455 |
46,016 |
27,382 |
22,536 |
22,841 |
20,948 |
|
Varicella (deaths)¶¶ |
§ |
§ |
§ |
§ |
§ |
§ |
9 |
2 |
|
Yellow fever*** |
1 |
— |
— |
— |
— |
— |
1 |
— |
|
* Acquired immunodeficiency syndrome. † Cases were reported to the Division of STD Prevention, National Center for HIV/AIDS, Viral Hepatitis, STD, and TB Prevention (NCHHSTP). § Not nationally notifiable. ¶ Data for ehrlichiosis attributable to other or unspecified agents were being withheld from publication pending the outcome of discussions concerning the reclassification of certain Ehrlichia species, which will probably affect how data in this category were reported. ** The anti-hepatitis C virus antibody test became available in May 1990. †† Cases were updated through the Division of TB Elimination, NCHHSTP. §§ Varicella was removed from the nationally notifiable disease list in 1981. Certain states continued to report these cases to CDC. ¶¶ Totals reported to the Division of Viral Diseases, National Center for Immunization and Respiratory Diseases (NCIRD). *** The last indigenous case of yellow fever was reported in 1911; all other case reports since 1911 have been imported. |
||||||||
|
TABLE 10. (Continued) Reported cases of notifiable diseases* — United States, 1988–1995 |
||||||||
|---|---|---|---|---|---|---|---|---|
|
Disease |
1988 |
1989 |
1990 |
1991 |
1992 |
1993 |
1994 |
1995 |
|
Syphilis, |
||||||||
|
total, all stages |
103,437 |
110,797 |
134,255 |
128,569 |
112,581 |
101,259 |
81,696 |
68,953 |
|
congenital (age <1 yr) |
741 |
1,837 |
3,865 |
4,424 |
4,067 |
3,420 |
2,452 |
1,863 |
|
primary and secondary |
40,117 |
44,540 |
50,223 |
42,935 |
33,973 |
26,498 |
20,627 |
16,500 |
|
Tetanus |
53 |
53 |
64 |
57 |
45 |
48 |
51 |
41 |
|
Toxic-shock syndrome |
390 |
400 |
322 |
280 |
244 |
212 |
192 |
191 |
|
Trichinosis |
45 |
30 |
129 |
62 |
41 |
16 |
32 |
29 |
|
Tuberculosis |
22,436 |
23,495 |
25,701 |
26,283 |
26,673 |
25,313 |
24,361 |
22,860 |
|
Tularemia |
201 |
152 |
152 |
193 |
159 |
132 |
96 |
§ |
|
Typhoid fever |
436 |
460 |
552 |
501 |
414 |
440 |
441 |
369 |
|
Varicella |
192,857 |
185,441 |
173,099 |
147,076 |
158,364 |
134,722 |
151,219 |
120,624 |
|
* No cases of yellow fever were reported during 1988–1995. † Acquired immunodeficiency syndrome. § Cutaneous diphtheria ceased being notifiable nationally after 1979. ¶ Beginning in 1984, data were recorded by date of report to state health departments. Before 1984, data were recorded by onset date. ** Not nationally notifiable. †† The anti-hepatitis C virus antibody test became available in May 1990. |
||||||||
|
TABLE 12. Number of deaths from selected nationally notifiable infectious diseases — United States, 2003–2009 |
||||||||
|---|---|---|---|---|---|---|---|---|
|
Cause of death |
ICD-10* Cause of death code |
No. of deaths |
||||||
|
2003 |
2004 |
2005 |
2006 |
2007 |
2008 |
2009 |
||
|
AIDS† |
B20–B24 |
13,658 |
13,063 |
12,543 |
12,133 |
11,295 |
10,285 |
9,406 |
|
Anthrax |
A22 |
0 |
0 |
0 |
0 |
0 |
0 |
0 |
|
Encephalitis, arboviral |
||||||||
|
California serogroup viruses |
A83.5 |
0 |
0 |
1 |
1 |
1 |
0 |
0 |
|
Eastern equine encephalitis virus |
A83.2 |
1 |
2 |
2 |
2 |
0 |
0 |
2 |
|
Powassan virus |
A84.8 |
0 |
0 |
0 |
0 |
0 |
0 |
0 |
|
St. Louis encephalitis virus |
A83.3 |
2 |
2 |
1 |
2 |
1 |
2 |
0 |
|
Western equine encephalitis virus |
A83.1 |
0 |
0 |
0 |
0 |
0 |
0 |
0 |
|
Botulism, foodborne |
A05.1 |
6 |
0 |
5 |
3 |
6 |
4 |
3 |
|
Brucellosis |
A23 |
0 |
0 |
2 |
2 |
1 |
0 |
1 |
|
Chancroid |
A57 |
0 |
0 |
0 |
0 |
0 |
0 |
0 |
|
Chlamydia trachomatis infections |
A56 |
0 |
0 |
0 |
0 |
0 |
0 |
0 |
|
Cholera |
A00 |
0 |
0 |
0 |
0 |
1 |
0 |
1 |
|
Coccidioidomycosis |
B38 |
73 |
100 |
76 |
110 |
99 |
72 |
87 |
|
Cryptosporidiosis |
A07.2 |
0 |
1 |
2 |
2 |
2 |
3 |
2 |
|
Cyclosporiasis |
A07.8 |
0 |
0 |
0 |
0 |
0 |
0 |
0 |
|
Diphtheria |
A36 |
1 |
0 |
0 |
0 |
0 |
0 |
0 |
|
Ehrlichiosis |
A79.8 |
1 |
0 |
0 |
0 |
0 |
0 |
0 |
|
Giardiasis |
A07.1 |
0 |
1 |
0 |
1 |
0 |
1 |
0 |
|
Gonoccocal infections |
A54 |
6 |
2 |
3 |
3 |
6 |
2 |
1 |
|
Haemophilus influenzae |
A49.2 |
5 |
11 |
4 |
4 |
10 |
3 |
7 |
|
Hansen disease (leprosy) |
A30 |
2 |
5 |
1 |
1 |
2 |
2 |
1 |
|
Hantavirus pulmonary syndrome |
A98.5 |
0 |
0 |
0 |
8 |
6 |
2 |
0 |
|
Hemolytic uremic syndrome, postdiarrheal |
D59.3 |
29 |
27 |
30 |
29 |
20 |
32 |
25 |
|
Hepatitis A, viral, acute |
B15 |
54 |
58 |
43 |
34 |
34 |
37 |
26 |
|
Influenza-associated pediatric mortality |
J10, J11 |
146 |
51 |
61 |
62 |
71 |
78 |
165 |
|
Legionellosis |
A48.1 |
98 |
72 |
78 |
91 |
67 |
92 |
104 |
|
Listeriosis |
A32 |
33 |
37 |
31 |
30 |
34 |
28 |
29 |
|
Lyme disease |
A69.2, L90.4 |
4 |
6 |
7 |
5 |
8 |
10 |
12 |
|
Malaria |
B50-B54 |
4 |
8 |
6 |
9 |
5 |
5 |
3 |
|
Measles |
B05 |
1 |
0 |
1 |
0 |
0 |
0 |
2 |
|
Meningococcal disease |
A39 |
161 |
138 |
123 |
105 |
87 |
102 |
99 |
|
Mumps |
B26 |
0 |
0 |
0 |
1 |
0 |
2 |
2 |
|
Pertussis |
A37 |
11 |
16 |
31 |
9 |
9 |
20 |
15 |
|
Plague |
A20 |
0 |
1 |
1 |
3 |
2 |
0 |
1 |
|
Poliomyelitis |
A80 |
0 |
0 |
0 |
0 |
0 |
0 |
0 |
|
Psittacosis |
A70 |
0 |
0 |
0 |
0 |
0 |
0 |
0 |
|
Q fever |
A78 |
1 |
1 |
2 |
2 |
4 |
0 |
1 |
|
Rabies, human |
A82 |
2 |
3 |
1 |
2 |
1 |
2 |
4 |
|
Rocky Mountain spotted fever |
A77.0 |
9 |
5 |
6 |
4 |
4 |
4 |
8 |
|
Rubella |
B06 |
0 |
1 |
0 |
0 |
1 |
0 |
1 |
|
Rubella, congenital syndrome |
P35.0 |
4 |
5 |
8 |
2 |
4 |
5 |
4 |
|
Salmonellosis |
A02 |
43 |
30 |
30 |
34 |
30 |
42 |
26 |
|
Shiga toxin-producing Escherichia coli (STEC) |
A04.0–A04.4 |
2 |
4 |
5 |
3 |
3 |
1 |
3 |
|
Shigellosis |
A03 |
2 |
0 |
9 |
3 |
4 |
3 |
4 |
|
Smallpox |
B03 |
0 |
0 |
0 |
0 |
0 |
0 |
0 |
|
Streptococcal disease, invasive, group A |
A40.0, A49.1 |
115 |
121 |
118 |
117 |
144 |
143 |
148 |
|
Streptococcus pneumoniae, invasive disease (restricted to age <5 years) |
A40.3, B95.3, J13 |
15 |
13 |
12 |
22 |
12 |
20 |
18 |
|
Syphilis, total, all stages |
A50–A53 |
34 |
43 |
47 |
38 |
42 |
34 |
34 |
|
Tetanus |
A35 |
4 |
4 |
1 |
4 |
5 |
3 |
6 |
|
Toxic-shock syndrome (other than streptococcal) |
A48.3 |
71 |
71 |
55 |
57 |
18 |
20 |
21 |
|
Trichinellosis |
B75 |
0 |
0 |
0 |
1 |
0 |
0 |
0 |
|
Tuberculosis |
A16–A19 |
711 |
657 |
648 |
652 |
554 |
585 |
529 |
|
Tularemia |
A21 |
2 |
1 |
0 |
0 |
2 |
1 |
3 |
|
Typhoid fever |
A01.0 |
0 |
0 |
0 |
0 |
0 |
2 |
0 |
|
Varicella |
B01 |
16 |
19 |
13 |
18 |
14 |
18 |
22 |
|
Yellow fever§ |
A95 |
0 |
0 |
0 |
0 |
0 |
0 |
0 |
|
Source: CDC. CDC WONDER Compressed Mortality files (http://wonder.cdc.gov/mortSQL.html) provided by the National Center for Health Statistics. National Vital Statistics System, 2003–2009. Underlying causes of death are classified according to ICD 10. Data for 2010–2012 are not available. Data are limited by the accuracy of the information regarding the underlying cause of death indicated on death certificates and reported to the National Vital Statistics System. * World Health Organization. International Statistical Classification of Diseases and Related Health Problems. Tenth Revision, 1992. † Acquired immunodeficiency syndrome. § For one fatality, the cause of death was erroneously reported as yellow fever in the National Center for Health Statistics dataset for 2003. Subsequent investigation has determined that this death did not result from infection with wild-type yellow fever virus, and it is therefore not included in this table. |
||||||||
Selected Reading for 2011
General
Adekoya N. Nationally notifable disease surveillance (NNDSS) and the Healthy People 2010 objectives. The eJournal of the South Carolina Medical Association 2005;101:e68--72. Available at http://www.scmanet.org/Downloads/e-Journal/SCMA_eJournal_March05.pdf.
Armstrong KE, McNabb S, Ferland LD, et al. Capacity of public health surveillance to comply with revised international health regulations, USA. Emerg Infect Dis 2010;5:804--8.
Baker MG, Fidler DP. Global public health surveillance under new international health regulations. Emerg Infect Dis 2006;12:1058--65.
Bayer R, Fairchild AL. Public health: surveillance and privacy. Science 2000;290:1898--9.
CDC. Racial disparities in nationally notifiable diseases---United States, 2002. MMWR 2005;54:9--11.
CDC. Case definitions for infectious conditions under public health surveillance. MMWR 1997;46(No. RR-10). Additional information available at http://www.cdc.gov/epo/dphsi/casedef/index.htm.
CDC. Framework for program evaluation in public health. MMWR 1999;48(No. RR-11).
CDC. Manual of procedures for the reporting of nationally notifiable diseases to CDC. Atlanta, GA: US Department of Health and Human Services, Public Health Service, CDC; 1995.
CDC. Manual for the surveillance of vaccine-preventable diseases. 3rd ed. Atlanta, GA: US Department of Health and Human Services, Public Health Service, CDC; 2002. Available at http://www.cdc.gov/nip/publications/surv-manual.
CDC. National Electronic Disease Surveillance System (NEDSS): a standards-based approach to connect public health and clinical medicine. J Public Health Manag Practice 2001;7:43--50.
CDC. Public Health Information Network (PHIN): overview. Atlanta, GA: US Department of Health and Human Services, CDC; 2006. Available at http://www.cdc.gov/phin/overview.html.
CDC. Sexually transmitted disease surveillance, 2010. Atlanta, GA: US Department of Health and Human Services, CDC; 2011. Available at http://www.cdc.gov/std/stats.
CDC. Sexually transmitted diseases treatment guidelines, 2010. MMWR 2010;59(No. RR-12).
Chang M-H, Glynn MK, Groseclose SL. Endemic, notifiable bioterrorismrelated diseases, United States, 1992--1999. Emerg Infect Dis 2003;9:556--64.
Chin JE, ed. Control of communicable diseases manual. 17th ed. Washington, DC: American Public Health Association; 2000.
Cronquist AB, Mody RK, Atkinson R, et al. Impacts of culture-independent diagnostic practices on public health surveillance for bacterial enteric pathogens. Clin Infect Dis 2012;54 (Suppl 5):S432--9.
Doyle TJ, Glynn MK, Groseclose SL. Completeness of notifiable infectious disease reporting in the United States: an analytical literature review. Am J Epidemiol 2002;155:866--74.
Effler P, Ching-Lee M, Bogard A, Ieong M-C, Nekomoto T, Jernigan D. Statewide system of electronic notifiable disease reporting from clinical laboratories: comparing automated reporting with conventional methods. JAMA 1999;282:1845--50.
Freimuth V, Linnan HW, Potter P. Communicating the threat of emerging infections to the public. Emerg Infect Dis 2000;6:337--47.
German R. Sensitivity and predictive value positive measurements for public health surveillance systems. Epidemiology 2000;11:720--7.
Gould LH, Seys S, Everstine K, et al. Recordkeeping practices of beef grinding activities at retail establishments. J Food Prot 2011;74:1022--4.
Government Accountability Office. Emerging infectious diseases: review of state and federal disease surveillance efforts. Washington, DC: Government Accountability Office; 2004. GAO-04-877. Available at http://www.gao.gov/new.items/d04877.pdf.
Hale CR, Scallan E, Cronquist AB, et al. Estimates of enteric illness attributable to contact with animals and their environments in the United States. Clin Infect Dis 2012;54 (Suppl 5):S472--9.
Hopkins RS. Design and operation of state and local infectious disease surveillance systems. J Public Health Manag Practice 2005;11:184--90. Jajosky RA, Groseclose SL. Evaluation of reporting timeliness of public health surveillance systems for infectious diseases. BMC Public Health 2004;4:29.
Jajosky R, Rey A, Park M, Aranas A, Macdonald S, Ferland L. Findings from the Council of State and Territorial Epidemiologists’ 2008 assessment of state reportable and nationally notifiable conditions in the United States and considerations for the future. J Public Health Manag Practice, 2011;17:255--64.
Koo D, Caldwell B. The role of providers and health plans in infectious disease surveillance. Eff Clin Pract 1999;2:247--52. Available at http://www.acponline.org/journals/ecp/sepoct99/koo.htm.
Koo D, Wetterhall S. History and current status of the National Notifiable Diseases Surveillance System. J Public Health Manag Pract 1996;2:4--10.
Krause G, Brodhun B, Altmann D, Claus H, Benzler J. Reliability of case definitions for public health surveillance assessed by round-robin test methodology. BMC Public Health 2006;6:129.
Lazarus R, Klompas M, Campion F, et al. Electronic support for public health: validated case finding and reporting for notifiable diseases using electronic medical data. J Am Med Inform Assoc 2009;16:18--24.
Lin SS, Kelsey JL. Use of race and ethnicity in epidemiologic research: concepts, methodological issues, and suggestions for research. Epidemiol Rev 2000;22:187--202.
Martin SM, Bean NH. Data management issues for emerging diseases and new tools for managing surveillance and laboratory data. Emerg Infect Dis 1995;1:124--8.
McNabb S, Chungong S, Ryan M, et al. Conceptual framework of public health surveillance and action and its application in health sector reform. BMC Public Health 2002;2:2.
McNabb S, Surdo A, Redmond A, et al. Applying a new conceptual framework to evaluate tuberculosis surveillance and action performance and measure the costs, Hillsborough County, Florida, 2002. Ann Epidemiol 2004;14:640--5.
Miller MA, Sentz J, Rabaa MA, et al. Global epidemiology of infections due to Shigella, Salmonella serotype Typhi, and enterotoxigenic Escherichia coli. Epidemiol Infect 2008;136:433--5.
Niskar AS, Koo D. Differences in notifiable infectious disease morbidity among adult women---United States, 1992--1994. J Womens Health 1998;7:451--8.
Overhage JM, Grannis S, McDonald CJ. A comparison of the completeness and timeliness of automated electronic laboratory reporting and spontaneous reporting of notifiable conditions. Am J Public Health 2008;98:344--50.
Panackal AA, M’ikanatha NM, Tsui FC, et al. Automatic electronic laboratory- based reporting of notifiable infectious diseases at a large health system. Emerg Infect Dis 2002;8:685--91.
Pinner RW, Koo D, Berkelman RL. Surveillance of infectious diseases. In: Lederberg J, Alexander M, Bloom RB, eds. Encyclopedia of microbiology. 2nd ed. San Diego, CA: Academic Press; 2000.
Pinner RW, Jernigan DB, Sutliff SM. Electronic laboratory-based reporting for public health. Mil Med 2000;165(Suppl 2):20--4.
Roush S, Birkhead G, Koo D, Cobb A, Fleming D. Mandatory reporting of diseases and conditions by health care professionals and laboratories. JAMA 1999;282:164--70.
Roush S, Murphy T. Historical comparisons of morbidity and mortality for vaccine-preventable diseases in the United States. JAMA 2007;298:2155--63. Silk, BJ, Berkelman RL. A review of strategies for enhancing the completeness of notifiable disease reporting. J Public Health Manag Practice 2005;11:191--200.
Scallan E, Hoekstra RM, Angulo FJ, et al. Foodborne illness acquired in the United States---major pathogens. Emerg Infect Dis 2011;17:7--15.
Scallan E, Griffin PM, Angulo FJ, et al. Foodborne illness acquired in the United States---unspecified agents. Emerg Infect Dis 2011;17:16--22.
Taylor EV, Holt KG, Mahon BE, et al. Ground beef consumption patterns in the United States, FoodNet, 2006 through 2007. J Food Prot 2012;75:341--6.
Teutsch SM, Churchill RE, eds. Principles and practice of public health surveillance. 2nd ed. New York, NY: Oxford University Press; 2000.
Thacker SB, Choi K, Brachman PS. The surveillance of infectious diseases. JAMA 1983;249:1181--5.
Anthrax
Blackburn JK, McNyset KM, Curtis A, Hugh-Jones ME. Modeling the geographic distribution of Bacillus anthracis, the causative agent of anthrax disease, for the contiguous United States using predictive ecological niche modeling. Am J Trop Med Hyg 2007;77:110--10.
Stern EJ, Uhde KB, Shadomy SV, Messonnier N. Conference report on public health and clinical guidelines for anthrax. Emerg Infect Dis 2008;14. Available at http://www.cdcnc.gov/eid/article/14/4/07-0969_article.htm.
Domestic Arboviral, Neuroinvasive and Nonneuroinvasive
Gibney KB, Colborn J, Baty S, et al. Modifiable risk factors for West Nile virus infection during an outbreak---Arizona, 2010. Am J Trop Med Hyg 2012;86:895--901.
Lindsey NP, Brown JA, ArboNET Evaluation Working Group, et al. State health department perceived utility of and satisfaction with ArboNET, the U.S. national arboviral surveillance system. Public Health Rep 2012;127:383--90.
Lindsey NP, Staples JE, Lehman JA, Fischer M. Medical risk factors for severe West Nile virus disease, United States, 2008--2010. Am J Trop Med Hyg 2012;87:179--84.
Lindsey NP, Sejvar JJ, Bode AV, Pape WJ, Campbell GL. Delayed mortality in a cohort of persons hospitalized with West Nile virus disease in Colorado in 2003. Vector Borne Zoonotic Dis 2012;12:230--5.
Reimann CA, Hayes EB, DiGuiseppi C, et al. Epidemiology of neuroinvasive arboviral disease in the United States, 1999--2007. Am J Trop Med Hyg 2008;79:974--9.
Weber I, Lindsey N, Bunko-Patterson A, et al. Completeness of West Nile virus testing among patients with meningitis and encephalitis during an outbreak in Arizona. Epidemiol Infect 2012;140:1632--6.
Botulism
Arnon SS, Barzilay EJ. Clostridial infections: botulism and infant botulism. In: Pickering LK, Baker CJ, Kimberlin DW, Long SS, eds. The Red Book: 2009 report of the Committee on Infectious Diseases. Elk Grove Village, IL: American Academy of Pediatrics; 2009:259--62.
Barzilay, EJ. Botulism and intestinal botulism. In: DL Heymann, ed. Control of communicable diseases manual. Washington, DC: American Public Health Association Press; 2008.
CDC. Infant botulism---New York City, 2001--2002. MMWR 2003;52:21--4.
Newkirk RW, Hedberg CW. Rapid detection of foodborne botulism outbreaks facilitated by epidemiological linking of cases: implications for food defense and public health response. Foodborne Pathog Dis 2012;9:150--5.
Sobel J. Botulism. Clin Infect Dis 2005;41:1167--73.
Sobel J, Tucker N, McLaughlin J, Maslanka S. Foodborne botulism in the United States, 1990--2000. Emerg Infect Dis 2004;10:1606--12.
Shapiro RL, Hatheway C, Swerdlow DL. Botulism in the United States: a clinical and epidemiologic review. Ann Intern Med 1998;129:221--8.
Shapiro RL, Hatheway C, Becher J, Swerdlow DL. Botulism surveillance and emergency response: a public health strategy for a global challenge. JAMA 1997;278:433--5.
Brucellosis
Ashford DA, di Pietra J, Lingappa J, et al. Adverse events in humans associated with accidental exposure to the livestock brucellosis vaccine RB51. Vaccine 2004;22:3435--9.
CDC. Brucellosis (Brucella melitensis, abortus, suis, and canis). Atlanta, GA: US Department of Health and Human Services, CDC; 2010. Available at http://www.cdc.gov/nczved/divisions/dfbmd/diseases/brucellosis.
CDC. Brucellosis case definition. Atlanta, GA: US Department of Health and Human Services, CDC; 2010. Available at http://www.cdc.gov/osels.
CDC. Laboratory-acquired brucellosis---Indiana and Minnesota, 2006. MMWR 2008;57:39--42.
Chomel BB, DeBess EE, Mangiamele DM, et al. Changing trends in the epidemiology of human brucellosis in California from 1973 to 1992: a shift toward foodborne transmission. J Infect Dis 1994;170:1216--23.
Glynn MK, Lynn TV. Brucellosis. J Am Vet Med Assoc 2008;233:900--8.
Yagupsky P, Baron EJ. Laboratory exposures to Brucellae and implications for bioterrorism. Emerg Infect Dis 2005;11:1180--5.
Chancroid
DiCarlo RP, Armentor BS, Martin DH. Chancroid epidemiology in New Orleans men. J Infect Dis 1995;172:446--52.
Mertz KJ, Weiss JB, Webb RM, et al. An investigation of genital ulcers in Jackson, Mississippi, with use of a multiplex polymerase chain reaction assay: high prevalence of chancroid and human immunodeficiency virus infection. J Infect Dis 1998;178:1060--6.
Mertz KJ, Trees D, Levine WC, et al. Etiology of genital ulcers and prevalence of human immunodeficiency virus coinfection in 10 US cities. The Genital Ulcer Disease Surveillance Group. J Infect Dis 1998;178:1795--8.
Chlamydia trachomatis infection
CDC. Sexually transmitted disease surveillance, 2011. Atlanta, GA: US Department of Health and Human Service; 2012.
CDC. Sexually transmitted diseases treatment guidelines, 2010. MMWR 2010;59(No. RR-12).
Datta SP, Sternberg M, Johnson RE, et al. Gonorrhea and chlamydia in the United States among persons 14 to 39 years of age, 1999 to 2002. Ann Intern Med 2007;147:89--96.
Satterwhite CL, Joesoef MR, Datta SD, Weinstock H. Estimates of Chlamydia trachomatis infections among men: United States. Sex Transm Dis 2007;35:S3--7.
Satterwhite CL, Tian LH, Braxton J, Weinstock H. Chlamydia prevalence among women and men entering the National Job Training Program: United States, 2003--2007. Sex Transm Dis 2010;37:63--7.
Cholera
Besser RE, Feikin DR, Eberhart-Phillips JE, Mascola L, Griffin PM. Diagnosis and treatment of cholera in the United States. Are we prepared? JAMA 1994;272:1203--5.
Newton AE, Heiman KE, Schmitz A, et al. Cholera in United States associated with epidemic in Hispaniola. Emerg Infect Dis 2011;17:2166--8.
Siddique AK, Nair GB, Alam M, et al. El Tor cholera with severe disease: a new threat to Asia and beyond. Epidemiol Infect 2010;138:347--52.
Steinberg EB, Greene KD, Bopp CA, et al. Cholera in the United States, 1995--2000: trends at the end of the twentieth century. J Infect Dis 2001;184:799--802.
Tappero J, Tauxe RV. Lessons learned during public health response to cholera epidemic in Haiti and the Dominican Republic. Emerg Infect Dis 2011;17:2087--93.
World Health Organization. Cholera, 2011. Wkly Epidemiol Rec 2012;87:289--304.
Coccidioidomycosis
Chen S, Erhart L, Anderson S, et al. Coccidioidomycosis: knowledge, attitudes, and practices among healthcare providers---Arizona, 2007. Medical Mycol 2011;49:649--56.
Hector RF, Rutherford GW, Tsang CA, et al. The public health impact of coccidioidomycosis in Arizona and California. Int J Environ Res Public Health 2011;4:1150--73.
Seitz AE, Prevots R, Holland SM. Hospitalizations associated with disseminated coccidioidomycosis, Arizona and California, USA. Emerg Infect Dis 2012;18:1476--8.
Cryptosporidiosis
CDC. Diagnostic procedures for stool specimens. Atlanta, GA: US Department of Health and Human Services, CDC; 2009. Available at http://www.dpd.cdc.gov/dpdx/HTML/DiagnosticProcedures.htm.
Roy SL, DeLong SM, Stenzel S, et al. Risk factors for sporadic cryptosporidiosis among immunocompetent persons in the United States from 1999 to 2001. J Clin Microbiol 2004;42:2944--51.
Yoder JS, Beach MJ. Cryptosporidium surveillance and risk factors in the United States. Exp Parasitol 2010;124:31--9.
Cyclosporiasis
Hall RL, Jones JL, Hurd S, et al. Population-based active surveillance for Cyclospora infection---United States, Foodborne Diseases Active Surveillance Network (FoodNet), 1997--2009. Clin Infect Dis 2012;54 (Suppl 5):S411--7.
Ortega YR, Sanchez R. Update on Cyclospora cayetanensis, a food-borne and waterborne parasite. Clin Microbiol Rev 2010;23:218--34.
Herwaldt BL. The ongoing saga of US outbreaks of cyclosporiasis associated with imported fresh produce: what Cyclospora cayetanensis has taught us and what we have yet to learn. In: Institute of Medicine. Addressing foodborne threats to health: policies, practices, and global coordination. Washington, DC: The National Academies Press; 2006:85--115, 133--40.
Herwaldt BL. Cyclospora cayetanensis: a review, focusing on the outbreaks of cyclosporiasis in the 1990s. Clin Infect Dis 2000;31:1040--57.
Diphtheria
Dewinter LM, Bernard KA, Romney MG. Human clinical isolates of Corynebacterium diphtheriae and Corynebacterium ulcerans collected in Canada from 1999 to 2003 but not fitting reporting criteria for cases of diphtheria. Clin Microbiol 2005;43:3447--9.
Ehrlichiosis and Anaplasmosis
CDC. Anaplasmosis and Ehrlichiosis---Maine, 2008. MMWR 2009: 58:1033--6.
Walker D. Rickettsiae and rickettsial infections: the current state of knowledge. Clin Infect Dis 2007 ;45 (Suppl 1):539--44.
Dumler JS, Madigan JE, Pusterla N, Bakken JS. Ehrlichioses in humans: epidemiology, clinical presentation, diagnosis, and treatment. Clin Infect Dis 2007;45 (Suppl 1):545--51.
Demma LJ, Holman RC, McQuiston JH, Krebs JW, Swerdlow DL. Epidemiology of human ehrlichiosis and anaplasmosis in the United States, 2001--2002. Am J Trop Med Hyg 2005;73:400--9.
Giardiasis
Cantey PT, Roy S, Lee B, et al. Study of nonoutbreak giardiasis: novel findings and implications for research. Am J Med. 2011;124:1175.e1--8.
Clinical and Laboratory Standards Institute. Procedures for the recovery and identification of parasites from the intestinal tract; approved guideline. CLSI document M28-A2 Second Edition ed. Wayne, PA: Clinical and Laboratory Standards Institute; 2005.
Gonorrhea
CDC. Sexually transmitted disease surveillance, 2011. Atlanta, GA: US Department of Health and Human Services; 2012.
CDC. Sexually transmitted diseases treatment guidelines, 2010. MMWR 2010;59(No. RR-12).
Datta SD, Sternberg M, Johnson RE, et al. Gonorrhea and chlamydia in the United States among persons 14 to 39 years of age, 1999 to 2002. Ann Int Med 2007;147:89--96.
Haemophilus influenzae, Invasive Disease
MacNeil JR, Cohn AC, Farley M, et al. Current epidemiology and trends in Invasive Haemophilus influenzae disease---United States, 1989--2008. Clin Infect Dis 2011:53:1230--6.
Briere E, Jackson M, Shah S, et al. Haemophilus influenzae type b disease and vaccine booster dose deferral, United States, 1998--2009. Pediatrics 2012;130:1--7.
Schuchat A, Messonnier NR. From pandemic suspect to the postvaccine era: the Haemophilus influenzae story. Clin Infect Dis 2007;44:817--9.
Hansen Disease (Leprosy)
Britton WJ, Lockwood NJ. Leprosy. Lancet 2004;363:1209--19.
Bruce S, Schroeder TL, Ellner K, et al. Armadillo exposure and Hansen’s disease: an epidemiologic survey in southern Texas. J Am Acad Dermatol 2000;43(2 Pt 1):223--8.
Hartzell JD, Zapor M, Peng S, Straight T. Leprosy: a case series and review. South Med J 2004;97:1252--6.
Hastings R, ed. Leprosy. 2nd ed. New York, NY: Churchill Livingstone; 1994.
Joyce MP, Scollard DM. Leprosy (Hansen’s disease). In: Rakel RE, Bope ET, eds. Conn’s current therapy 2004: latest approved methods of treatment for the practicing physician. 56th ed. Philadelphia, PA: Saunders; 2004:100--5.
Ooi WW, Moschella SL. Update on leprosy in immigrants in the United States: status in the year 2000. Clin Infect Dis 2001;32:930--7.
Scollard DM, Adams LB, Gillis TP, et al. The continuing challenges of leprosy. Clin Microbiol Rev 2006;19:338--81.
Hantavirus pulmonary syndrome
Khan AS, Khabbaz RF, Armstrong LR, et al. Hantavirus pulmonary syndrome---the first 100 US cases. J Infect Dis 1996;173:1297--1303.
Knust B, MacNeil A, Rollin PE. Hantavirus pulmonary syndrome clinical findings: evaluating a surveillance case definition. Vector Borne Zoonotic Dis 2012;12:393--9.
MacNeil A, Ksiazek TG, Rollin PE. Hantavirus pulmonary syndrome, United States, 1993--2009. Emerg Infect Dis 2011;1195--1201.
MacNeil A, Nichol ST, Spiropoulou CF. Hantavirus pulmonary syndrome. Virus Res 2011;138--47.
Hemolytic Uremic Syndrome, Postdiarrheal
Banatvala N, Griffin PM, Greene KD, et al. The United States prospective hemolytic uremic syndrome study: microbiologic, serologic, clinical, and epidemiologic findings. J Infect Dis 2001;183:1063--70.
Gould L, Demma L, Jones TF, et al. Hemolytic uremic syndrome and death in persons with Escherichia coli O157:H7 infection, Foodborne Diseases Active Surveillance Network Sites, 2000--2006. Clin Infect Dis 2009;49:1480--5.
Ong KL, Apostal M, Comstock N, et al. Strategies for surveillance of pediatric hemolytic uremic syndrome: Foodborne Diseases Active Surveillance Network (FoodNet), 2000--2007. Clin Infect Dis 2012;54 (Suppl 5):S424--31.
Tarr PI, Gordon CA Chandler WL. Shiga toxin-producing Escherichia coli and haemolytic uraemic syndrome. Lancet 2005;365:1073--86.
Hepatitis A
Klevens RM, Kruszon-Moran D, Wasley A, et al. Seroprevalence of Hepatitis A virus antibodies in the United States: results from the National Health and Nutrition Examination Survey. Public Health Rep 2011;126:522--32.
Hepatitis B
Kowdley KV, Wang CC, Welch S, Roberts H, Brosgart CL. Prevalence of chronic hepatitis B among foreign-born persons living in the United States by country of origin. Hepatology 2011;422--33.
Ott JJ, Stevens GA, Groeger J, Wiersma ST. Global epidemiology of hepatitis B virus infection: new estimates of age-specific HBsAg seroprevalence and endemicity. Vaccine 2012;30:2212--9.
Hepatitis C
Denniston MM, Klevens RM, McQuillan GM, Jiles RB. Awareness of infection, knowledge of hepatitis C, and medical follow-up among individuals testing positive for hepatitis C: National Health and Nutrition Examination Survey 2001--2008. Hepatology 2012;55:1652--61.
Klevens RM, Hu DJ, Jiles R, Holmberg SD. Evolving epidemiology of hepatitis C virus in the United States. Clin Infect Dis 2012 (Suppl 1);55:S3--9.
Moorman AC, Gordon SC, Rupp LB, et al. Baseline population characteristics and mortality among people in care for chronic viral hepatitis, 2006--2008: The Chronic Hepatitis Cohort Study (CHeCS). Clin Infect Dis 2013;56:40--50.
Spradling PR, Rupp L, Moorman AC, et al. Hepatitis B and C virus infection among 1.2 million persons with access to care: factors associated with testing and infection prevalence. Clin Infect Dis 2012;55:1047--55.
Influenza-Associated Pediatric Mortality
Bhat N, Wright JG, Broder KR, et al. Influenza-associated deaths among children in the United States, 2003--2004. N Engl J Med 2005;352:2559--67.
Blanton, L, Peacock G, Cox CM, et al. Neurologic disorders among pediatric deaths associated with the 2009 pandemic influenza. Pediatrics 2012;130:390--6.
Council of State and Territorial Epidemiologists. Influenza-associated pediatric mortality, 2004. Atlanta, GA: Council of State and Territorial Epidemiologists; 2004. Available at http://c.ymcdn.com/sites/www.cste.org/resource/resmgr/PDFs/CSTENotifiableConditionListA.pdf.
Council of State and Territorial Epidemiologists. Position statement 04-ID-04: influenza-associated pediatric mortality 2004. Atlanta, GA: Council of State and Territorial Epidemiologists; 2004. Available at http://c.ymcdn.com/sites/www.cste.org/resource/resmgr/PDFs/CSTENotifiableConditionListA.pdf.
Cox CM, Blanton L, Dhara R, Brammer L, Finelli L. 2009 pandemic influenza A (H1N1) deaths among children---United States, 2009--2010. Clin Infect Dis 2011;52:S69--74.
Guarner J, Paddock CD, Shieh WJ, et al. Histopathologic and immunohistochemical features of fatal influenza virus infection in children during the 2003--2004 season. Clin Infect Dis 2006:43;132--4.
Finelli L, Fiore A, Dhara R, et al. Influenza-associated pediatric mortality in the United States: increase of Staphylococcus aureus coinfection. Pediatrics 2008;122:805--11.
Peebles PJ, Dhara R, Brammer L, Fry AM, Finelli L. Influenza-associated mortality among children---United States: 2007--2008. Influenza Other Respi Viruses 2011;5:25--31.
Legionellosis
CDC. Legionellosis---United States, 2000--2009. MMWR 2011;60:1083--6.
European Centre for Disease Prevention and Control. Legionnaires disease in Europe, 2010. Stockholm, ECDC; 2012. Available at http://ecdc.europa.eu/en/publications/Publications/SUR-Legionnaires-disease-surveillance-2010.pdf.
European Working Group on Legionella Infections (EWGLI). EWGLI technical guidelines for the investigation, control, and prevention of travel associated Legionnaires’ disease. London, UK: United Kingdom Health Protection Agency; 2011. Available at http://ecdc.europa.eu/en/activities/surveillance/ELDSNet/Documents/EWGLI-Technical-Guidelines.pdf.
Fields BS, Benson RF, Besser RE. Legionella and Legionnaires’ disease: 25 years of investigation. Clin Microbiol Rev 2002;15:506--26.
Marston BJ, Lipman HB, Breiman RF. Surveillance for Legionnaires’ disease: risk factors for morbidity and mortality. Arch Intern Med 1994;154:2417--22.
Neil K, Berkelman R. Increasing incidence of legionellosis in the United States: changing epidemiological trends. Clin Infect Dis 2008;47:591--9.
Listeriosis
Gottlieb SL, Newbern EC, Griffin PM, et al. Multistate outbreak of listeriosis linked to turkey deli meat and subsequent changes in US regulatory policy. Clin Infect Dis 2006;42:29--36.
Jackson KA, Biggerstaff M, Tobin-D’Angelo M, et al. Multistate outbreak of Listeria monocytogenes associated with Mexican-style cheese made from pasteurized milk among pregnant, Hispanic women. J Food Prot 2011;74:949--53.
Jackson KA, Iwamoto M, Swerdlow DL. Pregnancy-associated listeriosis. Epidemiol Infect 2010;138:1503--9.
Laksanalamai P, Joseph LA, Silk BJ, et al. Genomic characterization of Listeria monocytogenes strains involved in a multistate listeriosis outbreak associated with cantaloupe in US. PloS ONE 2012;7:e42448.
Pouillot R, Hoelzer K, Jackson KA, et al. Relative risk of listeriosis in Foodborne Diseases Active Surveillance Network (FoodNet) sites according to age, pregnancy, and ethnicity. Clin Infect Dis 2012;54:S396--404.
Scallan E, Hoekstra RM, Angulo FJ, et al. Foodborne illness acquired in the United States--- major pathogens. Emerg Infect Dis 2011;17:7--15.
Silk BJ, Date KA, Jackson KA, et al. Invasive listeriosis in the Foodborne Diseases Active Surveillance Network (FoodNet), 2004--2009: Further targeted prevention needed for higher-risk groups. Clin Infect Dis 2012;54:S395--404.
Slutsker L, Schuchat A. Listeriosis in humans. In: Ryser ET Marth EH, eds. Listeria, listeriosis, and food safety. 2nd ed. New York, NY: Marcel Dekker, Inc.; Little, Brown and Company; 1999:75--95.
Swaminathan B, Gerner-Smidt P. The epidemiology of human listeriosis. Microbes Infect 2007;9:1236--43.
Voetsch AC, Angulo FJ, Jones TF, et al. Reduction in the incidence of invasive listeriosis in Foodborne Diseases Active Surveillance Network Sites, 1996--2003. Clin Infect Dis 2007;44:513--20.
Lyme disease
Stafford KC III. Tick management handbook: an integrated guide for homeowners, pest control operators, and public health officials for the prevention of tick-associated disease. New Haven, CT: Connecticut Agricultural Experiment Station; 2004. Available at http://www.cdc.gov/ncidod/dvbid/lyme/resources/handbook.pdf.
Connally NP, Durante AJ, Yousey-Hindes KM, et al. Peridomestic Lyme disease prevention: results of a population-based case-control study. Am J Prev Med 2009;37:201--6.
Hayes EG, Piesman J. How can we prevent Lyme disease? N Engl J Med 2003;348:2424--30.
CDC. Caution regarding testing for Lyme disease. MMWR 2005;54:125.
Wormser GP, Dattwyler RJ, Shapiro ED, et al. The clinical assessment, treatment, and prevention of Lyme disease, human granulocytic, anaplasmosis, and babesiosis: clinical practice guidelines by the Infectious Disease Society of America. Clin Infect Dis 2006;43:1089--1134.
Malaria
Mali S, Kachur SP, Arguin PM. Malaria surveillance---United States, 2010. MMWR 2012. 61(SS02);1--17.
Abanyie FA, Agguin PM, Gutman J. State of malaria diagnostic testing at clinical laboratories in the United States, 2010: a nationwide survey. Malar J 2011;10:340.
Krause G. et al. Chemoprophylaxis and malaria death rates. Emerg Infect Dis 2006;12:447--51.
Jensenius M, Han PV, Schlagenhauf P, et al. Acute and potentially life-threatening tropical diseases in western travelers---a GeoSentinel multicenter study, 1996--2011. Am J Trop Med 2013;88:397--404.
Measles
CDC. Measles---United States, January--July 2008. MMWR 2008;57:893--6.
Sugerman DE, Barskey AE. Measles outbreak in a highly vaccinated population, San Diego 2008: role of the intentionally unvaccinated. Pediatrics 2010;125:747--55.
Papania M, Hinman A, Katz S, Orenstein W, McCauley M, eds. Progress toward measles elimination---absence of measles as an endemic disease in the United States. J Infect Dis 2004;189(Suppl 1):S1--257.
Rota PA, Liffick SL, Rota JS, et al. Molecular epidemiology of measles viruses in the United States, 1997--2001. Emerg Infect Dis 2002;8:902--8.
CDC. Outbreak of measles---San Diego, California, January--February 2008. MMWR 2008;57:203--6.
Meningococcal Disease
Rosenstein NE, Perkins BA, Stephens DS, et al. Meningococcal disease. N Engl J Med 2001;334:1378--88.
Cohn AC, MacNeil JR, Harrison LH, et al. Changes in Neisseria meningitidis disease epidemiology in the United States, 1998--2007: implications for prevention of meningococcal disease. Clin Infect Dis 2010;50:184--91.
Mumps
CDC. Mumps outbreak---New York, New Jersey, Quebec, 2009. MMWR 2009;58:1270--4.
Barskey AE, Glasser JW, LeBaron CW. Mumps resurgence in the United States: a historical perspective on unexpected elements. Vaccine 2009; 27:6186--95.
Dayan G, Quinlisk P, Parker AA, et al. Recent resurgence of mumps in the United States. New Engl J Med 2008;358:1580--9.
Anderson LJ, Seward JF. Mumps epidemiology and immunity: the anatomy of a modern epidemic. Pediatr Infect Dis J 2008;27(Suppl 10):S75--9.
Bitsko RH, Cortese MM, Dayan GH, et al. Detection of RNA of mumps virus during an outbreak in a population with high level of measles, mumps, and rubella vaccine coverage. J Clin Microbiol 2008;46:1101--3.
Marin M, Quinlisk P, Shimabukuro T, et al. Mumps vaccination coverage and vaccine effectiveness in a large outbreak among college students---Iowa, 2006. Vaccine 2008;26:3601--7.
CDC. Updated recommendations for isolation of persons with mumps. MMWR 2008;57:1103--5.
Novel influenza A virus
Duchatez MF, Hause B, Stigger-Rosser E, et al. Multiple reassortment between pandemic (H1N1) 2009 and endemic influenza viruses in pigs, United States. Emerg Infect Dis 2011;17:1624--9.
Myers KP, Olsen CW, Gray GC. Cases of swine influenza in humans: a review of the literature. Clin Infect Dis 2007;44:1084--8.
Olsen CW. The emergence of novel swine influenza viruses in North America. Virus Res 2002;85:199--210.
Shinde V, Bridges CB, Uyeki TM, et al. Triple-reassortant swine influenza A (H1) in humans in the United States, 2005--2009. N Engl J Med 2009; 360:2616--25.
Vincent AL, Swenson SL, Lager KM, et al. Characterization of an influenza A virus isolated from pigs during an outbreak of respiratory disease in swine and people during a county fair in the United States. Vet Microbiol 2009;137:51--9.
Vincent AL, Ma W, Lager KM, et al. Swine influenza viruses: a North American perspective. Adv Virus Res 2008;72:127--54.
Pertussis
Clark TA, Messonnier NE, Hadler SC. Pertussis control: time for something new? Trends Microbiol 2012 May;20:211--3. [Epub ahead of print]
Mandal S, Tatti KM, Woods-Stout D, et al. Pertussis pseudo-outbreak linked to specimens contaminated by Bordetella pertussis DNA from clinic surfaces. Pediatrics 2012;129:e424--30.
Skoff TH, Cohn AC, Clark TA, Messonnier NE, Martin SW. Early impact of the US Tdap vaccination program on pertussis trends. Arch Pediatr Adolesc Med 2012;166:344--9.
Plague
CDC. Human plague---four states, 2006. MMWR 2006;55:940--3.
Dennis DT, Gage KL, Gratz N, Poland JD, Tikhomirov E. Plague manual: epidemiology, distribution, surveillance, and control. Geneva, Switzerland: World Health Organization; 1999.
Gould LH, Pape J, Ettestadt P, et al. Dog-associated risk factors for human plague. Zoonoses Public Health 2008;55:448--54.
Inglesby TV, Dennis DT, Henderson DA, et al. Plague as a biological weapon: medical and public health management. Working Group on Civilian Defense. JAMA 2000;283:2281--90.
Tourdjman M, Ibraheem M, Brett M, et al. Misidentification of Yersinia pestis by automated systems resulting in delayed diagnosis of human plague infections---Oregon and New Mexico, 2010--2011. Clin Infect Dis 2012;55:e58--60.
Poliomyelitis
Alexander LN, Seward JF, Santibanez TA, et al. Vaccine policy changes and epidemiology of polio in the United States. JAMA 2004;292:1696--702.
Psittacosis
Mitchell SL, Wolff BJ, Thacker WL, et al. Genotyping of Chlamydophila psitttaci by real time PCR and high resolution melt analysis. J Clin Microbiol 2008;47:175--81.
Q Fever
Angelakis E, Raoult D. Q fever. Vet Micro 2010;140:2--309.
Tissot-Dupont D, Raoult D. Q fever. Infect Dis Clin North Am 2008;22:505--14.
Parker N, Barralet J, Bell A. Q fever. Lancet 2006;367:679--88.
McQuiston JH, Holman RC, McCall CL, et al. National surveillance and the epidemiology of Q fever in the United States, 1978--2004. Am J Trop Med Hyg 2006;75:36--40.
Rabies
Rubella, Congenital Rubella Syndrome
Reef S, Cochi S, eds. The evidence for the elimination of rubella and congenital rubella syndrome in the United States: a public health achievement. Clin Infect Dis 2006;43 (Suppl 3):S123--68.
Salmonellosis
Barton Behravesh C, Mody RK, Jungk J, et al. 2008 outbreak of Salmonella Saintpaul infections associated with raw produce. N Engl J Med 2011; 364:918--27.
Cavallaro E, Date K, Medus C, et al. Salmonella Typhimurium Infections associated with peanut products. N Engl J Med 2011;365:601--10.
Chai SJ, White PL, Lathrop SL, et al. Salmonella enterica serotype Enteritidis: increasing incidence of domestically acquired infections. Clin Infect Dis 2012;54 (Suppl 5):S488--97.
Guo C, Hoekstra RM, Schroeder CM, et al. Application of Bayesian techniques to model the burden of human salmonellosis attributable to US food commodities at the point of processing: adaptation of a Danish model. Foodborne Pathog Dis 2011;8:509--16. [Epub 2011 ahead of print]
Jones TF, Ingram LA, Cieslak PR, et al. Salmonellosis outcomes differ substantially by serotype. J Infect Dis 2008;198:109--14.
Majowicz SE, Musto J, Scallan E, et al. The global burden of nontyphoidal Salmonella gastroenteritis. Clin Infect Dis 2010;50:882--9.
Olsen SJ, Bishop R, Brenner FW, et al. The changing epidemiology of Salmonella: trends in serotypes isolated from humans in the United States, 1987--1997. J Infect Dis 2001;183:756--61.
Scallan E, Hoekstra RM, Angulo FJ, et al. Foodborne illness acquired in the United States---major pathogens. Emerg Infect Dis 2011;17:7--15.
Sjolund-Karlsson M, Howie R, Krueger A, et al. CTX-M-producing non-Typhi Salmonella spp. isolated from humans, United States. Emerg Infect Dis 2011;17:97--9.
Severe Acute Respiratory Syndrome (SARS)
CDC. Severe Acute Respiratory Syndrome. Available at http://www.cdc.gov/sars/index.html.
World Health Organization. Severe Acute Respiratory Syndrome. Available at http://www.who.int/csr/sars/en.
Council of State and Territorial Epidemiologists. 2009 Position statement-09-ID-11: National Surveillance for Severe Acute Respiratory Syndrome. Available at http://c.ymcdn.com/sites/www.cste.org/resource/resmgr/PS/09-ID-11.pdf.
Shiga Toxin-Producing Escherichia coli
Brooks JT, Sowers EG, Wells JB, et al. Non-O157 Shiga toxin-producing Escherichia coli infections in the United States, 1983--2002. J Infect Dis 2005;192:1422--9.
Hadler JL, Clogher P, Hurd S, et al. Ten-year trends and risk factors for non-O157 shiga toxin--producing Escherichia coli found through shiga toxin testing, Connecticut, 2000--2009. Clin Infect Dis 2011;53:269--76.
Hedican EB, Medus C, Besser JM, et al. Characteristics of O157 versus non-O157 shiga toxin-producing Escherichia coli infections in Minnesota, 2000--2006. Clin Infect Dis 2009;49:358--64.
Hoefer D, Hurd S, Medus C, et al. Laboratory practices for the identification of Shiga toxin-producing Escherichia coli in the United States, FoodNet sites, 2007. Foodborne Pathog Dis 2011;8:555--60. [Epub ahead of print]
Neil KP, Biggerstaff G, MacDonald JK, et al. A novel vehicle for transmission of Escherichia coli O157:H7 to humans: multistate outbreak of E. coli O157:H7 infections associated with consumption of ready-to-bake commercial prepackaged cookie dough---United States, 2009. Clin Infect Dis 2012;54:511--8. [Epub ahead of print]
Lathrop S, Edge K, Bareta J, et al. Shiga toxin--producing Escherichia coli, New Mexico, USA, 2004--2007. Emerg Infect Dis 2009;15:1289--91.
Tarr PI, Gordon CA, Chandler WL. Shiga-toxin-producing Escherichia coli and haemolytic uraemic syndrome. Lancet 2005;365:1073--86.
Shigellosis
Arvelo W, Hinkle CJ, Nguyen TA, et al. Transmission risk factors and treatment of pediatric shigellosis during a large daycare center-associated outbreak of multidrug resistant Shigella sonnei: implications for the management of shigellosis outbreaks among children. Pediatr Infect Dis J 2009;28:976--80.
Borg ML, Modi A, Tostmann A, et al. Ongoing outbreak of Shigella flexneri serotype 3a in men who have sex with men in England and Wales, data from 2009--2011. Eurosurveill 2012;17:pii 20137.
Gupta A, Polyak CS, Bishop RD, Sobel J, Mintz ED. Laboratory-confirmed shigellosis in the United States, 1989--2002: epidemiologic trends and patterns. Clin Infect Dis 2004;38:1372--7.
Haley CC, Ong KL, Hedberg K, et al. Risk factors for sporadic shigellosis, FoodNet 2005. Foodborne Pathog Dis 2010;7:741--7.
Howie RL, Folster JP, Bowen A, et al. Reduced azithromycin susceptibility in Shigella sonnei, United States. Microb Drug Resist 2010;16:245--8. [Epub ahead of print]
Nygren B, Schilling K, Blanton E, et al. Foodborne outbreaks of shigellosis in the USA, 1998--2008. Epidemiol Infect 2012:1--9.
Shane A, Crump J, Tucker N, Painter J, Mintz E. Sharing Shigella: risk factors and costs of a multi-community outbreak of shigellosis. Arch Pediatr Adolesc Med 2003;157:601--3.
Sivapalasingam S, Nelson JM, Joyce K, et al. A high prevalence of antimicrobial resistance among Shigella isolates in the United States, 1999--2002. Antimicrob Agents Chemother 2006;50:49--54.
Spotted Fever Rickettsiosis
Dahlgren FS, Holman RC, Paddock CD, Callinan LS, McQuiston JH. Fatal Rocky Mountain spotted fever in the United States, 1999--2007. Am J Trop Med Hyg 2012;86:713--9.
Chapman AS, Murphy SM, Demma LJ, et al. Rocky Mountain spotted fever in the United States, 1997--2002. Vector Borne Zoonotic Dis 2006;6:170--8.
Demma LJ, Traeger MS, Nicholson WL, et al. Rocky Mountain spotted fever from an unexpected tick reservoir in Arizona. N Engl J Med 2005;353:587--94.
Openshaw JJ, Swerdlow DL, Krebs JW, et al. Rocky Mountain spotted fever in the United States, 2000--2007: interpreting contemporary increases in incidence. Am J Trop Med Hyg 2010;83:174--82.
Walker D. Rickettsiae and rickettsial infections: the current state of knowledge. Clin Infect Dis 2007:45(Suppl 1):539--44.
Streptococcal Toxic-Shock Syndrome
CDC. Active bacterial core surveillance report. 2010. Emerging Infections Program Network. Group A Streptococcus, 2009-Provisional. Atlanta, GA: US Department of Health and Human Services, CDC; 2010. Available at http://www.cdc.gov/abcs/reports-findings/survreports/gas09.pdf.
Martin JM, Green M. Group A Streptococcus. Seminars in pediatric infectious diseases 2006;17:140--8.
CDC. Investigating clusters of group A streptococcal disease. Atlanta, GA: US Department of Health and Human Services, CDC; 2009. Available at www.cdc.gov/strepAcalculator.
Prevention of Invasive Group A Streptococcal Infections Workshop Participants. Prevention of invasive group A streptococcal disease among household contacts of case patients among postpartum and postsurgical patients: recommendations from the Centers for Disease Control and Prevention. Clin Infect Dis 2002;35:950--9.
O’Loughlin RE, Roberson A, Cieslak PR, et al. The epidemiology of invasive group A streptococcal infections and potential vaccine implications, United States, 2000--2004. Clin Infect Dis 2007;45:853--62.
Streptococcus pneumoniae, Invasive, Drug-Resistant
Syphilis, Primary and Secondary
CDC. Sexually transmitted disease surveillance, 2011. Atlanta, GA: US Department of Health and Human Services; 2012.
CDC. Together we can. The national plan to eliminate syphilis from the United States. Atlanta, GA: US Department of Health and Human Services, CDC; 2006.
Heffelfinger JD, Swint EB, Berman SB, Weinstock HS. Trends in primary and secondary syphilis among men who have sex with men in the United States. Am J Public Health 2007;97:1076--83.
CDC. Sexually transmitted disease surveillance, 2009. Atlanta, GA: US Department of Health and Human Services, CDC; 2009.
CDC. Primary and secondary syphilis---Jefferson County, Alabama, 2002--2007. MMWR 2009;58:463--7.
Tetanus
CDC. Tetanus---Puerto Rico, 2002. MMWR 2002;51:613--5.
McQuillan GM, Kruszon-Moran D, Deforest A, Chu SY, Wharton M. Serologic immunity to diphtheria and tetanus in the United States. Ann Intern Med 2002;136:660--6.
Trichinellosis
Hall RL, Lindsay A, Hammond C, et al. Outbreak of human trichinellosis in Northern California caused by Trichinella murrelli. Am J Trop Med Hyg 2012;87:297--302.
Gottstein B, Pozio E, Nockler K. Epidemiology, diagnosis, treatment, and control of trichinellosis. Clin Microbiol 2009;22:127--45.
Gamble HR, Bessonov AS, Cuperlovic K, et al. International Commission on Trichinellosis: recommendations on methods for the control of Trichinella in domestic and wild animals intended for human consumption. Vet Parasitol 2000;93:393--408.
Tuberculosis
CDC. Reported tuberculosis in the United States, 2003. Atlanta, GA: US Department of Health and Human Services, CDC; 2004. Available at http://www.cdc.gov/nchstp/tb.
CDC. Trends in tuberculosis---United States, 2004. MMWR 2005;54:245--9.
Saraiya M, Cookson ST, Tribble P, et al. Tuberculosis screening among foreign-born persons applying for permanent US residence. Am J Public Health 2002;92:826--9.
Talbot EA, Moore M, McCray E, Binkin NJ. Tuberculosis among foreign-born persons in the United States, 1993--1998. JAMA 2000;284:2894--900.
Tularemia
CDC. Tularemia---United States, 1990--2000. MMWR 2002;51:182--4.
Dennis DT, Inglesby TV, Henderson, DA, et al. Tularemia as a biological weapon: medical and public health management. JAMA 2001;285:2763--73.
CDC. Tularemia---Missouri, 2000--2007. MMWR 2009;58:744--8.
Kugeler KJ, Mead PS, Janusz AM, et al. Molecular epidemiology of Francisella tularensis in the United States. Clin Infect Dis 2009;48:863--70.
Tarnvik A. WHO Guidelines on Tularemia. Vol. WHO/CDS/EPR/2007.7. Geneva, Switzerland: World Health Organization; 2007.
Typhoid Fever
Loharikar A, Newton A, Rowley P, et al. Typhoid fever outbreak associated with frozen mamey pulp imported from Guatemala to the western United States, 2010. Clin Infect Dis 2012;55:61--6.
Lynch MF, Blanton EM, Bulens S, et al. Typhoid fever in the United States, 1999--2006. JAMA 2009;302:898--9.
Olsen SJ, Bleasdale SC, Magnano AR, et al. Outbreaks of typhoid fever in the United States, 1960--1999. Epidemiol Infect 2003;130:13--21.
Steinberg EB, Bishop RB, Dempsey AF, et al. Typhoid fever in travelers: who should be targeted for prevention? Clin Infect Dis 2004;39:186--91.
Varicella
CDC. Evolution of varicella surveillance---selected states, 2000--2010. MMWR 2012;61:609--12.
Kattan JA, Sosa LE, Bohnwagner HD, Hadler JL. Impact of 2-dose vaccination on varicella epidemiology: Connecticut---2005--2008. J Infect Dis 2011;203:509--12.
Lopez AS, Zhang J, Brown C, Bialek S. Varicella-related hospitalizations in the United States, 2000--2006: the 1-dose varicella vaccination era. Pediatrics 2011;127:238--45.
Marin M, Zhang JX, Seward JF. Near elimination of varicella deaths in the US after implementation of the vaccination program. Pediatrics 2011;128:214--20.
Vibriosis
CDC. Vibrio mimicus infection from consuming crayfish---Spokane, Washington. MMWR 2010;59:1374.
Daniels NA, MacKinnon L, Bishop R, et al. Vibrio parahaemolyticus infections in the United States, 1973--1998. J Infect Dis 2000;181:1661--6.
Dechet A, Yu PA, Koram N, Painter J. Nonfoodborne Vibrio infections: an important cause of morbidity and mortality in the United States, 1997--2006. Clin Infect Dis 2008;46:970--6.
McLaughlin JB, DePaola A, Bopp CA, et al. Outbreak of Vibrio parahaemolyticus gastroenteritis associated with Alaskan oysters. N Engl J Med 2005;353:1463--70.
Newton A, Kendall M, Vugia DJ, Henao OL, Mahon BE. Increasing rates of vibriosis in the United States, 1996--2010: review of surveillance data from 2 systems. Clin Infect Dis 2012;54 (Suppl 5):S391--95.
Shapiro RL, Altekruse S, Hutwagner L, et al. The role of Gulf Coast oysters in warmer months in Vibrio vulnificus infections in the United States, 1998--1996. J Infect Dis 1998;178:752--9.
Tobin-D’Angelo M, Smith AR, Bulens SN, et al. Severe diarrhea caused by cholera toxin-producing Vibrio cholerae serogroup O75 infections acquired in the southeastern United States. Clin Infect Dis 2008;47:1035--40.
Viral hemorrhagic fever
Rollin PE, Nichol ST, Zaki S, Ksiazek TG. Arenaviruses and filoviruses. In: Murray PR, Baron EJ, Landry ML, Jorgensen JH, Pfaller MA, editors. Manual of Clinical Microbiology, 9th edition. Washington, DC: ASM Press; 2007:1510--22.
Fichet-Calvet E, Rogers DJ. Risk maps of Lassa fever in West Africa. PLoS Negl Trop Dis 2009;3:e388.
Ergonul O. Crimean-Congo Haemorrhagic Fever. Lancet 2006;6:203--14.
Amorosa V, MacNeil A, McConnell R, et al. Imported Lassa fever, Pennsylvania, USA, 2010. Emerg Infect Dis 2010;16:1598--600.
CDC. Imported case of Marburg Hemorrhagic fever---Colorado, 2008. MMWR 2009; 58:1377--81.
Viral Hepatitis
Ly KN, Xing J, Klevens RM, et al. The increasing burden of mortality from viral hepatitis in the United States between 1999 and 2007. Ann Intern Med 2012;156:271--8.
Spradling PR, Xing J, Phippard A, et al. Acute viral hepatitis in the United States-Mexico border region: data from the Border Infectious Disease Surveillance (BIDS) Project, 2000--2009. J Immigr Minor Health 2012. [Epub ahead of print].
Use of trade names and commercial sources is for identification only and does not imply endorsement by the U.S. Department of
Health and Human Services.
References to non-CDC sites on the Internet are
provided as a service to MMWR readers and do not constitute or imply
endorsement of these organizations or their programs by CDC or the U.S.
Department of Health and Human Services. CDC is not responsible for the content
of pages found at these sites. URL addresses listed in MMWR were current as of
the date of publication.
All MMWR HTML versions of articles are electronic conversions from typeset documents.
This conversion might result in character translation or format errors in the HTML version.
Users are referred to the electronic PDF version (http://www.cdc.gov/mmwr)
and/or the original MMWR paper copy for printable versions of official text, figures, and tables.
An original paper copy of this issue can be obtained from the Superintendent of Documents, U.S.
Government Printing Office (GPO), Washington, DC 20402-9371;
telephone: (202) 512-1800. Contact GPO for current prices.
**Questions or messages regarding errors in formatting should be addressed to
mmwrq@cdc.gov.
