Infographics

Infographics are an innovative and engaging method of visually communicating information in a format that is concise and easy to understand. They can play an important role in health education and raising awareness. Below are featured infographics available for download and to share digitally via social media.
About NCCDPHP
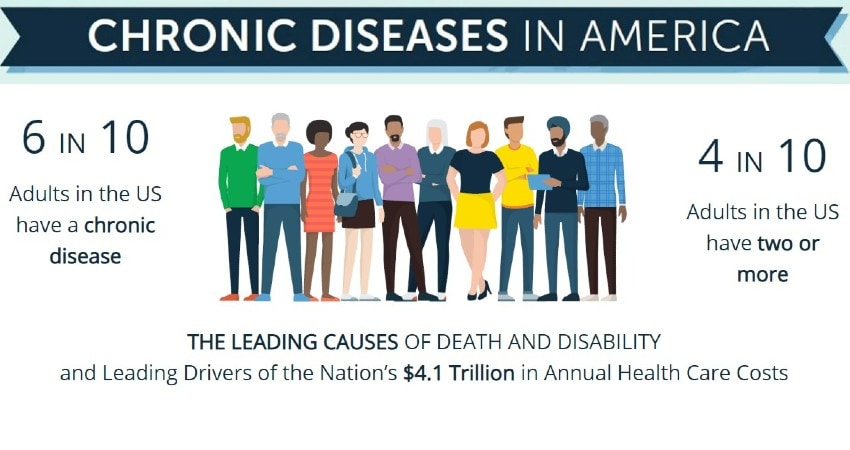
Chronic Diseases
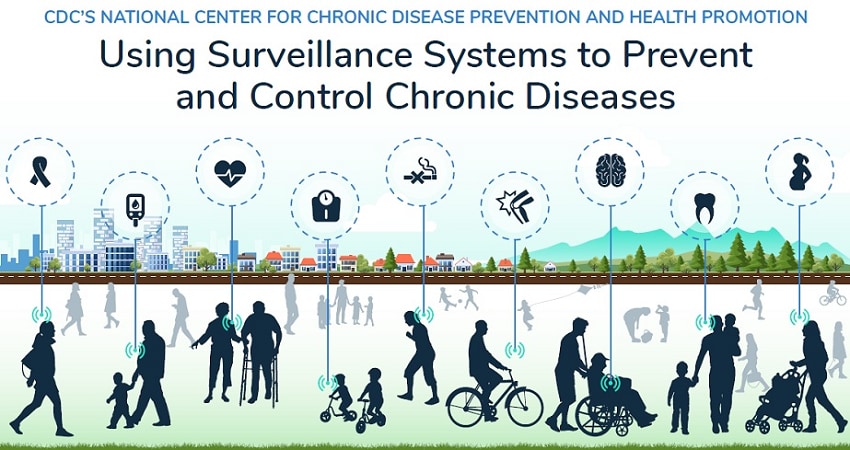
Surveillance
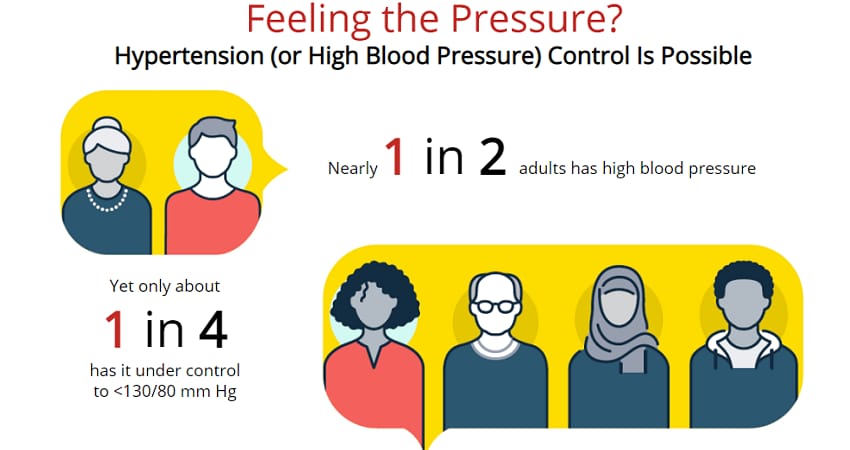
Diseases
Heart Disease

Cancer Survivors
Healthy Behaviors

Supporting Healthy Schools

Healthy Return to School Checklist
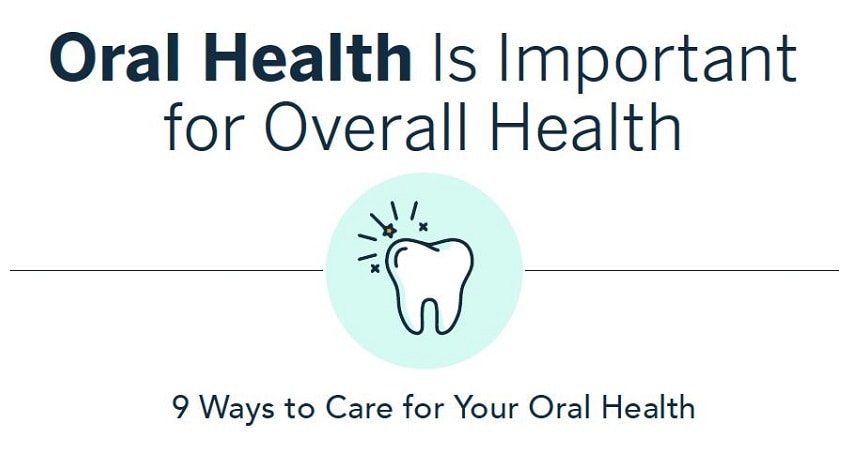
Oral Health

Children's Oral Health

Sleep

Children's Sleep

Physical Activity

Healthy Aging
Seasonal Tips

Healthy Fall

Healthy Summer

Healthy Spring
Image Resources by Division
Visit the links below to see graphics and other image resources available from CDC’s chronic disease programs.