Summary of Notifiable Infectious Diseases and Conditions — United States, 2013
Deborah Adams1
Kathleen Fullerton, MPH2
Ruth Jajosky, DMD, MPH1
Pearl Sharp1
Diana Onweh1
Alan Schley1
Willie Anderson1
Amanda Faulkner, MPH3
Kiersten Kugeler, PhD, MPH4
and the Nationally Notifiable Infectious Conditions Group
1Division of Health Informatics and Surveillance, Office of Public Health Scientific Services, CDC
2Division of Foodborne, Waterborne, and Environmental Diseases, Office of Infectious Diseases, CDC
3Division of Bacterial Diseases, Office of Infectious Diseases, CDC
4Division of Vector-Borne Diseases, Office of Infectious Diseases, CDC
Preface
The Summary of Notifiable Infectious Diseases and Condition—United States, 2013 (hereafter referred to as the summary) contains the official statistics, in tabular and graphic form, for the reported occurrence of nationally notifiable infectious diseases and conditions in the United States for 2013. Unless otherwise noted, data are final totals for 2013 reported as of June 30, 2014. These statistics are collected and compiled from reports sent by U.S. state and territory, New York City, and District of Columbia health departments to the National Notifiable Diseases Surveillance System (NNDSS), which is operated by CDC in collaboration with the Council of State and Territorial Epidemiologists (CSTE). This summary is available at http://www.cdc.gov/mmwr/mmwr_nd/index.html. This site also includes summary publications from previous years.
The Highlights section presents noteworthy epidemiologic and prevention information for 2013 for selected infectious diseases and conditions and additional information to aid in the interpretation of surveillance and infectious diseases- and conditions-trend data. Part 1 contains tables showing incidence data for the nationally notifiable infectious diseases and conditions reported during 2013; these tables do not include rows for conditions with zero cases reported in 2013.* The tables provide the number of cases reported to CDC for 2013 and the distribution of cases by month, geographic location, and patients' demographic characteristics (e.g., age, sex, race, and ethnicity). Part 1 also includes a table with the reported incidence of notifiable diseases during 2003–2013 and a table enumerating deaths associated with specified notifiable infectious diseases and conditions reported to CDC's National Center for Health Statistics (NCHS) during 2005–2011. Part 2 contains graphs and maps that depict summary data for selected notifiable infectious diseases and conditions described in tabular form in Part 1. Historical notifiable disease data, annotated as Part 3 in previous releases of this summary will no longer be included beginning with this report. Historical notifiable disease data during 1944–2012 are available online in previous years' summaries (http://www.cdc.gov/mmwr/mmwr_nd). Efforts are underway to post finalized data for years 2004–2012 on CDC WONDER (http://wonder.cdc.gov). The Selected Reading section presents general and disease-specific references for notifiable infectious diseases and conditions. These references provide additional information on surveillance and epidemiologic concerns, diagnostic concerns, and infectious disease-control activities.
Comments and suggestions from readers are welcome. To increase the usefulness of future editions, comments regarding the current report and descriptions of how information is or could be used are invited. Comments should be e-mailed to NNDSSweb@cdc.gov with the following subject line: "Annual Summary".
Background
The infectious diseases and conditions designated by CSTE and CDC as nationally notifiable during 2013 are listed in this section. A notifiable infectious disease or condition is one for which regular, frequent, and timely information regarding individual cases is considered necessary for the prevention and control of the disease or condition. A brief history of the reporting of nationally notifiable infectious diseases and conditions in the United States is available at http://wwwn.cdc.gov/nndss/history.html. In 1961, CDC assumed responsibility for the collection of data on nationally notifiable diseases and deaths in 122 U.S. cities. Data are collected through NNDSS, which is neither a single surveillance system nor a method of reporting. Rather, it is a 'system of systems', which is coordinated by CDC at the national level across disease-specific programs in order to optimize data compilation, analysis, and dissemination of notifiable disease data. Monitoring surveillance data enables public health authorities to detect sudden changes in disease or condition occurrence and distribution, identify changes in agents and host factors, and detect changes in health-care practices. National level surveillance data are compiled from case notification reports of nationally notifiable infectious diseases and conditions submitted from the state, territory, and selected local health departments to CDC.
Cases are first identified through reports of infectious diseases and conditions from the local level to the state or territory. Legislation, regulation, or other rules in those jurisdictions require health-care providers, hospitals, laboratories, and others to provide information on reportable conditions to public health authorities or their agents. Case reporting at the local level protects the public's health by ensuring the proper identification and follow-up of cases. Public health workers ensure that persons who are already ill receive appropriate treatment; trace contacts who need vaccines, treatment, quarantine, or education; investigate and halt outbreaks; eliminate environmental hazards; and close premises where disease transmission is believed to be ongoing.
Although infectious disease and condition reporting is mandated at the state, territory, and local levels by legislation or regulation, state and territory notification to CDC is voluntary. Selected local, state, and territorial health departments voluntarily notify CDC about nationally notifiable infectious diseases and conditions; the data in these case notifications to CDC are obtained through the reportable disease and condition surveillance systems in place at the state and local levels. Case notification of nationally notifiable infectious diseases and conditions helps public health authorities monitor the effect of these diseases and conditions, measure the disease and condition trends, assess the effectiveness of control and prevention measures, identify populations or geographic areas at high risk, allocate resources appropriately, formulate prevention strategies, and develop public health policies.
The list of nationally notifiable infectious diseases and conditions is revised periodically. An infectious disease or condition might be added to the list as a new pathogen emerges, or a disease or condition might be removed as its incidence declines. Public health officials at state and territorial health departments collaborate with CDC staff in determining which infectious diseases and conditions should be considered nationally notifiable. CSTE, with input from CDC, makes recommendations annually for additions and deletions to the list. The list of infectious diseases and conditions considered reportable in each jurisdiction varies over time and across jurisdictions. Current and historic national public health surveillance case definitions used for classifying and enumerating cases consistently at the national level across reporting jurisdictions are available at http://wwwn.cdc.gov/nndss/conditions.
Infectious Diseases and Conditions Designated by CSTE and CDC as Nationally Notifiable During 2013*
Anthrax
Arboviral diseases, neuroinvasive and nonneuroinvasive
California serogroup viruses
Eastern equine encephalitis virus
Powassan virus
St. Louis encephalitis virus
West Nile virus
Western equine encephalitis virus
Babesiosis
Botulism
foodborne
infant
other (includes wound and unspecified)
Brucellosis
Chancroid
Chlamydia trachomatis infection
Cholera (Vibrio cholerae O1 or O139)
Coccidioidomycosis
Cryptosporidiosis
Cyclosporiasis
Dengue virus infections
Dengue fever
Dengue hemorrhagic fever
Diphtheria
Ehrlichiosis/Anaplasmosis
Anaplasma phagocytophilum
Ehrlichia chaffeensis
Ehrlichia ewingii
Undetermined human ehrlichiosis/anaplasmosis
Giardiasis
Gonorrhea
Haemophilus influenzae, invasive disease
Hansen disease (leprosy)†
Hantavirus pulmonary syndrome
Hemolytic uremic syndrome, post-diarrheal
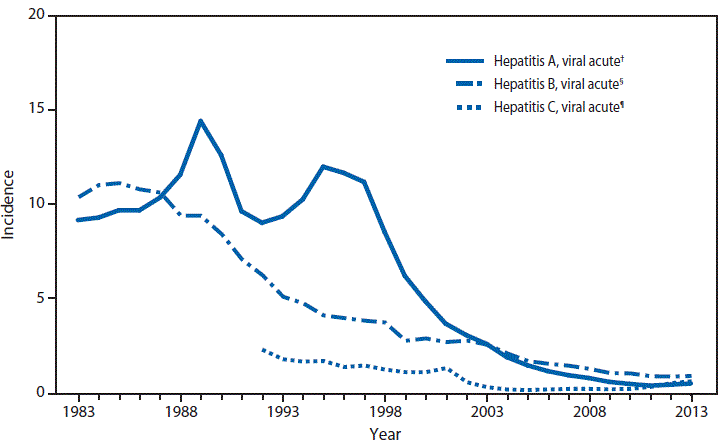
Hepatitis, viral
Hepatitis A, acute
Hepatitis B, acute
Hepatitis B, chronic
Hepatitis B, perinatal infection
Hepatitis C, acute
Hepatitis C, past or present
Human Immunodeficiency Virus (HIV) diagnoses§
Influenza-associated pediatric mortality
Invasive pneumococcal disease (Streptococcus pnuemoniae, invasive disease)
Legionellosis (Legionnaire's Disease or Pontiac fever)
Listeriosis
Lyme disease
Malaria
Measles†
Meningococcal disease (Neisseria meningitidis)
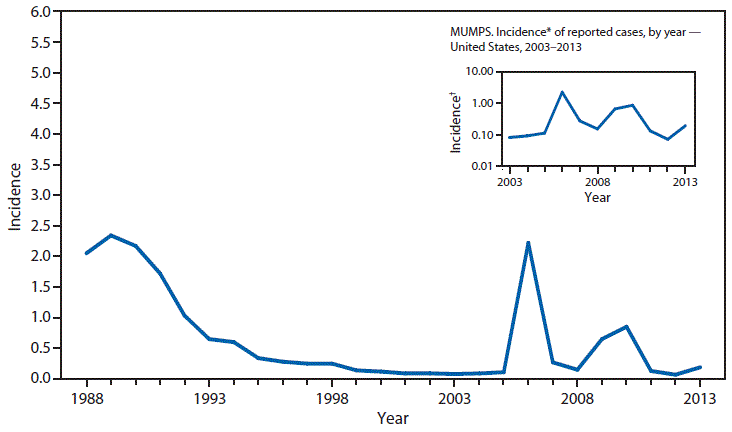
Mumps
Novel influenza A virus infections†
Pertussis
Plague
Poliomyelitis, paralytic
Poliovirus infection, nonparalytic
Psittacosis
Q fever
Acute
Chronic
Rabies
Animal
Human
Rubella†
Rubella, congenital syndrome
Salmonellosis
Severe acute respiratory syndrome-associated Coronavirus disease (SARS-CoV)
Shiga toxin-producing Escherichia coli (STEC)
Shigellosis
Smallpox
Spotted fever rickettsiosis
Streptococcal toxic-shock syndrome
Syphilis¶
Syphilis, congenital
Tetanus
Toxic-shock syndrome (other than streptococcal)
Trichinellosis
Tuberculosis
Tularemia
Typhoid fever (caused by Salmonella enterica serotype Typhi)
Vancomycin-intermediate Staphylococcus aureus (VISA) infection
Vancomycin-resistant Staphylococcus aureus (VRSA) infection
Varicella (morbidity)
Varicella (mortality)
Vibriosis (any species of the family Vibrionaceae, other than toxigenic Vibrio cholerae O1 or O139)
Viral Hemorrhagic Fever
Crimean-Congo Hemorrhagic fever virus
Ebola virus
Lassa virus
Lujo virus
Marburg virus
New World Arenaviruses (Guanarito, Machupo, Junin, and Sabia viruses)
Yellow fever
Data Sources
Provisional data on the reported occurrence of nationally notifiable infectious diseases and conditions are published weekly in MMWR throughout the year. After each reporting year, staff in state and territory health departments finalize reports of cases for that year with local or county health departments and reconcile the data with reports previously sent to CDC throughout the year. These data are compiled in final form in this summary, which represents the official and archival counts of cases for each year. The data in these reports are approved by the appropriate chief epidemiologist from each submitting state or territory before being published in this summary. Data published in MMWR Surveillance Summaries or other surveillance reports produced by CDC programs might differ from data reported in this summary because of differences in the timing of reports, the source of the data, or surveillance methodology.
Data in this summary were derived primarily from reports transmitted to CDC from health departments in the 50 states, five territories, New York City, and the District of Columbia (reporting jurisdictions). Data were reported for MMWR weeks 1–52, which correspond to the period for the week ending January 5, 2013 through the week ending December 28, 2013. More information regarding notifiable infectious diseases and conditions, including national surveillance case definitions, is available at http://wwwn.cdc.gov/nndss/conditions. Policies for reporting notifiable infectious disease and condition cases can vary by disease, condition, or reporting jurisdiction. The case-status categories used to determine which cases reported to NNDSS are published by infectious disease or condition and are listed in the publication criteria column of the 2013 NNDSS event code list (Exhibit).
For a report of a nationally notifiable disease or condition to publish in MMWR (formerly described as "print criteria", currently described as "publication criteria"), the reporting state or territory must have designated the infectious disease or condition reportable in their state or territory for the year corresponding to the year of report to CDC. After this criterion is met, the infectious disease- or condition-specific criteria listed in the Exhibit are applied. Where the Exhibit indicates that all reports will be published, this means that cases designated with unknown or suspect case confirmation status will be included in the counts along with probable and confirmed cases. Because CSTE position statements are not customarily finalized until July of each year, NNDSS data for newly added infectious diseases or conditions are not usually available from all reporting jurisdictions until January of the year following the approval of the CSTE position statement.
Final data for certain infectious diseases and conditions are derived from the surveillance records of the CDC program. Requests for further information regarding these data should be directed to the appropriate program.
Office of Public Health Scientific Services
National Center for Health Statistics (NCHS)
- Division of Vital Statistics (deaths from selected notifiable diseases)
Office of Infectious Diseases
National Center for HIV/AIDS, Viral Hepatitis, STD and TB Prevention
- Division of HIV/AIDS Prevention (AIDS and HIV infection)
- Division of Viral Hepatitis
- Division of STD Prevention (chancroid; Chlamydia trachomatis; gonorrhea; syphilis; and congenital syphilis)
- Division of Tuberculosis Elimination (tuberculosis)
National Center for Immunization and Respiratory Diseases
- Influenza Division (influenza-associated pediatric mortality, initial detections of novel influenza A virus infections)
- Division of Viral Diseases, (poliomyelitis, varicella [morbidity and mortality], and SARS-CoV)
National Center for Emerging and Zoonotic Infectious Diseases
- Division of Vector-Borne Diseases (arboviral diseases)
- Division of High-Consequence Pathogens and Pathology (animal rabies)
Population estimates were obtained from the NCHS postcensal estimates of the resident population of the United States during April 1, 2010–July 1, 2012 (release date: June 13, 2013), by year, county, single year of age (range: 0 to ≥85 years), bridged-race (white, black or African American, American Indian or Alaska Native, Asian or Pacific Islander), Hispanic ethnicity (not Hispanic or Latino, Hispanic or Latino), and sex (Vintage 2012), prepared under a collaborative arrangement with the U.S. Census Bureau. Population estimates for states are available at http://www.cdc.gov/nchs/nvss/bridged_race/data_documentation.htm#vintage2012. Population estimates for Territories are from the 2012 U.S. Census Bureau International Data Base, available at http://www.census.gov/population/international/data/idb/informationGateway.php. The choice of population denominators for incidence reported in MMWR is based on the availability of census population data at the time of preparation for publication and the desire for consistent use of the same population data to compute incidence reported by different CDC programs.
Incidence in this summary was calculated as the number of reported cases for each infectious disease or condition divided by either the U.S. resident population for the specified demographic population or the total U.S. resident population, multiplied by 100,000. For Territories, incidence in this summary was calculated as the number of reported cases for each infectious disease or condition divided by either the Territorial resident population for the specified demographic population or the total Territorial resident population, multiplied by 100,000. When a nationally notifiable infectious disease or condition is associated with a specific age restriction, the same age restriction was applied to the population in the denominator of the incidence calculation. In addition, population data from states in which the disease or condition was not reportable or was not available are excluded from incidence calculations. Unless otherwise stated, disease totals for the United States do not include data for American Samoa, Guam, Puerto Rico, the Commonwealth of the Northern Mariana Islands, or the U.S. Virgin Islands.
Interpreting Data
The completeness of information on notifiable infectious diseases and conditions was highly variable and related to the disease or condition being reported (1–8). Incidence data in this summary are presented by the MMWR week and year (http://wwwn.cdc.gov/nndss/document/MMWR_Week_overview.pdf) assigned by the state or territorial health department, with some exceptions, including human immunodeficiency virus (HIV) (presented by date of diagnosis), tuberculosis (presented by date CDC surveillance staff verified that the case met the criteria in the national surveillance case definition), domestic arboviral diseases (presented by date of illness onset), and varicella deaths (presented by date of death). Data were reported by the jurisdiction of the person's "usual residence" at the time of disease or condition onset (http://wwwn.cdc.gov/nndss/document/11-SI-04.pdf). For certain nationally notifiable infectious diseases and conditions, surveillance data are reported independently to various CDC programs. For this reason, surveillance data reported by other CDC programs might vary from data reported in this summary because of differences in 1) the date used to aggregate data (e.g., date of report or date of disease or condition occurrence), 2) the timing of reports, 3) the source of the data, 4) surveillance case definitions, and 5) policies regarding case jurisdiction (i.e., which jurisdiction should submit the case notification to CDC). In addition, the "date of disease occurrence" of conditions might vary. For infectious diseases, the meaning of the "date of disease occurrence" varies across jurisdictions and by disease and might be a date of symptom or disease onset, diagnosis, laboratory result, reporting of a case to a jurisdiction, or notification of a case to CDC.
Data reported in this summary are useful for analyzing infectious disease or condition trends and determining relative infectious disease or condition numbers. However, reporting practices affect how these data should be interpreted. Infectious disease and condition reporting is likely incomplete, and completeness might vary depending on the infectious disease or condition and reporting state. The degree of completeness of data reporting might be influenced by the diagnostic facilities available, control measures in effect, public awareness of a specific infectious disease or condition, and the resources and priorities of state and local officials responsible for controlling infectious diseases and conditions, and for public health surveillance. Finally, factors such as changes in methods for public health surveillance, introduction of new diagnostic tests, or discovery of new infectious disease or condition entities can cause changes in reporting that are independent of the actual incidence of infectious disease or condition.
Public health surveillance data are published for selected racial/ethnic populations because these characteristics can be risk markers for certain notifiable infectious diseases or conditions. Race and ethnicity data also can be used to highlight populations for focused prevention programs. However, caution must be used when drawing conclusions from reported race and ethnicity. Different racial/ethnic populations might have different patterns of access to health care, potentially resulting in data that are not representative of actual infectious disease or condition incidence among specific population groups. In addition, not all race and ethnicity data are collected or reported uniformly for all infectious diseases and conditions; for example, the recommended standard for classifying a person's race or ethnicity is based on self-reporting. However, this procedure might not always be followed.
The standardized categories used for classifying race and ethnicity have changed over time, and the transition in implementation to the newest race and ethnicity standard has taken varying amounts of time for different nationally notifiable infectious diseases and conditions. All data submitted to CDC, even those data using the new 1997 standard, are converted to the 1977 standard. Until CDC can accept data using the 1997 OMB standard across all conditions and across all reporting jurisdictions, the data will be converted to the 1977 standard. The current standard is the 1997 Office of Management and Budget (OMB) race and ethnicity standard, which includes the collection of multiple races per person; this should have been implemented by federal programs beginning January 1, 2003. CDC's Tuberculosis, HIV/AIDS, and Sexually Transmitted Diseases programs have implemented the 1997 OMB Standard. In addition, the National Electronic Disease Surveillance System Base System (NBS), which was in development in 1999 and by 2003 was in production by the first state, implemented the 1997 OMB standard. However, progress has been slow in updating the national case notification messaging standard across all reporting jurisdictions to enable CDC to aggregate data collected using the 1997 OMB standard for all nationally notifiable infectious diseases and conditions. Most of the case notification data submitted to CDC are in National Electronic Telecommunications System for Surveillance (NETSS) data format, which uses the 1977 OMB standard, in which race and ethnicity were collected as one variable.
Surveillance data reported to NNDSS are in either individual case-specific form or summary form (i.e., aggregated data for a group of cases). Summary data often lack demographic information (e.g., race); therefore, the demographic-specific rates presented in this summary might be underestimated.
Transitions in NNDSS Data Collection
A total of 57 public health departments (50 state health departments, two city health departments [New York City and the District of Columbia] and five territorial health departments) submitted to CDC notifiable infectious diseases and conditions data for inclusion in this summary. Data collection in NNDSS has undergone various transitions over time. Before 1990, data were reported to CDC as cumulative counts rather than as individual case reports. In 1990, using NETSS, states began electronically capturing and reporting individual cases to CDC without personal identifiers. In 2001, CDC launched the National Electronic Disease Surveillance System (NEDSS), now a component of the Public Health Information Network (PHIN), to promote the use of data and information system standards that advance the development of efficient, integrated, and interoperable surveillance information systems at the local, state, territorial, and national levels. Additional information concerning NEDSS is available at http://wwwn.cdc.gov/nndss/nedss.html.
One of the objectives of NEDSS is to improve the accuracy, completeness, and timeliness of disease reporting at the local, state, territorial, and national levels. A major feature of NEDSS is its ability to capture data already in electronic form (e.g., electronic laboratory results, which are needed for case confirmation) rather than having to enter these data manually, as in NETSS. Certain public health surveillance information systems are NEDSS-compatible. In 1999, CDC initiated development of the NBS, which the first state began using in 2003. Since the NBS launch, states and commercial vendors have developed several other NEDSS-compatible systems.
As of August 2013, all 50 state health departments use NEDSS-compatible public health surveillance information systems: 32 (64%) use state- or vendor-developed systems and 18 (36%) use the CDC-developed NBS. In addition, New York City uses a vendor-developed system and the District of Columbia uses both NBS and a vendor-developed system. In September 2013, Guam began to use NBS selectively as part of the territory's transition plan to use the system for all reportable infectious diseases and conditions. At that time, the remaining territorial health departments were not using NEDSS-compatible systems.
In 2013, CDC began to conceptualize improvements to strengthen and modernize the technical infrastructure supporting NNDSS. In 2014, CDC and selected states began work on the NNDSS Modernization Initiative (NMI), a multiyear commitment to enhance NNDSS surveillance capabilities. An important benefit for public health decision making will be the ability to acquire higher quality data that are more comprehensive and timely. Through NMI, CDC and its state partners will increase the robustness of the NNDSS technological infrastructure so that it is based on interoperable, standardized data and data exchange mechanisms. Additional information is available at http://www.cdc.gov/nmi.
Method for Identifying which Nationally Notifiable Infectious Diseases and Conditions are Reportable
States and jurisdictions are sovereign entities. Reportable conditions are determined by laws and regulations of each state, territory, or local jurisdiction. Some infectious diseases and conditions deemed nationally notifiable by CSTE might not be designated as reportable in certain states or jurisdictions. Only data from reporting states, territories, and jurisdictions that designated the infectious disease or condition as reportable are included in the summary tables. This ensures the data displayed in this summary are from population-based surveillance efforts and are generally comparable across states, territories, and other jurisdictions. When a CSTE- and CDC-recommended nationally notifiable disease or condition is judged by state, territory, or other jurisdiction officials to be not reportable, an "N" indicator for "not reportable" is inserted in the table for the specified reporting state, territory, or jurisdiction and applicable year. Each year, the NNDSS Data Processing Team solicits information from each NNDSS reporting state, territory, and jurisdiction (all 50 U.S. states, the District of Columbia, New York City, and five U.S. territories) about infectious diseases and conditions that are mandated by state, territory, or jurisdiction laws or regulations to be nationally reportable.
Revised International Health Regulations
At its annual meeting in June 2007, CSTE approved a position statement that supports implementation of International Health Regulations (IHR) in the United States (9). CSTE approval followed the adoption of revised IHR in May 2005 by the World Health Assembly (10) that went into effect in the United States on July 18, 2007. This international legal instrument governs the role of the World Health Organization (WHO) and its member countries, including the United States, in identifying, responding to, and sharing information about events that might constitute a Public Health Emergency of International Concern (PHEIC). A PHEIC is an extraordinary event that constitutes a public health risk to other countries through international spread of disease and potentially requires a coordinated international response. All WHO member countries are required to notify WHO of a potential PHEIC. WHO makes the final determination about the existence of a PHEIC.
Health-care providers in the United States are required to report diseases, conditions, and outbreaks determined to be reportable by local, state, or territorial law or regulation. Additionally, all health-care providers should work with their local, state, or territorial health agencies to identify and report events occurring in their location that might constitute a PHEIC. U.S. state and territorial departments of health have agreed to report information about a potential PHEIC to the most relevant federal agency responsible for monitoring such an event. In the case of human infectious disease, the U.S. state or territorial departments of health will notify CDC through existing formal and informal reporting mechanisms (10). CDC will further analyze the event by use of the decision algorithm in Annex 2 of the IHR and notify the U.S. Department of Health and Human Services (HHS) Secretary's Operations Center (SOC), as appropriate.
In the United States, HHS has the lead role in carrying out the IHR, in cooperation with multiple federal departments and agencies. When a potential PHEIC is identified, the United States has 48 hours to assess the risk of the reported event. If authorities determine that a potential PHEIC exists, the United States, as with all WHO member countries, has 24 hours to report the event to WHO. The HHS SOC is responsible for reporting a potential PHEIC to WHO.
An IHR decision algorithm (Annex 2 of the IHR) was developed to help countries determine whether an event should be reported. If any two of the following four questions are answered in the affirmative, then a potential PHEIC exists and WHO should be notified:
- Is the public health impact of the event serious?
- Is the event unusual or unexpected?
- Is there a significant risk of international spread?
- Is there a significant risk of international travel or trade restrictions?
The revised IHR reflects a conceptual shift from the use of a predefined disease list to a framework of reporting and responding to events on the basis of an assessment of public health criteria, including seriousness, unexpectedness, and international travel and trade implications. A PHEIC is an event that falls within those criteria (further defined in a decision algorithm in Annex 2 of the revised IHR). Any one of these four conditions always constitutes a PHEIC and do not require the use of the IHR decision instrument in Annex 2:
- severe acute respiratory syndrome (SARS),
- smallpox,
- poliomyelitis caused by wild-type poliovirus, and
- human influenza caused by a new subtype.
Any other event requires the use of the decision algorithm to determine if it is a potential PHEIC. Examples of events that require the use of the decision instrument include, but are not limited to cholera, pneumonic plague, yellow fever, West Nile fever, viral hemorrhagic fevers, and meningococcal disease. Other biologic, chemical, or radiologic events might fit the decision algorithm and also must be reported to WHO.
Additional information concerning IHR is available at http://www.who.int/csr/ihr/en and http://www.cdc.gov/globalhealth/ihregulations.htm. CSTE also approved a position statement that added initial detections of novel influenza A virus infections to the list of nationally notifiable infectious diseases, beginning in January 2007 (11).
Acknowledgements
We acknowledge John Florence for his technical review of this report. We acknowledge the following state health departments for review of data for novel influenza A virus infections: Arkansas Department of Health, Illinois Department of Public Health, Indiana State Department of Health, Iowa Department of Public Health, Michigan Department of Community Health, and Ohio Department of Health. We acknowledge all local, state, and territorial health departments in the United States for collecting the data included in this report.
References
- Doyle TJ, Glynn MK, Groseclose LS. Completeness of notifiable infectious disease reporting in the United States: an analytical literature review. Am J Epidemiol 2002;155:866–74.
- CDC. Assessing completeness of perinatal hepatitis B virus infection reporting through comparison of immunization program and surveillance data—United States. MMWR Morb Mortal Wkly Rep 2011;60:410–3.
- CDC. Evaluation of acute hepatitis C infection surveillance—United States, 2008. MMWR Morb Mortal Wkly Rep 2010;59:1407–10.
- Hwang J, McClintock S, Kachur SP, Slutsker L, Arguin P. Comparison of national malaria surveillance system with the national notifiable diseases surveillance system in the United States. J Public Health Manag Pract 2009;15:345–51.
- CDC. Cryptosporidiosis surveillance—United States, 2009–2010. MMWR Surveill Summ 2012;61(No. SS-5).
- Painter JE, Gargano JW, Collier SA, Yoder JS. Giardiasis surveillance–United States, 2011-2012. MMWR Surveill Summ 2015;64(No SS-3).
- Wilson NO, Hall RL, Montgomery SP, Jones JL. Trichinellosis surveillance—United States, 2008–2012. MMWR Surveill Summ 2015;64(No. SS-1).
- CDC. Babesiosis surveillance—18 States, 2011. MMWR Morb Mortal Wkly Rep 2012;61:505–9.
- Council of State and Territorial Epidemiologists. Events that may constitute a public health emergency of international concern. Position statement 07-ID-06. Available at http://c.ymcdn.com/sites/www.cste.org/resource/resmgr/PS/07-ID-06.pdf.
- World Health Organization. Third report of Committee A. Annex 2. Geneva, Switzerland: World Health Organization; 2005. Available at http://whqlibdoc.who.int/publications/2008/9789241580410_eng.pdf.
- Council of State and Territorial Epidemiologists. Council of State and Territorial Epidemiologists position statement; 2007. National reporting for initial detections of novel influenza A viruses. Available at http://c.ymcdn.com/sites/www.cste.org/resource/resmgr/PS/07-ID-01.pdf.
|
Code
|
Notifiable Condition
|
Publication Criteria*,†,§
|
|
11090
|
Anaplasma phagocytophilum
|
Confirmed and probable
|
|
10350
|
Anthrax
|
Confirmed and probable
|
|
12010
|
Babesiosis
|
Confirmed and probable
|
|
10530
|
Botulism, foodborne
|
Confirmed
|
|
10540
|
Botulism, infant
|
Confirmed
|
|
10550
|
Botulism, other (includes wound)
|
Confirmed
|
|
10548
|
Botulism, other (unspecified)
|
Confirmed
|
|
10549
|
Botulism, wound
|
Confirmed
|
|
10020
|
Brucellosis
|
Confirmed and probable
|
|
10054
|
California serogroup viruses, neuroinvasive disease
|
Data for publication received from ArboNET
|
|
10061
|
California serogroup viruses, nonneuroinvasive disease
|
Data for publication received from ArboNET
|
|
10273
|
Chancroid
|
All reports
|
|
10274
|
Chlamydia trachomatis infection
|
All reports
|
|
10470
|
Cholera (toxigenic Vibrio cholerae O1 or O139)
|
Confirmed
|
|
11900
|
Coccidioidomycosis
|
Confirmed
|
|
11580
|
Cryptosporidiosis
|
Confirmed and probable
|
|
11575
|
Cyclosporiasis
|
Confirmed and probable
|
|
10680
|
Dengue fever (DF)
|
Confirmed and probable
|
|
10685
|
Dengue hemorrhagic fever (DHF)
|
Confirmed and probable
|
|
10040
|
Diphtheria
|
Confirmed, probable, and unknown
|
|
10053
|
Eastern equine encephalitis virus, neuroinvasive disease
|
Data for publication received from ArboNET
|
|
10062
|
Eastern equine encephalitis virus, nonneuroinvasive disease
|
Data for publication received from ArboNET
|
|
11088
|
Ehrlichia chaffeensis
|
Confirmed and probable
|
|
11089
|
Ehrlichia ewingii
|
Confirmed and probable
|
|
11091
|
Ehrlichiosis/Anaplasmosis, undetermined
|
Confirmed and probable
|
|
11570
|
Giardiasis
|
Confirmed and probable
|
|
10280
|
Gonorrhea
|
All reports
|
|
10590
|
Haemophilus influenzae, invasive disease
|
Confirmed, probable, and unknown
|
|
10380
|
Hansen disease (leprosy)
|
Confirmed
|
|
11590
|
Hantavirus pulmonary syndrome
|
Confirmed
|
|
11550
|
Hemolytic uremic syndrome, postdiarrheal
|
Confirmed and probable
|
|
10110
|
Hepatitis A, acute
|
Confirmed
|
|
10100
|
Hepatitis B, acute
|
Confirmed
|
|
10104
|
Hepatitis B perinatal infection
|
Confirmed
|
|
10101
|
Hepatitis C, acute
|
Confirmed
|
|
11061
|
Influenza-associated pediatric mortality
|
Confirmed
|
|
10490
|
Legionellosis
|
Confirmed
|
|
10640
|
Listeriosis
|
Confirmed
|
|
11080
|
Lyme disease
|
Confirmed and probable
|
|
10130
|
Malaria
|
Confirmed
|
|
Code
|
Notifiable Condition
|
Publication Criteria*,†,§
|
|
10140
|
Measles (rubeola), total
|
Confirmed and unknown
|
|
10150
|
Meningococcal disease (Neisseria meningitidis)
|
Confirmed and probable
|
|
10180
|
Mumps
|
Confirmed, probable, and unknown
|
|
10317
|
Neurosyphilis
|
All reports
|
|
11062
|
Novel influenza A virus infections, initial detections of
|
Confirmed
|
|
10190
|
Pertussis
|
Confirmed, probable, and unknown
|
|
10440
|
Plague
|
All reports
|
|
10410
|
Poliomyelitis, paralytic
|
Confirmed
|
|
10405
|
Poliovirus infection, nonparalytic
|
Confirmed
|
|
10057
|
Powassan virus, neuroinvasive disease
|
Data for publication received from ArboNET
|
|
10063
|
Powassan virus, nonneuroinvasive disease
|
Data for publication received from ArboNET
|
|
10450
|
Psittacosis (Ornithosis)
|
Confirmed and probable
|
|
10257
|
Q fever, acute
|
Confirmed and probable
|
|
10258
|
Q fever, chronic
|
Confirmed and probable
|
|
10340
|
Rabies, animal
|
Confirmed
|
|
10460
|
Rabies, human
|
Confirmed
|
|
10200
|
Rubella
|
Confirmed and unknown
|
|
10370
|
Rubella, congenital syndrome
|
Confirmed, probable, and unknown
|
|
11000
|
Salmonellosis
|
Confirmed and probable
|
|
10575
|
Severe acute respiratory syndrome-associated coronavirus (SARS-CoV) disease
|
Confirmed and probable
|
|
11563
|
Shiga toxin-producing Escherichia coli (STEC)
|
Confirmed and probable
|
|
11010
|
Shigellosis
|
Confirmed and probable
|
|
11800
|
Smallpox
|
Confirmed and probable
|
|
10250
|
Spotted fever rickettsiosis
|
Confirmed, probable, and unknown
|
|
10051
|
St. Louis encephalitis virus, neuroinvasive disease
|
Data for publication received from ArboNET
|
|
10064
|
St. Louis encephalitis virus, nonneuroinvasive disease
|
Data for publication received from ArboNET
|
|
11700
|
Streptococcal toxic-shock syndrome
|
Confirmed and probable
|
|
11723
|
Streptococcus pneumoniae, invasive disease (IPD) (all ages)
|
Confirmed
|
|
10316
|
Syphilis, congenital
|
All reports
|
|
10313
|
Syphilis, early latent
|
All reports
|
|
10314
|
Syphilis, late latent
|
All reports
|
|
10318
|
Syphilis, late with clinical manifestations other than neurosyphilis
|
All reports
|
|
10311
|
Syphilis, primary
|
All reports
|
|
10312
|
Syphilis, secondary
|
All reports
|
|
10310
|
Syphilis, total primary and secondary
|
All reports
|
|
10315
|
Syphilis, unknown latent
|
All reports
|
|
10210
|
Tetanus
|
All reports
|
|
10520
|
Toxic-shock syndrome (staphylococcal)
|
Confirmed and probable
|
|
10270
|
Trichinellosis
|
Confirmed
|
|
10220
|
Tuberculosis
|
Publication criteria determined by the CDC Tuberculosis program
|
|
Code
|
Notifiable Condition
|
Publication Criteria*,†,§
|
|
10230
|
Tularemia
|
Confirmed and probable
|
|
10240
|
Typhoid fever (caused by Salmonella typhi)
|
Confirmed and probable
|
|
11663
|
Vancomycin-intermediate Staphylococcus aureus (VISA)
|
Confirmed
|
|
11665
|
Vancomycin-resistant Staphylococcus aureus (VRSA)
|
Confirmed
|
|
10030
|
Varicella (Chickenpox)
|
Confirmed and probable
|
|
11545
|
Vibriosis (any species of the family Vibrionacaeae, other than toxigenic Vibrio cholerae O1 or O139)
|
Confirmed and probable
|
|
11647
|
Viral hemorrhagic fevers
|
Confirmed
|
|
10056
|
West Nile virus, neuroinvasive disease
|
Data for publication received from ArboNET
|
|
10049
|
West Nile virus, nonneuroinvasive disease
|
Data for publication received from ArboNET
|
|
10052
|
Western equine encephalitis virus, neuroinvasive disease
|
Data for publication received from ArboNET
|
|
10065
|
Western equine encephalitis virus, nonneuroinvasive disease
|
Data for publication received from ArboNET
|
|
10660
|
Yellow fever
|
Data for publication received from ArboNET
|
Nationally Notifiable Infectious Conditions Group
Contributors
(All group members meet the CDC and MMWR criteria for contributors)
John Abellera, MPH, Willie Anderson, Kaitlin Benedict, MPH, Tina Benoit, MPH, David Blaney, MPH, Anna Bowen, MD, Delicia Carey, PhD, Tom Chiller, MD, Amanda Conrad, MPH, Kristina Cordes, MPH, MBA, Rosalyn Dhara, MPH, Elizabeth Ervin, MPH, Julia Gargano, PhD, Elizabeth B. Gray, MPH, Marta Guerra, DVM, Rebecca L. Hall, MPH, Alesia Harvey, Michele Hlavsa, MPH, Scott Holmberg, MD, Deborah Holtzman, Jacqueline Hurd, MPH, Brendan R. Jackson, MD, Kelly A. Jackson, MPH, Ruth Jiles, PhD, Anna Satcher Johnson, MPH, Michael Judd, MPH, Grishma Kharod, MPH, Sarah Kidd, MD, Robert Kirkcaldy, MD, Monina Klevens, DDS, Barbara Knust, DVM, Ben Kupronis, MPH, Jennifer Lehman, Anastasia Litvintseva, PhD, Adriana Lopez, MHS, Kathleen Ly, MPH, Jessica R. MacNeil, MPH, Harold S. Margolis, MD, Barbara Mahon, MD, Orion McCotter, MPH, Paul Mead, MD, Prachi Mehta, PhD, Rajal Mody, MD, William Morrill, MPH, Anna Newton, MPH, Agam Rao, MD, Susan B. Redd, Pierre E. Rollin, MD, Amanda Santander, MPH, Tyler M. Sharp, PhD, Tami H. Skoff, MS, John Su, MD, Kimberly Thomas, MPH, Elizabeth Torrone, PhD, Rita Traxler, MHS, Greg S. Wallace, MD, Tony Winters, MSPH, Jonathan Yoder, MPH.
Highlights for 2013
Below are summary highlights for certain national notifiable diseases and conditions. Highlights are intended to assist in the interpretation of major occurrences that affect disease incidence or surveillance trends (e.g., outbreaks, vaccine licensure, or policy changes).
Domestic Arboviral Disease, Neuroinvasive and Nonneuroinvasive
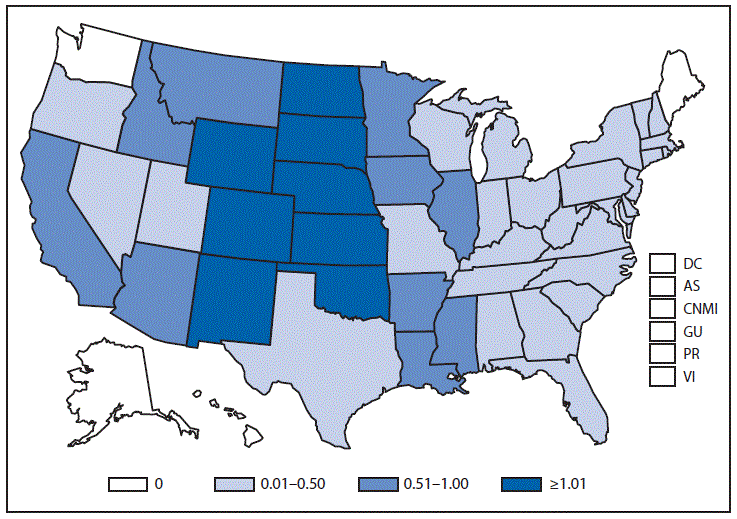
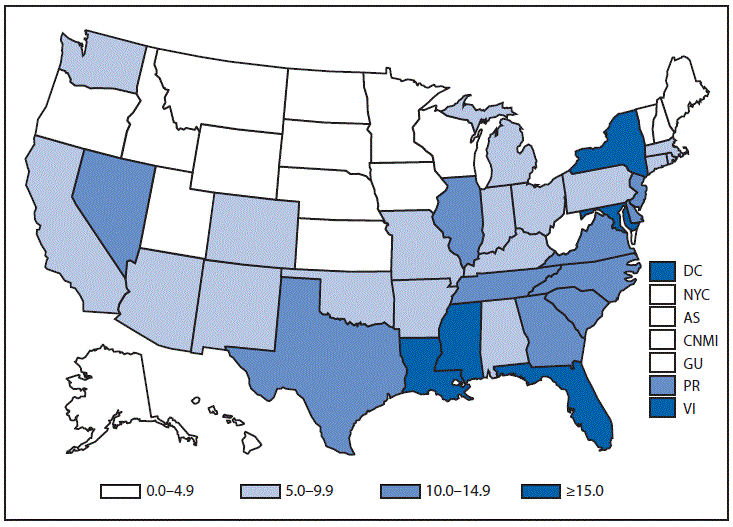
In 2013, a total of 2,469 West Nile virus (WNV) disease cases were reported, including 1,267 cases of neuroinvasive disease (e.g., meningitis, encephalitis, and acute flaccid paralysis) and 119 deaths (1). WNV disease cases were reported from 47 states and the District of Columbia. Approximately half (51%) of the WNV neuroinvasive disease cases were reported from six states (California, Colorado, Illinois, North Dakota, Oklahoma, and Texas). The incidence of neuroinvasive disease declined substantially in 2013 (0.40 per 100,000 population) compared with 2012 (0.92 per 100,000 population) when a large multistate outbreak occurred (2). However, the incidence in 2013 was similar to that during 2004–2007 and was higher than that during 2008–2011.
After WNV, the next most commonly reported cause of neuroinvasive arboviral disease was La Crosse virus, followed by Jamestown Canyon virus, Powassan virus, and Eastern equine encephalitis virus. In 2013, more Jamestown Canyon virus cases (N = 22) were reported than in any previous year and included the first cases reported from eight states. This increase is likely related to the initiation of routine immunoglobulin M testing at CDC and suggests that the incidence of Jamestown Canyon virus infection might have been underestimated in previous years. Although rare, Eastern equine encephalitis virus disease remained the most severe arboviral disease, with a 50% case-fatality ratio for reported cases in 2013.
- Lindsey NP, Lehman JA, Staples JE, Fischer M. West Nile virus and other arboviral diseases—United States, 2013. MMWR Morb Mortal Wkly Rep 2014;63:521–6.
- CDC. West Nile Virus and other arboviral diseases—United States, 2012. MMWR Morb Mortal Wkly Rep 2013;62:513–7.
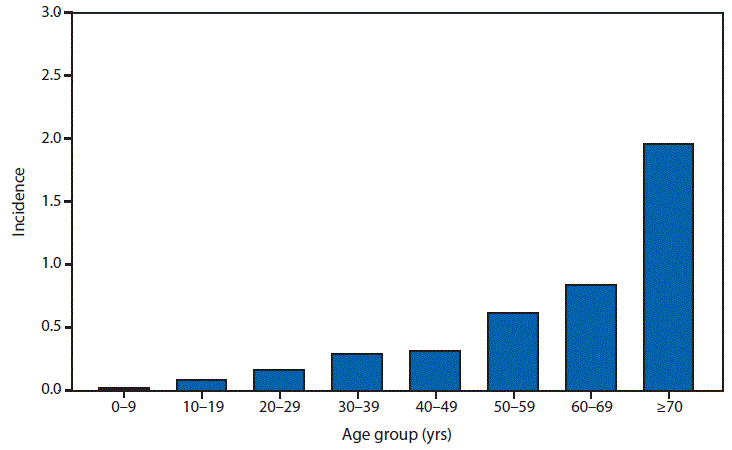
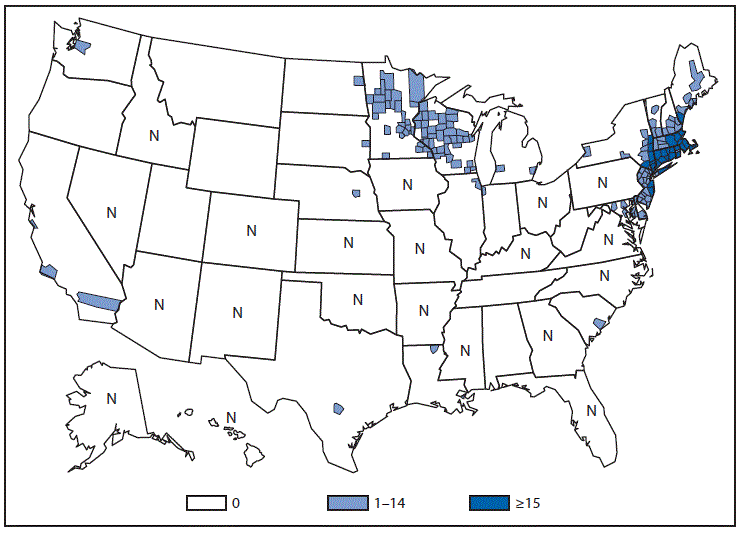
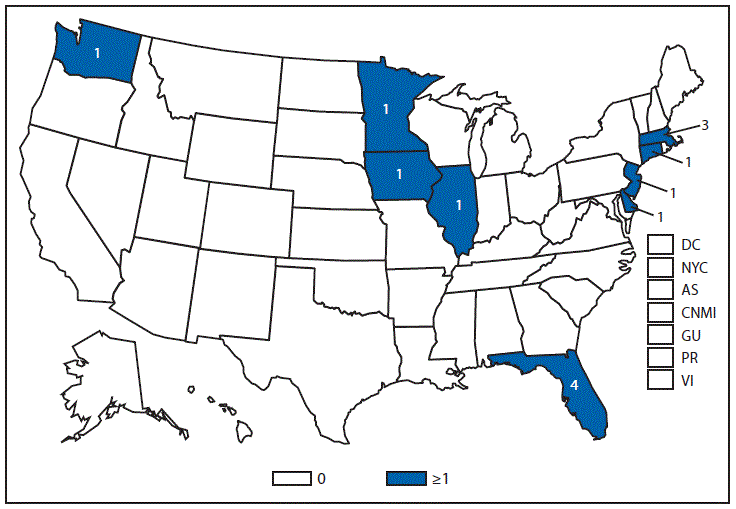
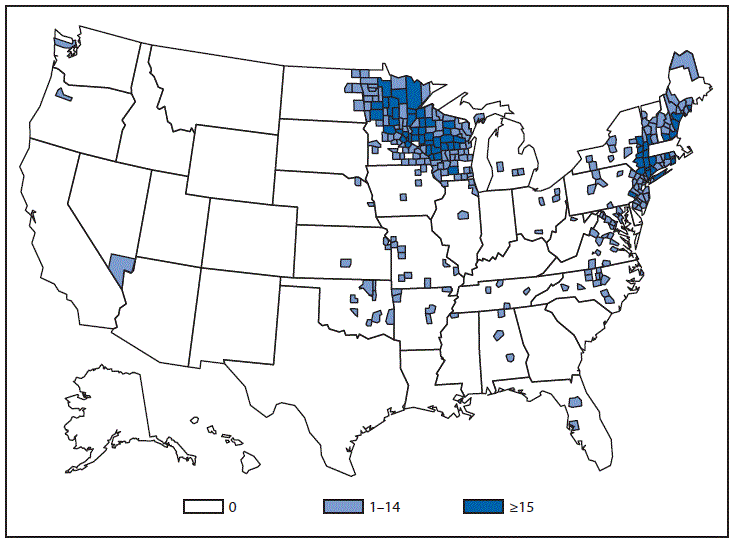
Babesiosis
Babesiosis is a disease caused by protozoan parasites of the genus Babesia that infect red blood cells. Babesia infection can range from asymptomatic to life threatening. Clinical manifestations might include fever, chills, other nonspecific influenza-like symptoms, and hemolytic anemia. Babesia parasites usually are tickborne, but can also be transmissible via blood transfusion or congenitally (1).
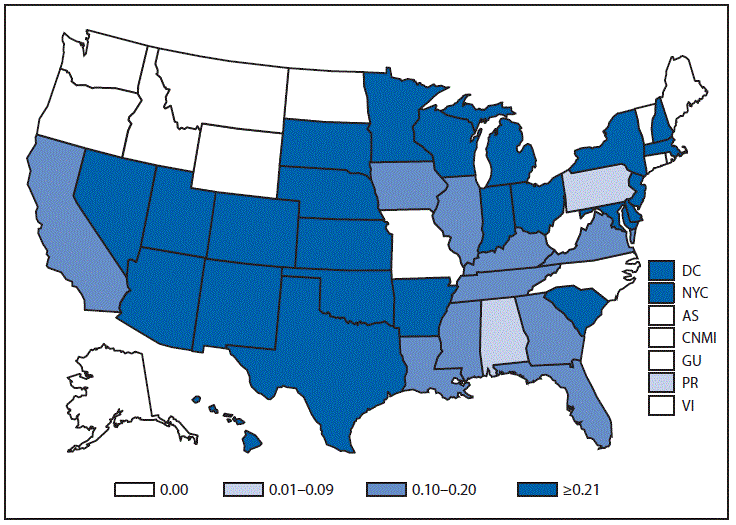
In 2013, 95% of cases were reported in residents of seven states (Connecticut, Massachusetts, Minnesota, New Jersey, New York, Rhode Island, and Wisconsin). The median age of patients was 62 years (range: <1–98 years); 65% were male, 32% were female, and the sex was unknown for 3%. Among the patients for whom data were available, 85% had symptom onset dates during June–August.
- Herwaldt BL, Linden JV, Bosserman E, Young C, Olkowska D, Wilson M. Transfusion-associated babesiosis in the United States: a description of cases. Ann Intern Med 2011;155:509–19.
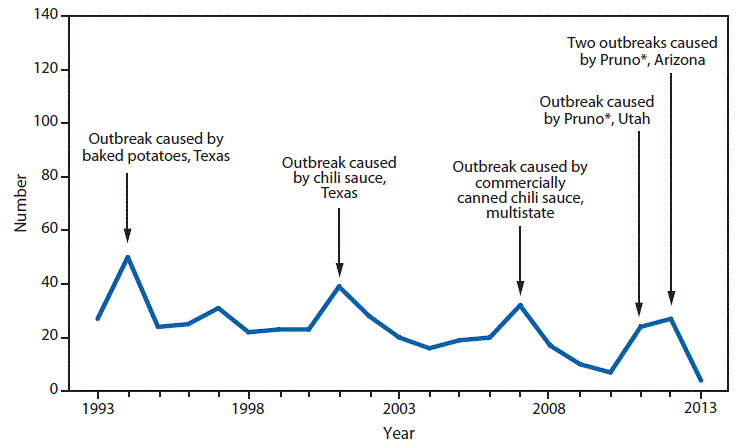
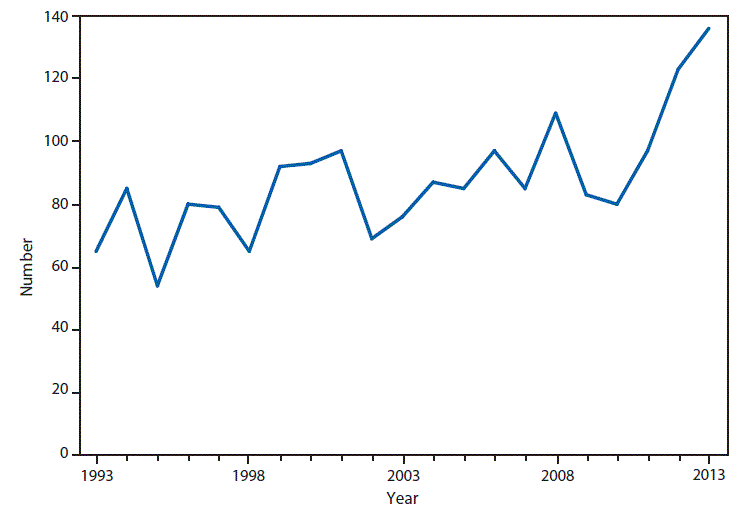
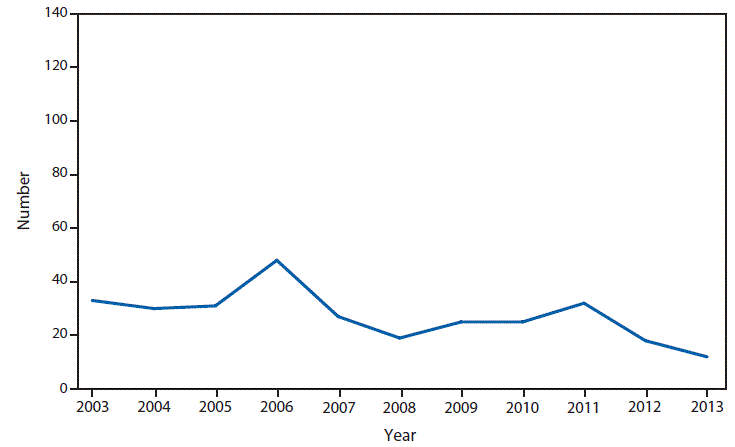
Botulism
Botulism is a severe paralytic illness caused by toxins produced by Clostridium botulinum. Exposure to the toxin can occur by ingestion (foodborne botulism), in situ production from C. botulinum colonization of either a wound (wound botulism) or the gastrointestinal tract (infant botulism and adult intestinal colonization botulism), or overdose of botulinum toxin used for cosmetic or therapeutic purposes (1). In 2013, a total of 152 cases of botulism reported, including 136 cases in infants, four foodborne cases, and 12 cases classified as other, including wound botulism. During 2013, no outbreaks (events with two or more cases) of foodborne botulism were reported.
All states maintain 24-hour telephone services for reporting of botulism and other public health emergencies. Health-care providers should report suspected botulism cases immediately to their state health departments. CDC maintains intensive surveillance for cases of botulism in the United States and provides consultation and antitoxin for suspected cases. State health departments can reach the CDC botulism duty officer on call 24 hours a day, 7 days a week via the CDC Emergency Operations Center (telephone: 770-488-7100).
- Sobel J. Botulism. Clin Infect Dis 2005;41:1167–73.
Brucellosis
In 2013, 99 brucellosis cases were reported from 28 U.S. states and territories. The number of cases decreased 13% from 2012 to 2013.
Brucellosis is reportable in all states and territories and is also a nationally notifiable condition. According to the CDC/CSTE case classification and diagnostic lab criteria, probable cases are defined as those that have clinically compatible illness and are epidemiologically linked to a confirmed human or animal case, and/or have presumptive laboratory evidence of Brucella infection. This presumptive laboratory evidence can be indicated either by a total antibody titer of 1:160 by standard tube agglutination or Brucella microagglutination in at least one serum specimen obtained after symptom onset, or by detection of Brucella DNA in a clinical specimen by PCR assay. Confirmed cases must have definitive evidence of Brucella infection, either via culture and identification of Brucella from clinical specimens or a fourfold or greater rise in Brucella antibody titer between acute and convalescent phase serum specimens, obtained at least two weeks apart.
Chlamydia
In 2013, approximately 1.4 million cases of Chlamydia trachomatis infections were reported (1). During 2012–2013, the rate of reported chlamydia decreased 1.5% from 453.3 to 446.6 cases per 100,000 population,* representing the first time since national reporting began that the overall chlamydia rate has decreased. The rate among women decreased 2.4% (638.7 to 623.1 cases per 100,000 population) and the rate among men increased slightly (0.8%) (260.6 to 262.6). Decreases among women were primarily among young women; the rate among women aged 15–19 years decreased 8.7% (3,331.7 to 3,043.3 cases per 100,000 population). Chlamydial infections are usually asymptomatic and rates of reported cases are affected by the proportion of the population screened and the diagnostic test used. Consequently, increases in chlamydia case rates might reflect increases in incidence of infection, screening coverage, and use of more sensitive diagnostic tests. Likewise, decreases in chlamydia case rates might suggest decreases in incidence of infection or screening coverage.
- CDC. Sexually transmitted disease surveillance 2013. Atlanta, GA: US Department of Health and Human Services, CDC; 2014.
Cholera
Cholera continues to be rare in the United States and is most often acquired during travel in countries where toxigenic Vibrio cholerae O1 or O139 is circulating (1‒3). Since epidemic cholera emerged in Haiti in October 2010, associated cases have been reported in the United States in travelers who have recently arrived from Hispaniola (2,3). Of the 14 cholera infections in 2013, a total of 13 were travel-associated, including nine with travel to Hispaniola (eight to Haiti and one to the Dominican Republic) and four to other cholera affected countries (including two with travel to Cuba). Cholera remains a global threat to health, particularly in areas with poor access to improved water and sanitation, such as Haiti and sub-Saharan Africa (4,5).
- Steinberg EB, Greene KD, Bopp CA, Cameron DN, Wells JG, Mintz ED. Cholera in the United States, 1995–2000: trends at the end of the twentieth century. J Infect Dis 2001;184:799–802.
- Newton AE, Heiman KE, Schmitz A, et al. Cholera in United States associated with epidemic in Hispaniola. Emerg Infect Dis 2011;17:2166–8.
- Loharikar A, Newton AE, Stroika S, et al. Cholera in the United States, 2001–2011: a reflection of patterns of global epidemiology and travel. Epidemiol Infect 2014;May 27:1–9.
- Tappero J, Tauxe RV. Lessons learned during public health response to cholera epidemic in Haiti and the Dominican Republic. Emerg Infect Dis 2011;17:2087–93.
- Mintz ED, Guerrant RL. A lion in our village—the unconscionable tragedy of cholera in Africa. New Engl J Med 2009;360:1061–3.
Coccidioidomycosis
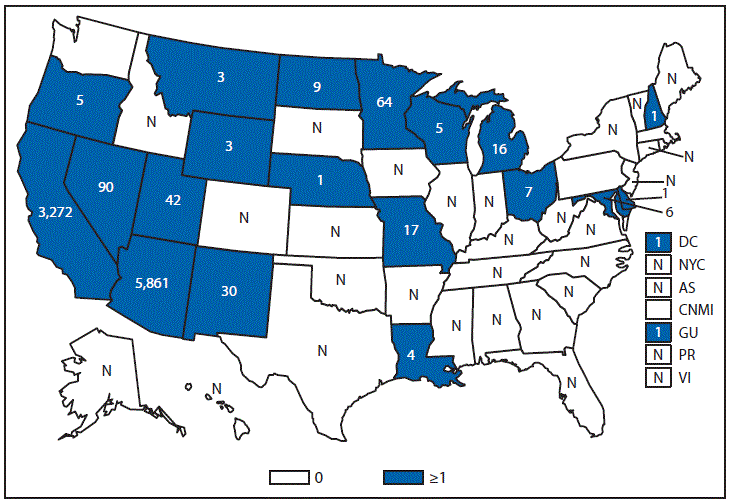
Coccidioidomycosis (i.e., Valley Fever) is a fungal infection caused by inhalation of Coccidioides spp. spores that are present in the arid soil of the southwestern United States, California, and parts of Central and South America. Coccidioides was also recently identified in soil in south-central Washington, far north of its known range, in association with three cases of human disease (1,2). After a substantial increase during 1998–2011 (3) and a decrease of approximately 22% from 2011 to 2012, the incidence of reported coccidioidomycosis decreased by 47% from 2012 (17,802) to 2013 (9,438). This decrease was largely a result of a 55% decrease in Arizona, which reports the most cases of any state. California, which reports the second-highest number of cases, experienced a decrease of 27%.
Reasons for the overall decrease in reported cases are not known but might be related to changes in the environment or changes in the at-risk population. Much of the decrease in Arizona was likely related to a change in testing methods in December 2012 at a major commercial laboratory that reports approximately 70% of coccidioidomycosis cases in Arizona (4). Despite the recent decrease, morbidity associated with this disease and the number of reported cases remains considerable, particularly in Arizona (5,861 cases) and California (3,272 cases). Physicians should continue to maintain a high suspicion for acute coccidioidomycosis among patients with an influenza-like illness or pneumonia who live in or have traveled to areas in which the disease is endemic, and they should be aware of the possibility for coccidioidomycosis outside of its previously recognized geographic range.
- Marsden-Haug N, Hill H, Litvintseva AP, et al. Coccidioides immitis identified in soil outside of its known range—Washington, 2013. MMWR Morb Mort Wkly Rep 2014;63:450.
- Marsden-Haug N, Goldoft M, Ralston C, et al. Coccidioidomycosis acquired in Washington State. Clin Infect Dis 2013;56:847–50.
- CDC. Increase in reported coccidioidomycosis—United States, 1998–2011. MMWR Morb Mort Wkly Rep 2013;62:217–21.
- Arizona Department of Health Services. Valley Fever 2012 Annual Report. Available at http://azdhs.gov/phs/oids/epi/valley-fever/documents/reports/valley-fever-2012.pdf.
Cryptosporidiosis
Although cryptosporidiosis affects persons in all age groups, cases are most frequently reported in children aged 1–4 years (1). A substantial increase in transmission of Cryptosporidium occurs during summer, coinciding with increased use of recreational water, which is a known risk factor for cryptosporidiosis. Cryptosporidium has emerged as the leading cause of reported recreational water-associated outbreaks and waterborne disease outbreaks overall (2). Transmission through recreational water is facilitated by the substantial number (108–109) of Cryptosporidium oocysts that can be shed in a single bowel movement (3), the extended time that oocysts can be shed (4), the low (≤10 oocysts) infectious dose (5), and the extreme tolerance of Cryptosporidium oocysts to chlorine (6). The increased reporting observed since 2005 continued; the rate of cryptosporidiosis increased 13% from 2012 to 2013. Furthermore, the proportion of probable cases has increased to 37% of all reported cases, primarily because of changes in the national case definition since 2011.
To reduce the burden of cryptosporidiosis associated with recreational water, enhanced prevention measures are needed. In the United States, pool codes are reviewed and approved by state or local officials; no federal agency regulates the design, construction, operation, and maintenance of treated aquatic venues. This lack of uniform national standards has been identified as a barrier to the prevention and control of outbreaks associated with treated recreational water. To provide support to state and local health departments, CDC led the development of the Model Aquatic Health Code (MAHC) (http://www.cdc.gov/mahc). This guidance document integrates the latest knowledge based on science and best practices with specific code language and explanatory materials covering the design, construction, operation, and maintenance of public swimming pools, spas, hot tubs, and other public aquatic facilities. Local and state agencies needing to create or update swimming pool and spa codes, rules, regulations, guidance, laws, or standards can use MAHC as a resource to protect public health while saving time and resources previously used to write or update code language.
- Painter JE, Hlavsa MC, Collier SA, et al. Cryptosporidiosis Surveillance—United States, 2011–2012. MMWR Surveill Summ 2015;64(No. SS-3).
- Hlavsa MC, Roberts VA, Kahler AM, et al. Outbreaks of illness associated with recreational water—United States, 2011–2012. MMWR Morb Mort Wkly Rep 2015;64:668–72.
- Goodgame RW, Genta RM, White AC, Chappell CL. Intensity of infection in AIDS-associated cryptosporidiosis. J Infect Dis 1993;167:704–9.
- Chappell CL, Okhuysen PC, Sterling CR, DuPont HL. Cryptosporidium parvum: intensity of infection and oocyst excretion patterns in healthy volunteers. J Infect Dis 1996;173:232–6.
- Chappell CL, Okhuysen PC, Langer-Curry R, et al. Cryptosporidium hominis: experimental challenge of healthy adults. Am J Trop Med Hyg 2006;75:851–7.
- Shields JM, Hill VR, Arrowood MJ, Beach MJ. Inactivation of Cryptosporidium parvum under chlorinated recreational water conditions. J Water Health 2008;6:513–20.
Cyclosporiasis
In 2013, the largest number of outbreak-associated cyclosporiasis cases was reported to CDC since 1997, and the largest number of cyclosporiasis cases was reported since the first year of national surveillance for the disease in 1999 (1,2). Of the 784 reported cases in 2013, a total of 631 (80%) occurred during June–August and were classified as outbreak associated. At least two outbreaks linked to two different fresh produce vehicles (bagged salad mix and cilantro) imported from Mexico occurred during this period. Only 199 (32%) of the 631 outbreak-associated cases could be directly linked to either of the two outbreaks; the vehicle(s) of infection for two thirds of the laboratory-confirmed domestically acquired cases could not be determined. Advanced molecular detection methods for Cyclospora are needed to link cases of cyclosporiasis to each other and to particular vehicles and sources of infection.
- Herwaldt BL. Cyclospora cayetanensis: A review, focusing on outbreaks of Cyclosporiasis in the 1990s. Clin Infect Dis 2000;31:1040–57.
- CDC. Summary of U.S. foodborne outbreaks of cyclosporiasis, 2000–2014. Available at http://www.cdc.gov/parasites/cyclosporiasis/outbreaks/foodborneoutbreaks.html.
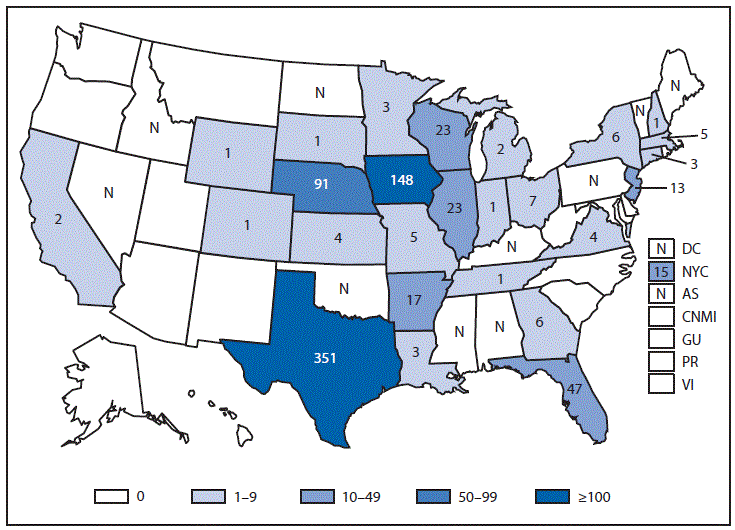
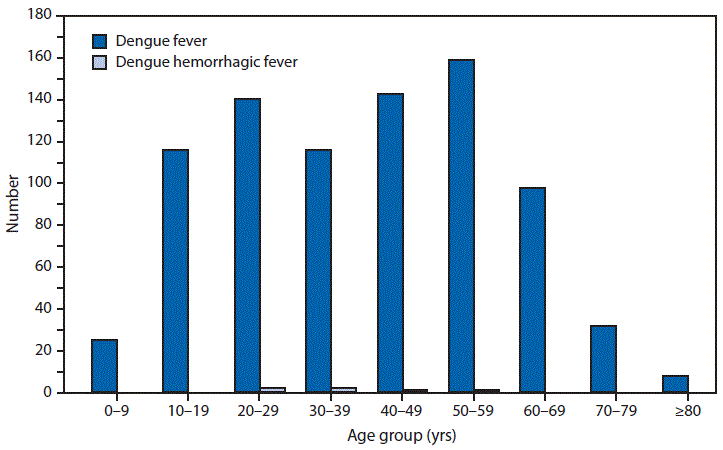
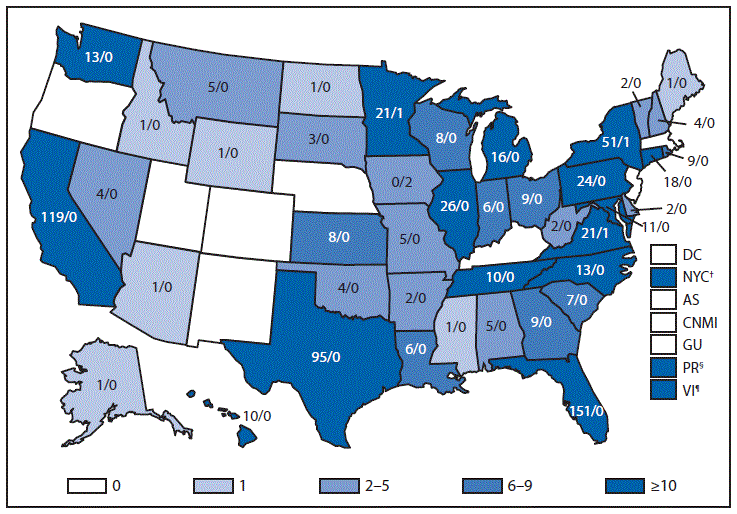
Dengue
Dengue is an acute febrile illness characterized by myalgia, headache, leukopenia, and minor bleeding manifestations (1). Patients with severe dengue experience plasma leakage resulting in fluid accumulation, hemorrhage, and/or major organ impairment (e.g., liver failure, myocarditis, and impaired consciousness). An estimated 390 million dengue virus infections occurred worldwide in 2010, of which 96 million resulted in clinically apparent illness (2). With proper clinical management, the case-fatality rate of hospitalized dengue patients can be <0.5% (3). Dengue is endemic throughout the tropics, including in the U.S. territories of Puerto Rico and the U.S. Virgin Islands. In 2013, dengue outbreaks occurred in Florida, Texas, and Puerto Rico.
In 2013, dengue epidemics occurred in the Americas and the Caribbean, including in Puerto Rico and the U.S. Virgin Islands. As a result, the 794 travel-associated cases was higher than in previous years. Travelers of all age groups continued to be affected. In association with increased incidence of travel-associated dengue, local dengue outbreaks occurred in at least three states in 2013. A dengue outbreak in southern Texas that was associated with an ongoing epidemic in northern Mexico resulted in 53 detected dengue cases, of which half were locally acquired. In Florida, an outbreak in Martin and Saint Lucie counties resulted in 25 locally acquired cases. As with the Key West outbreak during 2009–2010 (4), the sole dengue virus-type (DENV) detected in Florida in 2013 was DENV-1; however, it was distinct from the virus responsible for the Key West outbreak, suggesting that an independent importation event led to the 2013 outbreak. A single locally acquired case was detected in Long Island, New York in late 2013.
- World Health Organization. Dengue: guidelines for diagnosis, treatment, prevention and control. Geneva, Switzerland: World Health Organization; 2009.
- Bhatt S, Gething PW, Brady OJ, et al. The global distribution and burden of dengue. Nature 2013;496:504–7.
- Lam PK, Tam DT, Diet TV, et al. Clinical characteristics of dengue shock syndrome in Vietnamese children: a 10-year prospective study in a single hospital. Clin Infect Dis 2013;57:1577–86.
- Munoz-Jordan JL, Santiago GA, Margolis H, Stark L. Genetic relatedness of dengue viruses in Key West, Florida, USA, 2009–2010. Emerg Infect Dis 2013;19:652–4.
Ehrlichiosis and Anaplasmosis
Ehrlichiosis and anaplasmosis are rickettsial tickborne diseases that have been notifiable since 1998. The number of reported cases of Ehrlichia chaffeensis in 2013 (N = 1,518) was greater than previous years for the third year in a row. Similarly, the annual number of reported cases of Ehrlichia ewingii in 2013 (N = 31) was greater for the fourth year in a row. The lonestar tick (Amblyomma americanum) transmits both of these Ehrlichia species to humans. In contrast, the number of reported cases of Anaplasma phagocytophilum in 2013 (N = 2,782) was similar to 2011 (N = 2,575) and 2012 (N = 2,389). The blacklegged tick (Ixodes scapularis) and the Western blacklegged tick (Ixodes pacificus) transmit A. phagocytophilum to humans. This difference in trends between ehrlichiosis and anaplasmosis might be a result of changes in the ecology of these tick vectors, interactions between humans, animals, and ticks, use of diagnostic assays, or reporting practices.
Giardiasis
Giardiasis is the most common enteric parasitic infection in the United States, infecting an estimated 1.2 million persons annually (1). Symptomatology is variable, but giardiasis is normally characterized by diarrhea, abdominal cramps, bloating, weight loss, and malabsorption; extraintestinal symptoms are possible (2). Infected persons can shed Giardia for several weeks, and recent studies indicate a potential for chronic sequelae from giardiasis (3). Giardia is endemic worldwide, including in the United States and is the most commonly diagnosed pathogen among travelers returning to the United States from other countries (4). Giardia is commonly detected in internationally adopted children screened in the United States; often, these children do not have gastrointestinal symptoms (5).
Giardia is transmitted through the fecal-oral route with the ingestion of Giardia cysts through the consumption of fecally contaminated water and food or through person-to-person (or, to a lesser extent, animal-to-person) transmission. Most information on giardiasis transmission comes from outbreak investigations; however, the overwhelming majority of reported giardiasis cases are not linked to known outbreaks. Among reported cases, <2% are documented as outbreak-associated (6). The relative contributions of person-to-person, animal-to-person, foodborne, and waterborne transmission to sporadic human giardiasis in the United States are not well understood. New epidemiologic studies are needed to understand transmission pathways and to identify effective public health prevention measures.
Until recently, no reliable serologic assays for Giardia have been available, and no population studies of Giardia seroprevalence have been conducted. With recent laboratory advances (7), such studies might now be feasible and would contribute substantially to understanding the prevalence of giardiasis in the United States. Enhanced genotyping methods would increase knowledge of the molecular epidemiology of Giardia, including elucidating species-specific sub-assemblages (8). These tools, combined with traditional epidemiology and surveillance, would improve understanding of giardiasis risk factors, enable researchers to identify outbreaks by linking cases currently classified as sporadic infections, and provide risk factor information needed to inform prevention strategies.
- Scallan E, Hoekstra RM, Angulo FJ, et al. Foodborne illness acquired in the United States—major pathogens. Emerg Infect Dis 2011;17:7–15.
- Cantey PT, Roy S, Lee B, et al. Study of nonoutbreak giardiasis: novel findings and implications for research. Am J Med 2011;124:1175.e1–8.
- Hanevik K, Wensaas KA, Rortveit G, et al. Irritable bowel syndrome and chronic fatigue 6 years after Giardia infection: a controlled prospective cohort study. Clin Infect Dis 2014;59:1394–400.
- CDC. Surveillance for travel-related disease—GeoSentinel Surveillance System, United States, 1997–2011. MMWR Surveill Summ 2013;62:(No. SS-3).
- Staat MA, Rice M, Donauer S, et al. Intestinal parasite screening in internationally adopted children: importance of multiple stool specimens. Pediatrics 2011;128:e613–22.
- Painter JE, Gargano JW, Collier SA, Yoder JS. Giardiasis Surveillance – United States, 2011-2012. MMWR Surveill Summ 2015;64:(No. SS-3).
- Priest JW, Moss DM, Visvesvara GS, et al. Multiplex assay detection of immunoglobulin G antibodies that recognize Giardia intestinalis and Cryptosporidium parvum antigens. Clin Vaccine Immunol 2010;17:1695–707.
- Feng Y, Xiao L. Zoonotic potential and molecular epidemiology of Giardia species and giardiasis. Clin Microbiol Rev 2011;24:110–40.
Gonorrhea
The national rate of reported gonorrhea cases reached an historic low in 2009. However, from 2009 to 2012, the rate increased 8.8%, from 98.1 to 106.7 cases per 100,000 population.* In 2013, the gonorrhea rate decreased slightly (0.6%) to 106.1 cases. Although trends varied by region, the decrease during 2012–2013 was observed primarily among women. Nationwide, the gonorrhea rate among men increased 4.3%, and the rate among women decreased 5.1%. The increase among men compared with the decrease among women suggests either increased transmission or increased case ascertainment (e.g., through increased extragenital screening) among gay, bisexual, and other men who have sex with men. As in previous years, the highest rates were observed among persons aged 15–24 years, among blacks, and in the South. In 2013, the gonorrhea rate among blacks was 12.4 times the rate among whites (1).
Treatment for gonorrhea is complicated by antimicrobial resistance. Declining susceptibility to cephalosporins during 2006–2011 resulted in a change in the CDC treatment guidelines in 2012. The only CDC-recommended treatment regimen for gonorrhea is dual therapy with intramuscular ceftriaxone and oral azithromycin (2). Treatment with oral cefixime is no longer recommended because use might hasten the development of resistance to ceftriaxone. In CDC's sentinel surveillance system, Gonococcal Isolate Surveillance Project, the percentage of isolates with elevated ceftriaxone minimum inhibitory concentrations (MICs) decreased from a peak of 0.4% in 2011 to 0.05% in 2013, and the percentage of isolates with elevated cefixime MICs decreased from 1.4% in 2011 to 0.4% in 2013 (1).
- CDC. Sexually transmitted disease surveillance 2013. Atlanta, GA: US Department of Health and Human Services; 2014.
- CDC. Sexually Transmitted Diseases Treatment Guidelines, 2015. MMWR Recomm Rep 2015;64(No. RR-3):1-137.
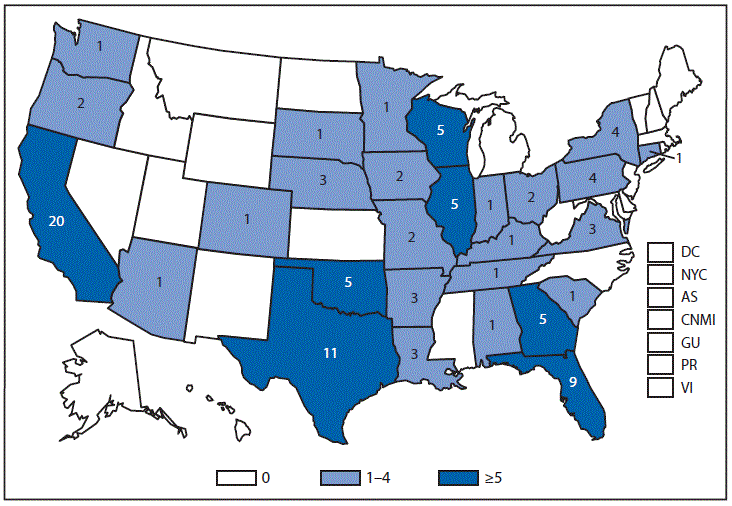
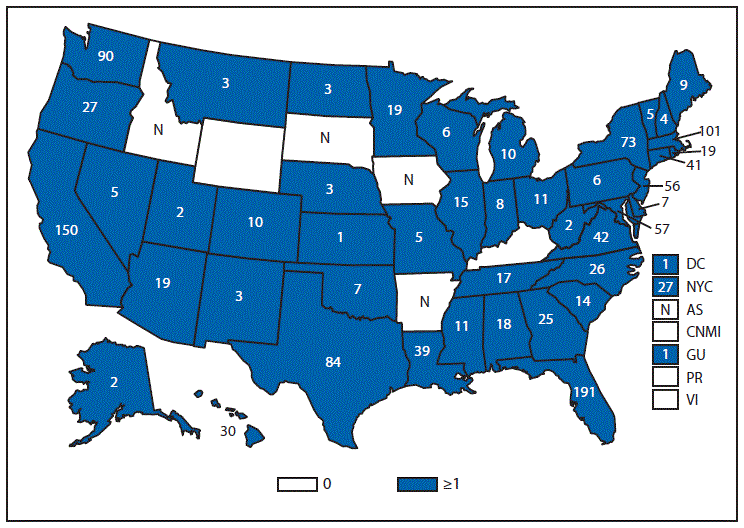
Hansen Disease (Leprosy)
In 2013, approximately 62% of 81 cases were reported from Texas (20%), New York City (12%), Florida (12%), and Hawaii (17%). An additional 18 cases were reported from U.S. territories with Guam accounting for 94% of these cases.
Hantavirus Pulmonary Syndrome
Hantavirus Pulmonary Syndrome (HPS) is a severe, sometimes fatal, respiratory disease in humans caused by infection with a hantavirus. Anyone who comes into contact with rodents that carry hantavirus is at risk for HPS. Rodent infestation in and around the home remains the primary risk for hantavirus exposure.
In 2013, two cases of HPS caused by infection with Bayou virus were confirmed, one in a Louisiana resident and one in a Texas resident. This is Louisiana's third and Texas' fourth HPS case due to Bayou virus infection. Of the 639 HPS cases reported since 1995, seven cases were related to Bayou virus and occurred in only Louisiana and Texas. Bayou virus is associated with the Rice Rat (Oryzomys palustris), which is found in marshy and semiaquatic areas in the southeastern United States and Central America (1).
Also in 2013, one patient with laboratory-confirmed acute hantavirus infection did not have respiratory symptoms and did not fit the clinical definition of HPS. CDC has recorded 10 such nonpulmonary hantavirus infections during the preceding 20 years of surveillance, which are not included in the national HPS case counts (2). This presents a missed opportunity to better understand the full spectrum of hantavirus-related disease. In 2014, CSTE recommended that Hantavirus infection, non-HPS become nationally notifiable (3).
- Mills JN, Amman BR, Glass GE. Ecology of hantaviruses and their hosts in North America. Vector Borne Zoonotic Dis 2009;10:563–74.
- Knust B, Rollin PE. Twenty-year summary of surveillance for human hantavirus infections, United States. Emerg Infect Dis 2013;19:1934–7.
- Council of State and Territorial Epidemiologists. Public health reporting and national notification for hantavirus infection. Position statement 14-ID-08.
Hemolytic Uremic Syndrome
Hemolytic uremic syndrome (HUS) is characterized by the triad of hemolytic anemia, thrombocytopenia, and renal insufficiency. The most common etiology of postdiarrheal HUS in the United States is infection with Shiga toxin-producing Escherichia coli (STEC), principally STEC O157:H7 (1,2). Children aged <5 years progress to HUS more often than all other persons infected with STEC O157:H7 (15.3% vs. 6.3%) (3). In 2013, as in previous years of surveillance, the age group with the most reported cases was children aged 1‒4 years (148 of 329 cases).
- Banatvala N, Griffin PM, Greene KD, et al. The United States prospective hemolytic uremic syndrome study: microbiologic, serologic, clinical, and epidemiologic findings. J Infect Dis 2001;183:1063–70.
- Mody RK, Luna-Gierke RE, Jones TF, et al. Infections in pediatric postdiarrheal hemolytic uremic syndrome: factors associated with identifying shiga toxin-producing Escherichia coli. Arch Pediatr Adolesc Med 2012;166:902–9.
- Gould LH, Demma L, Jones TF, et al. Hemolytic uremic syndrome and death in persons with Escherichia coli O157:H7 infection, Foodborne Diseases Active Surveillance Network sites, 2000–2006. Clin Infect Dis 2009;49:1480–5.
Human Immunodeficiency Virus Diagnoses
As of April 2008, all 50 states, the District of Columbia, and six U.S. territories have had laws or regulations requiring confidential name-based reporting for human immunodeficiency virus (HIV) infection, in addition to reporting persons whose disease has been classified as stage 3 (acquired immunodeficiency syndrome [AIDS]). In 2008, CDC published a revised surveillance case definition for HIV infection that includes AIDS and incorporates the HIV infection classification (1). Laboratory-confirmed evidence of HIV infection is required to meet the surveillance case definition for HIV infection, including stage 3 (AIDS).
This summary marks the first use of HIV data from the National HIV Surveillance System (NHSS) after implementation of updated methods for processing national HIV surveillance data. Key differences between the previous and current national data processing include more accurate deduplication resulting in lower overall numbers (approximately 1% fewer cases in the national data set) and an increase (approximately 70%) in the number of persons of multiple races living with diagnosed HIV because of the use of information from multiple records for a case when additional race information is available.
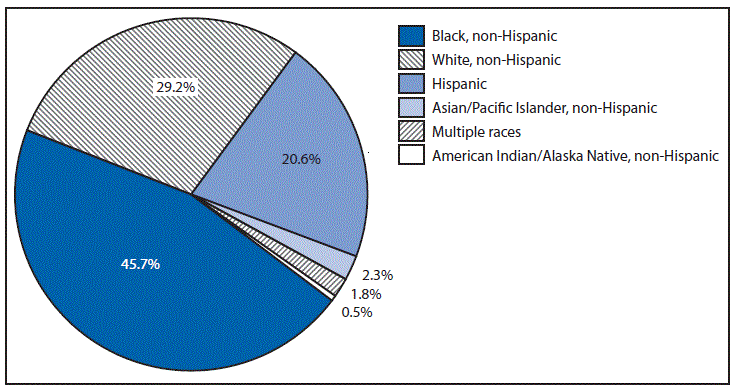
Gay, bisexual, and other men who have sex with men continue to be the risk group most affected by HIV in the United States (2). During 2013, data reported to NHSS indicated that blacks/African Americans remained the racial/ethnic group most affected by HIV, accounting for 45.7% of diagnoses that year.
- CDC. Revised surveillance case definitions for HIV infection among adults, adolescents and children aged <18 months and for HIV infection and AIDS among children aged 18 months to <13 years—United States, 2008. MMWR Recomm Rep 2008;57(No. RR-10).
- CDC. HIV Surveillance report, 2013; vol. 25. Available at http://www.cdc.gov/hiv/library/reports/surveillance/2013/surveillance_Report_vol_25.html.
Influenza-Associated Pediatric Mortality
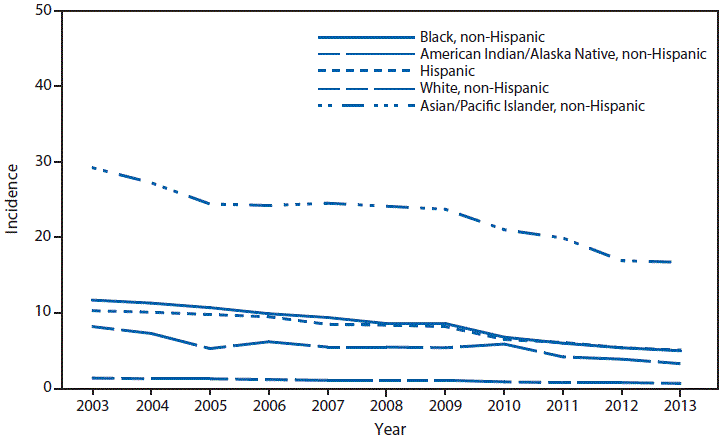
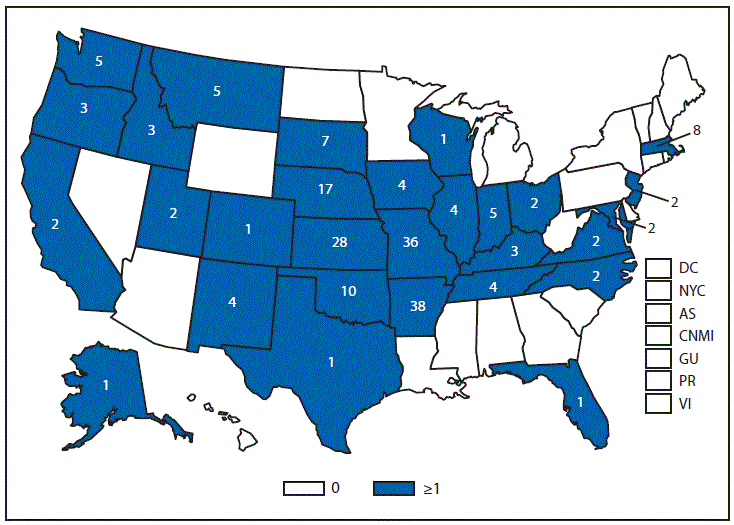
In June 2004, the Council of State and Territorial Epidemiologists added influenza-associated pediatric mortality (i.e., among persons aged <18 years) to the list of conditions reportable to the National Notifiable Diseases Surveillance System. Cumulative year-to-date incidence is published each week in MMWR Table I for nationally notifiable diseases where <1000 cases are reported during the preceding year. MMWR counts of deaths are by date of report in a calendar year and not by date of occurrence. From December 30, 2012 to December 28, 2013*, a total of 161 influenza-associated pediatric deaths were reported to CDC from 36 states, New York City, District of Columbia (one death), and Puerto Rico (one death). This compares with a mean of 69 deaths (range: 43–118) per calendar year reported for seasonal influenza during 2005–2012. A total of 358 deaths were reported from April 15, 2009 to October 2, 2010, coinciding with the 2009 influenza A (H1N1) pandemic.
Of the 161 influenza-associated pediatric deaths reported to CDC during 2013, one death occurred during the 2011–12 influenza season, 154 occurred during the 2012–13 influenza season, and six occurred during the 2013–14 influenza season. An influenza season spans the time period between MMWR week 40 of a calendar year to MMWR week 39 of the following year. Seventy-five (46.5%) deaths were associated with influenza A viruses, 81 (50.3%) with influenza B viruses, and one (0.6%) with an influenza virus for which the type was not determined; in addition, three (2%) deaths were associated with influenza A virus and influenza B virus co-infections, and one (0.6%) with an influenza A (H3N2) and A (H1N1) pdm09 co-infection. Of 75 influenza A viruses, subtype was determined for 39 (52%); nine were pH1N1 viruses and 30 were A (H3N2) viruses.
Among the 161 cases reported in 2013, a total of 17 children (11%) were aged <6 months, 47 (29%) were aged 6–59 months, and 97 (60%) were aged 5–17 years; the median age at the time of death was 6.7 years (range: 1 month–17 years). This median age is similar to that observed before the 2009 A (H1N1) pandemic for the surveillance years 2005–2008, January–April 2009, and 2011(median age range: 4–7.5 years), but lower than that observed when pH1N1 viruses circulated widely during May–December 2009 (median age: 9.3 years) and 2010 (median age: 8.2 years).
For the 161 cases reported in 2013, the overall influenza-associated mortality rate was 0.22 deaths per 100,000 children aged <18 years. This represents a more than three-fold increase in the overall rate when compared with 2012 (0.07 deaths per 100,000 children aged <18years) and a two-fold decrease in the rate compared with 2009 (0.48 deaths per 100,000 children aged <18 years). The rates by age group were 0.31 per 100,000 population for children aged <5 years, and 0.18 for children aged 5 to <18 years (1).
Information on the location of death was available for 156 (97%) of the 161 children: 95 (61%) children died after being admitted to the hospital (85 were admitted to the intensive care unit), 36 (23%) died in the emergency department, and 25 (16%) died outside the hospital. Information on pre-existing medical conditions was reported for 153 (95%) children: 83 (54%) children had one or more underlying or chronic medical conditions placing them at increased risk for influenza-associated complications (2). The most common group of underlying conditions was neurologic disorders (e.g., moderate to severe developmental delay, seizure disorders, cerebral palsy, mitochondrial disorders, neuromuscular disorders, and neurologic conditions), which was reported for 42 (27%) of 153 children. Seventeen (11%) of 153 children had cardiac disease or congenital heart disease, 15 (10%) had chromosomal abnormalities, and 37 (24%) had a chronic pulmonary condition (e.g., asthma, cystic fibrosis, or other chronic pulmonary disease).
Of 94 (58%) children who had specimens collected for bacterial culture from normally sterile sites, 46 (49%) had positive cultures, and nine (20%) of the 46 were positive for more than one pathogen. Staphylococcus aureus was detected in 24 (52%) of 46 positive cultures; 10 were methicillin-resistant, 10 were methicillin-sensitive, and for four specimens methicillin-sensitivity testing was not done. Eleven cultures (24%) were positive for Streptococcus pneumoniae and five (11%) were positive for Group A Streptococcus. Other bacterial pathogens identified included one each with Haemophilus influenzae, Haemophilus species, Pseudomonas aeruginosa, Escherichia coli, Moraxella, and Veillonella.
Of 107 children aged ≥6 months at the time of illness for whom seasonal vaccination status was known, 17 (16%) were vaccinated against influenza as recommended by the Advisory Committee on Immunization Practices (ACIP) (3). Twenty-one children were aged <6 months at the time of illness onset and ineligible for vaccination.
The number of influenza-associated pediatric deaths reported during 2013 was the highest observed since reporting began in the fall of 2004, excluding the influenza A (H1N1) pandemic in 2009 and 2010, although that increase covered several calendar years. The 2012–13 influenza season was moderately severe and peaked in late December 2012, but the majority of pediatric deaths associated with that season were reported in 2013 (4). Continued surveillance for influenza-associated mortality is important to monitor the effects of seasonal and novel influenza, factors contributing to severe influenza-associated disease, and the influence of interventions among children. Because of low vaccination rates it is recommended that increased efforts be directed towards achieving higher vaccination rates among all eligible children and encourage vaccination especially among children with the underlying medical conditions.
- National Center for Health Statistics. Vintage 2012 post-censal estimates of the resident population of the United States (April 1, 2010, July 1, 2010–July 1, 2012), by year, county, single-year of age (0, 1, 2, .., 85 years and over), bridged race, Hispanic origin, and sex. Available at ftp://ftp.cdc.gov/pub/Health_Statistics/NCHS/Datasets/NVSS/bridgepop/2012/documentation_bridged_postcen_V2012.pdf.
- CDC Prevention and control of influenza with vaccines: Recommendations of the Advisory Committee on Immunization Practices (ACIP)—United States, 2012–13 influenza season. MMWR Morb Mort Wkly Rep 2012;61;613–8.
- CDC. Recommended immunization schedules for persons aged 0 through 18 years—United States, 2012. MMWR Morb Mort Wkly Rep 2012;61:1–4.
- CDC. Influenza activity—United States, 2012–13 season and composition of the 2013–14 influenza vaccine. MMWR Morb Mort Wkly Rep 2013;62;473–9.
Listeriosis
Listeria monocytogenes infection (listeriosis) is rare but can cause severe invasive disease (e.g., bacteremia, meningitis). Listeriosis is predominately acquired through contaminated food and occurs most frequently among older adults, persons with certain immunocompromising conditions, and pregnant women and their newborns. Pregnancy-associated listeriosis is usually a relatively mild illness for the woman, but can result in fetal loss or severe neonatal disease.
Listeriosis has been nationally notifiable since 2000. In 2013, the incidence of listeriosis reported to NNDSS was 0.23 infections per 100,000 population. Progress toward the 2020 national target of 0.20 infections per 100,000 population (1) is measured through the Foodborne Diseases Active Surveillance Network (FoodNet), which conducts active, population-based surveillance for listeriosis in 10 US states. FoodNet reported a preliminary annual incidence of Listeria monocytogenes in 2013 of 0.26 infections per 100,000 population, similar to the rate reported to NNDSS (2).
The Listeria Initiative is an enhanced surveillance system designed to aid in the rapid investigation of listeriosis outbreaks by combining molecular subtyping results with epidemiologic data collected by state and local health departments (3). As part of the Listeria Initiative, CDC recommends that all clinical isolates of L. monocytogenes be forwarded routinely to a public health laboratory for pulsed-field gel electrophoresis (PFGE) subtyping, and that these PFGE subtyping results be submitted to PulseNet, the National Molecular Subtyping Network for Foodborne Disease Surveillance (4); clinical isolates also should be promptly sent to CDC for further characterization. In addition, communicable disease programs are asked to interview all patients with listeriosis promptly using the standard Listeria Initiative questionnaire, which is available in English and Spanish (http://www.cdc.gov/listeria/surveillance.html).
Beginning in September 2013, whole genome sequencing has been performed on all clinical isolates as part of a project conducted by CDC, state and local health departments, the Food and Drug Administration, the U.S. Department of Agriculture's Food Safety and Inspection Service, the National Institutes of Health, and international partners (5). All isolate sequences are deposited in publicly available databases at the National Center for Biotechnology Information of the National Institutes of Health. The Listeria Initiative has aided in the timely identification and removal of contaminated food during several listeriosis investigations, including a multistate outbreak of 6 illnesses that was linked to farmstead cheese in 2013 (6).
- US Department of Health and Human Services. Healthy people 2020 objectives. Available at http://www.healthypeople.gov/2020/topicsobjectives2020/objectiveslist.aspx?topicId=14.
- Crim SM, Iwamoto M, Huang JY, et al. Incidence and trends of infection with pathogens transmitted commonly through food—Foodborne Diseases Active Surveillance Network, 10 U.S. sites, 2006–2013. MMWR Morb Mort Wkly Rep 2014;63:328–32.
- CDC. National Enteric Disease Surveillance: The Listeria Initiative. Atlanta, Georgia: US Department of Health and Human Services, CDC, 2014. Available at http://www.cdc.gov/listeria/pdf/ListeriaInitiativeOverview_508.pdf.
- CDC. PulseNet. Available at http://www.cdc.gov/pulsenet.
- CDC. AMD Projects: Learning from listeria. Available at http://www.cdc.gov/amd/project-summaries/listeria.html.
- CDC. Multistate Outbreak of Listeriosis linked to Crave Brothers Farmstead Cheeses (Final Update). Available at http://www.cdc.gov/listeria/outbreaks/cheese-07-13/index.html.
Lyme Disease
National surveillance for Lyme disease was implemented in the United States in 1991 using a case definition based on clinical and laboratory findings. CSTE revised the case definition, effective 2008, to standardize laboratory criteria for confirmation and to allow reporting of "probable" cases.
In 2013, the number of confirmed and probable Lyme disease cases reported to CDC increased compared with the average number reported during 2010–2012. However, the number of confirmed cases in 2013 remained lower than the average reported during 2007–2009. Nevertheless, the geographic distribution of cases continues to increase. In 2013, a total of 412 counties had a reported incidence of ≥10 confirmed cases per 100,000 persons compared with 356 counties in 2012, and 324 counties in 2008.
Measles
Measles was declared eliminated from the United States in 2000. Since then, elimination has been maintained through high population immunity along with adequate disease surveillance and public health response capacity (1,2). Nonetheless, because measles remains endemic in much of the world, importations continue to result in sporadic cases and outbreaks in the United States, which can be costly to control (3). As in recent years, most measles cases (98%) were import associated (4). Measles was classified as internationally imported in 52 cases (5), 30 of which were in U.S. residents exposed while traveling abroad.
A measles outbreak is defined as a chain of transmission involving three or more cases. Ten outbreaks occurred in 2013, accounting for 75% of the total cases. The three largest outbreaks accounted for 55% of the cases. In each of these outbreaks, transmission occurred after a U.S. resident traveler introduced measles into communities with pockets of persons unvaccinated because of philosophical or religious beliefs. This allowed for spread to occur, mainly in households and community gatherings, before public health interventions could be implemented.
The largest outbreak occurred in New York City (58 cases). None of the patients had documentation of vaccination at the time of exposure. Twelve patients were aged <12 months. Of those who were eligible for vaccination, 67% had objected or had parental objection to vaccination because of religious or philosophical beliefs (6). The second largest outbreak occurred in North Carolina (23 cases, including a California resident) and mainly involved persons not vaccinated because of personal belief exemptions (7). The third largest outbreak was among 21 members of a church community in Texas aged 4 months–44 years. Nineteen (90%) of the cases were in patients aged >12 months, and 81% of those were unvaccinated (8). These outbreaks illustrate that imported measles cases can result in large outbreaks, particularly if introduced into areas with pockets of unvaccinated persons.
- Hutchins SS, Bellini W, Coronado V, et al. Population immunity to measles in the United States. J Infect Dis 2004:189(Suppl 1):S91‒97.1.
- Papania MJ, Wallace GS, Rota PA, et al. Elimination of endemic measles, rubella and congenital rubella syndrome from the Western Hemisphere—The United States experience. JAMA Pediatr 2014;168:148‒55.
- Parker AA, Staggs W, Dayan G, et al. Implications of a 2005 measles outbreak in Indiana for sustained elimination of measles in the United States. N Engl J Med 2006;355:447‒55.
- Council of State and Territorial Epidemiologists. Revision of measles, rubella, and congenital syndrome case classification as part of elimination goals in the United States. Position statement 2006-ID-16.
- CDC. Prevention of measles, rubella, congenital rubella syndrome, and mumps, 2013: Summary recommendations of the Advisory Committee on Immunization Practices (ACIP). MMWR Recomm Rep 2013;62(No. RR-4).
- CDC. Measles outbreak among members of a religious community—Brooklyn, New York, March‒June 2013. MMWR Morb Mort Wkly Rep 2013;62:752‒3.
- CDC. Measles outbreak associated with a traveler returning from India—North Carolina, April–May 2013. MMWR Morb Mort Wkly Rep 2013;62;753.
- CDC. Measles—United States, January 1–August 24, 2013. MMWR Morb Mort Wkly Rep 2013;62:741‒3.
Meningococcal Disease
Neisseria meningitidis is an important cause of bacterial meningitis and sepsis in the United States. In 2013, rates of meningococcal disease continued to be at historic lows in the United States (0.18 per 100,000 population). Meningococcal disease incidence remained highest among infants aged <1 year and adolescents and young adults (1,2). Among infants, disease incidence peaks within the first six months of life and most cases in this age group are caused by serogroup B (2). Serogroups C, Y, or W cause 73% of all cases of meningococcal disease among persons aged ≥11 years (2). In 2013, two universities, one in New Jersey and one in California, experienced serogroup B outbreaks with a combined 13 cases and one death reported.
CDC's Advisory Committee on Immunization Practices recommends routine use of quadrivalent (A, C, W, Y) meningococcal conjugate vaccine in adolescents and others at increased risk for disease (1,3). In October 2010, a booster dose was recommended for adolescents at age 16 years (1). In 2013, coverage with at least one dose of meningococcal conjugate vaccine was 77.8% among adolescents aged 13–17 years in the United States; however, coverage ranged from 40.4%–93.7% by state, including the District of Columbia (4). Two serogroup B meningococcal vaccines were licensed for use in the United States in 2014 and 2015. Both vaccines are approved for use in persons aged 10–25 years.
- CDC. Prevention and control of meningococcal disease: recommendations of the Advisory Committee on Immunization Practices (ACIP). MMWR Recomm Rep 2013;62(No.RR-2).
- Cohn AC, MacNeil JR, Harrison LH, et al. Changes in Neisseria meningitidis disease epidemiology in the United States, 1998–2007: implications for prevention of meningococcal disease. Clin Infect Dis 2010:50:184–91.
- CDC. Use of MenACWY-CRM vaccine in children aged 2 through 23 months at increased risk for meningococcal disease. MMWR Morb Mort Wkly Rep 2014;63:527–30.
- CDC. National and state vaccination coverage among adolescents aged 13–17 years—United States, 2013. MMWR Morb Mort Wkly Rep 2014;63:625–33.
Novel Influenza A Viruses
In 2007, CSTE added human infection with a novel influenza A virus to the list of conditions reportable to NNDSS (1). Novel influenza A virus infections are human infections with influenza A viruses that are different from currently circulating human seasonal influenza viruses. These viruses include those that are subtyped as nonhuman in origin and those that cannot be subtyped with standard methods and reagents used for currently circulating influenza viruses.
Influenza viruses that circulate in swine are called swine influenza viruses when isolated from swine, but are called variant viruses when isolated from humans. During 2005–2013, all cases of human infection with novel influenza A viruses involved variant viruses, rather than avian-origin influenza viruses. Although most persons identified with variant influenza virus infection report contact with swine preceding their illness, limited human-to-human transmission of these viruses has occurred (2). Because the implications of sustained, ongoing transmission of these viruses between humans are potentially severe, prompt and thorough investigation of sporadic human infections with nonhuman influenza viruses is needed to reduce the risk for sustained transmission (3).
In 2013, a total of 21 cases of human infection with novel influenza A viruses were reported from six states (Arkansas [two], Illinois [one], Indiana [14], Iowa [one], Michigan [two], and Ohio [one]) (4,5). Two cases (Arkansas) were associated with an influenza A (H1N1) variant virus (H1N1v), and the other 19 cases were associated with influenza A (H3N2) variant viruses (H3N2v). Twelve cases occurred in June (Indiana), four cases in July (Illinois [one], Indiana [two], and Ohio [one]), two cases in August (Michigan), and three cases in September (Arkansas [two] and Iowa [one]). The median age of patients was six years (range: 2–69 years), and 20 (95%) were aged <18 years; seven (33%) were male. The most commonly reported symptoms were fever (100%), cough (90%), fatigue (74%), and vomiting or diarrhea (57%); 19 (90%) patients reported influenza-like illness (e.g., fever (≥100°F [37.8°C], oral or equivalent) with cough and/or sore throat). Overall, six (29%) patients had at least one underlying medical condition known to confer increased risk for complications from influenza (6), the most common of which was asthma, which occurred in three patients. Twenty patients (95%) sought health care for illness and one of the 21 patients (with H3N2v virus infection) was hospitalized for influenza; all 21 fully recovered from their illness. All 21 patients reported direct contact (touching or handling) or indirect contact (walking through an area or coming within 6 feet) with swine in the week preceding illness onset. No cases were identified that were associated with likely human-to-human transmission of novel influenza A viruses.
Transmission of variant influenza A viruses to humans usually occurs among persons in direct contact with pigs or in those who have visited places where pigs were present (e.g., agricultural fairs, farms, and petting zoos). CDC conducts surveillance for human infections with novel influenza A viruses in conjunction with state and local public health laboratories year-round and conducts extensive epidemiologic investigations on each case. Any specimen with results suggestive of the presence of a novel influenza A virus or that cannot be subtyped using standard methods and reagents at a public health laboratory is immediately submitted to CDC for further testing. Surveillance for human infections with novel influenza A viruses is essential, and early identification and investigation of these cases are critical to evaluate the extent of outbreaks, and the potential for human-to-human transmission.
- Council of State and Territorial Epidemiologists. National reporting for initial detections of novel influenza A viruses. Position statement 07-ID-01. Available at http://c.ymcdn.com/sites/www.cste.org/resource/resmgr/PS/07-ID-01.pdf.
- Jhung MA, Epperson S, Biggerstaff M, et al. Outbreak of Variant Influenza A (H3N2) virus in the United States. CID 2013;57:1703–12.
- CDC. Update: Influenza A (H3N2)v transmission and guidelines—five states, 2011. MMWR Morb Mort Wkly Rep 2012;60:1741–4.
- CDC. Update: Influenza activity—United States and Worldwide, May 19–September, 2013. MMWR Morb Mort Wkly Rep 2013;62:838–42.
- CDC. Update: Influenza activity—United States, September 29–December 7, 2013. MMWR Morb Mort Wkly Rep 2013;62:1032–6.
- CDC. Prevention and control of seasonal influenza with vaccines: recommendations of the Advisory Committee on Immunization Practices—United States, 2013-2014. MMWR Recomm Rep 2013;62:(No. RR-7).
Pertussis
Reported pertussis cases decreased from 2012 (incidence: 15.4 per 100,000 population) to 2013 (9.1); however, U.S. pertussis case notifications continue to exceed those reported during the 1990s and early 2000s. Age-specific pertussis rates were highest among infants aged <1 year (102.8 per 100,000 population); children aged 7–10 years contributed the second highest rates of disease nationally (30.6), followed closely by adolescents aged 11–14 years (28.7).
A single dose of tetanus, diphtheria, and acellular pertussis (Tdap) vaccine is recommended for all adults and adolescents aged ≥11 years. Although coverage among adolescents aged 13–17 years continues to improve (84.6% in 2012 to 86.0% in 2013), coverage among adults remains low (14.2% in 2012) (1–3). To reduce the burden of pertussis among young infants, Tdap vaccination during pregnancy remains a priority. ACIP recommends a dose of Tdap vaccine during every pregnancy (4).
- CDC. National and state vaccination coverage among adolescents aged 13–17 years—United States, 2012. MMWR Morb Mort Wkly Rep 2013;62:685–93.
- CDC. National and state vaccination coverage among adolescents aged 13–17 years—United States, 2013. MMWR Morb Mort Wkly Rep 2014;63:625–33.
- CDC. Noninfluenza vaccination coverage among adults—United States, 2012. MMWR Morb Mort Wkly Rep 2014;63:95–102.
- CDC. Updated recommendations for use of tetanus toxoid, reduced diphtheria toxoid, and acellular pertussis vaccine (Tdap) in pregnant women—Advisory Committee on Immunization Practices (ACIP), 2012. MMWR Morb Mort Wkly Rep 2013;62;131–5.
Poliomyelitis, Paralytic and Poliovirus Infections
Vaccine-Associated Paralytic Poliomyelitis (VAPP) is a rare adverse reaction that can occur following vaccination with live-attenuated oral poliovirus vaccine (OPV) or after a susceptible person is exposed to someone who has been vaccinated with OPV (1,2). Inactivated poliovirus vaccine (IPV) does not cause VAPP. To reduce the risk for VAPP, the United States changed from an all OPV schedule to a sequential IPV/OPV schedule in 1997, and then to an all IPV schedule in 2000 (3,4). Before the use of OPV was discontinued in 2000, approximately eight cases of VAPP occurred in the United States each year (5). Since that time, only three cases of VAPP have been reported in the U.S.: one in 2005 in an unvaccinated traveler to countries using OPV (6), a second in 2009 in a U.S.-born resident with longstanding common variable immunodeficiency (7), and a third described below in a person who had severe combined immunodeficiency syndrome (SCIDS) (8).
In 2013, the Texas Department of State Health Services reported VAPP in a male infant from India with severe combined immunodeficiency. The infant, aged 7 months, was referred to a community hospital in early July 2013 with intermittent fever associated with a draining skin lesion at the site of a baccile Calmette-Guérin (BCG) vaccination. The child later developed increased irritability and decreased movement of the left leg. Blood culture confirmed the diagnosis of BCG-osis (disseminated BCG infection) and stool culture identified immunodeficiency-related vaccine derived poliovirus iVDPV type 1 (iVDPV1). Genetic evaluation of the iVDPV1 isolate was consistent with receipt of the first of two OPV doses administered during national immunization days in India, although other potential sources of secondary exposure are possible. The child developed respiratory distress and subsequently died.
- Henderson DA, Witte JJ, Morris L, Langmuir AD. Paralytic disease associated with oral polio vaccines. JAMA 1964;190:41–8.
- Nkowane MB, Wassilak SGF, Orenstein WA, et al. Vaccine-associated paralytic poliomyelitis. United States: 1973 through 1984. JAMA 1987;257:1335–40.
- CDC. Poliomyelitis prevention in the United States: introduction of a sequential vaccination schedule of inactivated poliovirus vaccine followed by oral poliovirus vaccine; recommendations of the Advisory Committee on Immunization Practices (ACIP). MMWR Recomm Rep 1997;46(No. RR-3).
- CDC. Poliomyelitis prevention in the United States: updated recommendations of the Advisory Committee on Immunization Practices (ACIP). MMWR Recomm Rep 2000;49(No. RR-5).
- Alexander LN, Seward JF, Santibanez TA, et al. Vaccine policy changes and epidemiology of poliomyelitis United States. JAMA 2004;292:1696–701.
- CDC. Imported vaccine-associated paralytic poliomyelitis—United States, 2005. MMWR Morb Mort Wkly Rep 2006;55:97–9.
- DeVries AS, Harper J, Murray A, et al. Vaccine-derived poliomyelitis 12 years after infection in Minnesota. New Engl J Med 2011;364:2316–23.
- CDC. Vaccine-associated paralytic poliomyelitis and BCG-osis in an immigrant child with severe combined immunodeficiency syndrome—Texas, 2013. MMWR Morb Mort Wkly Rep 2014;63:721–4.
Q fever
Q fever is a worldwide disease with acute and chronic stages caused by the bacteria Coxiella burnetii. During June–December 2013, an outbreak of Q fever in the United States occurred in Missouri resulted in 47 cases that met the outbreak case definition. This outbreak was associated with a large-scale cow and goat dairy. Two categories of Q fever have been notifiable since 2008: acute Q fever and chronic Q fever. Although patients with acute Q fever have good survival rates, chronic Q fever can be life threatening, especially when untreated. Thirty-three cases of chronic Q fever were reported in 2013, an increase in the annual number of reported cases (range: 16–26) since chronic Q fever became a reportable condition.
Salmonellosis
In 2013, the incidence of salmonellosis in the United States was 15.5 laboratory-confirmed infections per 100,000 population, approximately one and a half times the 2020 national health objective target of 11.4 infections per 100,000 population (1). Data from the Foodborne Diseases Active Surveillance Network (FoodNet), which conducts active surveillance for salmonellosis in 10 U.S. states, are used to measure progress towards Healthy People 2020 objectives. In 2013, FoodNet reported a preliminary annual incidence of Salmonella of 15.2 infections per 100,000 population, slightly lower than the rate reported to NNDSS (2). During 2013, as in previous years of surveillance, children aged <5 years had the highest reported incidence rates of salmonellosis. Salmonellosis is reported most frequently in late summer and early fall; in 2013, this seasonality was evident, with most reports in June, July, August, and September.
Accounting for underdiagnosis, Salmonella causes an estimated 1.2 million illnesses annually in the United States, approximately 1 million of which are transmitted by food consumed in the United States (3). Salmonella can contaminate a wide range of foods, and different serotypes tend to have different animal reservoirs and food sources, making control challenging. In 2013, the largest multistate outbreak of Salmonella infections (serotype Heidelberg) was traced to contaminated chicken; other notable outbreaks were linked to live poultry (serotypes Typhimurium, Infantis, Lille, Newport, and Mbandaka), tahini sesame paste (serotypes Montevideo and Mbandaka), cucumbers (serotype Saintpaul), ground beef (serotype Typhimurium), and small turtles (serotypes Sandiego, Pomona, and Poona) (4).
- US Department of Health and Human Services. Healthy People 2020 objectives. Available at http://www.healthypeople.gov/2020/topicsobjectives2020/objectiveslist.aspx?topicId=14.
- CDC. Foodborne Diseases Active Surveillance Network. Available at http://www.cdc.gov/foodnet/data/trends/tables/2013/table2a-b.html#table-2b.
- Scallan E, Hoekstra RM, Angulo FJ, et al. Foodborne illness acquired in the United States—major pathogens. Emerg Infect Dis 2011;17:7–15.
- CDC. Reports of selected Salmonella outbreak investigations, 2013. Available at http://www.cdc.gov/salmonella/outbreaks.html.
Shiga toxin-producing Escherichia coli (STEC)
In 2013, the incidence of laboratory-confirmed Shiga toxin-producing Escherichia coli (STEC) infections in the United States was 1.9 cases per 100,000 population. As in previous years of surveillance, the age group with the highest incidence of reported STEC infections was children aged <5 years. In 2013, multistate outbreaks of STEC infection linked to foods included ready-to-eat salads (STEC O157:H7) and frozen food products from a single manufacturer (STEC O121) (1).
Public health actions to monitor, prevent, and control STEC infections are based on serogroup characterization. Development of postdiarrheal hemolytic uremic syndrome (HUS), a severe complication of STEC infection, is most strongly associated with STEC O157. Non-O157 STEC, a diverse group that varies in virulence, comprises over 50 other serogroups. In the United States, STEC O157 is the most commonly reported serogroup of STEC causing human infection; however, increased use of assays for the detection of Shiga toxins in clinical laboratories in recent years has led to increased reporting of non-O157 STEC infection (2). STEC can produce Shiga toxins (Stx): Stx1, Stx2, or both. In general, strains that produce certain types of Stx 2 are the most virulent (3). Accounting for underdiagnosis, approximately 96,000 illnesses are caused by STEC O157, and approximately 168,000 illnesses are caused by non-O157 STEC each year (4).
Stool specimens from patients with community-acquired diarrhea submitted to clinical laboratories should be tested routinely both by culture for STEC O157 and by an assay that detects Shiga toxins (or the genes that encode them). Detection of Shiga toxin alone is inadequate for clinical management and public health investigation; characterizing STEC isolates by serogroup and by pulsed-field gel electrophoresis pattern is important to detect, investigate, and control outbreaks.
- CDC. Reports of selected E. coli outbreak investigations. Available at http://www.cdc.gov/ecoli/outbreaks.html.
- Gould LH, Mody RK, Ong KL, et al. Increased recognition of non-O157 Shiga toxin-producing Escherichia coli infections in the United States during 2000‒2010: epidemiologic features and comparison with E. coli O157 infections. Foodborne Pathogens and Disease 2013;10:453–60.
- Mody RK, Griffin PM. Fecal shedding of Shiga toxin-producing Escherichia coli: what should be done to prevent secondary cases? Clin Infect Dis 2013;56:1141–4.
- Scallan E, Hoekstra RM, Angulo FJ, et al. Foodborne illness acquired in the United States—major pathogens. Emerg Infect Dis 2011;17:7–15.
Shigellosis
In 2013, the incidence of reported shigellosis in the United States was 4.1 infections per 100,000 population; Shigella infections have not declined appreciably since 2003 (1). In 2013, as in previous years, the highest number of reported cases of shigellosis occurred among children aged <10 years. S. sonnei infections generally account for about 75% of shigellosis in the United States (1). Shigellosis does not demonstrate marked seasonality, likely reflecting the importance of person-to-person transmission.
Accounting for underdiagnosis, Shigella causes an estimated 500,000 illnesses annually in the United States, approximately 130,000 of which are transmitted by food consumed in the United States (2). Shigella is often transmitted person-to-person, including through sexual contact between men who have sex with men (MSM), and can also be transmitted by contaminated food or by contaminated water used for drinking or recreational purposes (3). Some cases of shigellosis are also acquired during international travel (4,5). Child care-associated outbreaks are common and are often difficult to control (6).
MSM and HIV-positive persons appear to be at the greatest risk for Shigella with decreased susceptibility to azithromycin. In 2013, all isolates known to be resistant to azithromycin harbored mphA or ermB macroslide resistance genes that are commonly plasmid-encoded. Clinicians are urged to test MSM and HIV-positive persons with shigellosis for antimicrobial resistance testing to determine the best course of treatment (7).
- CDC. National Shigella Surveillance annual summary, 2012. Atlanta, Georgia: US Department of Health and Human Services, CDC, 2013. Available at http://www.cdc.gov/ncezid/dfwed/pdfs/shigella-annual-report-2012-508c.pdf.
- Scallan E, Hoekstra RM, Angulo FJ, et al. Foodborne illness acquired in the United States—major pathogens. Emerg Infect Dis 2011;17:7–15.
- Gupta A, Polyak CS, Bishop RD, Sobel J, Mintz ED. Laboratory confirmed shigellosis in the United States, 1989–2002: epidemiologic trends and patterns. Clin Infect Dis 2004;38:1372–7.
- Ram PK, Crump JA, Gupta SK, Miller MA, Mintz, ED. Review article: part II. Analysis of data gaps pertaining to Shigella infections in low and medium human development index countries, 1984–2005. Epidemiol Infect 2008;136:577–603.
- Gupta SK, Strockbine N, Omondi M, Hise K, Fair MA, Mintz ED. Emergence of Shiga toxin 1 genes within Shigella dysenteriae Type 4 isolates from travelers returning from the island of Hispaniola. Am J Trop Med Hyg 2007;76:1163–5.
- Arvelo W, Hinkle J, Nguyen TA, et al. Transmission risk factors and treatment of pediatric shigellosis during a large daycare center-associated outbreak of multidrug resistant Shigella sonnei. Pediatr Infect Dis J 2009;11:976–80.
- CDC. Shigella with decreased susceptibility to azithromycin among men who have sex with men—United States, 2002–2013. MMWR Morb Mortal Wkly Rep 2014;63:132–3.
Spotted Fever Rickettsiosis
Spotted fever rickettsioses (SFR) are a group of tickborne infections caused by some members of the genus Rickettsia. The number of reported cases of SFR decreased from 4,470 in 2012 to 3,359 in 2013. Although a decrease in reported SFR cases occurred, 2013 represents the second highest year of SFR reports since 1920, when national surveillance of SFR began. Rocky Mountain spotted fever (RMSF), the most virulent of the SFR, is vectored by the American dog tick (Dermacentor variabilis), the brown dog tick (Rhipicephalus sanguineus), and the Rocky Mountain wood tick (Dermacentor andersoni) in the United States.
Syphilis, Congenital
Trends in congenital syphilis usually follow trends in primary and secondary syphilis among women, with a lag of 1–2 years. During 2009–2012, national rates of female primary and secondary syphilis and congenital syphilis declined. In 2013, the rate of congenital syphilis increased from 8.4 to 8.7 cases per 100,000 live births, the first increase since 2008. This increase was largely driven by increased cases in the West, and coincided with the increased rate of primary and secondary syphilis among women in the West during 2010–2013. Racial and ethnic disparities persisted: rates of congenital syphilis among blacks (29.0 cases per 100,000 live births) and among Hispanics (9.7 cases per 100,000 live births) were 10.4 and 3.5 times, respectively, the rate among whites (2.8 cases per 100,000 live births) (1).
- CDC. Sexually transmitted disease surveillance 2013. Atlanta, GA: US Department of Health and Human Services, CDC; 2014.
Syphilis, Primary and Secondary
In 2013, rates of primary and secondary syphilis were the highest reported since 1995. During 2012–2013, the rate of primary and secondary syphilis increased from 5.0 cases to 5.5 cases per 100,000 population. The rate among women (0.9 cases per 100,000 population) remained unchanged in 2013, but among men increased from 9.2 (in 2012) to 10.3 (in 2013) cases per 100,000 population, marking the 13th consecutive year the rate increased among men. Rates were highest in men aged 20–24 years and 25–29 years (1). In 2013, the rate among men remained highest among blacks aged 20–24 years and 25–29 years (96.4 cases and 97.2 cases per 100,000 population, respectively) (1). During 2007–2013, a total of 33 jurisdictions reported sex-of-sexual-partner data for 70% or more cases of primary and secondary syphilis each year; cases among gay, bisexual, and other men who have sex with men (MSM) increased each year. In 2013, 75% of all cases of primary and secondary syphilis were among MSM.
- CDC. Sexually transmitted disease surveillance 2013. Atlanta, GA: US Department of Health and Human Services, CDC; 2014.
Trichinellosis
In 2013, a total of 22 trichinellosis cases were reported. The 18 cases for which a suspected or known source of Trichinella infection was documented were attributed to the consumption of wild boar (n = 10), bear (n = six), and unspecified type of pork (n = two). No likely source of infection could be identified for the remaining four cases reported.
Two outbreaks were reported in 2013. One outbreak involved illnesses in three of five persons, all residents of Maryland, who ate bear meat that was hunted in Alaska. The meat was prepared into patties that were reportedly cooked on a charcoal grill for 15 minutes. This underscores the unreliability of cook time or subjective measures (e.g., color/appearance of meat) to assess doneness and the need to use a food thermometer to ensure that the meat has reached a safe temperature for consumption (1). The other 2013 outbreak affected members of two families in Illinois. A member of one of the families prepared sausage with deer meat and the meat of a wild boar that he hunted at a wild game park in Missouri. He shared the meat with his own family and members of a second family; all nine persons who consumed the deer and wild boar sausage developed trichinellosis (2). No boar meat was available for testing, but leftover samples of deer meat and the sausage were sent to CDC for confirmation and molecular characterization. The deer meat was negative for Trichinella parasites, but Trichinella spiralis larvae were found in the sausage; therefore, the wild boar and not the deer was determined to be the source of infection. This was the second reported trichinellosis outbreak in three years associated with boar from a wild game park. This highlights the risks associated with eating meat from wild animals, even those hunted in relative captivity, such as those in wild game parks (2,3). The best way to prevent Trichinella infection is to thoroughly cook all meats to the USDA-recommended temperatures before consumption (1).
- CDC. Trichinellosis: Prevention and control. July 19, 2013. Available at http://www.cdc.gov/parasites/trichinellosis/prevent.html.
- CDC. Trichinellosis caused by consumption of wild boar meat—Illinois, 2013. MMWR Morb Mort Wkly Rep 2013;63:451.
- Holzbauer M, Agger W, Hall R, et al. Outbreak of Trichinella spiralis infections associated with a wild boar hunted at a game farm in Iowa. Clin Infect Dis 2014;59:1750–56.
Typhoid Fever
Typhoid fever is rare in the United States. Since 2009, an annual average of less than 400 cases have been reported. In 2013, a total of 338 cases were reported. Approximately 75% of U.S. cases are associated with international travel (1), and the risk for infection is highest for travelers visiting friends and relatives in countries where typhoid fever is endemic, perhaps because they are less likely than other travelers to seek pretravel vaccination and to observe strict safe water and food practices. The risk also is higher for travelers who visit areas where the disease is highly endemic, such as the Indian subcontinent, even for a short time (2). In 2011, CDC removed pretravel typhoid vaccination recommendations for 26 low-risk destinations; pretravel vaccination guidelines are available at http://wwwnc.cdc.gov/travel (3).
- Lynch MF, Blanton EM, Bulens S, et al. Typhoid fever in the United States, 1999–2006. JAMA 2009;302:859-65.
- Steinberg EB, Bishop RB, Dempsey AF, et al. Typhoid fever in travelers: who should be targeted for prevention? Clin Infect Dis 2004;39:186–91.
- Johnson KJ, Gallagher NM, Mintz ED, Newton AE, Brunette GW, Kozarsky PE. From the CDC: New country-specific recommendations for pre-travel typhoid vaccination. J Travel Med 2011; 18:430–3.
Varicella
A second dose of varicella vaccine was added to the vaccination schedule for children in 2006 (1). Since then, the number of states reporting varicella cases to CDC through the National Notifiable Diseases Surveillance System (NNDSS) has increased from 29 to 40 as of 2013. Among these 40 states, varicella incidence in 31 states meeting criteria for adequate and consistent reporting (2) has declined 80.6% from 31.4 per 100,000 in 2006 to 6.1 per 100,000 in 2013.
National varicella surveillance data are being used to monitor trends in varicella incidence. Monitoring the association of the varicella vaccination program and disease trends requires data from variables such as age, vaccination status, disease severity (e.g., number of lesions), outcome of the case (e.g., hospitalized or died), and whether the case is associated with an outbreak. In 2013, among the cases reported from the 31 states with adequate and consistent reporting (2), data on age, vaccination status, disease severity, outcome, and whether the case was outbreak-related were included for 94%, 45%, 30%, 20%, and 65% of the cases, respectively. Of the limited number of cases with complete information, 50% were aged 1–9 years and 22.9% were aged 10–19 years; 54.9% had received at least one dose of varicella vaccine, and of those with information on number of doses, 56.3% received 2 doses; 49.2% reported mild disease (<50 lesions); 2% of cases had been hospitalized; and 14.2% were associated with outbreaks. Additionally, 27.8% of reported cases had laboratory testing for varicella, of which 7.4% were laboratory confirmed. As states continue improving varicella surveillance practices (3), increasing completeness of reporting for the clinical and epidemiologic variables and increasing laboratory testing of reported cases will allow for effective continued monitoring of the association of the 2-dose varicella vaccine program and changing varicella epidemiology.
- CDC. Prevention of varicella: recommendations of the Advisory Committee on Immunization Practices (ACIP). MMWR Recomm Rep 2007;56:(No. RR-4).
- CDC. Evolution of varicella surveillance—selected states, 2000–2010. MMWR Morb Mortal Wkly Rep 2012;61:609–12.
- Lopez AS, Lichtenstein M, Schmid SD, Bialek S. Assessment of Varicella Surveillance and Outbreak Control Practices—United States, 2012. MMWR Morb Mortal Wkly Rep 2014;63:785–88.
Vibriosis
The incidence of reported vibriosis (infection caused by a species from the family Vibrionaceae other than toxigenic Vibrio cholerae O1 or O139) has increased since 2007 (1). In 2012, an outbreak of V. parahaemoyticus infections was associated with consumption of shellfish harvested from Oyster Bay Harbor, New York (2). This same strain continued to cause illness in 2013 resulting in a total of 104 cases in 13 states. Illness was associated with consumption of shellfish harvested from Connecticut, Massachusetts, New York, and Virginia (3).
- Newton A, Kendall M, Vugia DJ, et al. Increasing rates of vibriosis in the United States, 1996–2010: review of surveillance data from 2 systems. Clin Infect Dis 2012;54 Suppl 5:S391–5.
- Martinez-Urtaza J, Baker-Austin C, Jones JL, Newton AE, Gonzalez-Aviles GD, DePaola A. Spread of Pacific Northwest Vibrio parahaemolyticus strain. N Engl J Med 2013;369:1573–4.
- Newton AE, Garrett N, Stroika SG, Halpin JL, Turnsek M, Mody RK. Increase in Vibrio parahaemolyticus infections associated with consumption of Atlantic coast shellfish—2013. MMWR Morb Mort Wkly Rep 2014;63:335–6.
Viral Hepatitis
Viral hepatitis is caused by infection with any of at least five distinct viruses: hepatitis A virus (HAV), hepatitis B virus (HBV), hepatitis C virus (HCV), hepatitis D virus (HDV), and hepatitis E virus (HEV). Most viral hepatitis infections in the United States are attributable to HAV, HBV, and HCV. All three of these unrelated viruses can produce an acute illness characterized by nausea, malaise, abdominal pain and jaundice; however, many of these acute infections are asymptomatic or cause only mild disease. Thus, many persons infected with HBV or HCV are unaware they are infected and have clinically silent infections for decades until developing cirrhosis, end-stage liver disease, or hepatocellular carcinoma. Both HAV and HBV are vaccine-preventable diseases and there are effective treatments for HBV and cure for HCV. Until recently, acute viral hepatitis disease had declined; however, surveillance detected increases in all three viral infections (HAV, HBV, and HCV).
The number of reported cases of acute HAV infection declined during 2006–2011. However, after this historic decline, the number increased 27.4%, from 1,398 cases in 2011 to 1,781 cases in 2013. During 2012–2013, the number of reported cases and rates increased for all persons aged ≥30 years, with the greatest increase from 207 to 302 reported cases (45.9%) among persons aged 30–39 years. In 2013, whites had the highest number of cases, but Asian/Pacific Islanders and Hispanics had the highest rate of HAV infection. Rates of HAV infection have been similar for males and females since 2003. Half of all HAV infections are now acquired outside the United States by adult travelers (1). Pre-exposure vaccination of international travelers, especially of those traveling areas where HAV is endemic, provides an opportunity to decrease the number and rate of HAV infection in the United States.
During 1990–2012, the number of acute cases of HBV infection declined, resulting in the lowest number of reported cases in 2012; however, during 2012–2013, the number of reported cases of acute HBV infection increased 5.3%, from 2,895 cases to 3,050 cases. The number of reported cases and rates increased among persons aged 30–39 and 40–49 years. Although the number and rate of acute HBV infection declined from 1.52 cases per 100,000 population to 1.27 cases per 100,000 population among non-Hispanic Blacks during 2012–2013, the rate remained the highest relative to all other race/ethnic groups, despite an increase in the rate among American Indian/Alaska Natives and non-Hispanic Whites. The rate of acute HBV infection was 1.6 times higher for males (1.2 cases per 100,000 population) than for females (0.73 cases per 100,000).
After receiving reports of approximately 800–1,000 cases of acute HCV infection each year during 2006–2010, there was an increase of 73.9% (from 1,232 in 2011 to 2,138 in 2013) in the number of cases reported to CDC (2). During 2010–2013, the number of reported cases and rates increased among all age groups, with the greatest increase occurring among those aged 20–29 years. Epidemiologic investigations have demonstrated that a marked increase in the number of acute cases of HCV infection have been found among young, nonminority persons who inject drugs, many of whom also abuse oral prescription opioid drugs (3–5). In 2013, American Indians/Alaska Natives had the highest rate (1.7 cases per 100,000 population) of acute HCV infection, 1.9 times higher than the rate for non-Hispanic whites, 6.9 times higher than Hispanics, 8 times higher than non-Hispanic Blacks, and 20.6 times higher than Asian/Pacific Islanders. Rates of acute HCV infection were similar for males and females in 2013.
Enhanced surveillance for viral hepatitis is necessary for early identification of persons previously unaware of their conditions. Early identification provides an opportunity for infected individuals to be linked to counseling and medical care, preventing continued transmission and advancement of hepatitis disease.
- Klevens RM, Miller J, Iqbal K, et al. The Evolving epidemiology of hepatitis A in the United States: incidence and molecular epidemiology from population-based surveillance. Arch Intern Med 2010;170:1811–18.
- CDC. Viral hepatitis surveillance—United States, 2012. Available at http://www.cdc.gov/hepatitis/Statistics/2012Surveillance/PDFs/2012HepSurveillanceRpt.pdf.
- CDC. Hepatitis C virus infection among adolescents and young adults—Massachusetts, 2002–2009. MMWR Morb Mort Wkly Rep 2011;60:537–41.
- CDC. Risk factors for Hepatitis C virus infections among young adults—Massachusetts, 2010. MMWR Morb Mort Wkly Rep 2011;60:1457–8.
- Suryaprasad AG, White JZ, Xu F, et al. Emerging epidemic of hepatitis C virus infections among young non-urban persons who inject drugs in the United States, 2006–2011. Clin Infect Dis 2014;59:1411–19.
PART 1 Summaries of Notifiable Diseases in the United States, 2013
Abbreviations and Symbols Used in Tables
U Data not available.
N Not reportable (i.e., report of disease is not required in that jurisdiction).
— No reported cases.
Notes: Rates <0.01 after rounding are listed as 0.
Data in the MMWR Summary of Notifiable Diseases — United States, 2013 might differ from data in other CDC surveillance reports because of differences in the timing of reports, the source of the data, the use of different case definitions, and print criteria.
|
Disease
|
Jan.
|
Feb.
|
Mar.
|
Apr.
|
May
|
June
|
July
|
Aug.
|
Sept.
|
Oct.
|
Nov.
|
Dec.
|
Month not stated
|
Total
|
|
Arboviral diseases†
|
|
California serogroup viruses
|
|
neuroinvasive
|
—
|
—
|
—
|
—
|
1
|
10
|
14
|
37
|
26
|
6
|
1
|
—
|
—
|
95
|
|
nonneuroinvasive
|
1
|
—
|
—
|
—
|
—
|
4
|
4
|
5
|
3
|
—
|
—
|
—
|
—
|
17
|
|
Eastern equine encephalitis virus
|
|
neuroinvasive
|
2
|
—
|
1
|
—
|
—
|
1
|
—
|
2
|
—
|
2
|
—
|
—
|
—
|
8
|
|
Powassan virus
|
|
neuroinvasive
|
—
|
—
|
—
|
—
|
3
|
1
|
2
|
2
|
1
|
2
|
1
|
—
|
—
|
12
|
|
nonneuroinvasive
|
—
|
—
|
—
|
—
|
—
|
1
|
—
|
1
|
—
|
—
|
1
|
—
|
—
|
3
|
|
St. Louis encephalitis virus
|
|
neuroinvasive
|
—
|
—
|
—
|
—
|
—
|
—
|
—
|
—
|
—
|
1
|
—
|
—
|
—
|
1
|
|
West Nile virus
|
|
neuroinvasive
|
1
|
—
|
2
|
1
|
2
|
16
|
131
|
440
|
523
|
139
|
11
|
1
|
—
|
1,267
|
|
nonneuroinvasive
|
1
|
—
|
1
|
2
|
3
|
22
|
150
|
496
|
448
|
71
|
6
|
2
|
—
|
1,202
|
|
Babesiosis, total
|
7
|
6
|
14
|
7
|
22
|
222
|
513
|
481
|
176
|
143
|
81
|
124
|
—
|
1,796
|
|
confirmed
|
3
|
4
|
2
|
3
|
11
|
185
|
463
|
420
|
136
|
110
|
59
|
86
|
—
|
1,482
|
|
probable
|
4
|
2
|
12
|
4
|
11
|
37
|
50
|
61
|
40
|
33
|
22
|
38
|
—
|
314
|
|
Botulism, total
|
12
|
10
|
21
|
11
|
11
|
12
|
10
|
11
|
10
|
12
|
13
|
19
|
—
|
152
|
|
foodborne
|
—
|
—
|
—
|
—
|
—
|
2
|
—
|
—
|
—
|
—
|
1
|
1
|
—
|
4
|
|
infant
|
11
|
8
|
20
|
10
|
10
|
9
|
9
|
11
|
10
|
12
|
10
|
16
|
—
|
136
|
|
other, (wound and unspecified)
|
1
|
2
|
1
|
1
|
1
|
1
|
1
|
—
|
—
|
—
|
2
|
2
|
—
|
12
|
|
Brucellosis
|
8
|
3
|
7
|
6
|
7
|
13
|
8
|
10
|
8
|
11
|
8
|
10
|
—
|
99
|
|
Chancroid§
|
—
|
—
|
—
|
1
|
3
|
—
|
1
|
2
|
1
|
—
|
1
|
1
|
—
|
10
|
|
Chlamydia trachomatis infection§
|
101,875
|
110,849
|
138,658
|
109,846
|
109,008
|
130,607
|
102,560
|
141,065
|
108,877
|
111,788
|
131,504
|
105,269
|
—
|
1,401,906
|
|
Cholera
|
3
|
1
|
—
|
1
|
—
|
—
|
—
|
4
|
1
|
1
|
—
|
3
|
—
|
14
|
|
Coccidioidomycosis
|
814
|
794
|
572
|
597
|
697
|
889
|
669
|
889
|
645
|
688
|
1,202
|
982
|
—
|
9,438
|
|
Cryptosporidiosis, total
|
373
|
378
|
465
|
442
|
354
|
533
|
1,134
|
2,111
|
1,288
|
858
|
653
|
467
|
—
|
9,056
|
|
confirmed
|
242
|
240
|
291
|
275
|
232
|
364
|
703
|
1,239
|
807
|
598
|
421
|
286
|
—
|
5,698
|
|
probable
|
131
|
138
|
174
|
167
|
122
|
169
|
431
|
872
|
481
|
260
|
232
|
181
|
—
|
3,358
|
|
Cyclosporiasis
|
2
|
4
|
1
|
4
|
4
|
156
|
253
|
276
|
29
|
19
|
5
|
31
|
—
|
784
|
|
Dengue Virus Infection†
|
|
Dengue fever
|
68
|
29
|
48
|
38
|
27
|
51
|
95
|
198
|
67
|
79
|
101
|
36
|
—
|
837
|
|
Dengue hemorrhagic fever
|
—
|
1
|
—
|
—
|
—
|
2
|
—
|
3
|
—
|
—
|
—
|
—
|
—
|
6
|
|
Ehrlichiosis/Anaplasmosis
|
|
|
|
|
|
|
|
|
|
|
|
|
|
|
|
Anaplasma phagocytophilum
|
11
|
16
|
23
|
44
|
160
|
675
|
661
|
458
|
218
|
213
|
190
|
113
|
—
|
2,782
|
|
Ehrlichia chaffeensis
|
7
|
3
|
6
|
13
|
82
|
292
|
381
|
309
|
147
|
85
|
64
|
129
|
—
|
1,518
|
|
Ehrlichia ewingii
|
—
|
—
|
—
|
—
|
1
|
5
|
7
|
15
|
2
|
1
|
—
|
—
|
—
|
31
|
|
Undetermined
|
1
|
3
|
1
|
2
|
11
|
34
|
56
|
48
|
24
|
22
|
11
|
7
|
—
|
220
|
|
Giardiasis
|
853
|
958
|
1,151
|
957
|
961
|
1,238
|
1,333
|
1,992
|
1,682
|
1,448
|
1,377
|
1,156
|
—
|
15,106
|
|
Gonorrhea§
|
24,460
|
25,220
|
30,938
|
24,944
|
24,554
|
30,910
|
25,478
|
34,360
|
26,818
|
27,119
|
31,448
|
26,755
|
—
|
333,004
|
|
Haemophilus influenzae, invasive disease
|
|
all ages, all serotypes
|
370
|
349
|
352
|
332
|
314
|
409
|
258
|
289
|
213
|
273
|
276
|
357
|
—
|
3,792
|
|
age <5 years
|
|
|
|
|
|
|
|
|
|
|
|
|
|
|
|
serotype b
|
1
|
5
|
3
|
3
|
2
|
1
|
1
|
2
|
3
|
3
|
3
|
4
|
—
|
31
|
|
nonserotype b
|
16
|
24
|
19
|
22
|
24
|
22
|
9
|
12
|
15
|
19
|
18
|
22
|
—
|
222
|
|
unknown serotype
|
14
|
25
|
20
|
12
|
19
|
18
|
15
|
8
|
14
|
9
|
14
|
17
|
—
|
185
|
|
Hansen disease (leprosy)
|
4
|
5
|
3
|
4
|
15
|
5
|
6
|
9
|
3
|
9
|
5
|
13
|
—
|
81
|
|
Hantavirus pulmonary syndrome
|
—
|
—
|
1
|
2
|
5
|
3
|
1
|
—
|
4
|
2
|
1
|
2
|
—
|
21
|
|
Hemolytic uremic syndrome postdiarrheal
|
15
|
7
|
16
|
13
|
21
|
37
|
51
|
52
|
33
|
38
|
27
|
19
|
—
|
329
|
|
Hepatitis virus, acute
|
|
A
|
86
|
119
|
127
|
104
|
188
|
227
|
152
|
185
|
191
|
146
|
141
|
115
|
—
|
1,781
|
|
B
|
194
|
238
|
240
|
226
|
234
|
295
|
249
|
280
|
224
|
264
|
330
|
276
|
—
|
3,050
|
|
C
|
115
|
146
|
199
|
169
|
167
|
209
|
140
|
225
|
195
|
141
|
217
|
215
|
—
|
2,138
|
|
Hepatitis B perinatal infection
|
2
|
3
|
6
|
6
|
4
|
7
|
4
|
6
|
3
|
2
|
3
|
2
|
—
|
48
|
|
Human immunodeficiency virus (HIV) diagnoses¶
|
3,658
|
3,350
|
3,441
|
3,566
|
3,350
|
3,272
|
3,331
|
3,352
|
2,952
|
2,756
|
1,568
|
373
|
—
|
34,969
|
|
Influenza-associated pediatric mortality**
|
27
|
36
|
30
|
27
|
12
|
5
|
4
|
3
|
3
|
3
|
5
|
5
|
—
|
160
|
|
Invasive pneumococcal disease
|
|
all ages
|
2,237
|
1,842
|
2,277
|
1,717
|
1,458
|
1,260
|
606
|
690
|
685
|
955
|
1,511
|
1,955
|
—
|
17,193
|
|
age <5 years
|
94
|
103
|
160
|
115
|
122
|
80
|
53
|
50
|
69
|
79
|
120
|
126
|
—
|
1,171
|
|
Legionellosis
|
175
|
203
|
194
|
142
|
212
|
892
|
816
|
787
|
481
|
402
|
324
|
326
|
—
|
4,954
|
|
Listeriosis
|
30
|
25
|
42
|
37
|
41
|
71
|
93
|
124
|
87
|
68
|
63
|
54
|
—
|
735
|
|
Lyme disease, total
|
784
|
746
|
849
|
898
|
1,454
|
6,082
|
8,985
|
7,087
|
3,292
|
2,559
|
2,093
|
1,478
|
—
|
36,307
|
|
confirmed
|
496
|
457
|
550
|
552
|
988
|
4,918
|
7,221
|
5,504
|
2,350
|
1,774
|
1,447
|
946
|
—
|
27,203
|
|
probable
|
288
|
289
|
299
|
346
|
466
|
1,164
|
1,764
|
1,583
|
942
|
785
|
646
|
532
|
—
|
9,104
|
|
Malaria
|
88
|
80
|
82
|
99
|
117
|
203
|
181
|
222
|
173
|
96
|
126
|
127
|
—
|
1,594
|
|
Disease
|
Jan.
|
Feb.
|
Mar.
|
Apr.
|
May
|
June
|
July
|
Aug.
|
Sept.
|
Oct.
|
Nov.
|
Dec.
|
Month not stated
|
Total
|
|
Measles, total
|
7
|
6
|
13
|
23
|
33
|
36
|
15
|
28
|
6
|
—
|
16
|
4
|
—
|
187
|
|
indigenous
|
4
|
3
|
8
|
20
|
29
|
30
|
2
|
22
|
4
|
—
|
13
|
—
|
—
|
135
|
|
imported
|
3
|
3
|
5
|
3
|
4
|
6
|
13
|
6
|
2
|
—
|
3
|
4
|
—
|
52
|
|
Meningococcal disease
|
|
All serogroups
|
60
|
69
|
63
|
59
|
45
|
30
|
36
|
38
|
29
|
32
|
51
|
44
|
—
|
556
|
|
serogroup ACWY
|
11
|
14
|
14
|
16
|
17
|
7
|
13
|
13
|
5
|
9
|
11
|
12
|
—
|
142
|
|
serogroup B
|
10
|
17
|
11
|
14
|
14
|
4
|
4
|
4
|
3
|
3
|
5
|
10
|
—
|
99
|
|
serogroup other
|
1
|
3
|
3
|
2
|
—
|
—
|
1
|
1
|
—
|
—
|
3
|
3
|
—
|
17
|
|
serogroup unknown
|
38
|
35
|
35
|
27
|
14
|
19
|
18
|
20
|
21
|
20
|
32
|
19
|
—
|
298
|
|
Mumps
|
19
|
22
|
61
|
106
|
137
|
38
|
20
|
49
|
61
|
38
|
22
|
11
|
—
|
584
|
|
Novel influenza A virus infection
|
—
|
—
|
—
|
—
|
—
|
5
|
9
|
4
|
2
|
1
|
—
|
—
|
—
|
21
|
|
Pertussis
|
1,650
|
1,697
|
2,047
|
1,771
|
2,053
|
2,706
|
2,591
|
3,237
|
2,309
|
2,225
|
3,217
|
3,136
|
—
|
28,639
|
|
Plague
|
—
|
—
|
—
|
—
|
—
|
—
|
—
|
2
|
1
|
1
|
—
|
—
|
—
|
4
|
|
Poliomyelitis, paralytic
|
—
|
—
|
—
|
—
|
—
|
—
|
1
|
—
|
—
|
—
|
—
|
—
|
—
|
1
|
|
Psittacosis
|
—
|
—
|
—
|
1
|
1
|
—
|
—
|
1
|
2
|
—
|
—
|
1
|
—
|
6
|
|
Q fever, total
|
5
|
7
|
11
|
7
|
10
|
22
|
20
|
25
|
22
|
7
|
8
|
26
|
—
|
170
|
|
acute
|
4
|
6
|
7
|
6
|
7
|
18
|
14
|
21
|
18
|
6
|
6
|
24
|
—
|
137
|
|
chronic
|
1
|
1
|
4
|
1
|
3
|
4
|
6
|
4
|
4
|
1
|
2
|
2
|
—
|
33
|
|
Rabies
|
|
animal
|
156
|
281
|
320
|
365
|
403
|
411
|
351
|
610
|
466
|
322
|
291
|
272
|
—
|
4,248
|
|
human
|
—
|
—
|
1
|
—
|
1
|
—
|
—
|
—
|
—
|
—
|
—
|
—
|
—
|
2
|
|
Rubella
|
1
|
—
|
1
|
1
|
—
|
—
|
3
|
—
|
—
|
—
|
1
|
2
|
—
|
9
|
|
Rubella, congential syndrome
|
—
|
—
|
—
|
—
|
—
|
—
|
—
|
—
|
—
|
—
|
—
|
1
|
—
|
1
|
|
Salmonellosis
|
1,807
|
1,802
|
2,881
|
2,855
|
3,554
|
5,440
|
5,728
|
7,292
|
5,562
|
5,297
|
4,697
|
3,719
|
—
|
50,634
|
|
Shiga toxin-producing Escherichia coli (STEC)
|
244
|
213
|
361
|
353
|
568
|
800
|
820
|
1,140
|
720
|
552
|
492
|
400
|
—
|
6,663
|
|
Shigellosis
|
511
|
622
|
706
|
620
|
673
|
994
|
1,008
|
1,520
|
1,210
|
1,329
|
1,747
|
1,789
|
—
|
12,729
|
|
Spotted fever rickettsiosis, total
|
30
|
47
|
50
|
69
|
219
|
573
|
569
|
739
|
419
|
295
|
159
|
190
|
—
|
3,359
|
|
confirmed
|
2
|
3
|
5
|
8
|
17
|
31
|
31
|
34
|
18
|
17
|
3
|
5
|
—
|
174
|
|
probable
|
28
|
44
|
44
|
60
|
202
|
542
|
538
|
704
|
401
|
277
|
156
|
185
|
—
|
3,181
|
|
Streptococcal toxic-shock syndrome
|
26
|
21
|
24
|
26
|
22
|
17
|
11
|
12
|
19
|
7
|
18
|
21
|
—
|
224
|
|
Syphilis, total all stages§††
|
3,729
|
4,188
|
5,423
|
4,427
|
4,381
|
5,168
|
4,133
|
5,504
|
4,689
|
4,607
|
5,297
|
4,925
|
—
|
56,471
|
|
congenital§
|
25
|
20
|
31
|
27
|
33
|
32
|
31
|
36
|
22
|
26
|
31
|
34
|
—
|
348
|
|
primary and secondary§
|
1,072
|
1,261
|
1,652
|
1,318
|
1,322
|
1,593
|
1,279
|
1,744
|
1,548
|
1,378
|
1,656
|
1,552
|
—
|
17,375
|
|
Tetanus
|
4
|
2
|
—
|
2
|
1
|
1
|
|
2
|
5
|
2
|
4
|
3
|
—
|
26
|
|
Toxic-shock syndrome (other than streptococcal)
|
6
|
8
|
3
|
8
|
9
|
4
|
7
|
11
|
8
|
1
|
4
|
2
|
—
|
71
|
|
Trichinellosis
|
—
|
4
|
5
|
2
|
—
|
1
|
—
|
—
|
2
|
1
|
5
|
2
|
—
|
22
|
|
Tuberculosis§§
|
493
|
611
|
668
|
795
|
789
|
892
|
882
|
783
|
768
|
895
|
769
|
1,237
|
—
|
9,582
|
|
Tularemia
|
2
|
2
|
3
|
5
|
16
|
63
|
33
|
38
|
14
|
14
|
7
|
6
|
—
|
203
|
|
Typhoid fever
|
24
|
17
|
30
|
30
|
24
|
39
|
39
|
28
|
28
|
21
|
32
|
26
|
—
|
338
|
|
Vancomycin-intermediate Staphylococcus aureus (VISA)
|
9
|
14
|
17
|
36
|
21
|
25
|
18
|
15
|
27
|
29
|
15
|
22
|
—
|
248
|
|
Varicella (Chickenpox)
|
|
morbidity
|
710
|
941
|
1,206
|
1,038
|
1,127
|
1,018
|
496
|
752
|
1,027
|
1,015
|
1,139
|
890
|
—
|
11,359
|
|
mortality¶¶
|
—
|
—
|
—
|
—
|
2
|
1
|
—
|
—
|
—
|
—
|
—
|
—
|
—
|
3
|
|
Vibriosis
|
15
|
31
|
24
|
33
|
55
|
116
|
271
|
361
|
170
|
119
|
61
|
43
|
—
|
1,299
|
|
|
|
TABLE 2. Reported cases of notifiable diseases,* by geographic division and area — United States, 2013
|
|
Area
|
Total resident population (in thousands)
|
Arboviruses†
|
|
California serogroup§
|
Eastern equine encephalitis
|
Powassan
|
St. Louis encephalitis
|
West Nile
|
|
Neuro-
invasive
|
Nonneuro-
invasive
|
Neuro-
invasive
|
Neuro-
invasive
|
Nonneuro-
invasive
|
Neuro-
invasive
|
Neuro-
invasive
|
Nonneuro-
invasive
|
|
United States
|
313,875
|
95
|
17
|
8
|
12
|
3
|
1
|
1,267
|
1,202
|
|
New England
|
14,564
|
3
|
—
|
2
|
3
|
—
|
—
|
11
|
5
|
|
Connecticut
|
3,592
|
—
|
—
|
1
|
—
|
—
|
—
|
1
|
3
|
|
Maine
|
1,329
|
—
|
—
|
—
|
1
|
—
|
—
|
—
|
—
|
|
Massachusetts
|
6,645
|
1
|
—
|
1
|
1
|
—
|
—
|
7
|
1
|
|
New Hampshire
|
1,322
|
1
|
—
|
—
|
1
|
—
|
—
|
1
|
—
|
|
Rhode Island
|
1,050
|
1
|
—
|
—
|
—
|
—
|
—
|
1
|
—
|
|
Vermont
|
626
|
—
|
—
|
—
|
—
|
—
|
—
|
1
|
1
|
|
Mid. Atlantic
|
41,208
|
3
|
1
|
—
|
5
|
1
|
—
|
34
|
21
|
|
New Jersey
|
8,868
|
—
|
—
|
—
|
1
|
—
|
—
|
10
|
2
|
|
New York (Upstate)
|
11,232
|
3
|
—
|
—
|
4
|
1
|
—
|
10
|
12
|
|
New York City
|
8,344
|
—
|
—
|
—
|
—
|
—
|
—
|
8
|
2
|
|
Pennsylvania
|
12,764
|
—
|
1
|
—
|
—
|
—
|
—
|
6
|
5
|
|
E.N. Central
|
46,567
|
29
|
10
|
—
|
3
|
2
|
—
|
167
|
54
|
|
Illinois
|
12,868
|
—
|
—
|
—
|
—
|
—
|
—
|
86
|
31
|
|
Indiana
|
6,538
|
1
|
—
|
—
|
—
|
—
|
—
|
19
|
4
|
|
Michigan
|
9,883
|
—
|
—
|
—
|
—
|
—
|
—
|
24
|
12
|
|
Ohio
|
11,553
|
14
|
2
|
—
|
—
|
—
|
—
|
21
|
3
|
|
Wisconsin
|
5,725
|
14
|
8
|
—
|
3
|
2
|
—
|
17
|
4
|
|
W.N. Central
|
20,755
|
5
|
1
|
—
|
1
|
—
|
—
|
288
|
455
|
|
Iowa
|
3,075
|
—
|
—
|
—
|
—
|
—
|
—
|
24
|
20
|
|
Kansas
|
2,885
|
—
|
—
|
—
|
—
|
—
|
—
|
34
|
57
|
|
Minnesota
|
5,380
|
5
|
1
|
—
|
1
|
—
|
—
|
31
|
48
|
|
Missouri
|
6,025
|
—
|
—
|
—
|
—
|
—
|
—
|
24
|
5
|
|
Nebraska
|
1,855
|
—
|
—
|
—
|
—
|
—
|
—
|
54
|
172
|
|
North Dakota
|
701
|
—
|
—
|
—
|
—
|
—
|
—
|
64
|
61
|
|
South Dakota
|
834
|
—
|
—
|
—
|
—
|
—
|
—
|
57
|
92
|
|
S. Atlantic
|
61,187
|
27
|
2
|
5
|
—
|
—
|
—
|
36
|
18
|
|
Delaware
|
917
|
—
|
—
|
—
|
—
|
—
|
—
|
3
|
—
|
|
District of Columbia
|
633
|
—
|
—
|
—
|
—
|
—
|
—
|
—
|
1
|
|
Florida
|
19,321
|
—
|
—
|
3
|
—
|
—
|
—
|
5
|
2
|
|
Georgia
|
9,916
|
1
|
1
|
1
|
—
|
—
|
—
|
4
|
6
|
|
Maryland
|
5,885
|
—
|
—
|
—
|
—
|
—
|
—
|
11
|
5
|
|
North Carolina
|
9,748
|
13
|
—
|
1
|
—
|
—
|
—
|
3
|
—
|
|
South Carolina
|
4,723
|
1
|
—
|
—
|
—
|
—
|
—
|
3
|
4
|
|
Virginia
|
8,187
|
2
|
—
|
—
|
—
|
—
|
—
|
6
|
—
|
|
West Virginia
|
1,857
|
10
|
1
|
—
|
—
|
—
|
—
|
1
|
—
|
|
E.S. Central
|
18,639
|
27
|
1
|
—
|
—
|
—
|
—
|
48
|
33
|
|
Alabama
|
4,818
|
2
|
—
|
—
|
—
|
—
|
—
|
3
|
6
|
|
Kentucky
|
4,380
|
—
|
—
|
—
|
—
|
—
|
—
|
1
|
2
|
|
Mississippi
|
2,986
|
2
|
1
|
—
|
—
|
—
|
—
|
27
|
18
|
|
Tennessee
|
6,455
|
23
|
—
|
—
|
—
|
—
|
—
|
17
|
7
|
|
W.S. Central
|
37,429
|
—
|
—
|
1
|
—
|
—
|
1
|
223
|
121
|
|
Arkansas
|
2,950
|
—
|
—
|
1
|
—
|
—
|
—
|
16
|
2
|
|
Louisiana
|
4,602
|
—
|
—
|
—
|
—
|
—
|
—
|
34
|
20
|
|
Oklahoma
|
3,816
|
—
|
—
|
—
|
—
|
—
|
—
|
60
|
29
|
|
Texas
|
26,061
|
—
|
—
|
—
|
—
|
—
|
1
|
113
|
70
|
|
Mountain
|
22,611
|
—
|
2
|
—
|
—
|
—
|
—
|
216
|
343
|
|
Arizona
|
6,551
|
—
|
—
|
—
|
—
|
—
|
—
|
50
|
12
|
|
Colorado
|
5,189
|
—
|
—
|
—
|
—
|
—
|
—
|
90
|
232
|
|
Idaho
|
1,596
|
—
|
1
|
—
|
—
|
—
|
—
|
14
|
26
|
|
Montana
|
1,005
|
—
|
—
|
—
|
—
|
—
|
—
|
10
|
28
|
|
Nevada
|
2,754
|
—
|
1
|
—
|
—
|
—
|
—
|
8
|
3
|
|
New Mexico
|
2,084
|
—
|
—
|
—
|
—
|
—
|
—
|
24
|
14
|
|
Utah
|
2,855
|
—
|
—
|
—
|
—
|
—
|
—
|
4
|
3
|
|
Wyoming
|
577
|
—
|
—
|
—
|
—
|
—
|
—
|
16
|
25
|
|
Pacific
|
50,915
|
1
|
—
|
—
|
—
|
—
|
—
|
244
|
152
|
|
Alaska
|
730
|
—
|
—
|
—
|
—
|
—
|
—
|
—
|
—
|
|
California
|
38,000
|
—
|
—
|
—
|
—
|
—
|
—
|
237
|
142
|
|
Hawaii
|
1,390
|
—
|
—
|
—
|
—
|
—
|
—
|
—
|
—
|
|
Oregon
|
3,900
|
1
|
—
|
—
|
—
|
—
|
—
|
7
|
9
|
|
Washington
|
6,895
|
—
|
—
|
—
|
—
|
—
|
—
|
—
|
1
|
|
Territories
|
|
|
|
|
|
|
|
|
|
|
American Samoa
|
55
|
—
|
—
|
—
|
—
|
—
|
—
|
—
|
—
|
|
C.N.M.I.
|
51
|
—
|
—
|
—
|
—
|
—
|
—
|
—
|
—
|
|
Guam
|
160
|
—
|
—
|
—
|
—
|
—
|
—
|
—
|
—
|
|
Puerto Rico
|
3,673
|
—
|
—
|
—
|
—
|
—
|
—
|
—
|
—
|
|
U.S. Virgin Islands
|
105
|
—
|
—
|
—
|
—
|
—
|
—
|
—
|
—
|
|
TABLE 2. (Continued) Reported cases of notifiable diseases,* by geographic division and area — United States, 2013
|
|
Area
|
Babesiosis
|
Botulism
|
Brucellosis
|
Chancroid§
|
|
Total
|
Confirmed
|
Probable
|
Total
|
Foodborne
|
Infant
|
Other†
|
|
United States
|
1,796
|
1,482
|
314
|
152
|
4
|
136
|
12
|
99
|
10
|
|
New England
|
920
|
812
|
108
|
1
|
1
|
—
|
—
|
1
|
2
|
|
Connecticut
|
289
|
249
|
40
|
—
|
—
|
—
|
—
|
1
|
—
|
|
Maine
|
36
|
30
|
6
|
—
|
—
|
—
|
—
|
—
|
—
|
|
Massachusetts
|
425
|
396
|
29
|
1
|
1
|
—
|
—
|
—
|
2
|
|
New Hampshire
|
22
|
18
|
4
|
—
|
—
|
—
|
—
|
—
|
—
|
|
Rhode Island
|
142
|
117
|
25
|
—
|
—
|
—
|
—
|
—
|
—
|
|
Vermont
|
6
|
2
|
4
|
—
|
—
|
—
|
—
|
—
|
—
|
|
Mid. Atlantic
|
705
|
553
|
152
|
28
|
—
|
27
|
1
|
8
|
—
|
|
New Jersey
|
171
|
137
|
34
|
4
|
—
|
4
|
—
|
—
|
—
|
|
New York (Upstate)
|
459
|
348
|
111
|
1
|
—
|
1
|
—
|
4
|
—
|
|
New York City
|
75
|
68
|
7
|
3
|
—
|
3
|
—
|
—
|
—
|
|
Pennsylvania
|
N
|
N
|
N
|
20
|
—
|
19
|
1
|
4
|
—
|
|
E.N. Central
|
85
|
70
|
15
|
6
|
—
|
6
|
—
|
13
|
—
|
|
Illinois
|
4
|
2
|
2
|
1
|
—
|
1
|
—
|
5
|
—
|
|
Indiana
|
1
|
—
|
1
|
—
|
—
|
—
|
—
|
1
|
—
|
|
Michigan
|
2
|
2
|
—
|
—
|
—
|
—
|
—
|
—
|
—
|
|
Ohio
|
N
|
N
|
N
|
5
|
—
|
5
|
—
|
2
|
—
|
|
Wisconsin
|
78
|
66
|
12
|
—
|
—
|
—
|
—
|
5
|
—
|
|
W.N. Central
|
67
|
34
|
33
|
6
|
—
|
6
|
—
|
9
|
—
|
|
Iowa
|
N
|
N
|
N
|
3
|
—
|
3
|
N
|
2
|
—
|
|
Kansas
|
N
|
N
|
N
|
1
|
—
|
1
|
—
|
—
|
—
|
|
Minnesota
|
64
|
32
|
32
|
—
|
—
|
—
|
—
|
1
|
—
|
|
Missouri
|
N
|
N
|
N
|
1
|
—
|
1
|
—
|
2
|
—
|
|
Nebraska
|
1
|
—
|
1
|
1
|
—
|
1
|
—
|
3
|
—
|
|
North Dakota
|
1
|
1
|
—
|
—
|
—
|
—
|
—
|
—
|
—
|
|
South Dakota
|
1
|
1
|
—
|
—
|
—
|
—
|
—
|
1
|
—
|
|
S. Atlantic
|
12
|
7
|
5
|
15
|
—
|
15
|
—
|
18
|
—
|
|
Delaware
|
2
|
2
|
—
|
3
|
—
|
3
|
—
|
—
|
—
|
|
District of Columbia
|
N
|
N
|
N
|
—
|
—
|
—
|
—
|
—
|
—
|
|
Florida
|
N
|
N
|
N
|
—
|
—
|
—
|
—
|
9
|
—
|
|
Georgia
|
N
|
N
|
N
|
—
|
—
|
—
|
—
|
5
|
—
|
|
Maryland
|
9
|
4
|
5
|
8
|
—
|
8
|
—
|
—
|
—
|
|
North Carolina
|
N
|
N
|
N
|
—
|
—
|
—
|
—
|
—
|
—
|
|
South Carolina
|
1
|
1
|
—
|
—
|
—
|
—
|
—
|
1
|
—
|
|
Virginia
|
N
|
N
|
N
|
3
|
—
|
3
|
—
|
3
|
—
|
|
West Virginia
|
—
|
—
|
—
|
1
|
—
|
1
|
—
|
—
|
—
|
|
E.S. Central
|
—
|
—
|
—
|
5
|
—
|
5
|
—
|
3
|
1
|
|
Alabama
|
—
|
—
|
—
|
—
|
—
|
—
|
—
|
1
|
1
|
|
Kentucky
|
N
|
N
|
N
|
2
|
—
|
2
|
—
|
1
|
—
|
|
Mississippi
|
N
|
N
|
N
|
2
|
—
|
2
|
—
|
—
|
—
|
|
Tennessee
|
—
|
—
|
—
|
1
|
—
|
1
|
—
|
1
|
—
|
|
W.S. Central
|
3
|
2
|
1
|
14
|
—
|
12
|
2
|
22
|
1
|
|
Arkansas
|
N
|
N
|
N
|
1
|
—
|
1
|
—
|
3
|
—
|
|
Louisiana
|
2
|
1
|
1
|
3
|
—
|
3
|
—
|
3
|
—
|
|
Oklahoma
|
N
|
N
|
N
|
1
|
—
|
1
|
—
|
5
|
—
|
|
Texas
|
1
|
1
|
—
|
9
|
—
|
7
|
2
|
11
|
1
|
|
Mountain
|
—
|
—
|
—
|
12
|
—
|
12
|
—
|
2
|
—
|
|
Arizona
|
N
|
N
|
N
|
1
|
—
|
1
|
—
|
1
|
—
|
|
Colorado
|
N
|
N
|
N
|
4
|
—
|
4
|
—
|
1
|
—
|
|
Idaho
|
N
|
N
|
N
|
1
|
—
|
1
|
—
|
—
|
—
|
|
Montana
|
—
|
—
|
—
|
—
|
—
|
—
|
—
|
—
|
—
|
|
Nevada
|
N
|
N
|
N
|
1
|
—
|
1
|
—
|
—
|
—
|
|
New Mexico
|
N
|
N
|
N
|
3
|
—
|
3
|
—
|
—
|
—
|
|
Utah
|
—
|
—
|
—
|
2
|
—
|
2
|
—
|
—
|
—
|
|
Wyoming
|
—
|
—
|
—
|
—
|
—
|
—
|
—
|
|
—
|
|
Pacific
|
4
|
4
|
—
|
65
|
3
|
53
|
9
|
23
|
6
|
|
Alaska
|
N
|
N
|
N
|
1
|
1
|
—
|
—
|
—
|
—
|
|
California
|
3
|
3
|
—
|
56
|
1
|
46
|
9
|
20
|
6
|
|
Hawaii
|
N
|
N
|
N
|
—
|
—
|
—
|
—
|
—
|
—
|
|
Oregon
|
—
|
—
|
—
|
4
|
1
|
3
|
—
|
2
|
—
|
|
Washington
|
1
|
1
|
—
|
4
|
—
|
4
|
—
|
1
|
—
|
|
Territories
|
|
|
|
|
|
|
|
|
|
|
American Samoa
|
U
|
U
|
U
|
—
|
—
|
—
|
—
|
—
|
—
|
|
C.N.M.I.
|
—
|
—
|
—
|
—
|
—
|
—
|
—
|
—
|
—
|
|
Guam
|
—
|
—
|
—
|
—
|
—
|
—
|
—
|
—
|
—
|
|
Puerto Rico
|
N
|
N
|
N
|
—
|
—
|
—
|
—
|
—
|
—
|
|
U.S. Virgin Islands
|
N
|
N
|
N
|
—
|
—
|
—
|
—
|
—
|
—
|
|
TABLE 2. (Continued) Reported cases of notifiable diseases,* by geographic division and area — United States, 2013
|
|
Area
|
Chlamydia trachomatis infection†
|
Cholera
|
Coccidioidomycosis
|
Cryptosporidiosis
|
Cyclosporiasis
|
|
Total
|
Confirmed
|
Probable
|
|
United States
|
1,401,906
|
14
|
9,438
|
9,056
|
5,698
|
3,358
|
784
|
|
New England
|
48,696
|
4
|
1
|
277
|
256
|
21
|
9
|
|
Connecticut
|
12,775
|
1
|
N
|
36
|
36
|
—
|
3
|
|
Maine
|
3,438
|
—
|
N
|
35
|
25
|
10
|
N
|
|
Massachusetts
|
23,210
|
3
|
—
|
123
|
123
|
—
|
5
|
|
New Hampshire
|
3,119
|
—
|
1
|
45
|
34
|
11
|
1
|
|
Rhode Island
|
4,312
|
—
|
—
|
12
|
12
|
—
|
—
|
|
Vermont
|
1,842
|
—
|
N
|
26
|
26
|
—
|
N
|
|
Mid. Atlantic
|
176,186
|
1
|
—
|
844
|
636
|
208
|
34
|
|
New Jersey
|
28,327
|
1
|
N
|
70
|
69
|
1
|
13
|
|
New York (Upstate)
|
37,922
|
—
|
N
|
252
|
243
|
9
|
6
|
|
New York City
|
57,881
|
—
|
N
|
81
|
81
|
—
|
15
|
|
Pennsylvania
|
52,056
|
—
|
N
|
441
|
243
|
198
|
N
|
|
E.N. Central
|
213,348
|
1
|
28
|
1,524
|
1,085
|
439
|
56
|
|
Illinois
|
63,797
|
1
|
N
|
266
|
143
|
123
|
23
|
|
Indiana
|
28,023
|
—
|
N
|
139
|
107
|
32
|
1
|
|
Michigan
|
44,835
|
—
|
16
|
270
|
234
|
36
|
2
|
|
Ohio
|
53,121
|
—
|
7
|
372
|
124
|
248
|
7
|
|
Wisconsin
|
23,572
|
—
|
5
|
477
|
477
|
—
|
23
|
|
W.N. Central
|
82,195
|
2
|
91
|
2,547
|
1,083
|
1,464
|
252
|
|
Iowa
|
10,953
|
1
|
N
|
1,505
|
498
|
1,007
|
148
|
|
Kansas
|
11,012
|
—
|
N
|
99
|
60
|
39
|
4
|
|
Minnesota
|
18,742
|
1
|
64
|
324
|
224
|
100
|
3
|
|
Missouri
|
27,328
|
—
|
17
|
210
|
97
|
113
|
5
|
|
Nebraska
|
7,301
|
—
|
1
|
151
|
103
|
48
|
91
|
|
North Dakota
|
2,932
|
—
|
9
|
84
|
63
|
21
|
N
|
|
South Dakota
|
3,927
|
—
|
N
|
174
|
38
|
136
|
1
|
|
S. Atlantic
|
282,067
|
5
|
8
|
1,181
|
716
|
465
|
57
|
|
Delaware
|
5,213
|
1
|
1
|
16
|
8
|
8
|
—
|
|
District of Columbia
|
6,414
|
—
|
1
|
15
|
14
|
1
|
N
|
|
Florida
|
80,182
|
4
|
N
|
409
|
201
|
208
|
47
|
|
Georgia
|
51,070
|
—
|
N
|
287
|
287
|
—
|
6
|
|
Maryland
|
26,723
|
—
|
6
|
65
|
45
|
20
|
—
|
|
North Carolina
|
48,416
|
—
|
N
|
126
|
49
|
77
|
—
|
|
South Carolina
|
25,594
|
—
|
N
|
98
|
65
|
33
|
—
|
|
Virginia
|
33,316
|
—
|
N
|
144
|
36
|
108
|
4
|
|
West Virginia
|
5,139
|
—
|
N
|
21
|
11
|
10
|
—
|
|
E.S. Central
|
94,432
|
—
|
—
|
352
|
220
|
132
|
1
|
|
Alabama
|
29,464
|
—
|
N
|
144
|
40
|
104
|
N
|
|
Kentucky
|
17,134
|
—
|
N
|
72
|
55
|
17
|
N
|
|
Mississippi
|
17,464
|
—
|
N
|
49
|
49
|
—
|
N
|
|
Tennessee
|
30,370
|
—
|
N
|
87
|
76
|
11
|
1
|
|
W.S. Central
|
192,325
|
—
|
4
|
923
|
765
|
158
|
371
|
|
Arkansas
|
15,447
|
—
|
N
|
57
|
48
|
9
|
17
|
|
Louisiana
|
28,739
|
—
|
4
|
378
|
376
|
2
|
3
|
|
Oklahoma
|
18,278
|
—
|
N
|
76
|
30
|
46
|
N
|
|
Texas
|
129,861
|
—
|
N
|
412
|
311
|
101
|
351
|
|
Mountain
|
93,766
|
—
|
6,029
|
734
|
559
|
175
|
2
|
|
Arizona
|
30,564
|
—
|
5,861
|
42
|
33
|
9
|
—
|
|
Colorado
|
20,386
|
—
|
N
|
99
|
71
|
28
|
1
|
|
Idaho
|
5,428
|
—
|
N
|
147
|
111
|
36
|
N
|
|
Montana
|
3,818
|
—
|
3
|
125
|
117
|
8
|
—
|
|
Nevada
|
11,781
|
—
|
90
|
20
|
13
|
7
|
N
|
|
New Mexico
|
12,249
|
—
|
30
|
49
|
49
|
—
|
—
|
|
Utah
|
7,535
|
—
|
42
|
86
|
82
|
4
|
—
|
|
Wyoming
|
2,005
|
—
|
3
|
166
|
83
|
83
|
1
|
|
Pacific
|
218,891
|
1
|
3,277
|
674
|
378
|
296
|
2
|
|
Alaska
|
5,774
|
—
|
—
|
6
|
6
|
—
|
—
|
|
California
|
167,346
|
—
|
3,272
|
306
|
283
|
23
|
2
|
|
Hawaii
|
6,640
|
—
|
N
|
1
|
1
|
—
|
—
|
|
Oregon
|
14,181
|
—
|
5
|
277
|
35
|
242
|
—
|
|
Washington
|
24,950
|
1
|
N
|
84
|
53
|
31
|
—
|
|
Territories
|
|
|
|
|
|
|
|
|
American Samoa
|
—
|
—
|
N
|
N
|
N
|
N
|
N
|
|
C.N.M.I.
|
—
|
—
|
—
|
—
|
—
|
—
|
—
|
|
Guam
|
937
|
—
|
1
|
—
|
—
|
—
|
—
|
|
Puerto Rico
|
5,969
|
—
|
N
|
—
|
—
|
—
|
—
|
|
U.S. Virgin Islands
|
775
|
—
|
—
|
—
|
—
|
—
|
—
|
|
TABLE 2. (Continued) Reported cases of notifiable diseases,* by geographic division and area — United States, 2013
|
|
Area
|
Dengue Virus Infection†
|
Ehrlichiosis/Anaplasmosis
|
|
Dengue Fever
|
Dengue Hemorrhagic Fever
|
Anaplasma phagocytophilum
|
Ehrlichia chaffeensis
|
Ehrlichia ewingii
|
Undetermined
|
|
United States
|
837
|
6
|
2,782
|
1,518
|
31
|
220
|
|
New England
|
34
|
—
|
747
|
73
|
1
|
7
|
|
Connecticut
|
18
|
—
|
125
|
—
|
—
|
—
|
|
Maine
|
1
|
—
|
94
|
3
|
1
|
2
|
|
Massachusetts
|
—
|
—
|
330
|
8
|
—
|
—
|
|
New Hampshire
|
4
|
—
|
88
|
7
|
—
|
2
|
|
Rhode Island
|
9
|
—
|
69
|
49
|
—
|
—
|
|
Vermont
|
2
|
—
|
41
|
6
|
—
|
3
|
|
Mid. Atlantic
|
206
|
2
|
591
|
166
|
1
|
37
|
|
New Jersey
|
—
|
—
|
80
|
50
|
—
|
2
|
|
New York (Upstate)
|
51
|
1
|
454
|
92
|
—
|
18
|
|
New York City
|
131
|
1
|
23
|
14
|
1
|
—
|
|
Pennsylvania
|
24
|
—
|
34
|
10
|
—
|
17
|
|
E.N. Central
|
65
|
—
|
705
|
89
|
—
|
93
|
|
Illinois
|
26
|
—
|
9
|
44
|
—
|
—
|
|
Indiana
|
6
|
—
|
—
|
—
|
—
|
48
|
|
Michigan
|
16
|
—
|
4
|
1
|
—
|
1
|
|
Ohio
|
9
|
—
|
4
|
10
|
—
|
2
|
|
Wisconsin
|
8
|
—
|
688
|
34
|
—
|
42
|
|
W.N. Central
|
38
|
3
|
660
|
454
|
20
|
59
|
|
Iowa
|
—
|
2
|
N
|
N
|
N
|
N
|
|
Kansas
|
8
|
—
|
7
|
86
|
3
|
—
|
|
Minnesota
|
21
|
1
|
630
|
7
|
—
|
42
|
|
Missouri
|
5
|
—
|
13
|
354
|
17
|
14
|
|
Nebraska
|
—
|
—
|
2
|
6
|
—
|
—
|
|
North Dakota
|
1
|
—
|
8
|
—
|
—
|
3
|
|
South Dakota
|
3
|
—
|
—
|
1
|
—
|
—
|
|
S. Atlantic
|
216
|
1
|
48
|
288
|
6
|
7
|
|
Delaware
|
2
|
—
|
—
|
14
|
1
|
1
|
|
District of Columbia
|
—
|
—
|
N
|
N
|
N
|
N
|
|
Florida
|
151
|
—
|
2
|
21
|
—
|
—
|
|
Georgia
|
9
|
—
|
—
|
20
|
—
|
—
|
|
Maryland
|
11
|
—
|
5
|
31
|
1
|
1
|
|
North Carolina
|
13
|
—
|
15
|
78
|
—
|
—
|
|
South Carolina
|
7
|
—
|
—
|
7
|
—
|
—
|
|
Virginia
|
21
|
1
|
23
|
113
|
4
|
3
|
|
West Virginia
|
2
|
—
|
3
|
4
|
—
|
2
|
|
E.S. Central
|
16
|
—
|
9
|
166
|
2
|
6
|
|
Alabama
|
5
|
—
|
3
|
11
|
—
|
1
|
|
Kentucky
|
—
|
—
|
—
|
67
|
—
|
—
|
|
Mississippi
|
1
|
—
|
1
|
3
|
—
|
1
|
|
Tennessee
|
10
|
—
|
5
|
85
|
2
|
4
|
|
W.S. Central
|
107
|
—
|
18
|
280
|
1
|
—
|
|
Arkansas
|
2
|
—
|
7
|
164
|
1
|
—
|
|
Louisiana
|
6
|
—
|
1
|
2
|
—
|
—
|
|
Oklahoma
|
4
|
—
|
10
|
106
|
—
|
—
|
|
Texas
|
95
|
—
|
—
|
8
|
—
|
—
|
|
Mountain
|
12
|
—
|
1
|
2
|
—
|
2
|
|
Arizona
|
1
|
—
|
—
|
—
|
—
|
2
|
|
Colorado
|
—
|
—
|
N
|
N
|
N
|
N
|
|
Idaho
|
1
|
—
|
N
|
N
|
N
|
N
|
|
Montana
|
5
|
—
|
—
|
1
|
—
|
—
|
|
Nevada
|
4
|
—
|
1
|
—
|
—
|
—
|
|
New Mexico
|
—
|
—
|
N
|
N
|
N
|
N
|
|
Utah
|
—
|
—
|
—
|
1
|
—
|
—
|
|
Wyoming
|
1
|
—
|
—
|
—
|
—
|
—
|
|
Pacific
|
143
|
—
|
3
|
—
|
—
|
9
|
|
Alaska
|
1
|
—
|
N
|
N
|
N
|
N
|
|
California
|
119
|
—
|
—
|
—
|
—
|
9
|
|
Hawaii
|
10
|
—
|
N
|
N
|
N
|
N
|
|
Oregon
|
—
|
—
|
1
|
—
|
—
|
—
|
|
Washington
|
13
|
—
|
2
|
—
|
—
|
—
|
|
Territories
|
|
|
|
|
|
|
|
American Samoa
|
—
|
—
|
N
|
N
|
N
|
N
|
|
C.N.M.I.
|
—
|
—
|
—
|
—
|
—
|
—
|
|
Guam
|
—
|
—
|
N
|
N
|
N
|
N
|
|
Puerto Rico
|
9,557
|
153
|
N
|
N
|
N
|
N
|
|
U.S. Virgin Islands
|
169
|
5
|
—
|
—
|
—
|
—
|
|
TABLE 2. (Continued) Reported cases of notifiable diseases,* by geographic division and area — United States, 2013
|
|
Area
|
Giardiasis
|
Gonorrhea†
|
Haemophilus influenzae, invasive disease
|
Hansen disease (leprosy)
|
|
All ages, serotypes
|
Age <5 years
|
|
Serotype b
|
Nonserotype b
|
Unknown serotype
|
|
United States
|
15,106
|
333,004
|
3,792
|
31
|
222
|
185
|
81
|
|
New England
|
1,443
|
6,883
|
362
|
2
|
7
|
1
|
1
|
|
Connecticut
|
230
|
2,860
|
55
|
—
|
1
|
—
|
—
|
|
Maine
|
218
|
245
|
25
|
2
|
1
|
—
|
N
|
|
Massachusetts
|
664
|
3,106
|
232
|
—
|
2
|
—
|
1
|
|
New Hampshire
|
117
|
121
|
25
|
—
|
1
|
1
|
—
|
|
Rhode Island
|
41
|
454
|
13
|
—
|
—
|
—
|
—
|
|
Vermont
|
173
|
97
|
12
|
—
|
2
|
—
|
N
|
|
Mid. Atlantic
|
2,865
|
40,807
|
609
|
8
|
22
|
27
|
13
|
|
New Jersey
|
336
|
7,014
|
114
|
—
|
—
|
12
|
2
|
|
New York (Upstate)
|
1,010
|
6,460
|
183
|
2
|
13
|
1
|
N
|
|
New York City
|
764
|
13,459
|
105
|
—
|
—
|
12
|
10
|
|
Pennsylvania
|
755
|
13,874
|
207
|
6
|
9
|
2
|
1
|
|
E.N. Central
|
1,953
|
55,395
|
640
|
3
|
51
|
13
|
1
|
|
Illinois
|
311
|
16,464
|
162
|
1
|
6
|
1
|
—
|
|
Indiana
|
203
|
7,144
|
141
|
1
|
12
|
1
|
1
|
|
Michigan
|
547
|
10,569
|
102
|
—
|
9
|
4
|
—
|
|
Ohio
|
507
|
16,619
|
149
|
1
|
24
|
2
|
—
|
|
Wisconsin
|
385
|
4,599
|
86
|
—
|
—
|
5
|
—
|
|
W.N. Central
|
1,561
|
17,713
|
271
|
2
|
5
|
30
|
3
|
|
Iowa
|
273
|
1,472
|
1
|
—
|
—
|
1
|
1
|
|
Kansas
|
102
|
2,161
|
40
|
—
|
5
|
—
|
—
|
|
Minnesota
|
618
|
3,873
|
90
|
—
|
—
|
12
|
1
|
|
Missouri
|
244
|
7,546
|
95
|
—
|
—
|
9
|
—
|
|
Nebraska
|
169
|
1,385
|
29
|
|
—
|
8
|
1
|
|
North Dakota
|
44
|
492
|
13
|
2
|
—
|
—
|
N
|
|
South Dakota
|
111
|
784
|
3
|
—
|
—
|
—
|
—
|
|
S. Atlantic
|
2,543
|
73,802
|
945
|
—
|
25
|
60
|
19
|
|
Delaware
|
20
|
1,390
|
9
|
—
|
—
|
1
|
—
|
|
District of Columbia
|
79
|
2,478
|
12
|
N
|
N
|
1
|
—
|
|
Florida
|
1,114
|
20,818
|
273
|
—
|
—
|
22
|
10
|
|
Georgia
|
641
|
14,252
|
162
|
—
|
5
|
14
|
6
|
|
Maryland
|
228
|
5,989
|
102
|
—
|
8
|
—
|
2
|
|
North Carolina
|
N
|
13,666
|
144
|
—
|
—
|
19
|
1
|
|
South Carolina
|
133
|
7,194
|
106
|
—
|
8
|
3
|
—
|
|
Virginia
|
278
|
6,952
|
98
|
—
|
3
|
—
|
—
|
|
West Virginia
|
50
|
1,063
|
39
|
—
|
1
|
—
|
N
|
|
E.S. Central
|
174
|
25,164
|
259
|
2
|
15
|
9
|
5
|
|
Alabama
|
174
|
8,377
|
74
|
1
|
7
|
2
|
1
|
|
Kentucky
|
N
|
4,315
|
47
|
1
|
—
|
1
|
1
|
|
Mississippi
|
N
|
5,096
|
29
|
—
|
2
|
5
|
3
|
|
Tennessee
|
N
|
7,376
|
109
|
—
|
6
|
1
|
—
|
|
W.S. Central
|
374
|
51,814
|
195
|
1
|
16
|
5
|
16
|
|
Arkansas
|
119
|
4,007
|
25
|
—
|
3
|
—
|
—
|
|
Louisiana
|
255
|
8,669
|
52
|
—
|
—
|
5
|
—
|
|
Oklahoma
|
N
|
5,303
|
113
|
—
|
13
|
—
|
N
|
|
Texas
|
N
|
33,835
|
5
|
1
|
N
|
N
|
16
|
|
Mountain
|
1,148
|
15,316
|
328
|
8
|
55
|
5
|
3
|
|
Arizona
|
115
|
6,412
|
112
|
3
|
22
|
2
|
—
|
|
Colorado
|
355
|
2,820
|
81
|
—
|
9
|
—
|
3
|
|
Idaho
|
137
|
211
|
19
|
1
|
3
|
3
|
—
|
|
Montana
|
91
|
224
|
6
|
—
|
4
|
—
|
—
|
|
Nevada
|
91
|
2,714
|
14
|
—
|
—
|
—
|
—
|
|
New Mexico
|
99
|
1,918
|
48
|
1
|
7
|
—
|
—
|
|
Utah
|
228
|
951
|
42
|
3
|
10
|
—
|
—
|
|
Wyoming
|
32
|
66
|
6
|
—
|
—
|
—
|
—
|
|
Pacific
|
3,045
|
46,110
|
183
|
5
|
26
|
35
|
20
|
|
Alaska
|
82
|
1,128
|
21
|
2
|
7
|
—
|
1
|
|
California
|
1,991
|
38,166
|
39
|
—
|
—
|
31
|
5
|
|
Hawaii
|
60
|
718
|
28
|
—
|
—
|
4
|
14
|
|
Oregon
|
364
|
1,729
|
84
|
1
|
10
|
—
|
N
|
|
Washington
|
548
|
4,369
|
11
|
2
|
9
|
—
|
N
|
|
Territories
|
|
|
|
|
|
|
|
|
American Samoa
|
—
|
—
|
—
|
—
|
—
|
—
|
—
|
|
C.N.M.I.
|
—
|
—
|
—
|
—
|
—
|
—
|
—
|
|
Guam
|
2
|
92
|
—
|
—
|
—
|
—
|
17
|
|
Puerto Rico
|
48
|
356
|
1
|
—
|
—
|
1
|
1
|
|
U.S. Virgin Islands
|
—
|
58
|
N
|
N
|
N
|
N
|
—
|
|
TABLE 2. (Continued) Reported cases of notifiable diseases,* by geographic division and area — United States, 2013
|
|
Area
|
Hantavirus pulmonary syndrome
|
Hemolytic uremic syndrome, postdiarrheal
|
Hepatitis, viral, acute
|
Hepatitis B perinatal infection
|
HIV diagnoses†
|
|
A
|
B
|
C
|
|
United States
|
21
|
329
|
1,781
|
3,050
|
2,138
|
48
|
34,969
|
|
New England
|
—
|
18
|
92
|
94
|
185
|
—
|
895
|
|
Connecticut
|
N
|
5
|
19
|
8
|
—
|
—
|
287
|
|
Maine
|
—
|
2
|
10
|
11
|
8
|
—
|
27
|
|
Massachusetts
|
—
|
5
|
43
|
71
|
174
|
—
|
476
|
|
New Hampshire
|
—
|
4
|
9
|
2
|
N
|
—
|
30
|
|
Rhode Island
|
—
|
—
|
4
|
U
|
U
|
—
|
70
|
|
Vermont
|
—
|
2
|
7
|
2
|
3
|
—
|
5
|
|
Mid. Atlantic
|
—
|
20
|
288
|
225
|
318
|
7
|
5,408
|
|
New Jersey
|
—
|
4
|
68
|
65
|
106
|
1
|
1,053
|
|
New York (Upstate)
|
—
|
11
|
75
|
49
|
115
|
—
|
862
|
|
New York City
|
—
|
4
|
92
|
68
|
16
|
—
|
2,297
|
|
Pennsylvania
|
—
|
1
|
53
|
43
|
81
|
6
|
1,196
|
|
E.N. Central
|
—
|
39
|
290
|
482
|
442
|
8
|
3,644
|
|
Illinois
|
—
|
5
|
79
|
94
|
37
|
—
|
1,294
|
|
Indiana
|
—
|
9
|
32
|
101
|
175
|
2
|
406
|
|
Michigan
|
—
|
7
|
83
|
53
|
74
|
1
|
693
|
|
Ohio
|
—
|
9
|
59
|
225
|
116
|
5
|
1,004
|
|
Wisconsin
|
—
|
9
|
37
|
9
|
40
|
—
|
247
|
|
W.N. Central
|
—
|
45
|
94
|
116
|
77
|
2
|
1,065
|
|
Iowa
|
—
|
6
|
17
|
11
|
—
|
—
|
117
|
|
Kansas
|
—
|
4
|
11
|
11
|
17
|
1
|
135
|
|
Minnesota
|
—
|
17
|
32
|
19
|
47
|
1
|
256
|
|
Missouri
|
—
|
13
|
8
|
61
|
6
|
—
|
440
|
|
Nebraska
|
—
|
3
|
13
|
9
|
2
|
—
|
68
|
|
North Dakota
|
—
|
2
|
9
|
—
|
4
|
—
|
17
|
|
South Dakota
|
—
|
—
|
4
|
5
|
1
|
—
|
32
|
|
S. Atlantic
|
—
|
40
|
284
|
884
|
413
|
5
|
10,902
|
|
Delaware
|
—
|
—
|
4
|
14
|
U
|
—
|
109
|
|
District of Columbia
|
—
|
—
|
—
|
—
|
—
|
—
|
351
|
|
Florida
|
—
|
14
|
115
|
323
|
134
|
2
|
4,859
|
|
Georgia
|
—
|
11
|
36
|
104
|
48
|
—
|
1,400
|
|
Maryland
|
—
|
2
|
29
|
43
|
53
|
—
|
1,005
|
|
North Carolina
|
—
|
7
|
46
|
75
|
79
|
1
|
1,451
|
|
South Carolina
|
—
|
—
|
14
|
58
|
—
|
—
|
697
|
|
Virginia
|
—
|
6
|
36
|
72
|
41
|
2
|
967
|
|
West Virginia
|
—
|
—
|
4
|
195
|
58
|
—
|
63
|
|
E.S. Central
|
—
|
21
|
59
|
621
|
354
|
1
|
1,978
|
|
Alabama
|
N
|
2
|
10
|
90
|
30
|
—
|
467
|
|
Kentucky
|
—
|
N
|
24
|
214
|
226
|
—
|
323
|
|
Mississippi
|
N
|
—
|
5
|
55
|
U
|
N
|
471
|
|
Tennessee
|
—
|
19
|
20
|
262
|
98
|
1
|
717
|
|
W.S. Central
|
4
|
31
|
146
|
314
|
117
|
2
|
5,115
|
|
Arkansas
|
—
|
3
|
9
|
50
|
30
|
—
|
157
|
|
Louisiana
|
1
|
—
|
14
|
82
|
19
|
—
|
1,275
|
|
Oklahoma
|
2
|
8
|
14
|
40
|
40
|
—
|
288
|
|
Texas
|
1
|
20
|
109
|
142
|
28
|
2
|
3,395
|
|
Mountain
|
13
|
33
|
182
|
106
|
83
|
2
|
1,590
|
|
Arizona
|
5
|
9
|
66
|
28
|
U
|
1
|
659
|
|
Colorado
|
2
|
12
|
51
|
24
|
21
|
1
|
300
|
|
Idaho
|
1
|
4
|
8
|
13
|
14
|
—
|
27
|
|
Montana
|
2
|
—
|
6
|
4
|
16
|
—
|
19
|
|
Nevada
|
—
|
1
|
19
|
29
|
9
|
—
|
386
|
|
New Mexico
|
3
|
3
|
20
|
3
|
12
|
—
|
117
|
|
Utah
|
—
|
3
|
12
|
5
|
11
|
—
|
71
|
|
Wyoming
|
—
|
1
|
—
|
—
|
—
|
—
|
11
|
|
Pacific
|
4
|
82
|
346
|
208
|
149
|
21
|
4,372
|
|
Alaska
|
N
|
N
|
1
|
1
|
—
|
—
|
21
|
|
California
|
3
|
57
|
255
|
138
|
72
|
19
|
3,661
|
|
Hawaii
|
—
|
4
|
16
|
4
|
—
|
—
|
68
|
|
Oregon
|
1
|
21
|
29
|
32
|
14
|
—
|
188
|
|
Washington
|
—
|
—
|
45
|
33
|
63
|
2
|
434
|
|
Territories
|
|
|
|
|
|
|
|
|
American Samoa
|
N
|
N
|
—
|
—
|
—
|
—
|
—
|
|
C.N.M.I.
|
—
|
—
|
—
|
—
|
—
|
—
|
1
|
|
Guam
|
N
|
—
|
31
|
75
|
71
|
—
|
—
|
|
Puerto Rico
|
—
|
N
|
10
|
36
|
N
|
—
|
454
|
|
U.S. Virgin Islands
|
—
|
N
|
—
|
—
|
—
|
—
|
17
|
|
TABLE 2. (Continued) Reported cases of notifiable diseases,* by geographic division and area — United States, 2013
|
|
Area
|
Influenza-
associated pediatric mortality†
|
Invasive Pneumococcal disease§
|
Legionellosis
|
Listeriosis
|
Lyme disease
|
Malaria
|
|
All Ages
|
Age <5 years
|
Total
|
Confirmed
|
Probable
|
|
United States
|
160
|
17,193
|
1,171
|
4,954
|
735
|
36,307
|
27,203
|
9,104
|
1,594
|
|
New England
|
8
|
1,220
|
47
|
363
|
61
|
12,892
|
9,496
|
3,396
|
130
|
|
Connecticut
|
—
|
315
|
16
|
63
|
22
|
2,925
|
2,111
|
814
|
20
|
|
Maine
|
—
|
121
|
6
|
23
|
4
|
1,373
|
1,127
|
246
|
10
|
|
Massachusetts
|
5
|
550
|
20
|
189
|
25
|
5,290
|
3,816
|
1,474
|
71
|
|
New Hampshire
|
3
|
101
|
5
|
27
|
5
|
1,687
|
1,324
|
363
|
10
|
|
Rhode Island
|
—
|
76
|
—
|
46
|
4
|
724
|
444
|
280
|
14
|
|
Vermont
|
—
|
57
|
—
|
15
|
1
|
893
|
674
|
219
|
5
|
|
Mid. Atlantic
|
19
|
2,293
|
128
|
1,431
|
179
|
14,139
|
11,278
|
2,861
|
418
|
|
New Jersey
|
5
|
598
|
39
|
241
|
29
|
3,766
|
2,785
|
981
|
93
|
|
New York (Upstate)
|
9
|
1,022
|
51
|
456
|
63
|
3,872
|
3,018
|
854
|
58
|
|
New York City
|
4
|
673
|
38
|
300
|
32
|
743
|
494
|
249
|
196
|
|
Pennsylvania
|
1
|
N
|
N
|
434
|
55
|
5,758
|
4,981
|
777
|
71
|
|
E.N. Central
|
24
|
3,054
|
187
|
1,311
|
102
|
2,580
|
2,073
|
507
|
149
|
|
Illinois
|
4
|
N
|
41
|
299
|
38
|
337
|
337
|
—
|
64
|
|
Indiana
|
4
|
726
|
36
|
91
|
11
|
110
|
101
|
9
|
20
|
|
Michigan
|
5
|
743
|
43
|
272
|
14
|
168
|
114
|
54
|
21
|
|
Ohio
|
8
|
1,161
|
43
|
491
|
24
|
93
|
74
|
19
|
33
|
|
Wisconsin
|
3
|
424
|
24
|
158
|
15
|
1,872
|
1,447
|
425
|
11
|
|
W.N. Central
|
12
|
1,043
|
99
|
183
|
21
|
2,667
|
1,625
|
1,042
|
109
|
|
Iowa
|
1
|
N
|
N
|
11
|
2
|
247
|
153
|
94
|
12
|
|
Kansas
|
3
|
149
|
N
|
17
|
3
|
34
|
18
|
16
|
8
|
|
Minnesota
|
4
|
536
|
43
|
49
|
12
|
2,340
|
1,431
|
909
|
67
|
|
Missouri
|
—
|
N
|
32
|
77
|
2
|
3
|
1
|
2
|
6
|
|
Nebraska
|
1
|
156
|
14
|
19
|
2
|
10
|
7
|
3
|
6
|
|
North Dakota
|
—
|
103
|
10
|
3
|
—
|
29
|
12
|
17
|
3
|
|
South Dakota
|
3
|
99
|
N
|
7
|
—
|
4
|
3
|
1
|
7
|
|
S. Atlantic
|
25
|
3,601
|
288
|
770
|
145
|
3,559
|
2,442
|
1,117
|
403
|
|
Delaware
|
1
|
29
|
1
|
16
|
1
|
509
|
400
|
109
|
9
|
|
District of Columbia
|
1
|
85
|
2
|
14
|
5
|
35
|
33
|
2
|
13
|
|
Florida
|
8
|
1,089
|
95
|
250
|
41
|
138
|
87
|
51
|
54
|
|
Georgia
|
4
|
1,138
|
91
|
66
|
14
|
8
|
8
|
—
|
67
|
|
Maryland
|
5
|
492
|
27
|
162
|
20
|
1,197
|
801
|
396
|
147
|
|
North Carolina
|
—
|
N
|
N
|
90
|
23
|
180
|
39
|
141
|
27
|
|
South Carolina
|
4
|
439
|
19
|
22
|
11
|
42
|
33
|
9
|
9
|
|
Virginia
|
2
|
N
|
37
|
123
|
29
|
1,307
|
925
|
382
|
75
|
|
West Virginia
|
—
|
329
|
16
|
27
|
1
|
143
|
116
|
27
|
2
|
|
E.S. Central
|
6
|
1,459
|
95
|
193
|
33
|
89
|
39
|
50
|
33
|
|
Alabama
|
1
|
182
|
18
|
41
|
5
|
24
|
11
|
13
|
2
|
|
Kentucky
|
2
|
255
|
13
|
50
|
11
|
40
|
17
|
23
|
9
|
|
Mississippi
|
1
|
233
|
18
|
19
|
4
|
—
|
—
|
—
|
3
|
|
Tennessee
|
2
|
789
|
46
|
83
|
13
|
25
|
11
|
14
|
19
|
|
W.S. Central
|
27
|
2,325
|
189
|
240
|
38
|
85
|
49
|
36
|
115
|
|
Arkansas
|
5
|
252
|
11
|
24
|
4
|
—
|
—
|
—
|
2
|
|
Louisiana
|
2
|
358
|
25
|
29
|
3
|
—
|
—
|
—
|
9
|
|
Oklahoma
|
2
|
N
|
21
|
19
|
3
|
3
|
1
|
2
|
14
|
|
Texas
|
18
|
1,715
|
132
|
168
|
28
|
82
|
48
|
34
|
90
|
|
Mountain
|
21
|
2,012
|
116
|
190
|
24
|
109
|
74
|
35
|
86
|
|
Arizona
|
4
|
786
|
44
|
69
|
3
|
32
|
22
|
10
|
33
|
|
Colorado
|
5
|
504
|
26
|
48
|
11
|
—
|
—
|
—
|
32
|
|
Idaho
|
—
|
N
|
4
|
12
|
—
|
19
|
14
|
5
|
5
|
|
Montana
|
—
|
31
|
1
|
9
|
—
|
18
|
16
|
2
|
—
|
|
Nevada
|
3
|
139
|
5
|
19
|
4
|
16
|
11
|
5
|
8
|
|
New Mexico
|
4
|
328
|
12
|
11
|
3
|
6
|
—
|
6
|
1
|
|
Utah
|
5
|
202
|
23
|
22
|
3
|
15
|
10
|
5
|
7
|
|
Wyoming
|
—
|
22
|
1
|
—
|
—
|
3
|
1
|
2
|
—
|
|
Pacific
|
18
|
186
|
22
|
273
|
132
|
187
|
127
|
60
|
151
|
|
Alaska
|
—
|
105
|
15
|
1
|
—
|
14
|
14
|
—
|
4
|
|
California
|
16
|
N
|
N
|
203
|
101
|
112
|
90
|
22
|
103
|
|
Hawaii
|
2
|
81
|
7
|
7
|
3
|
N
|
N
|
N
|
1
|
|
Oregon
|
—
|
N
|
N
|
20
|
7
|
43
|
12
|
31
|
13
|
|
Washington
|
—
|
N
|
N
|
42
|
21
|
18
|
11
|
7
|
30
|
|
Territories
|
|
|
|
|
|
|
|
|
|
|
American Samoa
|
—
|
N
|
—
|
N
|
N
|
N
|
N
|
N
|
—
|
|
C.N.M.I.
|
—
|
—
|
—
|
—
|
—
|
—
|
—
|
—
|
—
|
|
Guam
|
—
|
18
|
—
|
—
|
—
|
—
|
—
|
|
—
|
|
Puerto Rico
|
1
|
—
|
—
|
13
|
—
|
N
|
N
|
N
|
—
|
|
U.S. Virgin Islands
|
—
|
—
|
—
|
—
|
—
|
N
|
N
|
N
|
—
|
|
TABLE 2. (Continued) Reported cases of notifiable diseases,* by geographic division and area — United States, 2013
|
|
Area
|
Measles
|
Meningococcal disease
|
|
Total
|
Indigenous
|
Imported
|
All
Serogroups
|
Serogroups ACWY
|
Serogroup B
|
Serogroup
Other
|
Serogroup Unknown
|
|
United States
|
187
|
135
|
52
|
556
|
142
|
99
|
17
|
298
|
|
New England
|
2
|
—
|
2
|
25
|
14
|
8
|
2
|
1
|
|
Connecticut
|
—
|
—
|
—
|
3
|
1
|
—
|
1
|
1
|
|
Maine
|
—
|
—
|
—
|
4
|
2
|
1
|
1
|
—
|
|
Massachusetts
|
1
|
—
|
1
|
11
|
7
|
4
|
—
|
—
|
|
New Hampshire
|
—
|
—
|
—
|
2
|
1
|
1
|
—
|
—
|
|
Rhode Island
|
1
|
—
|
1
|
1
|
1
|
—
|
—
|
—
|
|
Vermont
|
—
|
—
|
—
|
4
|
2
|
2
|
—
|
—
|
|
Mid. Atlantic
|
80
|
70
|
10
|
82
|
18
|
14
|
2
|
48
|
|
New Jersey
|
15
|
12
|
3
|
20
|
—
|
—
|
—
|
20
|
|
New York (Upstate)
|
3
|
—
|
3
|
24
|
10
|
9
|
1
|
4
|
|
New York City
|
62
|
58
|
4
|
16
|
—
|
—
|
—
|
16
|
|
Pennsylvania
|
—
|
—
|
—
|
22
|
8
|
5
|
1
|
8
|
|
E.N. Central
|
12
|
3
|
9
|
52
|
21
|
24
|
3
|
4
|
|
Illinois
|
5
|
—
|
5
|
10
|
6
|
3
|
1
|
—
|
|
Indiana
|
2
|
1
|
1
|
15
|
6
|
9
|
—
|
—
|
|
Michigan
|
5
|
2
|
3
|
4
|
2
|
1
|
—
|
1
|
|
Ohio
|
—
|
—
|
—
|
10
|
5
|
3
|
1
|
1
|
|
Wisconsin
|
—
|
—
|
—
|
13
|
2
|
8
|
1
|
2
|
|
W.N. Central
|
5
|
—
|
5
|
38
|
6
|
6
|
1
|
25
|
|
Iowa
|
—
|
—
|
—
|
1
|
1
|
—
|
—
|
—
|
|
Kansas
|
—
|
—
|
—
|
3
|
2
|
—
|
—
|
1
|
|
Minnesota
|
2
|
—
|
2
|
12
|
—
|
—
|
—
|
12
|
|
Missouri
|
3
|
—
|
3
|
10
|
—
|
—
|
—
|
10
|
|
Nebraska
|
—
|
—
|
—
|
5
|
—
|
3
|
—
|
2
|
|
North Dakota
|
—
|
—
|
—
|
3
|
—
|
2
|
1
|
—
|
|
South Dakota
|
—
|
—
|
—
|
4
|
3
|
1
|
—
|
—
|
|
S. Atlantic
|
31
|
27
|
4
|
98
|
17
|
9
|
3
|
69
|
|
Delaware
|
—
|
—
|
—
|
2
|
—
|
2
|
—
|
—
|
|
District of Columbia
|
1
|
1
|
—
|
—
|
—
|
—
|
—
|
—
|
|
Florida
|
7
|
5
|
2
|
58
|
—
|
—
|
—
|
58
|
|
Georgia
|
—
|
—
|
—
|
12
|
4
|
1
|
1
|
6
|
|
Maryland
|
1
|
—
|
1
|
3
|
1
|
1
|
—
|
1
|
|
North Carolina
|
22
|
21
|
1
|
10
|
6
|
3
|
—
|
1
|
|
South Carolina
|
—
|
—
|
—
|
4
|
3
|
—
|
1
|
—
|
|
Virginia
|
—
|
—
|
—
|
7
|
2
|
2
|
—
|
3
|
|
West Virginia
|
—
|
—
|
—
|
2
|
1
|
—
|
1
|
—
|
|
E.S. Central
|
—
|
—
|
—
|
16
|
6
|
4
|
1
|
5
|
|
Alabama
|
—
|
—
|
—
|
5
|
2
|
2
|
1
|
—
|
|
Kentucky
|
—
|
—
|
—
|
1
|
1
|
—
|
—
|
—
|
|
Mississippi
|
—
|
—
|
—
|
4
|
—
|
—
|
—
|
4
|
|
Tennessee
|
—
|
—
|
—
|
6
|
3
|
2
|
—
|
1
|
|
W.S. Central
|
27
|
23
|
4
|
59
|
23
|
13
|
—
|
23
|
|
Arkansas
|
—
|
—
|
—
|
7
|
2
|
4
|
—
|
1
|
|
Louisiana
|
—
|
—
|
—
|
16
|
—
|
—
|
—
|
16
|
|
Oklahoma
|
—
|
—
|
—
|
6
|
4
|
2
|
—
|
—
|
|
Texas
|
27
|
23
|
4
|
30
|
17
|
7
|
—
|
6
|
|
Mountain
|
3
|
1
|
2
|
40
|
23
|
9
|
2
|
6
|
|
Arizona
|
1
|
—
|
1
|
12
|
9
|
3
|
—
|
—
|
|
Colorado
|
2
|
1
|
1
|
9
|
5
|
2
|
—
|
2
|
|
Idaho
|
—
|
—
|
—
|
4
|
1
|
1
|
—
|
2
|
|
Montana
|
—
|
—
|
—
|
1
|
1
|
—
|
—
|
—
|
|
Nevada
|
—
|
—
|
—
|
1
|
—
|
—
|
—
|
1
|
|
New Mexico
|
—
|
—
|
—
|
2
|
1
|
—
|
1
|
—
|
|
Utah
|
—
|
—
|
—
|
9
|
5
|
2
|
1
|
1
|
|
Wyoming
|
—
|
—
|
—
|
2
|
1
|
1
|
—
|
—
|
|
Pacific
|
27
|
11
|
16
|
146
|
14
|
12
|
3
|
117
|
|
Alaska
|
—
|
—
|
—
|
—
|
—
|
—
|
—
|
—
|
|
California
|
17
|
7
|
10
|
113
|
—
|
—
|
—
|
113
|
|
Hawaii
|
—
|
—
|
—
|
1
|
—
|
—
|
1
|
—
|
|
Oregon
|
6
|
3
|
3
|
12
|
7
|
3
|
1
|
1
|
|
Washington
|
4
|
1
|
3
|
20
|
7
|
9
|
1
|
3
|
|
Territories
|
|
|
|
|
|
|
|
|
|
American Samoa
|
—
|
—
|
—
|
—
|
—
|
—
|
—
|
—
|
|
C.N.M.I.
|
—
|
—
|
—
|
—
|
—
|
—
|
—
|
—
|
|
Guam
|
—
|
—
|
—
|
1
|
—
|
—
|
—
|
1
|
|
Puerto Rico
|
—
|
—
|
—
|
1
|
—
|
1
|
—
|
—
|
|
U.S. Virgin Islands
|
—
|
—
|
—
|
—
|
—
|
—
|
—
|
—
|
|
TABLE 2. (Continued) Reported cases of notifiable diseases,* by geographic division and area — United States, 2013
|
|
Area
|
Mumps
|
Novel influenza A virus infections†
|
Pertussis
|
Plague
|
Poliomyelitis, paralytic
|
Psittacosis
|
Q fever
|
|
Total
|
Acute
|
Chronic
|
|
United States
|
584
|
21
|
28,639
|
4
|
1
|
6
|
170
|
137
|
33
|
|
New England
|
79
|
—
|
1,147
|
—
|
—
|
—
|
2
|
1
|
1
|
|
Connecticut
|
4
|
—
|
61
|
—
|
—
|
N
|
—
|
—
|
—
|
|
Maine
|
1
|
—
|
332
|
—
|
—
|
—
|
—
|
—
|
—
|
|
Massachusetts
|
69
|
—
|
349
|
—
|
—
|
—
|
—
|
—
|
—
|
|
New Hampshire
|
1
|
—
|
131
|
—
|
—
|
—
|
N
|
N
|
N
|
|
Rhode Island
|
3
|
—
|
160
|
—
|
—
|
—
|
2
|
1
|
1
|
|
Vermont
|
1
|
—
|
114
|
—
|
—
|
—
|
N
|
N
|
N
|
|
Mid. Atlantic
|
146
|
—
|
1,903
|
—
|
—
|
—
|
7
|
5
|
2
|
|
New Jersey
|
80
|
—
|
406
|
—
|
—
|
—
|
2
|
2
|
—
|
|
New York (Upstate)
|
10
|
—
|
722
|
—
|
—
|
—
|
1
|
—
|
1
|
|
New York City
|
35
|
—
|
142
|
—
|
—
|
—
|
—
|
—
|
—
|
|
Pennsylvania
|
21
|
—
|
633
|
—
|
—
|
—
|
4
|
3
|
1
|
|
E.N. Central
|
50
|
18
|
5,111
|
—
|
—
|
—
|
25
|
19
|
6
|
|
Illinois
|
26
|
1
|
785
|
—
|
—
|
—
|
6
|
3
|
3
|
|
Indiana
|
4
|
14
|
616
|
—
|
—
|
—
|
1
|
1
|
—
|
|
Michigan
|
6
|
2
|
988
|
—
|
—
|
—
|
1
|
1
|
—
|
|
Ohio
|
12
|
1
|
1,464
|
—
|
—
|
—
|
8
|
6
|
2
|
|
Wisconsin
|
2
|
—
|
1,258
|
—
|
—
|
—
|
9
|
8
|
1
|
|
W.N. Central
|
15
|
1
|
2,523
|
—
|
—
|
1
|
42
|
35
|
7
|
|
Iowa
|
3
|
1
|
308
|
—
|
—
|
—
|
N
|
N
|
N
|
|
Kansas
|
—
|
—
|
405
|
—
|
—
|
—
|
3
|
3
|
—
|
|
Minnesota
|
3
|
—
|
865
|
—
|
—
|
—
|
2
|
2
|
—
|
|
Missouri
|
8
|
—
|
559
|
—
|
—
|
—
|
24
|
22
|
2
|
|
Nebraska
|
—
|
—
|
232
|
—
|
—
|
1
|
8
|
3
|
5
|
|
North Dakota
|
1
|
—
|
87
|
—
|
—
|
—
|
1
|
1
|
—
|
|
South Dakota
|
—
|
—
|
67
|
—
|
—
|
—
|
4
|
4
|
—
|
|
S. Atlantic
|
214
|
—
|
2,599
|
—
|
—
|
1
|
15
|
13
|
2
|
|
Delaware
|
—
|
—
|
57
|
—
|
—
|
—
|
—
|
—
|
—
|
|
District of Columbia
|
1
|
—
|
42
|
—
|
—
|
—
|
N
|
N
|
N
|
|
Florida
|
1
|
—
|
732
|
—
|
—
|
—
|
2
|
2
|
—
|
|
Georgia
|
10
|
—
|
317
|
—
|
—
|
—
|
2
|
2
|
—
|
|
Maryland
|
87
|
—
|
213
|
—
|
—
|
—
|
2
|
1
|
1
|
|
North Carolina
|
4
|
—
|
583
|
—
|
—
|
—
|
5
|
5
|
—
|
|
South Carolina
|
2
|
—
|
218
|
—
|
—
|
1
|
1
|
1
|
—
|
|
Virginia
|
109
|
—
|
418
|
—
|
—
|
—
|
3
|
2
|
1
|
|
West Virginia
|
—
|
—
|
19
|
—
|
—
|
—
|
—
|
—
|
—
|
|
E.S. Central
|
13
|
—
|
889
|
—
|
—
|
—
|
7
|
6
|
1
|
|
Alabama
|
4
|
—
|
200
|
—
|
—
|
—
|
2
|
2
|
—
|
|
Kentucky
|
2
|
—
|
383
|
—
|
—
|
—
|
1
|
—
|
1
|
|
Mississippi
|
—
|
—
|
59
|
—
|
—
|
—
|
—
|
—
|
—
|
|
Tennessee
|
7
|
—
|
247
|
—
|
—
|
—
|
4
|
4
|
—
|
|
W.S. Central
|
19
|
2
|
4,920
|
—
|
1
|
—
|
26
|
25
|
1
|
|
Arkansas
|
3
|
2
|
466
|
—
|
—
|
—
|
3
|
3
|
—
|
|
Louisiana
|
2
|
—
|
214
|
—
|
—
|
—
|
—
|
—
|
—
|
|
Oklahoma
|
1
|
—
|
255
|
—
|
—
|
—
|
3
|
3
|
—
|
|
Texas
|
13
|
—
|
3,985
|
—
|
1
|
N
|
20
|
19
|
1
|
|
Mountain
|
13
|
—
|
5,935
|
4
|
—
|
1
|
25
|
13
|
12
|
|
Arizona
|
1
|
—
|
1,440
|
—
|
—
|
1
|
8
|
4
|
4
|
|
Colorado
|
4
|
—
|
1,418
|
—
|
—
|
—
|
8
|
4
|
4
|
|
Idaho
|
—
|
—
|
237
|
—
|
—
|
—
|
2
|
1
|
1
|
|
Montana
|
—
|
—
|
663
|
—
|
—
|
—
|
2
|
1
|
1
|
|
Nevada
|
5
|
—
|
181
|
—
|
—
|
—
|
—
|
—
|
—
|
|
New Mexico
|
1
|
—
|
613
|
4
|
—
|
—
|
2
|
2
|
—
|
|
Utah
|
2
|
—
|
1,308
|
—
|
—
|
—
|
3
|
1
|
2
|
|
Wyoming
|
—
|
—
|
75
|
—
|
—
|
—
|
—
|
—
|
—
|
|
Pacific
|
35
|
—
|
3,612
|
—
|
—
|
3
|
21
|
20
|
1
|
|
Alaska
|
—
|
—
|
317
|
—
|
—
|
—
|
—
|
—
|
—
|
|
California
|
30
|
—
|
2,011
|
—
|
—
|
1
|
16
|
16
|
—
|
|
Hawaii
|
—
|
—
|
50
|
—
|
—
|
—
|
—
|
—
|
—
|
|
Oregon
|
3
|
—
|
486
|
—
|
—
|
2
|
3
|
3
|
—
|
|
Washington
|
2
|
—
|
748
|
—
|
—
|
—
|
2
|
1
|
1
|
|
Territories
|
|
|
|
|
|
|
|
|
|
|
American Samoa
|
—
|
—
|
—
|
—
|
—
|
N
|
N
|
N
|
N
|
|
C.N.M.I.
|
—
|
—
|
—
|
—
|
—
|
—
|
—
|
—
|
—
|
|
Guam
|
8
|
—
|
—
|
—
|
—
|
—
|
N
|
N
|
N
|
|
Puerto Rico
|
3
|
—
|
34
|
—
|
—
|
N
|
—
|
—
|
—
|
|
U.S. Virgin Islands
|
—
|
—
|
—
|
—
|
—
|
—
|
—
|
—
|
—
|
|
TABLE 2. (Continued) Reported cases of notifiable diseases,* by geographic division and area — United States, 2013
|
|
Area
|
Rabies
|
Rubella
|
Rubella, Congenital syndrome
|
Salmonellosis
|
Shiga toxin-producing Escherichia Coli (STEC)†
|
|
Animal
|
Human
|
|
United States
|
4,248
|
2
|
9
|
1
|
50,634
|
6,663
|
|
New England
|
307
|
—
|
—
|
—
|
2,116
|
256
|
|
Connecticut
|
148
|
—
|
—
|
—
|
426
|
71
|
|
Maine
|
50
|
—
|
—
|
—
|
131
|
27
|
|
Massachusetts
|
—
|
—
|
—
|
—
|
1,143
|
108
|
|
New Hampshire
|
30
|
—
|
—
|
—
|
213
|
27
|
|
Rhode Island
|
28
|
—
|
—
|
—
|
128
|
3
|
|
Vermont
|
51
|
—
|
—
|
—
|
75
|
20
|
|
Mid. Atlantic
|
742
|
—
|
1
|
1
|
5,112
|
725
|
|
New Jersey
|
—
|
—
|
—
|
—
|
1,062
|
137
|
|
New York (Upstate)
|
335
|
—
|
—
|
1
|
1,298
|
221
|
|
New York City
|
56
|
—
|
1
|
—
|
1,131
|
88
|
|
Pennsylvania
|
351
|
—
|
—
|
—
|
1,621
|
279
|
|
E.N. Central
|
166
|
—
|
1
|
—
|
5,561
|
1,031
|
|
Illinois
|
54
|
—
|
—
|
—
|
1,783
|
279
|
|
Indiana
|
10
|
—
|
—
|
—
|
705
|
121
|
|
Michigan
|
41
|
—
|
—
|
—
|
997
|
184
|
|
Ohio
|
61
|
—
|
1
|
—
|
1,181
|
222
|
|
Wisconsin
|
N
|
—
|
—
|
—
|
895
|
225
|
|
W.N. Central
|
223
|
—
|
—
|
—
|
3,235
|
1,009
|
|
Iowa
|
—
|
—
|
—
|
—
|
575
|
171
|
|
Kansas
|
60
|
—
|
—
|
—
|
423
|
89
|
|
Minnesota
|
62
|
—
|
—
|
—
|
799
|
305
|
|
Missouri
|
39
|
—
|
—
|
—
|
847
|
276
|
|
Nebraska
|
34
|
—
|
—
|
—
|
307
|
82
|
|
North Dakota
|
—
|
—
|
—
|
—
|
102
|
43
|
|
South Dakota
|
28
|
—
|
—
|
—
|
182
|
43
|
|
S. Atlantic
|
1,238
|
2
|
—
|
—
|
13,710
|
549
|
|
Delaware
|
—
|
—
|
—
|
—
|
121
|
15
|
|
District of Columbia
|
U
|
—
|
—
|
—
|
52
|
5
|
|
Florida
|
103
|
—
|
—
|
—
|
6,133
|
121
|
|
Georgia
|
302
|
—
|
—
|
—
|
2,281
|
121
|
|
Maryland
|
376
|
1
|
—
|
—
|
862
|
64
|
|
North Carolina
|
379
|
1
|
—
|
—
|
1,877
|
71
|
|
South Carolina
|
—
|
—
|
—
|
—
|
1,139
|
8
|
|
Virginia
|
—
|
—
|
—
|
—
|
1,051
|
109
|
|
West Virginia
|
78
|
—
|
—
|
—
|
194
|
35
|
|
E.S. Central
|
59
|
—
|
—
|
—
|
3,397
|
327
|
|
Alabama
|
39
|
—
|
—
|
—
|
1,086
|
53
|
|
Kentucky
|
15
|
—
|
—
|
—
|
526
|
110
|
|
Mississippi
|
5
|
—
|
—
|
—
|
917
|
30
|
|
Tennessee
|
—
|
—
|
—
|
—
|
868
|
134
|
|
W.S. Central
|
1,180
|
—
|
1
|
—
|
7,845
|
813
|
|
Arkansas
|
152
|
—
|
—
|
—
|
706
|
76
|
|
Louisiana
|
7
|
—
|
—
|
—
|
1,282
|
24
|
|
Oklahoma
|
84
|
—
|
1
|
—
|
911
|
107
|
|
Texas
|
937
|
—
|
—
|
—
|
4,946
|
606
|
|
Mountain
|
108
|
—
|
3
|
—
|
3,133
|
791
|
|
Arizona
|
N
|
—
|
—
|
—
|
1,010
|
246
|
|
Colorado
|
—
|
—
|
—
|
—
|
631
|
186
|
|
Idaho
|
27
|
—
|
2
|
—
|
134
|
106
|
|
Montana
|
36
|
—
|
—
|
—
|
93
|
49
|
|
Nevada
|
13
|
—
|
—
|
—
|
522
|
59
|
|
New Mexico
|
11
|
—
|
1
|
—
|
350
|
30
|
|
Utah
|
12
|
—
|
—
|
—
|
322
|
84
|
|
Wyoming
|
9
|
—
|
—
|
—
|
71
|
31
|
|
Pacific
|
225
|
—
|
3
|
—
|
6,525
|
1,162
|
|
Alaska
|
7
|
—
|
—
|
—
|
87
|
N
|
|
California
|
196
|
—
|
—
|
—
|
5,043
|
623
|
|
Hawaii
|
—
|
—
|
1
|
—
|
349
|
28
|
|
Oregon
|
10
|
—
|
1
|
—
|
375
|
189
|
|
Washington
|
12
|
—
|
1
|
—
|
671
|
322
|
|
Territories
|
|
|
|
|
|
|
|
American Samoa
|
U
|
U
|
—
|
—
|
—
|
—
|
|
C.N.M.I.
|
—
|
—
|
—
|
—
|
—
|
—
|
|
Guam
|
—
|
—
|
—
|
—
|
18
|
82
|
|
Puerto Rico
|
54
|
—
|
—
|
N
|
586
|
7
|
|
U.S. Virgin Islands
|
—
|
—
|
—
|
—
|
—
|
—
|
|
TABLE 2. (Continued) Reported cases of notifiable diseases,* by geographic division and area — United States, 2013
|
|
Area
|
Shigellosis
|
Spotted Fever Rickettsiosis†
|
Streptococcal toxic-shock syndrome
|
Syphilis§
|
|
Total
|
Confirmed
|
Probable
|
All Stages
|
Primary & Secondary
|
Congenital (age <1 yr)
|
|
United States
|
12,729
|
3,359
|
174
|
3,181
|
224
|
56,471
|
17,375
|
348
|
|
New England
|
515
|
9
|
1
|
8
|
39
|
1,327
|
502
|
4
|
|
Connecticut
|
57
|
—
|
—
|
—
|
18
|
133
|
56
|
—
|
|
Maine
|
5
|
2
|
—
|
2
|
16
|
21
|
10
|
—
|
|
Massachusetts
|
174
|
1
|
—
|
1
|
1
|
990
|
360
|
4
|
|
New Hampshire
|
8
|
4
|
1
|
3
|
—
|
79
|
28
|
—
|
|
Rhode Island
|
268
|
2
|
—
|
2
|
2
|
94
|
45
|
—
|
|
Vermont
|
3
|
—
|
—
|
—
|
2
|
10
|
3
|
—
|
|
Mid. Atlantic
|
871
|
86
|
4
|
82
|
37
|
8,626
|
2,163
|
13
|
|
New Jersey
|
137
|
42
|
2
|
40
|
27
|
968
|
233
|
—
|
|
New York (Upstate)
|
273
|
25
|
1
|
24
|
9
|
1,052
|
298
|
5
|
|
New York City
|
315
|
3
|
1
|
2
|
—
|
5,121
|
1,161
|
6
|
|
Pennsylvania
|
146
|
16
|
—
|
16
|
1
|
1,485
|
471
|
2
|
|
E.N. Central
|
1,348
|
171
|
7
|
164
|
90
|
5,624
|
2,031
|
49
|
|
Illinois
|
312
|
102
|
3
|
99
|
59
|
2,661
|
798
|
23
|
|
Indiana
|
117
|
32
|
2
|
30
|
13
|
543
|
215
|
—
|
|
Michigan
|
169
|
3
|
—
|
3
|
9
|
1,068
|
487
|
9
|
|
Ohio
|
714
|
23
|
1
|
22
|
9
|
1,095
|
436
|
17
|
|
Wisconsin
|
36
|
11
|
1
|
10
|
—
|
257
|
95
|
—
|
|
W.N. Central
|
870
|
292
|
11
|
281
|
1
|
1,753
|
698
|
3
|
|
Iowa
|
342
|
8
|
—
|
8
|
—
|
226
|
106
|
—
|
|
Kansas
|
40
|
—
|
—
|
—
|
—
|
196
|
51
|
—
|
|
Minnesota
|
132
|
15
|
1
|
14
|
—
|
541
|
193
|
—
|
|
Missouri
|
89
|
245
|
4
|
241
|
1
|
609
|
251
|
3
|
|
Nebraska
|
63
|
15
|
5
|
10
|
—
|
95
|
41
|
—
|
|
North Dakota
|
18
|
2
|
—
|
2
|
—
|
25
|
12
|
—
|
|
South Dakota
|
186
|
7
|
1
|
6
|
—
|
61
|
44
|
—
|
|
S. Atlantic
|
2,483
|
972
|
107
|
865
|
23
|
13,072
|
4,211
|
78
|
|
Delaware
|
14
|
11
|
—
|
11
|
—
|
146
|
52
|
1
|
|
District of Columbia
|
15
|
6
|
5
|
1
|
—
|
609
|
168
|
2
|
|
Florida
|
1,018
|
24
|
4
|
20
|
N
|
5,024
|
1,513
|
37
|
|
Georgia
|
886
|
81
|
81
|
—
|
—
|
2,990
|
1,017
|
20
|
|
Maryland
|
107
|
8
|
—
|
8
|
1
|
1,361
|
456
|
14
|
|
North Carolina
|
201
|
426
|
11
|
415
|
9
|
1,150
|
404
|
1
|
|
South Carolina
|
120
|
60
|
1
|
59
|
4
|
753
|
271
|
1
|
|
Virginia
|
115
|
350
|
4
|
346
|
8
|
1,000
|
315
|
2
|
|
West Virginia
|
7
|
6
|
1
|
5
|
1
|
39
|
15
|
—
|
|
E.S. Central
|
1,264
|
915
|
16
|
897
|
10
|
2,347
|
597
|
8
|
|
Alabama
|
313
|
255
|
1
|
254
|
—
|
679
|
183
|
2
|
|
Kentucky
|
63
|
72
|
2
|
68
|
10
|
395
|
122
|
4
|
|
Mississippi
|
222
|
39
|
1
|
38
|
N
|
293
|
78
|
—
|
|
Tennessee
|
666
|
549
|
12
|
537
|
—
|
980
|
214
|
2
|
|
W.S. Central
|
3,320
|
809
|
15
|
794
|
4
|
9,953
|
2,193
|
119
|
|
Arkansas
|
273
|
480
|
4
|
476
|
1
|
527
|
177
|
12
|
|
Louisiana
|
451
|
5
|
—
|
5
|
3
|
1,998
|
423
|
32
|
|
Oklahoma
|
210
|
241
|
10
|
231
|
N
|
383
|
118
|
—
|
|
Texas
|
2,386
|
83
|
1
|
82
|
N
|
7,045
|
1,475
|
75
|
|
Mountain
|
770
|
86
|
11
|
73
|
20
|
2,438
|
828
|
17
|
|
Arizona
|
428
|
63
|
9
|
54
|
—
|
962
|
287
|
13
|
|
Colorado
|
113
|
6
|
—
|
6
|
—
|
475
|
163
|
—
|
|
Idaho
|
11
|
1
|
1
|
—
|
—
|
42
|
15
|
—
|
|
Montana
|
69
|
2
|
—
|
2
|
—
|
8
|
5
|
—
|
|
Nevada
|
54
|
1
|
—
|
1
|
9
|
523
|
205
|
2
|
|
New Mexico
|
60
|
4
|
1
|
3
|
—
|
247
|
78
|
2
|
|
Utah
|
25
|
7
|
—
|
5
|
11
|
172
|
74
|
—
|
|
Wyoming
|
10
|
2
|
—
|
2
|
—
|
9
|
1
|
—
|
|
Pacific
|
1,288
|
19
|
2
|
17
|
—
|
11,331
|
4,152
|
57
|
|
Alaska
|
1
|
N
|
—
|
—
|
—
|
35
|
23
|
1
|
|
California
|
1,068
|
15
|
1
|
14
|
N
|
9,971
|
3,532
|
56
|
|
Hawaii
|
42
|
N
|
N
|
N
|
—
|
87
|
46
|
—
|
|
Oregon
|
55
|
2
|
1
|
1
|
N
|
527
|
267
|
—
|
|
Washington
|
122
|
2
|
—
|
2
|
N
|
711
|
284
|
—
|
|
Territories
|
|
|
|
|
|
|
|
|
|
American Samoa
|
—
|
N
|
N
|
N
|
N
|
—
|
—
|
—
|
|
C.N.M.I.
|
—
|
—
|
—
|
—
|
—
|
—
|
—
|
—
|
|
Guam
|
7
|
N
|
N
|
N
|
—
|
24
|
6
|
1
|
|
Puerto Rico
|
4
|
N
|
N
|
N
|
N
|
810
|
385
|
1
|
|
U.S. Virgin Islands
|
—
|
N
|
N
|
N
|
—
|
9
|
2
|
—
|
|
TABLE 2. (Continued) Reported cases of notifiable diseases,* by geographic division and area — United States, 2013
|
|
Area
|
Tetanus
|
Toxic-shock syndrome
|
Trichinellosis
|
Tuberculosis†
|
Tularemia
|
|
United States
|
26
|
71
|
22
|
9,582
|
203
|
|
New England
|
1
|
—
|
—
|
325
|
8
|
|
Connecticut
|
—
|
N
|
—
|
62
|
—
|
|
Maine
|
1
|
—
|
—
|
15
|
—
|
|
Massachusetts
|
—
|
—
|
—
|
201
|
8
|
|
New Hampshire
|
—
|
—
|
—
|
15
|
—
|
|
Rhode Island
|
—
|
—
|
—
|
27
|
—
|
|
Vermont
|
—
|
—
|
—
|
5
|
—
|
|
Mid. Atlantic
|
1
|
14
|
2
|
1,405
|
2
|
|
New Jersey
|
—
|
3
|
—
|
319
|
2
|
|
New York (Upstate)
|
1
|
6
|
2
|
216
|
—
|
|
New York City
|
—
|
3
|
—
|
656
|
—
|
|
Pennsylvania
|
—
|
2
|
—
|
214
|
—
|
|
E.N. Central
|
2
|
21
|
9
|
760
|
12
|
|
Illinois
|
—
|
5
|
9
|
327
|
4
|
|
Indiana
|
1
|
—
|
—
|
94
|
5
|
|
Michigan
|
1
|
10
|
—
|
141
|
—
|
|
Ohio
|
—
|
3
|
—
|
148
|
2
|
|
Wisconsin
|
—
|
3
|
—
|
50
|
1
|
|
W.N. Central
|
2
|
8
|
1
|
380
|
92
|
|
Iowa
|
1
|
1
|
—
|
47
|
4
|
|
Kansas
|
—
|
—
|
—
|
36
|
28
|
|
Minnesota
|
1
|
6
|
—
|
151
|
—
|
|
Missouri
|
—
|
1
|
—
|
104
|
36
|
|
Nebraska
|
—
|
—
|
1
|
21
|
17
|
|
North Dakota
|
—
|
—
|
—
|
12
|
—
|
|
South Dakota
|
—
|
—
|
—
|
9
|
7
|
|
S. Atlantic
|
7
|
12
|
6
|
1,746
|
7
|
|
Delaware
|
—
|
—
|
—
|
19
|
—
|
|
District of Columbia
|
—
|
—
|
—
|
38
|
—
|
|
Florida
|
5
|
N
|
—
|
652
|
1
|
|
Georgia
|
—
|
10
|
N
|
340
|
—
|
|
Maryland
|
—
|
N
|
3
|
176
|
2
|
|
North Carolina
|
—
|
1
|
1
|
216
|
2
|
|
South Carolina
|
—
|
1
|
—
|
112
|
—
|
|
Virginia
|
2
|
N
|
2
|
180
|
2
|
|
West Virginia
|
—
|
—
|
—
|
13
|
—
|
|
E.S. Central
|
2
|
5
|
—
|
374
|
7
|
|
Alabama
|
—
|
1
|
—
|
108
|
—
|
|
Kentucky
|
1
|
1
|
N
|
59
|
3
|
|
Mississippi
|
—
|
N
|
—
|
65
|
—
|
|
Tennessee
|
1
|
3
|
—
|
142
|
4
|
|
W.S. Central
|
3
|
2
|
—
|
1,502
|
49
|
|
Arkansas
|
1
|
2
|
N
|
72
|
38
|
|
Louisiana
|
—
|
—
|
—
|
139
|
—
|
|
Oklahoma
|
—
|
N
|
—
|
69
|
10
|
|
Texas
|
2
|
N
|
—
|
1,222
|
1
|
|
Mountain
|
3
|
3
|
—
|
450
|
15
|
|
Arizona
|
—
|
1
|
—
|
184
|
—
|
|
Colorado
|
—
|
1
|
—
|
74
|
1
|
|
Idaho
|
1
|
—
|
—
|
11
|
3
|
|
Montana
|
—
|
—
|
—
|
6
|
5
|
|
Nevada
|
—
|
—
|
—
|
92
|
—
|
|
New Mexico
|
1
|
—
|
—
|
50
|
4
|
|
Utah
|
1
|
1
|
—
|
33
|
2
|
|
Wyoming
|
—
|
—
|
—
|
—
|
—
|
|
Pacific
|
5
|
6
|
4
|
2,640
|
11
|
|
Alaska
|
—
|
N
|
2
|
71
|
1
|
|
California
|
4
|
6
|
2
|
2,171
|
2
|
|
Hawaii
|
—
|
N
|
—
|
115
|
—
|
|
Oregon
|
1
|
N
|
—
|
73
|
3
|
|
Washington
|
—
|
N
|
—
|
210
|
5
|
|
Territories
|
|
|
|
|
|
|
American Samoa
|
—
|
N
|
N
|
2
|
—
|
|
C.N.M.I.
|
—
|
—
|
—
|
16
|
—
|
|
Guam
|
—
|
—
|
—
|
48
|
—
|
|
Puerto Rico
|
1
|
N
|
N
|
50
|
—
|
|
U.S. Virgin Islands
|
—
|
—
|
—
|
2
|
—
|
|
TABLE 2. (Continued) Reported cases of notifiable diseases,* by geographic division and area — United States, 2013
|
|
Area
|
Typhoid fever
|
Vancomycin-intermediate
Staphylococcus aureus (VISA)
|
Varicella
|
Vibriosis
|
|
Morbidity
|
Mortality†
|
|
United States
|
338
|
248
|
11,359
|
3
|
1,299
|
|
New England
|
27
|
—
|
1,116
|
—
|
179
|
|
Connecticut
|
5
|
—
|
223
|
—
|
41
|
|
Maine
|
—
|
—
|
140
|
—
|
9
|
|
Massachusetts
|
18
|
—
|
510
|
N
|
101
|
|
New Hampshire
|
3
|
N
|
104
|
—
|
4
|
|
Rhode Island
|
1
|
—
|
39
|
—
|
19
|
|
Vermont
|
—
|
—
|
100
|
—
|
5
|
|
Mid. Atlantic
|
79
|
54
|
1,204
|
1
|
162
|
|
New Jersey
|
30
|
8
|
419
|
—
|
56
|
|
New York (Upstate)
|
16
|
35
|
N
|
1
|
73
|
|
New York City
|
23
|
6
|
N
|
—
|
27
|
|
Pennsylvania
|
10
|
5
|
785
|
—
|
6
|
|
E.N. Central
|
29
|
37
|
2,834
|
—
|
50
|
|
Illinois
|
12
|
7
|
731
|
—
|
15
|
|
Indiana
|
4
|
—
|
321
|
—
|
8
|
|
Michigan
|
4
|
15
|
722
|
—
|
10
|
|
Ohio
|
5
|
12
|
661
|
N
|
11
|
|
Wisconsin
|
4
|
3
|
399
|
—
|
6
|
|
W.N. Central
|
14
|
133
|
1,237
|
1
|
31
|
|
Iowa
|
1
|
N
|
N
|
N
|
N
|
|
Kansas
|
2
|
1
|
434
|
—
|
1
|
|
Minnesota
|
7
|
—
|
478
|
—
|
19
|
|
Missouri
|
1
|
131
|
230
|
1
|
5
|
|
Nebraska
|
—
|
—
|
16
|
—
|
3
|
|
North Dakota
|
—
|
—
|
36
|
—
|
3
|
|
South Dakota
|
3
|
1
|
43
|
N
|
N
|
|
S. Atlantic
|
51
|
14
|
1,404
|
1
|
365
|
|
Delaware
|
1
|
—
|
23
|
—
|
7
|
|
District of Columbia
|
—
|
N
|
10
|
—
|
1
|
|
Florida
|
11
|
5
|
659
|
1
|
191
|
|
Georgia
|
11
|
—
|
54
|
—
|
25
|
|
Maryland
|
13
|
4
|
N
|
—
|
57
|
|
North Carolina
|
5
|
2
|
N
|
N
|
26
|
|
South Carolina
|
—
|
—
|
168
|
—
|
14
|
|
Virginia
|
10
|
3
|
374
|
N
|
42
|
|
West Virginia
|
—
|
—
|
116
|
—
|
2
|
|
E.S. Central
|
10
|
—
|
165
|
—
|
41
|
|
Alabama
|
4
|
—
|
160
|
—
|
18
|
|
Kentucky
|
3
|
N
|
N
|
N
|
—
|
|
Mississippi
|
—
|
—
|
5
|
N
|
11
|
|
Tennessee
|
3
|
—
|
N
|
—
|
12
|
|
W.S. Central
|
14
|
10
|
2,185
|
—
|
130
|
|
Arkansas
|
—
|
—
|
249
|
—
|
N
|
|
Louisiana
|
—
|
1
|
62
|
—
|
39
|
|
Oklahoma
|
1
|
1
|
N
|
N
|
7
|
|
Texas
|
13
|
8
|
1,874
|
N
|
84
|
|
Mountain
|
22
|
—
|
1,093
|
—
|
42
|
|
Arizona
|
12
|
—
|
354
|
—
|
19
|
|
Colorado
|
2
|
N
|
353
|
N
|
10
|
|
Idaho
|
2
|
N
|
N
|
N
|
N
|
|
Montana
|
1
|
—
|
84
|
—
|
3
|
|
Nevada
|
1
|
—
|
N
|
N
|
5
|
|
New Mexico
|
1
|
N
|
66
|
—
|
3
|
|
Utah
|
3
|
—
|
227
|
—
|
2
|
|
Wyoming
|
—
|
—
|
9
|
N
|
—
|
|
Pacific
|
92
|
—
|
121
|
—
|
299
|
|
Alaska
|
5
|
N
|
61
|
—
|
2
|
|
California
|
69
|
N
|
30
|
—
|
150
|
|
Hawaii
|
4
|
—
|
30
|
—
|
30
|
|
Oregon
|
3
|
N
|
N
|
N
|
27
|
|
Washington
|
11
|
N
|
N
|
—
|
90
|
|
Territories
|
|
|
|
|
|
|
American Samoa
|
—
|
N
|
N
|
N
|
N
|
|
C.N.M.I.
|
—
|
—
|
—
|
—
|
—
|
|
Guam
|
—
|
—
|
57
|
N
|
1
|
|
Puerto Rico
|
—
|
2
|
305
|
—
|
—
|
|
U.S. Virgin Islands
|
—
|
—
|
—
|
—
|
—
|
|
Disease
|
<1 yr
|
1–4 yrs
|
5–14 yrs
|
15–24 yrs
|
25–39 yrs
|
40–64 yrs
|
>65 yrs
|
Age not stated
|
Total
|
|
No.
|
Rate
|
No.
|
Rate
|
No.
|
Rate
|
No.
|
Rate
|
No.
|
Rate
|
No.
|
Rate
|
No.
|
Rate
|
|
Arboviral diseases§
|
|
California serogroup viruses
|
|
neuroinvasive
|
2
|
(0.05)
|
18
|
(0.11)
|
51
|
(0.12)
|
6
|
(0.01)
|
6
|
(0.01)
|
10
|
(0.01)
|
2
|
(0.00)
|
—
|
95
|
|
nonneuroinvasive
|
1
|
(0.03)
|
1
|
(0.01)
|
3
|
(0.01)
|
—
|
(0.00)
|
2
|
(0.00)
|
9
|
(0.01)
|
1
|
(0.00)
|
—
|
17
|
|
Eastern equine encephalitis virus
|
|
neuroinvasive
|
—
|
(0.00)
|
—
|
(0.00)
|
2
|
(0.00)
|
—
|
(0.00)
|
—
|
(0.00)
|
3
|
(0.00)
|
3
|
(0.01)
|
—
|
8
|
|
Powassan virus
|
|
|
|
|
|
|
|
|
|
|
|
|
|
|
|
|
|
neuroinvasive
|
—
|
(0.00)
|
1
|
(0.01)
|
—
|
(0.00)
|
—
|
(0.00)
|
1
|
(0.00)
|
5
|
(0.00)
|
5
|
(0.01)
|
—
|
12
|
|
nonneuroinvasive
|
—
|
(0.00)
|
—
|
(0.00)
|
—
|
(0.00)
|
—
|
(0.00)
|
—
|
(0.00)
|
—
|
(0.00)
|
3
|
(0.01)
|
—
|
3
|
|
St. Louis encephalitis virus
|
|
|
|
|
|
|
|
|
|
|
|
|
|
|
|
|
|
neuroinvasive
|
—
|
(0.00)
|
—
|
(0.00)
|
—
|
(0.00)
|
—
|
(0.00)
|
—
|
(0.00)
|
1
|
(0.00)
|
—
|
(0.00)
|
—
|
1
|
|
West Nile virus
|
|
neuroinvasive
|
1
|
(0.03)
|
1
|
(0.01)
|
18
|
(0.04)
|
65
|
(0.15)
|
161
|
(0.26)
|
563
|
(0.54)
|
458
|
(1.06)
|
—
|
1,267
|
|
nonneuroinvasive
|
1
|
(0.03)
|
3
|
(0.02)
|
27
|
(0.07)
|
80
|
(0.18)
|
209
|
(0.34)
|
628
|
(0.60)
|
254
|
(0.59)
|
—
|
1,202
|
|
Babesiosis, total¶
|
2
|
(0.09)
|
5
|
(0.05)
|
19
|
(0.08)
|
29
|
(0.11)
|
94
|
(0.26)
|
694
|
(1.15)
|
702
|
(2.91)
|
251
|
1,796
|
|
confirmed
|
2
|
(0.08)
|
4
|
(0.04)
|
11
|
(0.04)
|
18
|
(0.07)
|
72
|
(0.19)
|
549
|
(0.86)
|
589
|
(2.32)
|
237
|
1,482
|
|
probable
|
—
|
(0.00)
|
1
|
(0.01)
|
8
|
(0.03)
|
11
|
(0.04)
|
22
|
(0.06)
|
145
|
(0.22)
|
113
|
(0.45)
|
14
|
314
|
|
Botulism, total
|
136
|
(3.45)
|
—
|
(0.00)
|
—
|
(0.00)
|
2
|
(0.00)
|
4
|
(0.01)
|
9
|
(0.01)
|
1
|
(0.00)
|
—
|
152
|
|
foodborne
|
—
|
(0.00)
|
—
|
(0.00)
|
—
|
(0.00)
|
—
|
(0.00)
|
1
|
(0.00)
|
2
|
(0.00)
|
1
|
(0.00)
|
—
|
4
|
|
infant
|
136
|
(3.45)
|
—
|
(0.00)
|
—
|
(0.00)
|
—
|
(0.00)
|
—
|
(0.00)
|
—
|
(0.00)
|
—
|
(0.00)
|
—
|
136
|
|
other, (wound and unspecified)
|
—
|
(0.00)
|
—
|
(0.00)
|
—
|
(0.00)
|
2
|
(0.00)
|
3
|
(0.00)
|
7
|
(0.01)
|
—
|
(0.00)
|
—
|
12
|
|
Brucellosis
|
—
|
(0.00)
|
2
|
(0.01)
|
6
|
(0.01)
|
6
|
(0.01)
|
33
|
(0.05)
|
33
|
(0.03)
|
19
|
(0.04)
|
—
|
99
|
|
Chancroid**
|
—
|
(0.00)
|
—
|
(0.00)
|
—
|
(0.00)
|
5
|
(0.01)
|
3
|
(0.00)
|
1
|
(0.00)
|
—
|
(0.00)
|
—
|
10
|
|
Chlamydia trachomatis infection**
|
—
|
(0.00)
|
—
|
(0.00)
|
—
|
(0.00)
|
949,270
|
(2160.73)
|
384,095
|
(621.65)
|
51,709
|
(49.78)
|
1,377
|
(3.19)
|
2,052
|
1,401,906
|
|
Cholera
|
—
|
(0.00)
|
—
|
(0.00)
|
—
|
(0.00)
|
1
|
(0.00)
|
1
|
(0.00)
|
9
|
(0.01)
|
2
|
(0.00)
|
1
|
14
|
|
Coccidioidomycosis¶
|
6
|
(0.40)
|
44
|
(0.71)
|
369
|
(2.32)
|
891
|
(5.19)
|
1,926
|
(8.06)
|
3,920
|
(9.86)
|
2,195
|
(13.55)
|
87
|
9,438
|
|
Cryptosporidiosis, total
|
135
|
(3.42)
|
1,165
|
(7.26)
|
1,302
|
(3.16)
|
1,287
|
(2.93)
|
2,167
|
(3.51)
|
1,940
|
(1.87)
|
978
|
(2.27)
|
82
|
9,056
|
|
confirmed
|
84
|
(2.13)
|
759
|
(4.73)
|
814
|
(1.98)
|
877
|
(2.00)
|
1,345
|
(2.18)
|
1,237
|
(1.19)
|
535
|
(1.24)
|
47
|
5,698
|
|
probable
|
51
|
(1.29)
|
406
|
(2.53)
|
488
|
(1.19)
|
410
|
(0.93)
|
822
|
(1.33)
|
703
|
(0.68)
|
443
|
(1.03)
|
35
|
3,358
|
|
Cyclosporiasis
|
—
|
(0.00)
|
13
|
(0.09)
|
17
|
(0.05)
|
35
|
(0.09)
|
138
|
(0.25)
|
422
|
(0.46)
|
157
|
(0.42)
|
2
|
784
|
|
Dengue virus infection
|
|
Denque fever
|
1
|
(0.03)
|
5
|
(0.03)
|
71
|
(0.17)
|
143
|
(0.33)
|
177
|
(0.29)
|
357
|
(0.34)
|
83
|
(0.19)
|
—
|
837
|
|
Denque hemorrhagic fever
|
—
|
(0.00)
|
—
|
(0.00)
|
—
|
(0.00)
|
2
|
(0.00)
|
2
|
(0.00)
|
2
|
(0.00)
|
—
|
(0.00)
|
—
|
6
|
|
Ehrlichiosis/Anaplasmosis
|
|
Anaplasma phagocytophilum
|
1
|
(0.03)
|
13
|
(0.09)
|
123
|
(0.31)
|
121
|
(0.29)
|
261
|
(0.44)
|
1,088
|
(1.10)
|
827
|
(2.01)
|
348
|
2,782
|
|
Ehrlichia chaffeensis
|
1
|
(0.03)
|
18
|
(0.12)
|
61
|
(0.16)
|
89
|
(0.21)
|
156
|
(0.27)
|
691
|
(0.70)
|
490
|
(1.19)
|
12
|
1,518
|
|
Ehrlichia ewingii
|
—
|
(0.00)
|
—
|
(0.00)
|
—
|
(0.00)
|
4
|
(0.01)
|
4
|
(0.01)
|
18
|
(0.02)
|
5
|
(0.01)
|
—
|
31
|
|
Undetermined
|
—
|
(0.00)
|
3
|
(0.02)
|
12
|
(0.03)
|
14
|
(0.03)
|
31
|
(0.05)
|
102
|
(0.10)
|
54
|
(0.13)
|
4
|
220
|
|
Giardiasis
|
86
|
(2.68)
|
1,794
|
(13.73)
|
1,932
|
(5.75)
|
1,738
|
(4.79)
|
2,934
|
(5.76)
|
4,745
|
(5.47)
|
1,492
|
(4.09)
|
385
|
15,106
|
|
Gonorrhea**
|
—
|
(0.00)
|
—
|
(0.00)
|
—
|
(0.00)
|
185,127
|
(421.39)
|
114,201
|
(184.83)
|
29,442
|
(28.34)
|
825
|
(1.91)
|
525
|
333,004
|
|
Haemophilus influenzae, invasive disease
|
|
all ages, all serotypes
|
275
|
(6.98)
|
163
|
(1.02)
|
126
|
(0.30)
|
103
|
(0.23)
|
209
|
(0,34)
|
897
|
(0.86)
|
1,887
|
(4.37)
|
132
|
3,792
|
|
age<5 yrs
|
|
|
|
|
|
|
|
|
|
|
|
|
|
|
|
|
|
serotype b
|
19
|
(0.48)
|
12
|
(0.07)
|
—
|
(0.00)
|
—
|
(0.00)
|
—
|
(0.00)
|
—
|
(0.00)
|
—
|
(0.00)
|
—
|
31
|
|
nonserotype b
|
144
|
(4.04)
|
78
|
(0.54)
|
—
|
(0.00)
|
—
|
(0.00)
|
—
|
(0.00)
|
—
|
(0.00)
|
—
|
(0.00)
|
—
|
222
|
|
unknown serotype
|
112
|
(3.15)
|
73
|
(0.50)
|
—
|
(0.00)
|
—
|
(0.00)
|
—
|
(0.00)
|
—
|
(0.00)
|
—
|
(0.00)
|
—
|
185
|
|
Hansen disease
|
—
|
(0.00)
|
—
|
(0.00)
|
—
|
(0.00)
|
11
|
(0.03)
|
20
|
(0.04)
|
23
|
(0.02)
|
13
|
(0.03)
|
14
|
81
|
|
Hantavirus pulmonary syndrome
|
—
|
(0.00)
|
—
|
(0.00)
|
2
|
(0.01)
|
1
|
(0.00)
|
5
|
(0.01)
|
10
|
(0.01)
|
3
|
(0.01)
|
—
|
21
|
|
Hemolytic uremic syndrome postdiarrheal
|
5
|
(0.13)
|
148
|
(0.94)
|
98
|
(0.24)
|
28
|
(0.06)
|
8
|
(0.01)
|
19
|
(0.02)
|
20
|
(0.05)
|
3
|
329
|
|
Hepatitis virus, acute
|
|
|
|
|
|
|
|
|
|
|
|
|
|
|
|
|
|
A
|
1
|
(0.03)
|
22
|
(0.14)
|
75
|
(0.18)
|
237
|
(0.54)
|
461
|
(0.75)
|
675
|
(0.65)
|
284
|
(0.66)
|
26
|
1,781
|
|
B
|
—
|
(0.00)
|
1
|
(0.01)
|
5
|
(0.01)
|
119
|
(0.27)
|
1,211
|
(1.97)
|
1,492
|
(1.44)
|
156
|
(0.36)
|
66
|
3,050
|
|
C
|
10
|
(0.26)
|
3
|
(0.02)
|
1
|
(0.00)
|
474
|
(1.13)
|
963
|
(1.62)
|
514
|
(0.52)
|
28
|
(0.07)
|
145
|
2,138
|
|
Hepatitis B perinatal infection
|
27
|
(0.69)
|
19
|
(0.12)
|
1
|
(0.00)
|
—
|
(0.00)
|
—
|
(0.00)
|
—
|
(0.00)
|
—
|
(0.00)
|
1
|
48
|
|
Human immunodeficiency virus (HIV) diagnoses††
|
29
|
(0.70)
|
37
|
(0.20)
|
95
|
(0.20)
|
7,319
|
(16.70)
|
13,888
|
(22.20)
|
12,854
|
(12.40)
|
747
|
(1.70)
|
—
|
34,969
|
|
Influenza-associated pediatric mortality§§
|
24
|
(0.61)
|
40
|
(0.25)
|
73
|
(0.18)
|
23
|
(0.18)
|
—
|
(0.00)
|
—
|
(0.00)
|
—
|
(0.00)
|
—
|
160
|
|
Invasive pneumococcal disease
|
|
|
|
|
|
|
|
|
|
|
|
|
|
|
|
|
|
all ages
|
362
|
(13.93)
|
693
|
(6.56)
|
420
|
(1.55)
|
328
|
(1.14)
|
1,232
|
(3.05)
|
7,009
|
(10.21)
|
6,568
|
(22.80)
|
581
|
17,193
|
|
age<5 yrs
|
388
|
(13.12)
|
783
|
(6.51)
|
—
|
(0.00)
|
—
|
(0.00)
|
—
|
(0.00)
|
—
|
(0.00)
|
—
|
(0.00)
|
—
|
1,171
|
|
Legionellosis
|
4
|
(0.10)
|
9
|
(0.06)
|
5
|
(0.01)
|
39
|
(0.09)
|
287
|
(0.46)
|
2,413
|
(2.32)
|
1,844
|
(4.27)
|
353
|
4,954
|
|
Disease
|
<1 yr
|
1–4 yrs
|
5–14 yrs
|
15–24 yrs
|
25–39 yrs
|
40–64 yrs
|
>65 yrs
|
Age not stated
|
Total
|
|
No.
|
Rate
|
No.
|
Rate
|
No.
|
Rate
|
No.
|
Rate
|
No.
|
Rate
|
No.
|
Rate
|
No.
|
Rate
|
|
Listeriosis
|
38
|
(0.96)
|
3
|
(0.02)
|
4
|
(0.01)
|
23
|
(0.05)
|
50
|
(0.08)
|
202
|
(0.19)
|
400
|
(0.93)
|
15
|
735
|
|
Lyme disease, total
|
17
|
(0.43)
|
1,212
|
(7.59)
|
5,149
|
(12.57)
|
3,221
|
(7.36)
|
3,966
|
(6.45)
|
11,420
|
(11.04)
|
5,422
|
(12.63)
|
5,900
|
36,307
|
|
confirmed
|
16
|
(0.41)
|
1,039
|
(6.50)
|
4,027
|
(9.83)
|
2,292
|
(5.24)
|
2,908
|
(4.73)
|
8,669
|
(8.38)
|
3,951
|
(9.20)
|
4,301
|
27,203
|
|
probable
|
1
|
(0.03)
|
173
|
(1.08)
|
1,122
|
(2.74)
|
929
|
(2.12)
|
1,058
|
(1.72)
|
2,751
|
(2.66)
|
1,471
|
(3.43)
|
1,599
|
9,104
|
|
Malaria
|
3
|
(0.08)
|
67
|
(0.42)
|
142
|
(0.35)
|
195
|
(0.44)
|
498
|
(0.81)
|
570
|
(0.55)
|
92
|
(0.21)
|
27
|
1,594
|
|
Measles, total
|
23
|
(0.58)
|
49
|
(0.31)
|
44
|
(0.11)
|
32
|
(0.07)
|
21
|
(0.03)
|
18
|
(0.02)
|
—
|
(0.00)
|
—
|
187
|
|
indigenous
|
16
|
(0.41)
|
34
|
(0.21)
|
37
|
(0.09)
|
27
|
(0.06)
|
11
|
(0.02)
|
10
|
(0.01)
|
—
|
(0.00)
|
—
|
135
|
|
imported
|
7
|
(0.18)
|
15
|
(0.09)
|
7
|
(0.02)
|
5
|
(0.01)
|
10
|
(0.02)
|
8
|
(0.01)
|
—
|
(0.00)
|
—
|
52
|
|
Meningococcal disease
|
|
|
|
|
|
|
|
|
|
|
|
|
|
|
|
|
|
all serogroups
|
47
|
(1.19)
|
46
|
(0.29)
|
31
|
(0.08)
|
110
|
(0.25)
|
83
|
(0.13)
|
130
|
(0.13)
|
103
|
(0.24)
|
6
|
556
|
|
serogroup ACWY
|
13
|
(0.33)
|
4
|
(0.02)
|
4
|
(0.01)
|
21
|
(0.05)
|
17
|
(0.03)
|
37
|
(0.04)
|
41
|
(0.10)
|
5
|
142
|
|
serogroup B
|
15
|
(0.38)
|
16
|
(0.10)
|
13
|
(0.03)
|
24
|
(0.05)
|
10
|
(0.02)
|
16
|
(0.02)
|
4
|
(0.01)
|
1
|
99
|
|
serogroup other
|
1
|
(0.03)
|
1
|
(0.01)
|
1
|
(0.00)
|
4
|
(0.01)
|
2
|
(0.00)
|
7
|
(0.01)
|
1
|
(0.00)
|
—
|
17
|
|
serogroup unknown
|
18
|
(0.46)
|
25
|
(0.16)
|
13
|
(0.03)
|
61
|
(0.14)
|
54
|
(0.09)
|
70
|
(0.07)
|
57
|
(0.13)
|
—
|
298
|
|
Mumps
|
2
|
(0.05)
|
33
|
(0.21)
|
48
|
(0.12)
|
285
|
(0.65)
|
96
|
(0.16)
|
74
|
(0.07)
|
14
|
(0.03)
|
32
|
584
|
|
Novel influenza A virus infection
|
—
|
(0.00)
|
8
|
(0.05)
|
11
|
(0.03)
|
—
|
(0.00)
|
—
|
(0.00)
|
—
|
(0.00)
|
1
|
(0.00)
|
1
|
21
|
|
Pertussis
|
4,000
|
(101.48)
|
3,853
|
(24.01)
|
11,281
|
(27.42)
|
3,818
|
(8.69)
|
1,840
|
(2.98)
|
2,894
|
(2.79)
|
851
|
(1.97)
|
102
|
28,639
|
|
Plague
|
—
|
(0.00)
|
—
|
(0.00)
|
1
|
(0.00)
|
1
|
(0.00)
|
—
|
(0.00)
|
1
|
(0.00)
|
1
|
(0.00)
|
—
|
4
|
|
Poliomyelitis, paralytic
|
—
|
(0.00)
|
1
|
(0.01)
|
—
|
(0.00)
|
—
|
(0.00)
|
—
|
(0.00)
|
—
|
(0.00)
|
—
|
(0.00)
|
—
|
1
|
|
Psittacosis
|
—
|
(0.00)
|
—
|
(0.00)
|
—
|
(0.00)
|
—
|
(0.00)
|
1
|
(0.00)
|
5
|
(0.01)
|
—
|
(0.00)
|
—
|
6
|
|
Q fever, total
|
—
|
(0.00)
|
—
|
(0.00)
|
2
|
(0.00)
|
6
|
(0.01)
|
24
|
(0.04)
|
85
|
(0.08)
|
34
|
(0.08)
|
19
|
170
|
|
acute
|
—
|
(0.00)
|
—
|
(0.00)
|
2
|
(0.00)
|
5
|
(0.01)
|
21
|
(0.03)
|
66
|
(0.06)
|
25
|
(0.06)
|
18
|
137
|
|
chronic
|
—
|
(0.00)
|
—
|
(0.00)
|
—
|
(0.00)
|
1
|
(0.00)
|
3
|
(0.00)
|
19
|
(0.02)
|
9
|
(0.02)
|
1
|
33
|
|
Rabies, human
|
—
|
(0.00)
|
—
|
(0.00)
|
—
|
(0.00)
|
1
|
(0.00)
|
—
|
(0.00)
|
1
|
(0.00)
|
—
|
(0.00)
|
—
|
2
|
|
Rubella
|
1
|
(0.03)
|
1
|
(0.01)
|
1
|
(0.00)
|
1
|
(0.00)
|
4
|
(0.01)
|
1
|
(0.00)
|
—
|
(0.00)
|
—
|
9
|
|
Rubella, congenital syndrome
|
1
|
(0.03)
|
—
|
(0.00)
|
—
|
(0.00)
|
—
|
(0.00)
|
—
|
(0.00)
|
—
|
(0.00)
|
—
|
(0.00)
|
—
|
1
|
|
Salmonellosis
|
5,440
|
(138.01)
|
7,558
|
(47.10)
|
6,289
|
(15.29)
|
4,609
|
(10.49)
|
6,631
|
(10.73)
|
11,906
|
(11.46)
|
7,239
|
(16.78)
|
962
|
50,634
|
|
Shiga toxin-producing Escherichia coli (STEC)
|
187
|
(4.76)
|
1,583
|
(9.89)
|
1,251
|
(3.05)
|
1,166
|
(2.66)
|
879
|
(1.43)
|
901
|
(0.87)
|
594
|
(1.38)
|
102
|
6,663
|
|
Shigellosis
|
206
|
(5.23)
|
3,248
|
(20.24)
|
3,949
|
(9.60)
|
1,010
|
(2.30)
|
1,976
|
(3.20)
|
1,745
|
(1.68)
|
458
|
(1.06)
|
137
|
12,729
|
|
Spotted Fever Rickettsiosis, total
|
3
|
(0.08)
|
39
|
(0.24)
|
163
|
(0.40)
|
296
|
(0.68)
|
602
|
(0.98)
|
1,520
|
(1.47)
|
722
|
(1.68)
|
14
|
3,359
|
|
confirmed
|
1
|
(0.03)
|
4
|
(0.03)
|
9
|
(0.02)
|
9
|
(0.02)
|
31
|
(0.05)
|
76
|
(0.07)
|
41
|
(0.10)
|
3
|
174
|
|
probable
|
2
|
(0.05)
|
35
|
(0.22)
|
154
|
(0.38)
|
286
|
(0.65)
|
571
|
(0.93)
|
1,442
|
(1.39)
|
681
|
(1.59)
|
10
|
3,181
|
|
Streptococcal toxic-shock syndrome
|
2
|
(0.08)
|
5
|
(0.05)
|
13
|
(0.05)
|
8
|
(0.03)
|
29
|
(0.07)
|
84
|
(0.12)
|
83
|
(0.28)
|
—
|
224
|
|
Syphilis, total all stages**,¶¶
|
—
|
(0.00)
|
—
|
(0.00)
|
—
|
(0.00)
|
12,179
|
(27.72)
|
23,391
|
(37.86)
|
19,103
|
(18.39)
|
1,362
|
(3.16)
|
25
|
56,471
|
|
congenital**
|
—
|
(0.00)
|
—
|
(0.00)
|
—
|
(0.00)
|
—
|
(0.00)
|
—
|
(0.00)
|
—
|
(0.00)
|
—
|
(0.00)
|
—
|
348
|
|
primary and secondary**
|
—
|
(0.00)
|
—
|
(0.00)
|
—
|
(0.00)
|
4,542
|
(10.34)
|
7,576
|
(12.26)
|
5,057
|
(4.87)
|
162
|
(0.38)
|
10
|
17,375
|
|
Tetanus
|
—
|
(0.00)
|
—
|
(0.00)
|
2
|
(0.00)
|
1
|
(0.00)
|
5
|
(0.01)
|
3
|
(0.00)
|
5
|
(0.01)
|
10
|
26
|
|
Toxic-shock syndrome
|
1
|
(0.03)
|
3
|
(0.03)
|
17
|
(0.06)
|
20
|
(0.06)
|
8
|
(0.02)
|
11
|
(0.01)
|
1
|
(0.00)
|
10
|
71
|
|
Trichinellosis
|
—
|
(0.00)
|
—
|
(0.00)
|
1
|
(0.00)
|
4
|
(0.01)
|
8
|
(0.01)
|
9
|
(0.01)
|
—
|
(0.00)
|
—
|
22
|
|
Tuberculosis***
|
67
|
(1.70)
|
230
|
(1.43)
|
188
|
(0.46)
|
978
|
(2.23)
|
2,252
|
(3.64)
|
3,673
|
(3.54)
|
2,194
|
(5.09)
|
—
|
9,582
|
|
Tularemia
|
—
|
(0.00)
|
16
|
(0.10)
|
38
|
(0.09)
|
12
|
(0.03)
|
25
|
(0.04)
|
73
|
(0.07)
|
31
|
(0.07)
|
8
|
203
|
|
Typhoid fever
|
7
|
(0.18)
|
38
|
(0.24)
|
60
|
(0.15)
|
57
|
(0.13)
|
95
|
(0.15)
|
59
|
(0.06)
|
17
|
(0.04)
|
5
|
338
|
|
Vancomycin-intermediate Staphylococcus aureus (VISA)
|
2
|
(0.06)
|
1
|
(0.01)
|
3
|
(0.01)
|
20
|
(0.06)
|
43
|
(0.09)
|
92
|
(0.11)
|
68
|
(0.20)
|
19
|
248
|
|
Vibriosis
|
1
|
(0.03)
|
15
|
(0.10)
|
80
|
(0.20)
|
86
|
(0.20)
|
224
|
(0.37)
|
507
|
(0.50)
|
271
|
(0.65)
|
115
|
1,299
|
|
Disease
|
Male
|
Female
|
Sex not
stated
|
Total
|
|
No.
|
Rate
|
No.
|
Rate
|
|
Arboviral diseases§
|
|
|
|
|
|
|
|
California serogroup viruses
|
|
|
|
|
|
|
|
neuroinvasive
|
59
|
(0.04)
|
36
|
(0.02)
|
—
|
95
|
|
nonneuroinvasive
|
12
|
(0.01)
|
5
|
(0.00)
|
—
|
17
|
|
Eastern equine encephalitis virus
|
|
|
|
|
|
|
|
neuroinvasive
|
6
|
(0.00)
|
2
|
(0.00)
|
—
|
8
|
|
Powassan virus
|
|
|
|
|
|
|
|
neuroinvasive
|
9
|
(0.01)
|
3
|
(0.00)
|
—
|
12
|
|
nonneuroinvasive
|
2
|
(0.00)
|
1
|
(0.00)
|
—
|
3
|
|
St. Louis encephalitis virus
|
|
|
|
|
|
|
|
neuroinvasive
|
1
|
(0.00)
|
|
(0.00)
|
—
|
1
|
|
West Nile virus
|
|
|
|
|
|
|
|
neuroinvasive
|
761
|
(0.49)
|
506
|
(0.32)
|
—
|
1,267
|
|
nonneuroinvasive
|
664
|
(0.43)
|
538
|
(0.34)
|
—
|
1,202
|
|
Babesiosis, total¶
|
1,154
|
(1.28)
|
577
|
(0.62)
|
65
|
1,796
|
|
confirmed
|
968
|
(1.02)
|
450
|
(0.46)
|
64
|
1,482
|
|
probable
|
186
|
(0.20)
|
127
|
(0.13)
|
1
|
314
|
|
Botulism, total
|
77
|
(0.05)
|
75
|
(0.05)
|
—
|
152
|
|
foodborne
|
|
(0.00)
|
4
|
(0.00)
|
—
|
4
|
|
infant
|
65
|
(3.23)
|
71
|
(3.69)
|
—
|
136
|
|
other, (wound and unspecified)
|
12
|
(0.01)
|
|
(0.00)
|
—
|
12
|
|
Brucellosis
|
63
|
(0.04)
|
36
|
(0.02)
|
—
|
99
|
|
Chancroid**
|
6
|
(0.00)
|
4
|
(0.00)
|
—
|
10
|
|
Chlamydia trachomatis infection**
|
405,652
|
(262.60)
|
993,348
|
(623.19)
|
2906
|
1,401,906
|
|
Cholera
|
7
|
(0.00)
|
6
|
(0.00)
|
1
|
14
|
|
Coccidioidomycosis¶
|
5,088
|
(8.54)
|
4,307
|
(7.06)
|
43
|
9,438
|
|
Cryptosporidiosis, total
|
4,397
|
(2.85)
|
4,623
|
(2.90)
|
36
|
9,056
|
|
confirmed
|
2,844
|
(1.84)
|
2,848
|
( 1.78)
|
6
|
5,698
|
|
probable
|
1,553
|
(1.01)
|
1,775
|
(1.11)
|
30
|
3,358
|
|
Cyclosporiasis
|
333
|
(0.24)
|
446
|
(0.32)
|
5
|
784
|
|
Dengue virus infection
|
|
|
|
|
|
|
|
Denque fever
|
425
|
(0.28)
|
412
|
(0.26)
|
—
|
837
|
|
Denque hemorrhagic fever
|
3
|
(0.00)
|
3
|
(0.00)
|
—
|
6
|
|
Ehrlichiosis/Anaplasmosis
|
|
|
|
|
|
|
|
Anaplasma phagocytophilum
|
1,480
|
(1.01)
|
967
|
(0.64)
|
335
|
2,782
|
|
Ehrlichia chaffeensis
|
899
|
(0.61)
|
604
|
(0.40)
|
15
|
1,518
|
|
Ehrlichia ewingii
|
19
|
(0.01)
|
12
|
(0.01)
|
—
|
31
|
|
Undetermined
|
118
|
(0.08)
|
99
|
(0.07)
|
3
|
220
|
|
Giardiasis
|
9,048
|
(7.06)
|
5,985
|
(4.52)
|
73
|
15,106
|
|
Gonorrhea**
|
169,130
|
(109.49)
|
163,208
|
(102.39)
|
666
|
333,004
|
|
Haemophilus influenzae, invasive disease
|
|
|
|
|
|
|
|
all ages, all serotypes
|
1,641
|
(1.06)
|
1,999
|
(1.25)
|
152
|
3,792
|
|
age <5 yrs
|
|
|
|
|
|
|
|
serotype b
|
21
|
(0.21)
|
10
|
(0.10)
|
—
|
31
|
|
nonserotype b
|
127
|
(1.25)
|
93
|
(0.95)
|
2
|
222
|
|
unknown serotype
|
109
|
(1.07)
|
74
|
(0.76)
|
2
|
185
|
|
Hansen disease
|
46
|
(0.03)
|
21
|
(0.01)
|
14
|
81
|
|
Hantavirus pulmonary syndrome
|
11
|
(0.01)
|
10
|
(0.01)
|
—
|
21
|
|
Hemolytic uremic syndrome postdiarrheal
|
133
|
(0.09)
|
195
|
(0.12)
|
1
|
329
|
|
Hepatitis virus, acute
|
|
|
|
|
|
|
|
A
|
864
|
(0.56)
|
914
|
(0.57)
|
3
|
1,781
|
|
B
|
1,873
|
(1.22)
|
1,163
|
(0.73)
|
14
|
3,050
|
|
C
|
1,142
|
(0.77)
|
993
|
(0.65)
|
3
|
2,138
|
|
Hepatitis B perinatal infection
|
20
|
(0.01)
|
28
|
(0.02)
|
—
|
48
|
|
Human immunodeficiency virus (HIV)
|
|
|
|
|
|
|
|
diagnoses††
|
27,992
|
(18.00)
|
6,977
|
(4.30)
|
—
|
34,969
|
|
Influenza-associated pediatric mortality§§
|
82
|
(0.22)
|
78
|
(0.22)
|
—
|
160
|
|
Invasive pneumococcal disease
|
|
|
|
|
|
|
|
all ages
|
8,537
|
(8.39)
|
8,044
|
(7.64)
|
612
|
17,193
|
|
age <5 yrs
|
636
|
(8.30)
|
433
|
(5.90)
|
102
|
1,171
|
|
Legionellosis
|
3,153
|
(2.04)
|
1,794
|
(1.13)
|
7
|
4,954
|
|
Listeriosis
|
362
|
(0.23)
|
371
|
(0.23)
|
2
|
735
|
|
Disease
|
Male
|
Female
|
Sex not
stated
|
Total
|
|
No.
|
Rate
|
No.
|
Rate
|
|
Lyme disease, total
|
20,731
|
(13.48)
|
15,067
|
(9.49)
|
509
|
36,307
|
|
confirmed
|
15,642
|
(10.17)
|
11,205
|
(7.06)
|
356
|
27,203
|
|
probable
|
5,112
|
(3.32)
|
3,874
|
(2.44)
|
118
|
9,104
|
|
Malaria
|
989
|
(0.64)
|
596
|
(0.37)
|
9
|
1,594
|
|
Measles, total
|
97
|
(0.06)
|
89
|
(0.06)
|
1
|
187
|
|
indigenous
|
69
|
(0.04)
|
65
|
(0.04)
|
1
|
135
|
|
imported
|
28
|
(0.02)
|
24
|
(0.02)
|
—
|
52
|
|
Meningococcal disease
|
|
|
|
|
|
|
|
all serogroups
|
291
|
(0.19)
|
265
|
(0.17)
|
—
|
556
|
|
serogroup ACWY
|
74
|
(0.05)
|
68
|
(0.04)
|
—
|
142
|
|
serogroup B
|
51
|
(0.03)
|
48
|
(0.03)
|
—
|
99
|
|
serogroup other
|
10
|
(0.01)
|
7
|
(0.00)
|
—
|
17
|
|
serogroup unknown
|
156
|
(0.10)
|
142
|
(0.09)
|
—
|
298
|
|
Mumps
|
294
|
(0.19)
|
288
|
(0.18)
|
2
|
584
|
|
Novel influenza A virus infection
|
7
|
(0.00)
|
4
|
(0.00)
|
10
|
21
|
|
Pertussis
|
13,115
|
(8.49)
|
15,417
|
(9.67)
|
107
|
28,639
|
|
Plague
|
3
|
(0.00)
|
1
|
(0.00)
|
—
|
4
|
|
Poliomyelitis, paralytic
|
1
|
(0.00)
|
|
(0.00)
|
—
|
1
|
|
Psittacosis
|
3
|
(0.00)
|
3
|
(0.00)
|
—
|
6
|
|
Q fever, total
|
118
|
(0.08)
|
35
|
(0.02)
|
17
|
170
|
|
acute
|
92
|
(0.06)
|
29
|
(0.02)
|
16
|
137
|
|
chronic
|
26
|
(0.02)
|
6
|
(0.00)
|
1
|
33
|
|
Rabies, human
|
2
|
(0.00)
|
|
(0.00)
|
—
|
2
|
|
Rubella
|
7
|
(0.00)
|
2
|
(0.00)
|
—
|
9
|
|
Rubella, congenital syndrome
|
1
|
(0.00)
|
|
(0.00)
|
—
|
1
|
|
Salmonellosis
|
23,926
|
(15.49)
|
26,466
|
(16.60)
|
242
|
50,634
|
|
Shiga toxin-producing Escherichia coli (STEC)
|
2,989
|
(1.94)
|
3,646
|
(2.29)
|
28
|
6,663
|
|
Shigellosis
|
6,403
|
(4.14)
|
6,266
|
(3.93)
|
60
|
12,729
|
|
Spotted Fever Rickettsiosis, total
|
2,208
|
(1.44)
|
1,142
|
(0.72)
|
9
|
3,359
|
|
confirmed
|
98
|
(0.06)
|
74
|
(0.05)
|
2
|
174
|
|
probable
|
2,108
|
(1.37)
|
1,066
|
(0.67)
|
7
|
3,181
|
|
Streptococcal toxic-shock syndrome
|
113
|
(0.11)
|
111
|
(0.10)
|
—
|
224
|
|
Syphilis, total all stages**,¶¶
|
45,926
|
(29.73)
|
10,271
|
(6.44)
|
274
|
56,471
|
|
congenital**
|
60
|
(2.98)
|
72
|
(3.74)
|
216
|
348
|
|
primary and secondary**
|
15,861
|
(10.27)
|
1,500
|
(0.94)
|
14
|
17,375
|
|
Tetanus
|
12
|
(0.01)
|
14
|
(0.01)
|
—
|
26
|
|
Toxic-shock syndrome (other than streptococcal)
|
25
|
(0.02)
|
46
|
(0.04)
|
—
|
71
|
|
Trichinellosis
|
11
|
(0.01)
|
11
|
(0.01)
|
—
|
22
|
|
Tuberculosis***
|
5,816
|
(3.76)
|
3,760
|
(2.36)
|
6
|
9,582
|
|
Tularemia
|
132
|
(0.09)
|
69
|
(0.04)
|
2
|
203
|
|
Typhoid fever
|
166
|
(0.11)
|
172
|
(0.11)
|
—
|
338
|
|
Vancomycin-intermediate Staphylococcus aureus (VISA)
|
134
|
(0.11)
|
109
|
(0.09)
|
5
|
248
|
|
Vibriosis
|
822
|
(0.55)
|
374
|
(0.24)
|
103
|
1,299
|
|
|
|
Disease
|
American Indian or Alaska Native
|
Asian or Pacific Islander
|
Black
|
White
|
Other
|
Race not stated
|
Total
|
|
No.
|
Rate
|
No.
|
Rate
|
No.
|
Rate
|
No.
|
Rate
|
|
Arboviral diseases§
|
|
|
|
|
|
|
|
|
|
|
|
|
California serogroup viruses
|
|
|
|
|
|
|
|
|
|
|
|
|
neuroinvasive
|
0
|
(0.00)
|
0
|
(0.00)
|
3
|
(0.01)
|
79
|
(0.03)
|
0
|
13
|
95
|
|
West Nile Virus
|
|
|
|
|
|
|
|
|
|
|
|
|
neuroinvasive
|
23
|
(0.52)
|
12
|
(0.07)
|
69
|
(0.16)
|
889
|
(0.36)
|
28
|
246
|
1,267
|
|
nonneuroinvasive
|
16
|
(0.36)
|
5
|
(0.03)
|
15
|
(0.03)
|
859
|
(0.35)
|
19
|
288
|
1,202
|
|
Babesiosis, total¶
|
7
|
(0.29)
|
44
|
(0.34)
|
32
|
(0.14)
|
1,076
|
(0.74)
|
25
|
612
|
1,796
|
|
confirmed
|
4
|
(0.14)
|
41
|
(0.31)
|
28
|
(0.11)
|
892
|
(0.59)
|
24
|
493
|
1,482
|
|
probable
|
3
|
(0.11)
|
3
|
(0.02)
|
4
|
(0.02)
|
184
|
(0.12)
|
1
|
119
|
314
|
|
Botulism, total
|
1
|
(0.02)
|
8
|
(0.04)
|
11
|
(0.03)
|
97
|
(0.04)
|
1
|
34
|
152
|
|
infant
|
—
|
(—)
|
8
|
(3.40)
|
10
|
(1.47)
|
86
|
(2.92)
|
1
|
31
|
136
|
|
Brucellosis
|
2
|
(0.05)
|
4
|
(0.02)
|
5
|
(0.01)
|
59
|
(0.02)
|
10
|
19
|
99
|
|
Chlamydia trachomatis infection**
|
18,477
|
(420.33)
|
21,137
|
(116.70)
|
436,817
|
(1,011.2)
|
467,915
|
(188.55)
|
55,808
|
401,752
|
1,401,906
|
|
Coccidioidomycosis¶
|
82
|
(3.61)
|
157
|
(1.78)
|
245
|
(1.91)
|
2,401
|
(2.48)
|
238
|
6,315
|
9,438
|
|
Cryptosporidiosis, total
|
40
|
(0.91)
|
90
|
(0.50)
|
668
|
(1.55)
|
5,797
|
(2.34)
|
230
|
2,231
|
9,056
|
|
confirmed
|
21
|
(0.48)
|
62
|
(0.34)
|
477
|
(1.10)
|
3,630
|
(1.46)
|
145
|
1,363
|
5,698
|
|
probable
|
19
|
(0.43)
|
28
|
(0.15)
|
191
|
(0.44)
|
2,167
|
(0.87)
|
85
|
868
|
3,358
|
|
Cyclosporiasis
|
0
|
(0.00)
|
12
|
(0.07)
|
21
|
(0.06)
|
527
|
(0.24)
|
4
|
220
|
784
|
|
Dengue fever
|
2
|
(0.05)
|
88
|
(0.49)
|
43
|
(0.10)
|
447
|
(0.18)
|
40
|
217
|
837
|
|
Ehrlichiosis/Anaplasmosis
|
|
|
|
|
|
|
|
|
|
|
|
|
Anaplasma phagocytophilum
|
28
|
(0.72)
|
7
|
(0.04)
|
14
|
(0.03)
|
1,678
|
(0.71)
|
44
|
1,011
|
2,782
|
|
Ehrlichia chaffeensis
|
30
|
(0.77)
|
4
|
(0.02)
|
25
|
(0.06)
|
995
|
(0.42)
|
21
|
443
|
1,518
|
|
Ehrlichia ewingii
|
0
|
(0.00)
|
0
|
(0.00)
|
0
|
(0.00)
|
21
|
(0.01)
|
2
|
8
|
31
|
|
Undetermined
|
2
|
(0.05)
|
0
|
(0.00)
|
4
|
(0.01)
|
156
|
(0.07)
|
9
|
49
|
220
|
|
Giardiasis
|
52
|
(1.49)
|
650
|
(3.98)
|
1,086
|
(3.13)
|
6,869
|
(3.34)
|
537
|
5,912
|
15,106
|
|
Gonorrhea**
|
3,798
|
(86.40)
|
3,313
|
(18.29)
|
158,297
|
(366.44)
|
88,122
|
(35.51)
|
10,308
|
69,166
|
333,004
|
|
Haemophilus influenzae, invasive disease
|
|
|
|
|
|
|
|
|
|
|
|
|
all ages, all serotypes
|
50
|
(1.14)
|
61
|
(0.34)
|
448
|
(1.04)
|
2,307
|
(0.93)
|
119
|
807
|
3,792
|
|
age <5 years
|
|
|
|
|
|
|
|
|
|
|
|
|
serotype b
|
4
|
(1.03)
|
—
|
(—)
|
2
|
(0.06)
|
20
|
(0.13)
|
1
|
4
|
31
|
|
nonserotype b
|
17
|
(4.37)
|
3
|
(0.25)
|
31
|
(0.91)
|
118
|
(0.79)
|
9
|
44
|
222
|
|
unknown serotype
|
2
|
(0.51)
|
8
|
(0.67)
|
35
|
(1.03)
|
82
|
(0.55)
|
18
|
40
|
185
|
|
Hansen disease
|
0
|
(0.00)
|
21
|
(0.13)
|
5
|
(0.01)
|
29
|
(0.01)
|
2
|
24
|
81
|
|
Hemolytic uremic syndrome postdiarrheal
|
1
|
(0.02)
|
8
|
(0.04)
|
6
|
(0.01)
|
257
|
(0.11)
|
14
|
43
|
329
|
|
Hepatitis virus, acute
|
|
|
|
|
|
|
|
|
|
|
|
|
A
|
7
|
(0.16)
|
103
|
(0.57)
|
77
|
(0.18)
|
1,163
|
(0.47)
|
68
|
363
|
1,781
|
|
B
|
18
|
(0.41)
|
58
|
(0.32)
|
388
|
(0.90)
|
1,967
|
(0.80)
|
80
|
539
|
3,050
|
|
C
|
39
|
(0.98)
|
14
|
(0.08)
|
78
|
(0.19)
|
1,595
|
(0.67)
|
46
|
366
|
2,138
|
|
Hepatitis B perinatal infection
|
0
|
(0.00)
|
24
|
(0.13)
|
5
|
(0.01)
|
5
|
(0.00)
|
3
|
11
|
48
|
|
Human immunodeficiency virus (HIV)
|
|
|
|
|
|
|
|
|
|
|
|
|
diagnoses††
|
175
|
(7.50)
|
740
|
(4.60)
|
15,966
|
(40.90)
|
10,196
|
(5.20)
|
7,892
|
—
|
34,969
|
|
Influenza-associated pediatric mortality§§
|
6
|
(0.44)
|
8
|
(0.19)
|
24
|
(0.20)
|
107
|
(0.19)
|
3
|
12
|
160
|
|
Invasive pneumococcal disease
|
|
|
|
|
|
|
|
|
|
|
|
|
all ages
|
214
|
(8.32)
|
163
|
(1.75)
|
2,557
|
(8.14)
|
9,842
|
(6.01)
|
378
|
4,039
|
17,193
|
|
age <5 years
|
19
|
(7.00)
|
30
|
(4.03)
|
227
|
(8.01)
|
537
|
(4.82)
|
33
|
325
|
1,171
|
|
Legionellosis
|
11
|
(0.25)
|
56
|
(0.31)
|
853
|
(1.97)
|
3,114
|
(1.25)
|
107
|
813
|
4,954
|
|
Listeriosis
|
1
|
(0.02)
|
53
|
(0.29)
|
73
|
(0.17)
|
496
|
(0.20)
|
19
|
93
|
735
|
|
Lyme disease, total
|
144
|
(3.28)
|
366
|
(2.13)
|
315
|
(0.73)
|
22,277
|
(8.99)
|
995
|
12,210
|
36,307
|
|
Confirmed
|
103
|
(2.35)
|
266
|
(1.55)
|
216
|
(0.50)
|
16,860
|
(6.81)
|
827
|
8,931
|
27,203
|
|
Probable
|
41
|
(0.93)
|
100
|
(0.58)
|
99
|
(0.23)
|
5,417
|
(2.19)
|
168
|
3,279
|
9,104
|
|
Disease
|
American Indian or Alaska Native
|
Asian or Pacific Islander
|
Black
|
White
|
Other
|
Race not stated
|
Total
|
|
No.
|
Rate
|
No.
|
Rate
|
No.
|
Rate
|
No.
|
Rate
|
|
Malaria
|
3
|
(0.07)
|
126
|
(0.70)
|
765
|
(1.77)
|
206
|
(0.08)
|
67
|
427
|
1,594
|
|
Measles, total
|
0
|
(0.00)
|
19
|
(0.10)
|
3
|
(0.01)
|
115
|
(0.05)
|
3
|
47
|
187
|
|
indigenous
|
0
|
(0.00)
|
6
|
(0.03)
|
0
|
(0.00)
|
90
|
(0.04)
|
3
|
36
|
135
|
|
imported
|
0
|
(0.00)
|
13
|
(0.07)
|
3
|
(0.01)
|
25
|
(0.01)
|
0
|
11
|
52
|
|
Meningococcal disease
|
|
|
|
|
|
|
|
|
|
|
|
|
All serogroups
|
5
|
(0.11)
|
7
|
(0.04)
|
66
|
(0.15)
|
372
|
(0.15)
|
22
|
84
|
556
|
|
serogroup ACWY
|
4
|
(0.09)
|
4
|
(0.02)
|
16
|
(0.04)
|
95
|
(0.04)
|
4
|
19
|
142
|
|
serogroup B
|
1
|
(0.02)
|
1
|
(0.01)
|
3
|
(0.01)
|
80
|
(0.03)
|
1
|
13
|
99
|
|
serogroup unknown
|
0
|
(0.00)
|
2
|
(0.01)
|
42
|
(0.10)
|
186
|
(0.07)
|
17
|
51
|
298
|
|
Mumps
|
0
|
(0.00)
|
24
|
(0.13)
|
17
|
(0.04)
|
309
|
(0.12)
|
13
|
221
|
584
|
|
Pertussis
|
283
|
(6.44)
|
398
|
(2.20)
|
1,368
|
(3.17)
|
20,559
|
(8.28)
|
799
|
5,232
|
28,639
|
|
Q fever, total
|
1
|
(0.02)
|
6
|
(0.03)
|
4
|
(0.01)
|
92
|
(0.04)
|
4
|
63
|
170
|
|
acute
|
0
|
(0.00)
|
6
|
(0.03)
|
2
|
(0.00)
|
72
|
(0.03)
|
4
|
53
|
137
|
|
chronic
|
1
|
(0.02)
|
0
|
(0.00)
|
2
|
(0.00)
|
20
|
(0.01)
|
0
|
10
|
33
|
|
Salmonellosis
|
353
|
(8.03)
|
1,799
|
(9.93)
|
4,334
|
(10.03)
|
30,235
|
(12.18)
|
1,778
|
12,135
|
50,634
|
|
Shiga toxin-producing Escherichia coli (STEC)
|
28
|
(0.66)
|
154
|
(0.85)
|
244
|
(0.57)
|
4,618
|
(1.86)
|
195
|
1,424
|
6,663
|
|
Shigellosis
|
360
|
(8.19)
|
203
|
(1.12)
|
2,591
|
(6.00)
|
5,802
|
(2.34)
|
603
|
3,170
|
12,729
|
|
Spotted fever rickettsiosis, total
|
75
|
(1.76)
|
18
|
(0.10)
|
85
|
(0.20)
|
2,277
|
(0.92)
|
57
|
847
|
3,359
|
|
confirmed
|
10
|
(0.23)
|
1
|
(0.01)
|
3
|
(0.01)
|
122
|
(0.05)
|
4
|
34
|
174
|
|
probable
|
65
|
(1.48)
|
17
|
(0.10)
|
82
|
(0.19)
|
2,152
|
(0.87)
|
53
|
812
|
3,181
|
|
Streptococcal toxic-shock syndrome
|
1
|
(0.04)
|
6
|
(0.06)
|
18
|
(0.06)
|
170
|
(0.10)
|
3
|
26
|
224
|
|
Syphilis, total all stages**,¶¶
|
297
|
(6.76)
|
1,398
|
(7.72)
|
22,779
|
(52.73)
|
24,627
|
(9.92)
|
3,424
|
3,946
|
56,471
|
|
congenital**
|
2
|
(2.56)
|
4
|
(1.70)
|
160
|
(23.55)
|
101
|
(3.43)
|
11
|
70
|
348
|
|
primary and secondary**
|
116
|
(2.64)
|
450
|
(2.48)
|
6,646
|
(15.38)
|
8,381
|
(3.38)
|
853
|
929
|
17,375
|
|
Tetanus
|
1
|
(0.02)
|
1
|
(0.01)
|
1
|
(0.00)
|
17
|
(0.01)
|
0
|
6
|
26
|
|
Toxic-shock syndrome (other than streptococcal)
|
0
|
(0.00)
|
3
|
(0.02)
|
3
|
(0.01)
|
49
|
(0.03)
|
4
|
12
|
71
|
|
Tuberculosis***
|
143
|
(3.25)
|
3,017
|
(16.66)
|
2,146
|
(4.97)
|
4,016
|
(1.62)
|
216
|
44
|
9,582
|
|
Tularemia
|
12
|
(0.27)
|
1
|
(0.01)
|
2
|
(0.00)
|
143
|
(0.06)
|
1
|
44
|
203
|
|
Typhoid fever
|
3
|
(0.07)
|
179
|
(0.99)
|
28
|
(0.06)
|
56
|
(0.02)
|
15
|
57
|
338
|
|
Vancomycin-intermediate Staphylococcus aureus (VISA)
|
1
|
(0.03)
|
1
|
(0.01)
|
49
|
(0.13)
|
134
|
(0.07)
|
2
|
61
|
248
|
|
Vibriosis
|
2
|
(0.05)
|
43
|
(0.24)
|
83
|
(0.19)
|
814
|
(0.34)
|
20
|
337
|
1,299
|
|
Disease
|
Hispanic
|
Non-Hispanic
|
Ethnicity
not stated
|
Total
|
|
No.
|
Rate
|
No.
|
Rate
|
|
Arboviral diseases§
|
|
|
|
|
|
|
|
California serogorup viruses
|
|
|
|
|
|
|
|
neuroinvasive
|
1
|
(0.00)
|
75
|
(0.03)
|
19
|
95
|
|
West Nile virus
|
|
|
|
|
|
|
|
neuroinvasive
|
133
|
(0.25)
|
780
|
(0.30)
|
354
|
1,267
|
|
nonneuroinvasive
|
51
|
(0.10)
|
778
|
(0.30)
|
373
|
1,202
|
|
Babesiosis, total¶
|
96
|
(0.27)
|
831
|
(0.57)
|
869
|
1,796
|
|
confirmed
|
84
|
(0.23)
|
676
|
(0.43)
|
722
|
1,482
|
|
probable
|
12
|
(0.03)
|
155
|
(0.10)
|
147
|
314
|
|
Botulism, total
|
25
|
(0.05)
|
94
|
(0.04)
|
33
|
152
|
|
infant
|
20
|
(1.97)
|
84
|
(2.87)
|
32
|
136
|
|
Brucellosis
|
45
|
(0.08)
|
42
|
(0.02)
|
12
|
99
|
|
Chlamydia trachomatis infection**
|
197,808
|
(373.44)
|
687,629
|
(263.56)
|
516,469
|
1,401,906
|
|
Coccidioidomycosis¶
|
1,151
|
(5.05)
|
2,079
|
(2.12)
|
6,208
|
9,438
|
|
Cryptosporidiosis, total
|
556
|
(1.05)
|
5,495
|
(2.11)
|
3,005
|
9,056
|
|
confirmed
|
383
|
(0.72)
|
3,387
|
(1.30)
|
1,928
|
5,698
|
|
probable
|
173
|
(0.33)
|
2,108
|
(0.81)
|
1,077
|
3,358
|
|
Cyclosporiasis
|
61
|
(0.12)
|
498
|
(0.22)
|
225
|
784
|
|
Dengue Virus Infection
|
|
|
|
|
|
|
|
Dengue fever
|
300
|
(0.57)
|
357
|
(0.14)
|
180
|
837
|
|
Ehrlichiosis/Anaplasmosis
|
|
|
|
|
|
|
|
Anaplasma phagocytophilum
|
25
|
(0.05)
|
1,668
|
(0.67)
|
1,089
|
2,782
|
|
Ehrlichia chaffeensis
|
27
|
(0.05)
|
1,048
|
(0.42)
|
443
|
1,518
|
|
Ehrlichia ewingii
|
1
|
(0.00)
|
26
|
(0.01)
|
4
|
31
|
|
Undetermined
|
1
|
(0.00)
|
160
|
(0.06)
|
59
|
220
|
|
Giardiasis
|
1,061
|
(2.57)
|
7,260
|
(3.31)
|
6,785
|
15,106
|
|
Gonorrhea**
|
34,655
|
( 65.43)
|
194,857
|
( 74.68)
|
103,492
|
333,004
|
|
Haemophilus influenzae, invasive disease
|
|
|
|
|
|
|
|
all ages, all serotypes
|
207
|
(0.39)
|
2,144
|
(0.82)
|
1,441
|
3,792
|
|
age <5 years
|
|
|
|
|
|
|
|
serotype b
|
1
|
(0.02)
|
21
|
(0.14)
|
9
|
31
|
|
nonserotype b
|
26
|
(0.51)
|
126
|
(0.85)
|
70
|
222
|
|
unknown serotype
|
29
|
(0.57)
|
93
|
(0.63)
|
63
|
185
|
|
Hansen disease (leprosy)
|
14
|
(0.03)
|
48
|
(0.02)
|
19
|
81
|
|
Hemolytic uremic syndrome postdiarrheal
|
33
|
(0.06)
|
239
|
(0.09)
|
57
|
329
|
|
Hepatitis virus, acute
|
|
|
|
|
|
|
|
A
|
278
|
(0.52)
|
1,076
|
(0.41)
|
427
|
1,781
|
|
B
|
205
|
(0.39)
|
1,974
|
(0.76)
|
871
|
3,050
|
|
C
|
114
|
(0.23)
|
1,335
|
(0.53)
|
689
|
2,138
|
|
Hepatitis B perinatal infection
|
0
|
(0.00)
|
34
|
(0.01)
|
14
|
48
|
|
Human immunodeficiency virus (HIV) diagnoses§§
|
7,211
|
(13.30)
|
27,758
|
(10.60)
|
-
|
34,969
|
|
Influenza-associated pediatric mortality**
|
35
|
(0.20)
|
101
|
(0.18)
|
24
|
160
|
|
Invasive pneumococcal disease
|
|
|
|
|
|
|
|
all ages
|
1,139
|
(3.58)
|
9,098
|
(5.19)
|
6,956
|
17,193
|
|
age <5 years
|
134
|
(3.96)
|
585
|
(5.04)
|
452
|
1,171
|
|
Legionellosis
|
247
|
(0.47)
|
3,427
|
(1.31)
|
1,280
|
4,954
|
|
Listeriosis
|
83
|
(0.16)
|
481
|
(0.18)
|
171
|
735
|
|
Lyme disease, total
|
618
|
(1.17)
|
16,192
|
(6.24)
|
19,497
|
36,307
|
|
Confirmed
|
455
|
(0.86)
|
12,166
|
(4.69)
|
14,582
|
27,203
|
|
Probable
|
163
|
(0.31)
|
4,026
|
(1.55)
|
4,915
|
9,104
|
|
Disease
|
Hispanic
|
Non-Hispanic
|
Ethnicity
not stated
|
Total
|
|
No.
|
Rate
|
No.
|
Rate
|
|
Malaria
|
25
|
(0.05)
|
1,146
|
(0.44)
|
423
|
1,594
|
|
Measles, total
|
5
|
(0.01)
|
143
|
(0.05)
|
39
|
187
|
|
indigenous
|
5
|
(0.01)
|
103
|
(0.04)
|
27
|
135
|
|
imported
|
0
|
(0.00)
|
40
|
(0.02)
|
12
|
52
|
|
Meningococcal disease
|
|
|
|
|
|
|
|
All serogroups
|
93
|
(0.18)
|
346
|
(0.13)
|
117
|
556
|
|
serogroup ACWY
|
17
|
(0.03)
|
94
|
(0.04)
|
31
|
142
|
|
serogroup B
|
11
|
(0.02)
|
68
|
(0.03)
|
20
|
99
|
|
serogroup unknown
|
65
|
(0.12)
|
168
|
(0.06)
|
65
|
298
|
|
Mumps
|
41
|
(0.08)
|
307
|
(0.12)
|
236
|
584
|
|
Pertussis
|
4,718
|
(8.91)
|
17,691
|
(6.78)
|
6,230
|
28,639
|
|
Q fever, total
|
20
|
(0.04)
|
89
|
(0.03)
|
61
|
170
|
|
acute
|
19
|
(0.04)
|
66
|
(0.03)
|
52
|
137
|
|
chronic
|
1
|
(0.00)
|
23
|
(0.01)
|
9
|
33
|
|
Salmonellosis
|
6,766
|
(12.77)
|
28,862
|
(11.06)
|
15,006
|
50,634
|
|
Shiga toxin-producing Escherichia coli (STEC)
|
858
|
(1.62)
|
4,089
|
(1.57)
|
1,716
|
6,663
|
|
Shigellosis
|
2,853
|
(5.39)
|
6,343
|
(2.43)
|
3,533
|
12,729
|
|
Spotted fever rickettsiosis, total
|
102
|
(0.19)
|
2,199
|
(0.85)
|
1,058
|
3,359
|
|
confirmed
|
5
|
(0.01)
|
121
|
(0.05)
|
48
|
174
|
|
probable
|
96
|
(0.18)
|
2,076
|
(0.80)
|
1,009
|
3,181
|
|
Streptococcal toxic-shock syndrome
|
13
|
(0.06)
|
143
|
(0.08)
|
68
|
224
|
|
Syphilis, total, all stages**,¶¶
|
13,225
|
(24.97)
|
39,094
|
(14.98)
|
4,152
|
56,471
|
|
congenital**
|
92
|
(9.06)
|
247
|
(8.44)
|
9
|
348
|
|
primary and secondary**
|
3,459
|
(6.53)
|
12,905
|
(4.95)
|
1,011
|
17,375
|
|
Tetanus
|
1
|
(0.00)
|
20
|
(0.01)
|
5
|
26
|
|
Toxic-shock syndrome (other than streptococcal)
|
4
|
(0.01)
|
39
|
(0.02)
|
28
|
71
|
|
Tuberculosis***
|
2,699
|
(5.10)
|
6,872
|
(2.63)
|
11
|
9,582
|
|
Tularemia
|
7
|
(0.01)
|
157
|
(0.06)
|
39
|
203
|
|
Typhoid fever
|
39
|
(0.07)
|
241
|
(0.09)
|
58
|
338
|
|
Vancomycin-intermediate Staphylococcus aureus (VISA)
|
11
|
(0.03)
|
178
|
(0.08)
|
59
|
248
|
|
Vibriosis
|
100
|
(0.19)
|
789
|
(0.31)
|
410
|
1,299
|
PART 2
Graphs and Maps for Selected Notifiable Diseases in the United States, 2013
Abbreviations and Symbols Used in Graphs and Maps
U Data not available.
N Not reportable (i.e., report of disease not required in that jurisdiction).
DC District of Columbia
NYC New York City
AS American Samoa
CNMI Commonwealth of Northern Mariana Islands
GU Guam
PR Puerto Rico
VI U.S. Virgin Islands
Anthrax. Number* of reported cases, by year — United States, 1958–2013
Updated prevention and treatment guidelines for adults and for pregnant and postpartum women, which might be used for patient management following naturally occurring or bioterrorism-related cases, were published in the February 2014 Emerging Infectious Diseases Journal.
Alternate Text: This figure is a line graph that presents the number of anthrax cases by year in the United States from 1958 to 2013.
ARBOVIRAL DISEASES. Number* of reported cases of neuroinvasive disease, by year — United States, 2004–2013
Alternate Text: This figure is a line graph that presents the number of cases of neuroinvasive disease, broken down by California serogroup viruses, Eastern equine encephalitis virus, and St. Louis encephalitis virus, from 2004 to 2013.
ARBOVIRAL DISEASES, WEST NILE VIRUS. Incidence* of reported cases of neuroinvasive disease — United States and U.S. territories, 2013
In 2013, eight states reported an incidence of West Nile virus (WNV) neuroinvasive disease >1 case per 100,000; the four states with the highest reported incidence were North Dakota (8.9), South Dakota (6.8), Nebraska (2.9), and Wyoming (2.8). Six states reported approximately half of the WNV neuroinvasive disease cases: California (237 cases), Texas (113), Colorado (90), Illinois (86), North Dakota (64), and Oklahoma (60).
Alternate Text: This figure is a map that presents the incidence of reported cases per 100,000 population of neuroinvasive disease in each state 2013.
ARBOVIRAL DISEASES, WEST NILE VIRUS. Incidence* of reported cases of neuroinvasive disease, by year — United States, 2004–2013
In 2013, the incidence declined substantially compared with 2012, when a large multistate outbreak of WNV occurred. The incidence in 2013 was similar to that during 2004–2007 and was higher than that during 2008–2011.
Alternate Text: This figure is a bar graph that presents the incidence per 100,000 population of reported cases of neuroinvasive disease during 2013.
ARBOVIRAL DISEASES, WEST NILE VIRUS. Incidence* of reported cases of neuroinvasive disease, by age group — United States, 2013
In 2013, the median age of patients with West Nile virus neuroinvasive disease was 59 years (range: 11 months–97 years), with increasing incidence among older age groups.
Alternate Text: This figure is a map that presents the number of reported cases in each state in 2013.
BABESIOSIS. Number of reported cases, by county — United States, 2013
Babesiosis, a tickborne parasitic infection, became nationally notifiable in 2011. In 2013, babesiosis became reportable in four additional states (Louisiana, South Carolina, South Dakota, and Texas). Approximately 95% of cases were reported from the Northeast and upper Midwest.
Alternate Text: This figure is a bar chart that presents the incidence of cases of neuroinvasive disease by age group from age 0 to ≥70 years in 2013.
BOTULISM, FOODBORNE. Number of reported cases, by year — United States, 1993–2013
The number of foodborne botulism cases, caused by ingestion of preformed toxin, is at its lowest level in 20 years.
Alternate Text: This figure is a line graph that presents the number of botulism cases in U.S. infants from 1993 to 2013.
BOTULISM, INFANT. Number of reported cases, by year — United States, 1993–2013
Infant botulism remains the most common transmission category of botulism in the United States and accounted for most botulism cases in 2013. Reported cases have been increasing over the past 3 years.
Alternate Text: This figure is a line graph that presents the number of foodborne-related botulism cases in the United States from 1993 to 2013.
BOTULISM, OTHER. Number* of reported cases, by year — United States, 2003–2013
Annual numbers of cases of wound botulism and of botulism in "unspecified" transmission categories have remained generally stable during the past decade but reached a 10-year low in 2013.
Alternate Text: This figure is a line graph that presents the number of wound-related and unspecified botulism cases in the United States from 2003 to 2013.
Brucellosis. Number of reported cases, by year — United States, 1983–2013
After a sharp increase in reported cases from 2011 to 2012, the number of reported cases declined in 2013.
Alternate Text: This figure is a line graph that presents the number of brucellosis cases in the United States from 1983 to 2013.
Brucellosis. Number of reported cases — United States and U.S. territories, 2013
The total number of cases declined, but in Georgia, Oklahoma, and Wisconsin, the number of cases increased.
Alternate Text: This figure is a map of the United States and U.S. territories that presents the number of brucellosis cases in each state and territory in 2013.
Chlamydia. Incidence* of reported cases among women — United States and U.S. Territories, 2013
In 2013, rates of reported cases of chlamydia by state ranged from 236.2 cases per 100,000 population in New Hampshire to 789.4 cases in Alaska; the rate in the District of Columbia was 1,104.4.
Alternate Text: This figure is a map of the United States and U.S. territories that presents the incidence per 100,000 population of chlamydia among women in 2013.
Cholera. Number of reported cases — United States and U.S. territories, 2013
Of the 14 cholera infections reported in 2013, the majority of cases were reported by states on the East coast. Thirteen of the reported cases were travel-associated. Nine patients traveled to Hispaniola (eight to Haiti and one to the Dominican Republic) and four traveled to other cholera-affected countries (including two to Cuba).
Alternate Text: This figure is a map of the United States and U.S. territories that presents the number of cholera cases in each state and territory in 2013.
COCCIDIOIDOMYCOSIS. Number of reported cases — United States and U.S. territories, 2013
In the United States, coccidioidomycosis is endemic in the Southwestern states. The fungus that causes coccidioidomycosis also was recently found in south-central Washington State. Cases reported from states outside the endemic area usually occur among travelers returning from areas in which the disease is endemic.
Alternate Text: This figure is a map of the United States and U.S. territories that presents the number of reported cases in each state and territory in 2013.
Cryptosporidiosis. Incidence* of reported cases, by year — United States, 2002–2013
The incidence of reported cryptosporidiosis remains historically elevated relative to the baseline observed before 2005. Whether this increase reflects a change in the true incidence of cryptosporidiosis or changing diagnosis, testing, or reporting patterns is unclear.
Alternate Text: This figure is a bar chart that presents the incidence per 100,000 population of cryptosporidiosis cases in the United States from 2002 to 2013.
Cryptosporidiosis. Incidence* of reported cases — United States and U.S. territories, 2013
Cryptosporidiosis is widespread geographically in the United States. Although incidence appears to be consistently higher in certain states, differences in reported incidence among states might reflect differences in risk factors; the number of cases associated with outbreaks; or the capacity to detect, investigate, and report cases. Incidence categories have been modified to reflect the recent increase in incidence.
Alternate Text: This figure is a map of the United States and U.S. territories that presents the incidence range per 100,000 population of cryptosporidiosis cases in each state and territory in 2013.
CYCLOSPORIASIS. Number of reported cases — United States and U.S. territories, 2013
In 2013, a total of 784 cyclosporiasis cases were reported from 26 states and New York City, representing the largest number of reported cases since 1997. Of the 784 cases, 631 (80%) were outbreak-associated cyclosporiasis cases from 25 states that occurred during June–August 2013.
Alternate Text: This figure is a map that provides the reported cases of Cyclosporiasis in the United States and in U.S. territories in 2013.
Dengue virus infection. Number* of reported cases, by age group — United States, 2013
Persons of all age groups (range: 0–9 years through >80 years) were affected by dengue in 2013, although most (83%) cases occurred in adults. Local dengue outbreaks were detected in 2013 in Texas (24 cases), Florida (24 cases), and New York (one case).
Alternate Text: This figure is a bar chart of the number of reported cases of dengue virus infection by age group in the United States in 2013.
Dengue fever and dengue hemorrhagic fever. Number* of reported cases, by location of residence — United States and U.S. territories, 2013
In 2013, a total of 17 jurisdictions reported more than 10 dengue cases.Among these jurisdictions, New York (both upstate New York and New York City), Florida, California, Texas, Illinois, and Pennsylvania reported the highest number of cases in 2013. The majority of cases were travel-associated, and the most common destinations of travel were Puerto Rico, the Dominican Republic, Mexico, India, and Haiti. An epidemic that began in Puerto Rico in late 2012 continued through much of 2013, resulting in more than 9,700 cases in 2013, making it the largest epidemic in Puerto Rico since 2010.
Alternate Text: This figure is a map of the United States that presents the number of cases of dengue fever and dengue hemorrhagic fever in the United States and its territories in 2013.
Diphtheria. Number of reported cases, by year — United States, 1983–2013
Alternate Text: This figure is a bar graph that presents the number of reported cases of diphtheria, by year, in the United States during 1983-2013.
EHRLICHIOSIS, ANAPLASMA PHAGOCYTOPHILUM. Number of reported cases, by county — United States, 2013
Cases are reported primarily from the Upper Midwest and coastal New England, reflecting both the range of the primary tick vector species, Ixodes scapularis, also known to transmit Lyme disease and babesiosis, and the range of preferred animal hosts for tick feeding.
Alternate Text: This figure is a map of the United States that presents the number of ehrlichiosis (anaplasma phagocytophilum) cases by county in 2013.
EHRLICHIOSIS, EHRLICHIA CHAFFEENSIS. Number of reported cases, by county — United States, 2013
Ehrlichia chaffeensis is the most common type of ehrlichiosis infection in the United States. This tickborne pathogen is transmitted by Amblyomma americanum, the lonestar tick, whose geographic range extends from the Southeast into parts of the Northeast and Midwest. The majority of cases of E. chaffeensis ehrlichiosis are reported from the Midwest, South, and Northeast regions.
Alternate Text: This figure is a map of the United States that presents the number of Ehrlichiosis (Ehrlichia chaffeensis) cases by county in 2013.
EHRLICHIOSIS, EHRLICHIA EWINGII. Number of reported cases, by county — United States, 2013
Ehrlichia ewingii is the least common cause of ehrlichiosis. Ehrlichia ewingii is carried by Amblyomma americanum, the lonestar tick, which is the same vector that transmits E. chaffeensis, and whose geographic range extends from the Southeast into parts of the Northeast and Midwest. No serologic tests are used to distinguish between the two species, and differentiation can only be made by molecular genotyping.
Alternate Text: This figure is a map of the United States that presents the number of Ehrlichiosis (Ehrlichia ewingii) cases in by county in 2013.
EHRLICHIOSIS, undetermined. Number of reported cases, by county — United States, 2013
Cases of ehrlichiosis and anaplasmosis, caused by an undetermined species, are reported across the United States but are more likely to be reported in the Midwest region and the Middle Atlantic division. This classification of "undetermined" is most often used in geographic areas where no clear geographic boundary separates the individual tick vectors. Because ehrlichiosis and anaplasmosis elicit some cross reactivity in antibody detection, this category can also be used when single, inappropriate diagnostic tests are performed that do not provide differentiation of etiology.
Alternate Text: This figure is a map of the United States that presents the number of Ehrlichiosis (undetermined) cases by county in 2013.
GIARDIASIS. Incidence* of reported cases — United States and U.S. territories, 2013
Giardiasis is widespread geographically in the United States, and the states with the highest rates are in the northern half of the country. These geographic differences might reflect differences in exposures and behaviors, although varying giardiasis case detection and reporting among states might also contribute.
Alternate Text: This figure is a map of the United States and U.S. territories that presents the incidence range per 100,000 population of giardiasis cases in each state and territory in 2013.
Gonorrhea. Incidence* of reported cases — United States and U.S. territories, 2013
In 2013, rates of reported gonorrhea cases per 100,000 population ranged by state from 9.2 in New Hampshire to 188.4 in Louisiana; the gonorrhea rate in the District of Columbia was 391.9.
Alternate Text: This figure is a map of the United States and U.S. territories that presents the incidence range per 100,000 population of gonorrhea cases in each state and territory in 2013.
Gonorrhea. Incidence* of reported cases by sex — United States, 1998–2013
Rates of gonorrhea are similar among men and women; however, in 2013, the gonorrhea rate among men was higher than the rate among women for the first time since 2000.
Alternate Text: This figure is a line graph that presents the incidence per 100,000 population of gonorrhea cases in the United States, with separate lines for men and women, from 1998 to 2013.
Gonorrhea. Incidence* of reported cases by race/ethnicity — United States, 1998–2013
The gonorrhea rate among non-Hispanic blacks is considerably higher than other races/ethnicities. In 2013, the rate among non-Hispanic blacks was approximately 12 times the rate among non-Hispanic whites.
Alternate Text: This figure is a line graph that presents the incidence per 100,000 population of gonorrhea cases in the United States by race/ethnicity, with separate lines for black non-Hispanic, white non-Hispanic, American Indian/Alaska Native non-Hispanic, Asian/Pacific Islander non-Hispanic, and Hispanic, from 1998 to 2013.
Haemophilus influenzae, Invasive Disease. Incidence* of reported cases, by serotype among persons aged <5 years — United States, 2000–2013
The epidemiology of invasive Haemophilus influenzae disease has changed in the United States in the post-Hib vaccine era. The epidemiology of invasive Haemophilus influenzae disease has changed in the United States in the post-Hib vaccine era (the vaccine for serotype B was introduced in 1985). Nontypeable Haemophilus influenzae now causes the majority of invasive disease in children <5 years of age. Hib disease incidence remains below the Healthy People 2020 goal of 0.27/100,000 population. Nontypeable Haemophilus influenzae now causes the majority of invasive disease in children aged <5 years. Hib disease incidence remains below the Healthy People 2020 goal of 0.27 per 100,000 population.
Alternate Text: This figure is a line graph that presents the incidence rates for all invasive Haemophilus influenzae (serotype b (Hib), non-b, and nontypeable) in the United States among persons aged ˂5 years, from 2000 to 2013.
Haemophilus influenzae, Invasive Disease. Incidence* of reported cases, by serotype among persons aged ≥5 years — United States, 2000–2013
The epidemiology of invasive Haemophilus influenzae disease has changed in the United States in the post-Hib vaccine era (the vaccine for serotype B was introduced in 1985). Nontypeable Haemophilus influenzae now causes the majority of invasive disease in children aged <5 years. Hib disease incidence remains below the Healthy People 2020 goal of 0.27 per 100,000 population.
Alternate Text: This figure is a line graph that presents the incidence of invasive Haemophilus influenzae (serotype b (Hib), non-b, and nontypeable) in the United States, with separate lines for persons aged ≥5 years, from 2000 to 2013.
Hansen Disease (leprosy). Number of reported cases, by year — United States, 1993–2013
Annual reported cases of Hansen's disease have remained fairly steady since 2011.
Alternate Text: This figure is a line graph that presents the number of Hansen disease cases, also known as leprosy, in the United States from 1993 to 2013.
Hemolytic Uremic Syndrome, Postdiarrheal. Number of reported cases — United States and U.S. territories, 2013
In 2013, 40 jurisdictions (states, districts, and territories) reported cases. Most cases of postdiarrheal hemolytic uremic syndrome (HUS) are caused by Shiga toxin-producing Escherichia coli (STEC).
Alternate Text: This figure is a map of the United States and U.S. territories that presents the number of hemolytic uremic, postdiarrheal cases in each state and territory in 2013.
Hepatitis, Viral. Incidence* of reported cases, by year — United States, 1983–2013
Hepatitis A incidence declined during 1998–2011 and increased in 2012 and 2013. The hepatitis A vaccine became available in 1995, the last year a peak in incidence of acute, symptomatic hepatitis A was observed. Coinciding with the implementation of the national vaccination strategy to eliminate hepatitis B infections, the incidence of acute hepatitis B has declined since 1987. Acute hepatitis B incidence has remained stable since 2008. The incidence of acute hepatitis C remained fairly stable during 1992–2000, declined in 2001 and 2002, remained stable during 2003–2005, and increased in 2011, 2012, and 2013. Recent investigations suggest this increase is largely driven by acute infections in nonurban young persons who start injecting drugs after habituation to oral prescription opioid drugs such as "OxyContin" and oxycodone.
Alternate Text: This figure is a line graph that presents the incidence per 100,000 population of viral hepatitis, with separate lines for hepatitis A, B, and C, in the United States from 1983 to 2013.
Hepatitis A. Incidence* of reported cases, by county — United States, 2013
Although effective vaccines to prevent Hepatitis A virus infections have been available in the United States since 1995, cases still occur in almost every state. In 2013, a total of 1,781 cases were reported and 17 counties in 13 states reported incidence rates of >10 cases per 100,000 population. Two of these counties in one state reported incidence rates of >20 cases.
Alternate Text: This figure is a map of the United States that presents the incidence range per 100,000 population of hepatitis A by county in 2013.
Hepatitis B Perinatal Infection. Number of reported cases — United States and U.S. territories, 2013
In 2013, a total of 16 states reported 48 cases of perinatal hepatitis B. Because of the asymptomatic nature of hepatitis B in young children, lack of timely testing among exposed infants, and incomplete reporting of infants with hepatitis B to public health surveillance programs, the reported number of cases of perinatal hepatitis B is considered low and represents only a proportion of all infants infected with hepatitis B virus at birth.
Alternate Text: This figure is a map of the United States in which the number of reported cases of Hepatitis B is provided in each state U.S. territory.
HUMAN IMMUNODEFICIENCY VIRUS DIAGNOSES. Percentage of diagnosed cases, by race/ethnicity — United States, 2013
Of persons diagnosed with HIV infection in 2013, the greatest percentage was among blacks/African Americans followed by whites, Hispanics/Latinos, Asians/Pacific Islanders, persons of multiple races, and American Indians/Alaska Natives.
Alternate Text: This figure is a pie chart that presents the percentage of diagnosed cases of HIV by race/ethnicity in the United States in 2013. The race/ethnicities included are black non-Hispanic, white non-Hispanic, Asian/Pacific Islanders non-Hispanic, American Indian/Alaska Native non-Hispanic, and Hispanic.
HUMAN IMMUNODEFICIENCY VIRUS DIAGNOSES. Diagnosis incidence* — United States and U.S. territories, 2013
The highest rates (i.e., ≥15 diagnoses per 100,000 population) of HIV diagnoses were in certain states in the Southeast and Northeast. A rate of ≥15 diagnoses per 100,000 population also was observed in the District of Columbia and the U.S. Virgin Islands.
Alternate Text: This figure is a map of the United States and U.S. territories that presents the rates per 100,000 population of diagnosed HIV cases in each state and territory in 2013.
INFLUENZA-ASSOCIATED PEDIATRIC MORTALITY. Incidence* of reported cases — United States and U.S. territories, 2013
In 2013, New York City and 37 states reported 160 influenza-associated pediatric deaths for an overall incidence rate in the United States of 0.22 deaths per 100,000 children aged <18 years.
Alternate Text: This figure is a map of the United States and U.S. territories that presents the incidence range per 100,000 population of influenza-associated pediatric deaths in each state and territory in 2013.
LEGIONELLOSIS. Incidence* of reported cases, by year — United States, 1998–2013
The incidence of legionellosis increased again in 2013, continuing a general increase that began in 2003. Decreases since 2003 do not result in a lower incidence beyond the immediate past year. Factors contributing to this increase might include increased diagnostic testing or an increase in disease transmission.
Alternate Text: This figure is a line graph that presents the incidence per 100,000 population of legionellosis cases in the United States from 1998 to 2013.
LISTERIOSIS. Incidence* of reported cases — United States and U.S. territories, 2013
In 2013, a total of 44 states, the District of Columbia, and New York City reported 735 cases of listeriosis for an overall incidence rate in the United States of 0.23 infections per 100,000, which is unchanged from 2012. Incidence rates were highest in the Northeastern states. To improve outbreak detection and better link cases to food sources, prospective, real-time whole genome sequencing of L. monocytogenes isolates began in September 2013.
Alternate Text: This figure is a map of the United States and U.S. territories that presents the incidence range per 100,000 population of listeriosis cases in each state and territory in 2013.
LYME DISEASE. Incidence* of reported confirmed cases, by county — United States, 2013
Approximately 95% of confirmed Lyme disease cases are reported from states in the Northeast, mid-Atlantic, and upper Midwest. A rash that can be confused with early Lyme disease sometimes occurs following bites of the lone star tick (Amblyomma americanum). These ticks, which do not transmit the Lyme disease bacterium, are common human-biting ticks in the southern and southeastern United States.
Alternate Text: This figure is a map of the United States that presents the incidence per 100,000 population of lyme disease cases in each county in 2013.
MALARIA. Number of reported cases — United States and U.S. territories, 2013
In 2013, cases of malaria were reported from almost every state, and nearly all cases reported in the United States were acquired overseas. Cases in eight states or areas (California, Maryland, Massachusetts, New Jersey, New York City, Pennsylvania, Texas, and Virginia) accounted for 53% of the reported cases because of large immigrant populations and international travelers.
Alternate Text: This figure is a map of the United States and U.S. territories that presents the number of malaria cases in the United States in 2013.
MEASLES. Incidence* of reported cases, by year — United States, 1978–2013
In 2000, the U.S. achieved measles elimination (defined as interruption of year-round endemic measles transmission). Measles elimination has been maintained in the United States for more than a decade through high population immunity secondary to high measles-mumps-rubella vaccination coverage.
Alternate Text: This figure is a line graph that presents the incidence per 100,000 population of measles cases in the United States from 1978 to 2013.
MENINGOCOCCAL DISEASE. Incidence* of reported cases, by year — United States, 1983–2013
In 2013, meningococcal disease incidence remained low, but it continues to cause substantial morbidity and mortality in the United States. In 2005, a quadrivalent (A,C,W,Y) meningococcal conjugate vaccine was licensed and recommended for adolescents and others at increased risk for disease. In October 2010, a booster dose was added to recommendations for adolescents at age 16 years.
Alternate Text: This figure is a line graph that presents the incidence per 100,000 population of meningococcal disease cases in the United States from 1983 to 2013.
MUMPS. Incidence* of reported cases, by year — United States, 1988–2013
The widespread use of a second dose of mumps vaccine beginning in 1989 was followed by historically low morbidity until 2006, when the United States experienced the largest mumps outbreak in two decades. The 2006 outbreak of approximately 6,000 cases primarily affected college students aged 18–24 years in the Midwest. A second large outbreak occurred during 2009–2010 and affected Orthodox Jewish communities in the Northeast.
Alternate Text: This figure is a line graph that presents the incidence per 100,000 population of mumps cases in the United States from 1988 to 2013
PERTUSSIS. Incidence* of reported cases, by year — United States, 1983–2013
Pertussis remains endemic in the United States with cyclic peaks occurring every 2–5 years. Incidence decreased 41% from 2012 to 2013, but rates remain higher than rates observed during the 1990s and early 2000s.
Alternate Text: This figure is a line graph that presents the incidence per 100,000 population of pertussis cases in the United States from 1983 to 2013.
PERTUSSIS. Incidence* of reported cases, by age — United States, 2013
Infants, especially those who are too young to be fully vaccinated, are at greatest risk for severe disease and death from pertussis. Historically, the highest rates of pertussis have been observed among children aged <1 year; however, rates have increased among school-aged children and adolescents in recent years.
Alternate Text: This figure is a line graph that presents the incidence of pertussis per 100,000 population in 5-year increments between ages 0 and ≥85 years.
Q FEVER, ACUTE AND CHRONIC. Number* of reported cases — United States and U.S. territories, 2013
In 2013, Q fever, caused by Coxiella burnetii, was reported in 36 jurisdictions (states, districts, or territories). Human cases of Q fever most often result from contact with infected livestock, especially sheep, goats, and cattle.
Alternate Text: This figure is a map of the United States and U.S. territories that presents the number of acute and chronic Q fever cases in each state and territory in 2013.
RABIES, ANIMAL. Number* of reported cases, by county — United States, 2013
In 2013, rabid animals were reported in all jurisdictions except Hawaii. Because reporting is based on the number of animals tested, the burden of disease is likely underestimated.
Alternate Text: This figure is a map of the United States that presents the number of rabies cases, by county, among wild and domestic animals in the United States in 2013.
RUBELLA. Incidence* of reported cases, by year — United States, 1983–2013
In 2004, rubella was certified as no longer endemic in the U.S.
Alternate Text: This figure is a line graph that presents the incidence per 100,000 population of rubella cases in the United States from 1983 to 2013.
SALMONELLOSIS AND SHIGELLOSIS. Incidence* of reported cases, by year — United States, 1983–2013
Although incidence rates of salmonellosis have remained relatively stable since the early 1990s, incidence rates of shigellosis during the same period have followed a general decreasing trend.
Alternate Text: This figure is a line graph that presents the number of salmonellosis and shigellosis cases in the United States from 1983 to 2013.
SHIGA TOXIN-PRODUCING ESCHERICHIA COLI (STEC). Incidence* of reported cases — United States and U.S. territories, 2013
Incidence rates were generally highest in the northern and western states. States with the highest incidence rates were Idaho, North Dakota, and Minnesota.
Alternate Text: This figure is a map of the United States and U.S. territories that presents the incidence of Shiga-toxin producing Escherichia coli cases in each state and territory in 2013.
SPOTTED FEVER RICKETTSIOSIS. Number of reported cases, by county — United States, 2013
In the United States, the majority of cases of spotted fever rickettsiosis (SFR) are attributed to infection with Rickettsia rickettsii, the causative agent of Rocky Mountain spotted fever (RMSF). Cases of SFR also might be from other agents such as Rickettsia parkeri and Rickettsia species 364D. RMSF is ubiquitous across the United States, which represents the widespread nature of the three tick vectors known to transmit RMSF: Dermacentor variabilis in the East, Dermacentor andersoni in the West, and Rhipicephalus sanguineus, recently recognized as a new tick vector in parts of Arizona. Historically, much of the incidence of RMSF has been in the Central Atlantic region and parts of the Midwest; however, endemic transmission of RMSF in Arizona communities has led to a substantial reported incidence rate.
Alternate Text: The figure is a map that presents the number of spotted fever rickettsiosis cases by county in the United States in 2013.
SYPHILIS, CONGENITAL. Incidence* of reported cases among infants, by year of birth — United States, 1983–2013
In 2013, the rate of congenital syphilis was near historic lows. However, for the first time since 2008, the rate of congenital syphilis increased from 2012 to 2013, from 8.4 to 8.7 cases per 100,000 live births (a 4% increase).
Alternate Text: This figure is a line graph that presents the incidence per 100,000 live births of congenital syphilis cases among infants aged <1 year in the United States during 1983-2013.
SYPHILIS, PRIMARY AND SECONDARY. Incidence* of reported cases — United States and U.S. territories, 2013
In 2013, jurisdictions in all census regions of the U.S. and many outlying territories reported cases of primary and secondary syphilis. A total of 15 states and areas (including the District of Columbia) with the highest rates of primary and secondary syphilis accounted for 70% of all U.S. cases of primary and secondary syphilis; the rate of primary and secondary syphilis in 14 of these 15 states and areas exceeded the national rate of 5.5 cases per 100,000 population; nine of these 15 states and areas were in the South.
Alternate Text: This figure is a map of the United States and U.S. territories that presents the incidence per 100,000 population of primary and secondary syphilis cases in each state and territory in 2013.
SYPHILIS, PRIMARY AND SECONDARY. Incidence* of reported cases by sex — United States, 1998–2013
During 2012–2013, the rate of primary and secondary syphilis in the United States remained constant in women and increased in men (women: constant at 0.9; men: increased from 9.2 to 10.3) per 100,000 population.
Alternate Text: This figure is a line graph that presents the incidence per 100,000 population of primary and secondary syphilis cases among men and women in the United States from 1998 to 2013.
Syphilis, Primary and Secondary. Incidence* of reported cases by race/ethnicity — United States, 1998–2013
During 1998–2013, the rate of primary and secondary syphilis was highest among non-Hispanic blacks (16.8 cases per 100,000 population in 2013). In 2013, the rate among non-Hispanic blacks was 5.6 times the rate among non-Hispanic whites (3.0 cases), and the rate among Hispanics (6.3 cases) was 2.1 times the rate among non-Hispanic whites.
Alternate Text: This figure is a line graph that presents the incidence per 100,000 population of primary and secondary syphilis cases by race/ethnicity in the United States from 1998 to 2013. The race/ethnicities include black non-Hispanic, white non-Hispanic, American Indian/Alaska Native non-Hispanic, Asian/Pacific Islander non-Hispanic, and Hispanic.
Trichinellosis. Number of reported cases, by year — United States, 1983–2013
In 2013, a total of 22 trichinellosis cases were reported from eight states. A trichinellosis outbreak was reported involving nine persons from two families from one state, all of whom consumed meat from a boar that was hunted in a wild game park in a neighboring state. This is the second reported trichinellosis outbreak in 3 years associated with a wild game park.
Alternate Text: This figure is a line graph that presents the number of trichinellosis cases in the United States from 1983 to 2013.
Tuberculosis. Incidence* of reported cases — United States and U.S. territories, 2013
In 2013, the tuberculosis incidence rate in the United States declined for the 21st consecutive year. Nine states and the District of Columbia reported an incidence rate above the national average.
Alternate Text: This figure is a map of the United States and U.S. territories that presents the incidence range per 100,000 population of tuberculosis cases in each state and territory in 2013.
Tuberculosis. Number of reported cases among U.S.-born and foreign-born persons,* by year — United States, 2003–2013
The number of tuberculosis cases reported among U.S.-born and foreign-born patients has consistently declined since 2003. In 2009, the number of cases declined significantly and has continued to decrease more modestly.
Alternate Text: This figure is a line graph that presents the number of cases of tuberculosis cases, separated by U.S.-born and foreign-born persons, in the United States from 2003 to 2013.
Tuberculosis. Incidence* of reported cases, by race/ethnicity† — United States, 2003–2013
The factor of difference between Asian/Pacific Islanders has widened from 21 times that of non-Hispanic whites in 2003 to 26 times that of non-Hispanic whites by 2013.
Alternate Text: This figure is a line graph that presents the incidence per 100,000 population of tuberculosis cases by race/ethnicity in the United States from 2003 to 2013. The race/ethnicities include black non-Hispanic, white non-Hispanic, American Indian/Alaska Natives non-Hispanic, Asian/Pacific Islanders non-Hispanic, and non-Hispanic.
Tularemia. Number of reported cases by year — United States and U.S. territories, 2013
In 2013, tularemia cases were reported from 29 states. Although the disease occurs across a broad geographic area, over half (64%) of all cases were reported from the south central states of Arkansas, Kansas, Missouri, Nebraska, and Oklahoma.
Alternate Text: This figure is a map of the United States and U.S. territories that presents the number of tularemia cases in each state and territory in 2011.
TYPHOID FEVER. Number* of reported cases by year — United States, 1983–2013
In the United States, typhoid fever remains primarily a disease of travelers to countries where typhoid fever is endemic, for whom vaccination against typhoid fever is recommended. During the last 30 years, the annual number of typhoid fever cases peaked in 1990 (552 cases) and then declined to a low of 321 cases in 2002. Case counts then returned to levels observed in the early 1990s before declining to 338 in 2013.
Alternate Text: This figure is a line graph that presents the number of cases of typhoid fever in the United States from 1983 to 2013.
VARICELLA (CHICKENPOX). Number* of reported cases — Illinois, Michigan, Texas, and West Virginia, 1991–2013
In four states (Michigan, Illinois, Texas, and West Virginia), the number of cases reported in 2013 was 23% lower than 2012, 74% lower than the average annual number reported during the mature 1-dose varicella vaccination era of 2000–2006, and 96% lower than the average annual number reported during the prevaccine years of 1993–1995.
Alternate Text: This figure is a line graph that presents the number of cases of varicella, also known as chickenpox, in Illinois, Michigan, Texas, and West Virginia from 1991 to 2013.
Vibriosis. Number of reported cases — United States and U.S. territories, 2013
In 2013, the number of Vibrio parahaemolyticus infections of a particular strain increased markedly, and illness was associated with consumption of shellfish harvested from Connecticut, Massachusetts, New York, and Virginia coastal waters. Before 2012, infections with this strain had only been associated with shellfish from the Pacific Northwest.
Alternate Text: This figure is a map of the United States and U.S. territories that presents the number of cases of vibriosis in each state and territory in 2013.
PART 3
Historical Summaries of Notifiable Diseases in the United States, 2003–2013
Abbreviations and Symbols Used in Tables
NA Data not available.
— No reported cases.
Notes: Rates <0.01 after rounding are listed as 0.
Data in the MMWR Summary of Notifiable Diseases — United States, 2011 might differ from data in other CDC surveillance reports because of differences in the timing of reports, the source of the data, the use of different case definitions, and print criteria.
|
Disease
|
2003
|
2004
|
2005
|
2006
|
2007
|
2008
|
2009
|
2010
|
2011
|
2012
|
2013
|
|
AIDS
|
15.36
|
15.28
|
14
|
12.9
|
12.5
|
13
|
†
|
†
|
†
|
†
|
†
|
|
Anthrax
|
—
|
—
|
—
|
0
|
0
|
0
|
0
|
0
|
0
|
0
|
0
|
|
Arboviral diseases§
|
|
|
|
|
|
|
|
|
|
|
|
|
California serogroup virus disease
|
|
|
|
|
|
|
|
|
|
|
|
|
neuroinvasive
|
—
|
—
|
0.02
|
0.02
|
0.02
|
0.02
|
0.02
|
0.02
|
0.04
|
0.02
|
0.03
|
|
nonneuroinvasive
|
¶
|
¶
|
0
|
0
|
0
|
0
|
0
|
0
|
0.01
|
0
|
0.01
|
|
Eastern equine encephalitis virus disease
|
|
|
|
|
|
|
|
|
|
|
|
|
neuroinvasive
|
—
|
—
|
0
|
0
|
0
|
0
|
0
|
0
|
0
|
0
|
0
|
|
nonneuroinvasive
|
¶
|
¶
|
0
|
0
|
0
|
0
|
0
|
—
|
—
|
—
|
—
|
|
Powassan virus disease
|
|
|
|
|
|
|
|
|
|
|
|
|
neuroinvasive
|
—
|
—
|
0
|
0
|
0
|
0
|
0
|
0
|
0
|
0
|
0
|
|
nonneuroinvasive
|
¶
|
¶
|
0
|
0
|
0
|
0
|
—
|
—
|
0
|
0
|
0
|
|
St. Louis encephalitis virus disease
|
|
|
|
|
|
|
|
|
|
|
|
|
neuroinvasive
|
—
|
—
|
0
|
0
|
0
|
0
|
0
|
0
|
0
|
0
|
0
|
|
nonneuroinvasive
|
¶
|
¶
|
0
|
0
|
0
|
0
|
0
|
0
|
0
|
0
|
0
|
|
West Nile virus disease
|
|
|
|
|
|
|
|
|
|
|
|
|
neuroinvasive
|
—
|
—
|
0.45
|
0.5
|
0.41
|
0.23
|
0.13
|
0.2
|
0.16
|
0.92
|
0.4
|
|
nonneuroinvasive
|
¶
|
¶
|
0.58
|
0.94
|
0.8
|
0.22
|
0.11
|
0.13
|
0.07
|
0.9
|
0.38
|
|
Western equine encephalitis virus disease
|
|
|
|
|
|
|
|
|
|
|
|
|
neuroinvasive
|
—
|
—
|
—
|
—
|
—
|
—
|
—
|
—
|
—
|
—
|
—
|
|
nonneuroinvasive
|
¶
|
¶
|
—
|
—
|
—
|
—
|
—
|
—
|
—
|
—
|
—
|
|
Babesiosis, total**
|
|
|
|
|
|
|
|
|
|
|
|
|
confirmed
|
¶
|
¶
|
¶
|
¶
|
¶
|
¶
|
¶
|
¶
|
0.39
|
0.22
|
0.77
|
|
probable
|
¶
|
¶
|
¶
|
¶
|
¶
|
¶
|
¶
|
¶
|
0.12
|
0.06
|
0.16
|
|
Botulism, total
|
0.01
|
0.02
|
0.01
|
0.02
|
0.05
|
0.05
|
0.04
|
0.04
|
0.01
|
0.05
|
0.05
|
|
foodborne
|
0.01
|
0.01
|
0.01
|
0.01
|
0.01
|
0.01
|
0
|
0
|
0.01
|
0.01
|
0
|
|
infant
|
1.87
|
2.12
|
2.09
|
2.35
|
2.05
|
2.56
|
1.92
|
1.88
|
2.34
|
3.1
|
3.45
|
|
other (wound and unspecified)
|
—
|
—
|
—
|
—
|
—
|
—
|
—
|
—
|
—
|
0.01
|
0
|
|
Brucellosis
|
0.04
|
0.04
|
0.04
|
0.04
|
0.04
|
0.03
|
0.04
|
0.04
|
0.03
|
0.04
|
0.03
|
|
Chancroid††
|
0.02
|
0
|
0.01
|
0.01
|
0.01
|
0.01
|
0.01
|
0.01
|
0
|
0
|
0
|
|
Chlamydia trachomatis infections††
|
304.7
|
319.6
|
332.5
|
348
|
370
|
401.3
|
409.2
|
426
|
457.1
|
456.7
|
446.7
|
|
Cholera
|
0
|
0
|
0
|
0
|
0
|
0
|
0
|
0
|
0.01
|
0.01
|
0
|
|
Coccidioidomycosis
|
2.57
|
4.14
|
6.24
|
6.79
|
14.4
|
7.76
|
13.24
|
§
|
16.49
|
12.97
|
7.82
|
|
Cryptosporidiosis, total**
|
1.22
|
1.23
|
1.93
|
2.05
|
3.73
|
3.02
|
2.52
|
2.91
|
3
|
2.56
|
2.89
|
|
confirmed
|
¶
|
¶
|
¶
|
¶
|
¶
|
¶
|
2.43
|
2.73
|
1.98
|
1.68
|
1.82
|
|
probable
|
¶
|
¶
|
¶
|
¶
|
¶
|
¶
|
0.09
|
0.19
|
1.01
|
0.87
|
1.06
|
|
Cyclosporiasis
|
0.03
|
0.14
|
0.24
|
0.06
|
0.04
|
0.05
|
0.05
|
0.07
|
0.05
|
0.04
|
0.28
|
|
Dengue Virus Infection§
|
|
|
|
|
|
|
|
|
|
|
|
|
Dengue Fever
|
¶
|
¶
|
¶
|
¶
|
¶
|
¶
|
¶
|
0.22
|
0.08
|
0.17
|
0.27
|
|
Dengue Hemorrhagic Fever
|
¶
|
¶
|
¶
|
¶
|
¶
|
¶
|
¶
|
0
|
0
|
0
|
0
|
|
Diphtheria
|
0
|
—
|
—
|
—
|
—
|
—
|
—
|
—
|
—
|
—
|
—
|
|
Ehrlichiosis
|
|
|
|
|
|
|
|
|
|
|
|
|
human granulocytic (HGE)
|
0.13
|
0.2
|
0.28
|
0.23
|
0.31
|
¶
|
¶
|
¶
|
¶
|
¶
|
¶
|
|
human monocytic (HME)
|
0.11
|
0.12
|
0.18
|
0.2
|
0.3
|
¶
|
¶
|
¶
|
¶
|
¶
|
¶
|
|
human (other & unspecified)§§
|
—
|
—
|
0.04
|
0.08
|
0.12
|
¶
|
¶
|
¶
|
¶
|
¶
|
¶
|
|
Ehrlichiosis/Anaplasmosis
|
|
|
|
|
|
|
|
|
|
|
|
|
Ehrlichia chaffeensis
|
¶
|
¶
|
¶
|
¶
|
¶
|
0.35
|
0.34
|
0.26
|
0.29
|
0.38
|
0.51
|
|
Ehrlichia ewingii
|
¶
|
¶
|
¶
|
¶
|
¶
|
0
|
0
|
0
|
0
|
0.01
|
0.01
|
|
Anaplasma phagocytophilum
|
¶
|
¶
|
¶
|
¶
|
¶
|
0.43
|
0.42
|
0.61
|
0.88
|
0.81
|
0.93
|
|
Undetermined
|
¶
|
¶
|
¶
|
¶
|
¶
|
0.06
|
0.06
|
0.04
|
0.05
|
0.06
|
0.07
|
|
Encephalitis/meningitis, arboviral¶¶
|
|
|
|
|
|
|
|
|
|
|
|
|
California serogroup virus
|
0.06
|
0
|
¶¶
|
¶¶
|
¶¶
|
¶¶
|
¶¶
|
¶¶
|
¶¶
|
¶¶
|
¶¶
|
|
Eastern equine virus
|
0
|
0
|
¶¶
|
¶¶
|
¶¶
|
¶¶
|
¶¶
|
¶¶
|
¶¶
|
¶¶
|
¶¶
|
|
Powassan virus
|
0
|
0
|
¶¶
|
¶¶
|
¶¶
|
¶¶
|
¶¶
|
¶¶
|
¶¶
|
¶¶
|
¶¶
|
|
St. Louis virus
|
0.01
|
0
|
¶¶
|
¶¶
|
¶¶
|
¶¶
|
¶¶
|
¶¶
|
¶¶
|
¶¶
|
¶¶
|
|
West Nile virus
|
1
|
0.43
|
¶¶
|
¶¶
|
¶¶
|
¶¶
|
¶¶
|
¶¶
|
¶¶
|
¶¶
|
¶¶
|
|
Western equine virus
|
0
|
—
|
¶¶
|
¶¶
|
¶¶
|
¶¶
|
¶¶
|
¶¶
|
¶¶
|
¶¶
|
¶¶
|
|
Enterohemorrhagic Escherichia coli
|
|
|
|
|
|
|
|
|
|
|
|
|
O157:H7
|
0.93
|
0.87
|
0.89
|
¶
|
¶
|
¶
|
¶¶
|
¶¶
|
¶¶
|
¶¶
|
¶¶
|
|
non-O157
|
0.09
|
0.13
|
0.19
|
¶
|
¶
|
¶
|
¶¶
|
¶¶
|
¶¶
|
¶¶
|
¶¶
|
|
not serogrouped
|
0.05
|
0.13
|
0.16
|
¶
|
¶
|
¶
|
¶¶
|
¶¶
|
¶¶
|
¶¶
|
¶¶
|
|
Giardiasis
|
6.84
|
8.35
|
7.82
|
7.28
|
7.66
|
7.41
|
7.37
|
7.64
|
6.42
|
5.87
|
5.8
|
|
Disease
|
2003
|
2004
|
2005
|
2006
|
2007
|
2008
|
2009
|
2010
|
2011
|
2012
|
2013
|
|
Gonorrhea††
|
116.4
|
113.5
|
115.6
|
121
|
119
|
111.6
|
99.05
|
100.8
|
104.1
|
107.5
|
106.1
|
|
Haemophilus influenzae, invasive disease
|
|
|
|
|
|
|
|
|
|
|
|
|
all ages, serotypes
|
0.7
|
0.72
|
0.78
|
0.82
|
0.85
|
0.96
|
0.99
|
1.03
|
1.15
|
1.1
|
1.21
|
|
age <5 yrs
|
|
|
|
|
|
|
|
|
|
|
|
|
serotype b
|
0.16
|
0.03
|
0.04
|
0.14
|
0.11
|
0.14
|
0.18
|
0.11
|
0.06
|
0.15
|
0.16
|
|
nonserotype b
|
0.59
|
0.04
|
0.67
|
0.86
|
0.97
|
1.18
|
1.17
|
0.94
|
0.57
|
1.02
|
1.11
|
|
unknown serotype
|
1.15
|
0.97
|
1.08
|
0.88
|
0.88
|
0.79
|
0.79
|
1.05
|
0.89
|
1.04
|
0.93
|
|
Hansen disease (Leprosy)
|
0.03
|
0.04
|
0.03
|
0.03
|
0.04
|
0.03
|
0.04
|
0.04
|
0.03
|
0.03
|
0.03
|
|
Hantavirus pulmonary syndrome
|
0.01
|
0.01
|
0.01
|
0.01
|
0.01
|
0.01
|
0.01
|
0.01
|
0.01
|
0.01
|
0.01
|
|
Hemolytic uremic syndrome postdiarrheal
|
0.06
|
0.07
|
0.08
|
0.11
|
0.1
|
0.12
|
0.09
|
0.09
|
0.1
|
0.09
|
0.11
|
|
Hepatitis, viral, acute***
|
|
|
|
|
|
|
|
|
|
|
|
|
A
|
2.66
|
1.95
|
1.53
|
1.21
|
1
|
0.86
|
0.65
|
0.54
|
0.45
|
0.5
|
0.57
|
|
B
|
2.61
|
2.14
|
1.78
|
1.62
|
1.51
|
1.34
|
1.12
|
1.1
|
0.94
|
0.93
|
0.97
|
|
C
|
0.38
|
0.31
|
0.23
|
0.26
|
0.28
|
0.29
|
0.27
|
0.29
|
0.42
|
0.59
|
0.71
|
|
Hepatitis B perinatal infection
|
—
|
—
|
—
|
—
|
—
|
—
|
—
|
—
|
—
|
0.01
|
0.02
|
|
Human immunodeficiency virus (HIV) diagnoses†
|
—
|
—
|
—
|
—
|
—
|
—
|
12.13
|
11.64
|
11.32
|
11.26
|
11.06
|
|
Influenza-associated pediatric mortality†††
|
¶
|
¶
|
0.02
|
0.07
|
0.1
|
0.12
|
0.48
|
0.08
|
0.17
|
0.07
|
0.22
|
|
Invasive pneumococcal disease, all ages§§§
|
—
|
—
|
—
|
—
|
—
|
—
|
—
|
—
|
—
|
7.72
|
8.3
|
|
age<5 years
|
—
|
—
|
—
|
—
|
—
|
—
|
—
|
—
|
—
|
8.35
|
7.8
|
|
Legionellosis
|
0.78
|
0.71
|
0.78
|
0.96
|
0.91
|
1.05
|
1.16
|
1.09
|
1.36
|
1.19
|
1.58
|
|
Listeriosis
|
0.24
|
0.32
|
0.31
|
0.3
|
0.27
|
0.25
|
0.28
|
0.27
|
0.28
|
0.23
|
0.23
|
|
Lyme disease, total¶¶¶
|
7.39
|
6.84
|
7.94
|
6.75
|
9.21
|
11.67
|
12.71
|
9.86
|
10.78
|
9.96
|
11.62
|
|
confirmed
|
¶¶¶
|
¶¶¶
|
¶¶¶
|
¶¶¶
|
¶¶¶
|
9.59
|
9.85
|
7.38
|
7.92
|
7.1
|
8.71
|
|
probable
|
¶¶¶
|
¶¶¶
|
¶¶¶
|
¶¶¶
|
¶¶¶
|
2.08
|
2.8
|
2.49
|
2.84
|
2.84
|
2.91
|
|
Malaria
|
0.49
|
0.51
|
0.51
|
0.5
|
0.47
|
0.42
|
0.48
|
0.58
|
0.56
|
0.48
|
0.51
|
|
Measles
|
0.02
|
0.01
|
0.02
|
0.02
|
0.01
|
0.05
|
0.02
|
0.02
|
0.06
|
0.02
|
0.06
|
|
indigenous
|
—
|
—
|
—
|
—
|
—
|
—
|
—
|
—
|
—
|
0.01
|
0.04
|
|
imported
|
—
|
—
|
—
|
—
|
—
|
—
|
—
|
—
|
—
|
0.01
|
0.02
|
|
Meningococcal disease, invasive****
|
|
|
|
|
|
|
|
|
|
|
|
|
all serogroups
|
0.61
|
0.47
|
0.42
|
0.4
|
0.36
|
0.39
|
0.32
|
0.27
|
0.25
|
0.18
|
0.18
|
|
serogroup AWYC
|
****
|
****
|
0.1
|
0.11
|
0.11
|
0.11
|
0.1
|
0.09
|
0.08
|
0.05
|
0.05
|
|
serogroup B
|
****
|
****
|
0.05
|
0.07
|
0.06
|
0.06
|
0.06
|
0.04
|
0.05
|
0.04
|
0.03
|
|
other serogroup
|
****
|
****
|
0.01
|
0.01
|
0.01
|
0.01
|
0.01
|
0
|
0.01
|
0.01
|
0.01
|
|
serogroup unknown
|
****
|
****
|
0.26
|
0.22
|
0.18
|
0.2
|
0.16
|
0.13
|
0.1
|
0.08
|
0.09
|
|
Mumps
|
0.08
|
0.09
|
0.11
|
2.22
|
0.27
|
0.15
|
0.65
|
0.85
|
0.13
|
0.07
|
0.19
|
|
Novel influenza A virus infections
|
¶
|
¶
|
¶
|
¶
|
0
|
0
|
14.37
|
0
|
0
|
0.1
|
0.1
|
|
Pertussis
|
4.04
|
8.88
|
8.72
|
5.27
|
3.49
|
4.4
|
5.54
|
8.97
|
6.06
|
15.49
|
9.12
|
|
Plague
|
0
|
0
|
0
|
0.01
|
0
|
0
|
0
|
0
|
0
|
0
|
0
|
|
Poliomyelitis, paralytic
|
0
|
0
|
0
|
0
|
—
|
—
|
0
|
—
|
—
|
—
|
—
|
|
Poliovirus infection, nonparalytic
|
¶
|
¶
|
¶
|
¶
|
—
|
—
|
—
|
—
|
—
|
—
|
—
|
|
Psittacosis
|
0
|
0
|
0.01
|
0.01
|
0
|
0
|
0
|
0
|
0
|
0
|
0
|
|
Q Fever††††
|
0.02
|
0.03
|
0.05
|
0.06
|
0.06
|
0.04
|
0.04
|
0.04
|
0.04
|
0.04
|
0.05
|
|
acute
|
††††
|
††††
|
††††
|
††††
|
††††
|
0.04
|
0.03
|
0.04
|
0.04
|
0.04
|
0.04
|
|
chronic
|
††††
|
††††
|
††††
|
††††
|
††††
|
0
|
0.01
|
0.01
|
0.01
|
0.01
|
0.01
|
|
Rabies
|
|
|
|
|
|
|
|
|
|
|
|
|
animal
|
0
|
0
|
0
|
0
|
0
|
0
|
0
|
0
|
0
|
1.48
|
1.41
|
|
human
|
0
|
0
|
0
|
0
|
0
|
0
|
0
|
0
|
0
|
0
|
0
|
|
Rubella
|
0
|
0
|
0
|
0
|
0
|
0.01
|
0
|
0
|
0
|
0
|
0
|
|
Rubella, congenital syndrome
|
0
|
0
|
0
|
0
|
0
|
—
|
—
|
0
|
—
|
0
|
0
|
|
Salmonellosis
|
15.16
|
14.47
|
15.43
|
15.5
|
16
|
16.92
|
16.18
|
17.73
|
16.79
|
17.27
|
16.13
|
|
SARS-CoV§§§§
|
0
|
—
|
—
|
—
|
—
|
—
|
—
|
—
|
—
|
—
|
—
|
|
Shiga toxin-producing Escherichia coli (STEC)
|
¶
|
¶
|
¶
|
1.71
|
1.62
|
1.76
|
1.53
|
1.78
|
1.96
|
2.08
|
2.13
|
|
Shigellosis
|
8.19
|
4.99
|
5.51
|
5.23
|
6.6
|
7.5
|
5.24
|
4.82
|
4.32
|
4.9
|
4.06
|
|
Spotted Fever Rickettsiosis, total¶¶¶¶
|
0.38
|
0.6
|
0.66
|
0.8
|
0.77
|
0.85
|
0.6
|
0.65
|
0.91
|
1.44
|
1.08
|
|
confirmed
|
¶¶¶¶
|
¶¶¶¶
|
¶¶¶¶
|
¶¶¶¶
|
¶¶¶¶
|
0.06
|
0.05
|
0.05
|
0.08
|
0.06
|
0.06
|
|
probable
|
¶¶¶¶
|
¶¶¶¶
|
¶¶¶¶
|
¶¶¶¶
|
¶¶¶¶
|
0.78
|
0.55
|
0.59
|
0.83
|
1.38
|
1.02
|
|
Smallpox
|
¶
|
—
|
—
|
—
|
—
|
—
|
—
|
—
|
—
|
—
|
—
|
|
Streptococcal disease, invasive, group A
|
2.04
|
1.82
|
2
|
2.24
|
1.89
|
2.3
|
2.13
|
¶
|
¶
|
¶
|
¶
|
|
Streptococcal, toxic shock syndrome
|
0.06
|
0.06
|
0.07
|
0.06
|
0.06
|
0.07
|
0.08
|
0.07
|
0.09
|
0.1
|
0.11
|
|
Streptococcus pneumoniae invasive disease (IPD)*****
|
|
|
|
|
|
|
|
|
|
|
|
|
all ages
|
*****
|
*****
|
*****
|
*****
|
*****
|
*****
|
*****
|
8.83
|
8.52
|
—
|
—
|
|
age <5 yrs
|
*****
|
*****
|
*****
|
*****
|
*****
|
*****
|
*****
|
14.15
|
7.64
|
—
|
—
|
|
Disease
|
2003
|
2004
|
2005
|
2006
|
2007
|
2008
|
2009
|
2010
|
2011
|
2012
|
2013
|
|
Streptococcus pneumoniae invasive disease
|
|
|
|
|
|
|
|
|
|
|
|
|
drug resistant, all ages
|
0.99
|
1.49
|
1.42
|
2.19
|
1.49
|
1.6
|
1.75
|
*****
|
*****
|
*****
|
*****
|
|
age <5 yrs
|
—
|
—
|
—
|
—
|
3.73
|
3.51
|
4.54
|
*****
|
*****
|
*****
|
*****
|
|
non-drug resistant,age <5 yrs
|
8.86
|
8.22
|
8.21
|
11.9
|
13.6
|
13.36
|
12.93
|
*****
|
*****
|
*****
|
*****
|
|
Syphilis, total††
|
|
|
|
|
|
|
|
|
|
|
|
|
all stages
|
11.9
|
11.94
|
11.33
|
12.5
|
13.7
|
15.34
|
14.74
|
14.93
|
14.9
|
16.02
|
17.99
|
|
congenital
|
10.56
|
9.12
|
8.24
|
9.07
|
10.5
|
10.12
|
9.9
|
8.85
|
8.68
|
8.12
|
8.83
|
|
primary and secondary
|
2.49
|
2.71
|
2.97
|
3.29
|
3.83
|
4.48
|
4.6
|
4.49
|
4.52
|
5.03
|
5.54
|
|
Tetanus
|
0.01
|
0.01
|
0.01
|
0.01
|
0.01
|
0.01
|
0.01
|
0.01
|
0.01
|
0.01
|
0.01
|
|
Toxic-shock syndrome
|
0.05
|
0.04
|
0.04
|
0.05
|
0.04
|
0.03
|
0.03
|
0.04
|
0.03
|
0.03
|
0.03
|
|
Trichinellosis
|
0
|
0
|
0.01
|
0.01
|
0
|
0.01
|
0
|
0
|
0.01
|
0.01
|
0.01
|
|
Tuberculosis†††††
|
5.17
|
5.09
|
4.8
|
4.65
|
4.44
|
4.28
|
3.8
|
3.64
|
3.41
|
3.19
|
3.05
|
|
Tularemia
|
0.04
|
0.05
|
0.05
|
0.03
|
0.05
|
0.04
|
0.03
|
0.04
|
0.05
|
0.05
|
0.06
|
|
Typhoid fever
|
0.12
|
0.11
|
0.11
|
0.12
|
0.14
|
0.15
|
0.13
|
0.15
|
0.13
|
0.11
|
0.11
|
|
Vancomycin-intermediate Staphylococcus aureus
|
§
|
—
|
0
|
0
|
0.02
|
0.03
|
0.03
|
0.04
|
0.04
|
0.06
|
0.1
|
|
Vancomycin-resistant Staphylococcus aureus
|
§
|
0
|
0
|
0
|
0
|
0
|
0
|
0
|
—
|
—
|
—
|
|
Varicella (chickenpox morbidity)§§§§§
|
7.27
|
18.41
|
19.64
|
28.7
|
18.7
|
13.56
|
8.71
|
6.46
|
5.79
|
5.33
|
4.62
|
|
Varicella (chickenpox mortality)
|
—
|
—
|
—
|
—
|
—
|
—
|
—
|
—
|
—
|
0
|
0
|
|
Vibriosis
|
§
|
§
|
§
|
§
|
0.25
|
0.24
|
0.3
|
0.3
|
0.29
|
0.39
|
0.43
|
|
Viral hemorrhagic fevers
|
§
|
§
|
§
|
§
|
§
|
§
|
§
|
0
|
0
|
0
|
0
|
|
Yellow fever¶¶¶¶¶
|
—
|
—
|
—
|
—
|
—
|
—
|
—
|
—
|
—
|
—
|
—
|
|
Cause of death
|
ICD-10† cause of death code
|
No. of deaths
|
|
2005
|
2006
|
2007
|
2008
|
2009
|
2010
|
2011
|
|
Anthrax
|
A22
|
0
|
0
|
0
|
0
|
0
|
0
|
0
|
|
Babesiosis
|
B60.0
|
4
|
5
|
6
|
7
|
6
|
4
|
5
|
|
Botulism, foodborne
|
A05.1
|
5
|
3
|
6
|
4
|
3
|
0
|
0
|
|
Brucellosis
|
A23
|
2
|
2
|
1
|
0
|
1
|
0
|
1
|
|
Cholera (toxigenic Vibrio cholerae O1 or O139)
|
A00
|
0
|
0
|
1
|
0
|
1
|
0
|
0
|
|
Coccidioidomycosis
|
B38
|
76
|
110
|
99
|
72
|
87
|
92
|
88
|
|
Cryptosporidiosis
|
A07.2
|
2
|
2
|
2
|
3
|
2
|
4
|
4
|
|
Cyclosporiasis
|
A07.8
|
0
|
0
|
0
|
0
|
0
|
0
|
0
|
|
Dengue fever
|
A90
|
2
|
0
|
0
|
0
|
1
|
2
|
0
|
|
Dengue hemorrhagic fever
|
A91
|
0
|
0
|
0
|
0
|
0
|
1
|
0
|
|
Diphtheria
|
A36.0, A36.1, A36.2
|
0
|
0
|
0
|
0
|
0
|
0
|
0
|
|
Ehrlichiosis and anaplasmosis (Anaplasma phagocytophilum, Ehrlichia cheffeensis, Ehrlichia ewingii, Ehrlichiosis and Anaplasmosis, Undetermined human ehrlichiosis/anaplasmosis)
|
A79
|
0
|
3
|
1
|
1
|
0
|
1
|
1
|
|
Giardiasis
|
A07.1
|
0
|
1
|
0
|
1
|
0
|
1
|
1
|
|
Haemophilus influenzae infection
|
A41.3, J14, G00.0
|
4
|
4
|
10
|
3
|
7
|
4
|
65
|
|
Hansen disease (leprosy)
|
A30
|
1
|
1
|
2
|
2
|
1
|
4
|
1
|
|
Hantavirus pulmonary syndrome
|
B33.4+
|
0
|
8
|
6
|
2
|
0
|
5
|
8
|
|
Hemolytic uremic syndrome, postdiarrheal
|
D59.3
|
30
|
29
|
20
|
32
|
25
|
20
|
25
|
|
Hepatitis A, viral, acute
|
B15
|
43
|
34
|
34
|
37
|
26
|
29
|
25
|
|
Human Immunodeficiency Virus (HIV) diagnosis
|
B20-B24
|
12,543
|
12,133
|
11,295
|
10,285
|
9,406
|
8,369
|
7,683
|
|
Influenza-associated pediatric mortality
|
J09, J10, J11
|
61
|
62
|
71
|
78
|
165
|
38
|
85
|
|
Legionellosis
|
A48.1, A48.2
|
78
|
91
|
67
|
92
|
104
|
104
|
111
|
|
Listeriosis
|
A32, P37.2
|
31
|
30
|
34
|
28
|
29
|
27
|
52
|
|
Lyme disease
|
A69.2, L90.4
|
7
|
5
|
8
|
10
|
12
|
10
|
6
|
|
Malaria
|
B50-B54
|
6
|
9
|
5
|
5
|
3
|
10
|
3
|
|
Measles
|
B05
|
1
|
0
|
0
|
0
|
2
|
2
|
0
|
|
Meningococcal disease
|
A39.0+
|
123
|
105
|
87
|
102
|
99
|
79
|
26
|
|
Mumps
|
B26
|
0
|
1
|
0
|
2
|
2
|
1
|
0
|
|
Pertussis
|
A37.0
|
31
|
9
|
9
|
20
|
15
|
26
|
1
|
|
Plague
|
A20
|
1
|
3
|
2
|
0
|
1
|
0
|
0
|
|
Poliomyelitis, acute
|
A80
|
0
|
0
|
0
|
0
|
0
|
0
|
0
|
|
Psittacosis
|
A70
|
0
|
0
|
0
|
0
|
0
|
0
|
0
|
|
Q fever
|
A78, J17.8, I39.8
|
2
|
2
|
4
|
0
|
1
|
0
|
2
|
|
Rabies, human
|
A82
|
1
|
2
|
1
|
2
|
4
|
1
|
4
|
|
Rubella
|
B06
|
0
|
0
|
1
|
0
|
1
|
1
|
1
|
|
Rubella congenital syndrome
|
P35.0
|
8
|
2
|
4
|
5
|
4
|
8
|
5
|
|
Salmonellosis
|
A02
|
30
|
34
|
30
|
42
|
26
|
28
|
44
|
|
Severe acute respiratory syndrome-associated coronavirus (SARS-CoV)
|
U04
|
0
|
0
|
0
|
0
|
0
|
0
|
0
|
|
Shiga toxin-producing Escherichia coli (STEC)
|
A04.3
|
5
|
3
|
3
|
1
|
3
|
8
|
0
|
|
Shigellosis
|
A03
|
9
|
3
|
4
|
3
|
4
|
2
|
3
|
|
Smallpox
|
B03
|
0
|
0
|
0
|
0
|
0
|
0
|
0
|
|
Spotted fever rickettsiosis (replaced Rocky Mountain spotted fever)
|
A77
|
6
|
4
|
4
|
4
|
8
|
8
|
10
|
|
Streptococcus pneumoniae, invasive disease (IPD) (all ages)
|
A40.3, G00.1, J13
|
670
|
574
|
568
|
534
|
570
|
468
|
454
|
|
Tetanus
|
A35, A33, A34
|
1
|
4
|
5
|
3
|
6
|
3
|
6
|
|
Toxic-shock syndrome
|
A48.3
|
55
|
57
|
18
|
20
|
21
|
24
|
23
|
|
Trichinellosis
|
B75
|
0
|
1
|
0
|
0
|
0
|
0
|
0
|
|
Tuberculosis
|
A15-A19
|
648
|
652
|
554
|
585
|
529
|
569
|
539
|
|
Tularemia
|
A21
|
0
|
0
|
2
|
1
|
3
|
0
|
0
|
|
Typhoid fever
|
A01.0
|
0
|
0
|
0
|
2
|
0
|
0
|
0
|
|
Varicella
|
B01
|
13
|
18
|
14
|
18
|
22
|
16
|
14
|
|
Vibriosis
|
A05.3, B98.1
|
1
|
2
|
0
|
1
|
0
|
0
|
0
|
Selected Reading for 2013
General
Adams DA, Jajosky RA, Ajani U, et al. Summary of notifiable diseases—United States, 2012. MMWR Morb Mort Wkly Rep 2014;61:1–121.
Adekoya N, Truman BI, Ajani UA. Completeness of Reporting of Race and Ethnicity Data in the Nationally Notifiable Diseases Surveillance System, United States, 2006–2010. J Public Health Manag Pract 2014.
Armstrong KE, McNabb S, Ferland LD, et al. Capacity of public health surveillance to comply with revised international health regulations, USA. Emerg Infect Dis 2010;5:804–8.
Beltran VM, Harrison KM, Hall HI, Dean HD. Collection of social determinant of health measures in US natonal surveillance systems for HIV, viral hepatitis, STDs, and TB. Public Health Rep 2011;126 Suppl 3:41–53.
Blau DM, Clark SC, Nolte KB, et al. Infectious disease surveillance by medical examiners and coroners. Emerging Infect Dis 2013;19:821–2.
Boehmer TK, Patnaik JL, Burnite SJ, et al. Use of hospital discharge data to evaluate notifiable disease reporting to Colorado's Electronic Disease Reporting System. Public Health Rep 2011;126:100–6.
Buehler JW, Hopkins RS, Overhage JM, et al. Framework for evaluating public health surveillance systems for early detection of outbreaks: recommendations from the CDC Working Group. MMWR Recomm Rep 2004;53(No. RR-5).
CDC. Automated detection and reporting of notifiable diseases using electronic medical records versus passive surveillance—Massachusetts, June 2006–July 2007. MMWR Morb Mort Wkly Rep 2008;57:373–6.
CDC. CDC's vision for public health surveillance in the 21st century. MMWR Surveillance Summaries 2012;61(Suppl; July 27, 2012).
CDC. Comparison of provisional with final notifiable disease case counts—National Notifiable Diseases Surveillance System, 2009. MMWR Morb Mort Wkly Rep 2013;62;747–51.
CDC. Framework for program evaluation in public health. MMWR Recomm Rep 1999;48(No. RR-11).
CDC. Historical perspectives: notifiable disease surveillance and notifiable disease statistics United States, June 1946 and June 1996. MMWR Morb Mort Wkly Rep 1996;45:530–6.
CDC. Manual for the surveillance of vaccine-preventable diseases 5th Edition. Atlanta, GA: US Department of Health and Human Services; CDC, 2012. Available at http://www.cdc.gov/vaccines/pubs/surv-manual/index.html.
CDC. NCHHSTP Atlas. US Department of Health and Human Services; CDC. Available at http://www.cdc.gov/nchhstp/atlas.
CDC. National Electronic Disease Surveillance System (NEDSS): a standards-based approach to connect public health and clinical medicine. J Public Health Manag Pract 2001;7:43–50.
CDC. Notice to Readers: Changes in presentation of data from the National Notifiable Diseases Surveillance System—January 13, 2006. MMWR Morb Mort Wkly Rep 2006;55:13–14.
CDC. Potential effects of electronic laboratory reporting on improving timeliness of infectious disease notification—Florida, 2002–2006. MMWR Morb Mort Wkly Rep 2008;57:1325–8.
CDC. Progress in increasing electronic reporting of laboratory results to public health agencies—United States, 2013. MMWR Morb Mort Wkly Rep 2013;62:797–999.
CDC. Public Health Information Network: Connecting public health. Atlanta, GA: US Department of Health and Human Services; CDC. Available at http://www.cdc.gov/phin/about/index.html.
CDC. Reporting race and ethnicity data—National Electronic Telecommunications System for Surveillance, 1994–1997. MMWR Morb Mort Wkly Rep 1999;48:305–12.
CDC. State Electronic Disease Surveillance Systems—United States, 2007 and 2010. MMWR Morb Mort Wkly Rep 2011;60:1421–23.
CDC. Ten leading nationally notifiable infectious diseases—United States, 1995. MMWR Morb Mort Wkly Rep 1996;45:883–4.
CDC. Updated guidelines for evaluating public health surveillance systems: recommendations from the Guidelines Working Group. MMWR Recomm Rep 2001;50(No. RR-13).
CDC. Use of race and ethnicity in public health surveillance: summary of the CDC/ATSDR workshop. MMWR Recomm Rep 1993;42(No. RR-10).
Chang MH, Glynn MK, Groseclose SL. Endemic, notifiable bioterrorism-related diseases, United States, 1992–1999. Emerg Infect Dis 2003;9:556–64.
Cronquist AB, Mody RK, Atkinson R, et al. Impacts of culture-independent diagnostic practices on public health surveillance for bacterial enteric pathogens. Clin Infect Dis 2012;54 (Suppl 5):S432–9.
Dato V, Wagner MM, Fapohunda A. How outbreaks of infectious disease are detected: a review of surveillance systems and outbreaks. Public Health Rep 2004 Sep–Oct;119:464–71.
Dixon BE, Siegel JA, Oemig TV, Grannis SJ. Electronic health information quality challenges and interventions to improve public health surveillance data and practice. Public Health Rep 2013;128:546–53.
Edelstein M, Heymann DL, Giesecke J, Weinberg J. Validity of International Health Regulations in reporting emerging infectious diseases. Emerg Infect Dis 2012;18:1115–20.
Effler P, Ching-Lee M, Bogard A, et al. Statewide system of electronic notifiable disease reporting from clinical laboratories: comparing automated reporting with conventional methods. JAMA 1999;282:1845–50.
Fairchild A, Bayer R, Colgrove J. Privacy and public health surveillance: the enduring tension. Virtual Mentor 2007;9:838–41.
Frieden TR. A framework for public health action: the health impact pyramid. Am J Public Health 2010;100:590–95.
Friedlin J, Grannis S, Overhage JM. Using natural language processing to improve accuracy of automated notifiable disease reporting. AMIA Symposium Proceedings 2008:207–11.
German R. Sensitivity and predictive value positive measurements for public health surveillance systems. Epidemiology 2000;11:720–7.
Government Accountability Office. Emerging infectious diseases: review of state and federal disease surveillance efforts. Washington, DC: Government Accountability Office; 2004. GAO-04-877. Available at http://www.gao.gov/new.items/d04877.pdf.
Gubernot DM, Boyer BL, Moses MS. Animals as early detectors of bioevents: veterinary tools and a framework for animal-human integrated zoonotic disease surveillance. Public Health Rep 2008;123:300–15.
Hagmann SH, Han PV, Stauffer WM, et al. Travel-associated disease among US residents visiting US GeoSentinel clinics after return from international travel. Fam Pract 2014;31:678–87.
Heymann DL, ed. Control of communicable diseases manual. 20th ed. Washington, DC: American Public Health Association; 2014.
Hopkins RS. Design and operation of state and local infectious disease surveillance systems. J Public Health Manag Pract 2005;11:184–90.
Jajosky RA, Groseclose SL. Evaluation of reporting timeliness of public health surveillance systems for infectious diseases. BMC Public Health 2004;4:29.
Jajosky R, Rey A, Park M, et al. Findings from the Council of State and Territorial Epidemiologists' 2008 assessment of state reportable and nationally notifiable conditions in the United States and considerations for the future. Public Health Manag Pract 2011;17:255–64.
Kleinman KP, Abrams AM. Assessing the utility of public health surveillance using specificity, sensitivity, and lives saved. Stat Med 2008;27:4057–68.
Krause G, Brodhun B, Altmann D, Claus H, Benzler J. Reliability of case definitions for public health surveillance assessed by round-robin test methodology. BMC Public Health 2006;6:129.
Lazarus R, Klompas M, Campion F, et al. Electronic support for public health: validated case finding and reporting for notifiable diseases using electronic medical data. J Am Med Inform Assn 2009;16:18–24.
Lee LM, Teutsch SM, Thacker SB, St Louis ME, eds. Principles and practice of public health surveillance. 3rd ed. New York, NY: Oxford University Press; 2010:1–17.
Lee LM, Thacker SB. The cornerstone of public health practice: public health surveillance, 1961–2011. MMWR Surveill Summ 2011;60 Suppl 4:15–21.
M'ikanatha NM, Iskander J. Concepts and methods in infectious disease surveillance. Malden, MA: Wiley; 2014.
M'ikanatha NM, Lynfield R, Van Beneden CA, de Valk H. Infectious disease surveillance, 2nd edition. Malden, MA: Wiley; 2013.
Nguyen TQ, Thorpe L, Makki HA, Mostashari F. Benefits and barriers to electronic laboratory results reporting for notifiable diseases: the New York City Department of Health and Mental Hygiene experience. Am J Public Health 2007;97 Suppl 1:S142–5.
Office of the National Coordinator for Health Information Technology (ONC). Federal health information technology strategic plan 2011–2015. Washington, DC: US Department of Health and Human Services; ONC. Available at http://www.healthit.gov/sites/default/files/utility/final-federal-health-it-strategic-plan-0911.pdf.
Overhage JM, Grannis S, McDonald CJ. A comparison of the completeness and timeliness of automated electronic laboratory reporting and spontaneous reporting of notifiable conditions. Am J Public Health 2008;98:344–50.
Pickering LK, editor. Red Book: 2012 Report of the Committee on Infectious Diseases. 29th ed. Elk Grove Village, IL: American Academy of Pediatrics; 2012.
Roush S, Murphy T, et al. Historical comparisons of morbidity and mortality for vaccine-preventable diseases in the United States. JAMA 2007;298:2155–63.
Scallan E, Hoekstra RM, Angulo FJ, et al. Foodborne illness acquired in the United States—major pathogens. Emerg Infect Dis 2011;17:7–15.
Sickbert-Bennett EE, Weber DJ, Poole C, et al. Completeness of communicable disease reporting, North Carolina, USA, 1995–1997 and 2000–2006. Emerg Infect Dis 2011;17:23–9.
Silk BJ, Berkelman RL. A review of strategies for enhancing the completeness of notifiable disease reporting. J Public Health Manag Pract 2005;11:191–200.
Struelens MJ, Brisse S. From molecular to genomic epidemiology: transforming surveillance and control of infectious diseases. Euro surveillance: European Communicable Disease Bulletin 2013;18:20386.
Vogt RL, Spittle R, Cronquist A, Patnaik JL. Evaluation of the timeliness and completeness of a web-based notifiable disease reporting system by a local health department. J Public Health Manag Pract 2006;12:540–4.
Anthrax
Bradley JS, Peacock G, Krug SE, Bower WA, Cohn AC, Meaney-Delman D, et al. Pediatric anthrax clinical management. Pediatrics 2014;133:e1411–36.
Hendricks KA, Wright ME, Shadomy SV, et al. Centers for Disease Control and Prevention (CDC) expert panel meetings on prevention and treatment of anthrax in adults. Emerg Infect Dis 2014:20:130687.
Meaney-Delman D, Zotti ME, Creanga AA, Misegades LK, Wako E, Treadwell TA, et al. Special considerations for prophylaxis for and treatment of anthrax in pregnant and postpartum women. Emerg Infect Dis 2014;20:e130611.
Domestic Arboviral, Neuroinvasive and Nonneuroinvasive
Blau DM, Rabe IB, Bhatnagar J, Civen R, Trivedi KK, Rollin D, Hocevar S, Kuehnert M, Staples JE, Zaki SR, Fischer M, and the West Nile Virus Transplant-Associated Transmission Investigation Team. West Nile virus RNA detected in tissues of a deceased donor associated with transmission of the virus through solid organ transplantation. Emerg Infect Dis 2013;19:1518‒20.
Gaensbauer J, Lindsey NP, Messacar K, Staples JE, Fischer M. Neuroinvasive arboviral disease in the United States: 2003 to 2012. Pediatrics 2014;134:e642–e650.
Geissler AL, Thorp E, Van Houten C, Lanciotti RS, Panella N, Gunnels B, Murphy T, Staples JE. Colorado tick fever virus among humans and ticks in a national parks and forest—Wyoming 2010. Vector Borne Zoonotic Dis 2014;14:675–80.
Lindsey NP, Lehman JA, Staples JE, Fischer M. West Nile virus and other arboviral diseases—United States, 2013. MMWR Morb Mort Wkly Rep 2014;63:521–526.
Lindsey NP, Staples JE, Delorey MJ, and Fischer M. Lack of evidence of increased West Nile virus disease severity in the United States in 2012. Am J Trop Med Hyg 2014;90(1):163–168.
Lindsey NP, Staples JE, Lehman JA, Fischer M. Surveillance for West Nile Virus Disease—United States, 1999–2008. MMWR Surveill Summ 2010;59(No. SS-2).
Rabe IB, Schwartz B, Farnon E, et al. Fatal transplant-associated West Nile virus encephalitis and public health response—California, 2010. Transplantation 2013;96:463–8.
Reimann CA, Hayes EB, DiGuiseppi C, et al. Epidemiology of Neuroinvasive Arboviral Disease in the United States, 1999–2007. Am J Trop Med Hyg 2008;79:974–9.
Ruktanonchai DJ, Pillai S, Stonecipher S, et al. Effect of aerial insecticide spraying on West Nile virus disease—North Texas, 2012. Am J Trop Med Hyg 2014;91:240–5.
Staples JE, Shankar M, Sejvar JJ, Meltzer M, Fischer M. Acute and long-term costs of West Nile virus disease among patients hospitalized in Colorado. Amer J Trop Med Hyg 2014;90:402–9.
Yendell SJ, Taylor J, Biggerstaff BJ, Tabony L, Staples JE, Fischer M. Use of laboratory reports as predictors of West Nile Virus disease cases—Texas, 2008–2012. Epidemiol Infect 2014;24:1–8.
Babesiosis
CDC. Babesiosis surveillance—18 states, 2011. MMWR Morb Mort Wkly Rep 2012;61:505–9.
Herwaldt BL, Linden JV, Bosserman E, Young C, Olkowska D, Wilson M. Transfusion-associatedbabesiosis in the United States: a description of cases. Ann Intern Med 2011;155:509–19.
Joseph JT, Purtill K, Wong SJ, et al. Vertical transmission of Babesia microti, United States. Emerg Infect Dis 2012;18:1318–21.
Perez Acosta ME, Ender PT, Smith EM, Jahre JA. Babesia microti infection, eastern Pennsylvania, USA. Emerg Infect Dis 2013;19:1105–7.
Vannier E, Krause PJ. Human babesiosis. N Engl J Med 2012;366:2397–407.
Brucellosis
Ashford DA, di Pietra J, Lingappa J, et al. Adverse events in humans associated with accidental exposure to the livestock brucellosis vaccine RB51. Vaccine 2004;22:3435–9.
CDC. Brucellosis (Brucella melitensis, abortus, suis, and canis). Atlanta, GA: US Department of Health and Human Services; 2012.
CDC. Brucellosis. Atlanta, GA: US Department of Health and Human Services, CDC; 2010. Available at http://www.cdc.gov/nczved/divisions/dfbmd/diseases/brucellosis.
CDC. Brucellosis case definition. Atlanta, GA: US Department of Health and Human Services, CDC; 2010. Available at http://wwwn.cdc.gov/nndss/conditions/brucellosis/case-definition/2010.
CDC. Brucella suis infection associated with feral swine hunting—three states, 2007–2008. MMWR Morb Mort Wkly Rep 2009;58:618–21.
CDC. Public health consequences of a false-positive laboratory test result for Brucella—Florida, Georgia, and Michigan, 2005. MMWR Morb Mort Wkly Rep 2008;57:603–5.
CDC. Laboratory-acquired brucellosis—Indiana and Minnesota, 2006. MMWR Morb Mort Wkly Rep 2008;57:39–42.
Chomel BB, DeBess EE, Mangiamele DM, et al. Changing trends in the epidemiology of human brucellosis in California from 1973 to 1992: a shift toward foodborne transmission. J Infect Dis 1994;170:1216–23.
Glynn MK, Lynn TV. Brucellosis. J Am Vet Med Assoc 2008;233:900–8.
Traxler RM, Lehman MW, Bosserman EA, Guerra MA, Smith TL. A literature review of laboratory-acquired brucellosis. J Clin Microbiol 2013;51:3055–62.
Yagupsky P, Baron EJ. Laboratory exposures to Brucellae and implications for bioterrorism. Emerg Infect Dis 2005;11:1180–5.
Botulism
Arnon SS, Barzilay EJ. Clostridial infections: botulism and infant botulism. In: Pickering LK, Baker CJ, Kimberlin DW, Long SS, eds. The Red Book: 2009 report of the Committee on Infectious Diseases. Elk Grove Village: American Academy of Pediatrics;2009:259–62.
Barzilay, EJ. Botulism and Intestinal Botulism. In: DL Heymann, ed. Control of communicable diseases manual, Washington, DC: American Public Health Association Press; 2008.
CDC. Infant botulism—New York City, 2001–2002. MMWR Morb Mort Wkly Rep 2003;52:21–4.
Fagan RP, McLaughlin JB, Castrodale LJ, et al. Endemic foodborne botulism among Alaska Native persons—Alaska, 1947–2007. Clin Infect Dis 2011;52:585–92.
Newkirk RW, Hedberg CW. Rapid detection of foodborne botulism outbreaks facilitated by epidemiological linking of cases: implications for food defense and public health response. Foodborne Pathog Dis 2012;9:150–5.
Shapiro RL, Hatheway C, Becher J, Swerdlow DL. Botulism surveillance and emergency response: a public health strategy for a global challenge. JAMA 1997;278:433–5.
Shapiro RL, Hatheway C, Swerdlow DL. Botulism in the United States: a clinical and epidemiologic review. Ann Intern Med 1998;129:221–8.
Sobel J. Botulism. Clin Infect Dis 2005;41:1167–73.
Sobel J, Tucker N, McLaughlin J, Maslanka, S. Foodborne botulism in the United States, 1990–2000. Emerg Infect Dis 2004;10:1606–12.
Chlamydia trachomatis infection
CDC. Sexually transmitted disease surveillance, 2013. Atlanta, GA: US Department of Health and Human Services; 2014.
CDC. Sexually transmitted diseases treatment guidelines, 2015. MMWR Surveill Summ 2015;64(No. SS-3).
Satterwhite CL, Torrone E, Meites E, et al. Sexually transmitted infections among US women and men: prevalence and incidence estimates, 2008. Sex Transm Dis 2013;40:187–93.
Torrone E, Papp J, Weinstock H. Prevalence of Chlamydia trachomatis Genital Infection Among Persons Aged 14-39 Years—United States, 2007-2012. MMWR Morb Mort Wkly Rep 2014;63:834–8.
Cholera
Besser RE, Feikin DR, Eberhart-Phillips JE, Mascola L, Griffin PM. Diagnosis and treatment of cholera in the United States. Are we prepared? JAMA 1994;272:1203–5.
Loharikar A, Newton AE, Stroika S, et al. Cholera in the United States, 2001–2011: a reflection of patterns of global epidemiology and travel. Epidemiol Infect 2014;142:1–9.
Newton AE, Heiman KE, Schmitz A, et al. Cholera in United States associated with epidemic in Hispaniola. Emerg Infect Dis 2011;17:2166–8.
Siddique AK, Nair GB, Alam M, et al. El Tor cholera with severe disease: a new threat to Asia and beyond. Epidemiol Infect 2010;138:347–52.
Steinberg EB, Greene KD, Bopp CA, Cameron DN. Wells JG, Mintz ED. Cholera in the United States, 1995–2000: trends at the end of the twentieth century. J Infect Dis 2001;184:799–802.
Tappero J, Tauxe RV. Lessons learned during public health response to cholera epidemic in Haiti and the Dominican Republic. Emerg Infect Dis 2011;17:2087–93.
World Health Organization. Cholera, 2012. Wkly Epidemiol Rec 2013;88:321–336.
Coccidioidomycosis
Blair JE, Chang YH, Cheng MR, Vaszar LT, Vikram HR, Orenstein R, et al. Characteristics of patients with mild to moderate primary pulmonary coccidioidomycosis. Emerg Infect Dis 2014;20:983–90.
Sondermeyer G, Lee L, Gilliss D, Tabnak F, Vugia D. Coccidioidomycosis-associated hospitalizations, California, USA, 2000–2011. Emerg Infect Dis 2013;19:1590–7.
Nguyen C, Barker BM, Hoover S, et al. Recent advances in our understanding of the environmental, epidemiological, immunological, and clinical dimensions of Coccidioidomycosis. Clin Microbiol Rev 2013;26:505–25.
Cryptosporidiosis
CDC. DPDx—Laboratory identification of parasitic diseases of public health concern: Cryptosporidiosis. Atlanta, GA: US Department of Health and Human Services, CDC; 2013. Available at http://www.cdc.gov/dpdx/cryptosporidiosis/dx.html.
Hlavsa MC, Roberts VA, Kahler AM, et. al. Outbreaks of illness associated with recreational water — United States, 2011–2012. MMWR Morb Mort Wkly Rep 2015;64:668–72.
Painter JE, Hlavsa, MC Collier SA, et al. Cryptosporidiosis surveillance—United States, 2011–2012. MMWR Surveill Summ 2015;64(No. SS-3).
Roy SL, DeLong SM, Stenzel S, et al. Risk factors for sporadic cryptosporidiosis among immunocompetent persons in the United States from 1999 to 2001. J Clin Microbiol 2004;42:2944–51.
Yoder JS, Beach MJ. Cryptosporidium surveillance and risk factors in the United States. Exp Parasitol 2010;124:31–9.
Cyclosporiasis
Hall RL, Jones JL, Herwaldt BL. Surveillance for laboratory-confirmed sporadic cases of cyclosporiasis—United States, 1997–2008. MMWR Surveill Summ 2011;60(No. SS-2).
Hall RL, Jones JL, Hurd S, Smith G, Mahon BE, Herwaldt BL. Population-based active surveillance for Cyclospora infection—United States, Foodborne Diseases Active Surveillance Network (FoodNet), 1997–2009. Clin Infect Dis 2012;54(Suppl 5):S411–S17.
Herwaldt BL. Cyclospora cayetanensis: a review, focusing on the outbreaks of cyclosporiasis in the 1990s. Clin Infect Dis 2000;31:1040–57.
Herwaldt BL. The ongoing saga of U.S. outbreaks of cyclosporiasis associated with imported fresh produce: what Cyclospora cayetanensis has taught us and what we have yet to learn. In: Institute of Medicine. Addressing foodborne threats to health: policies, practices, and global coordination. Washington, DC: The National Academies Press;2006:85–115, 133–40.
Ortega YR, Sanchez R. Update on Cyclospora cayetanensis, a food-borne and waterborne parasite. Clin Microbiol Rev 2010;23:218–34.
Dengue fever
Simmons CP, Farrar JJ, Nguyen V, Wills B. Dengue. New Engl J Med 2012;366:1423–32.
Diptheria
Dewinter LM, Bernard KA, Romney MG. Human clinical isolates of Corynebacterium diphtheriae and Corynebacterium ulcerans collected in Canada from 1999 to 2003 but not fitting reporting criteria for cases of diphtheria. Clin Microbiol 2005;43:3447–9.
Tiwari TW, Wharton M. Diphtheria Toxoid (Chapter 12) In: Plotkin O, Orenstein W , Offitt P, eds. Vaccines 2013.
Wagner KS, Stickings P, White JM, et al. A review of the international issues surrounding the availability and demand for diphtheria antitoxin for therapeutic use. Vaccine 2009;28:14–20.
Wagner KS, White JM, Crowcroft NS, DeMartin S, Mann G, Efstratiou A. Diphtheria in the United Kingdom, 1986–2008: the increasing role of Corynebacterium ulcerans. Epidemiol Infect 2010;138:1519–30.
Wagner KS, White JM, Lucenko I, et al. Diphtheria in the postepidemic period, Europe, 2000–2009. Emerg Infect Dis 2012;18:217–25.
Zakikhany K, Efstratiou A. Diphtheria in Europe: current problems and new challenges. Future Microbiol 2012;7:595–607.
Ehrlichiosis and Anaplasmosis
Banatvala N, Griffin PM, Greene KD, et al. The United States prospective hemolytic uremic syndrome study: microbiologic, serologic, clinical, and epidemiologic findings. J Infect Dis 2001;183:1063–70.
CDC. Diagnosis and management of tickborne rickettsial diseases: Rocky Mountain spotted fever, ehrlichioses, and anaplasmosis—United States. MMWR Recomm Rep 2006;55(No. RR-4).
Dahlgren FS, Mandel EJ, Krebs JW, Massung RF, McQuiston JH. Increasing incidence of Ehrlichia chaffeensis and Anaplasma phagocytophilum in the United States, 2000–2007. Am J Trop Med Hyg 2011;85:124–31.
Dumler JS, Madigan JE, Pusterla N, Bakken JS. Ehrlichioses in humans: epidemiology, clinical presentation, diagnosis, and treatment. Clin Infect Dis 2007;45(Suppl 1):545–51.
Regan J, Matthias J, Green-Murphy A, et al. A confirmed Ehrlichia ewingii infection likely acquired through platelet transfusion. Clin Infect Dis 2013;56:E105–7.
Walker D. Rickettsiae and rickettsial infections: the current state of knowledge. Clin Infect Dis 2007;45(Suppl 1):539–44.
Giardiasis
Cantey PT, Roy S, Lee B, et al. Study of nonoutbreak giardiasis: novel findings and implications for research. Am J Med 2011;124:1175.e1–8.
Clinical and Laboratory Standards Institute. Procedures for the recovery and identification of parasites from the intestinal tract; approved guideline. CLSI document M28–A2 Second Edition ed. Wayne, PA: Clinical and Laboratory Standards Institute; 2005.
CDC. Surveillance for travel-related disease—GeoSentinel Surveillance System, United States, 1997–2011. MMWR Surveill Summ 2013;62(No. SS-3).
Drugs for parasitic infections. Treatment Guidel Med Lett 2010;8(suppl):e5.
Painter JE, Gargano JW, Collier SA, Yoder JS. Giardiasis Surveillance —United States, 2011-2012. MMWR Surveill Summ 2015;64(No. SS-3).
Saiman L, Aronson J, Zhou J, et al. Prevalence of infectious diseases among internationally adopted children. Pediatrics 2001;108:608–12.
Staat MA, Rice M, Donauer S, et al. Intestinal parasite screening in internationally adopted children: importance of multiple stool specimens. Pediatrics 2011;128:e613–22.
Gonorrhea
CDC. Sexually transmitted disease surveillance, 2013. Atlanta, GA: US Department of Health and Human Services; 2014.
CDC. Sexually transmitted diseases treatment guidelines, 2015. MMWR Recomm Rep 2015;64:(No. RR-3).
Torrone ES, Johnson RE, Tian LH, et al. Prevalence of Neisseria gonorrhoeae among persons 14 to 39 years of age, United States, 1999 to 2008. Sex Transm Dis 2013;40:202–5.
Haemophilus influenzae
Briere E, Jackson M, Shah S, et al. Haemophilus influenzae type b disease and vaccine booster dose deferral, United States, 1998–2009. Pediatrics 2012;130:1–7.
Briere EC, Rubin L, Moro PL, Cohn A, Clark T, Messonnier N. Prevention and control of Haemophilus influenzae type b disease: recommendations of the Advisory Committee on Immunization Practices (ACIP). MMWR Recomm Reop 2014;63(No. RR-1).
MacNeil JR, Cohn AC, Farley M, et al. Current epidemiology and trends in invasive Haemophilus influenzae disease—United States, 1989–2008. Clin Infect Dis 2011:53:1230–6.
Schuchat A, Messonnier NR. From pandemic suspect to the postvaccine era: the Haemophilus influenzae story. Clin Infect Dis 2007;44:817–9.
Hansen Disease (leprosy)
Britton WJ, Lockwood NJ. Leprosy. Lancet 2004;363:1209–19.
Bruce S, Schroeder TL, Ellner K, et al. Armadillo exposure and Hansen's disease: an epidemiologic survey in southern Texas. J Am Acad Dermatol 2000;43:223–8.
Hartzell JD, Zapor M, Peng S, Straight T. Leprosy: a case series and review. South Med J 2004;97:1252–6.
Hastings R, ed. Leprosy. 2nd ed. New York, NY: Churchill Livingstone; 1994.
Joyce MP, Scollard DM. Leprosy (Hansen's disease). In: Rakel RE, Bope ET, eds. Conn's current therapy 2004: latest approved methods of treatment for the practicing physician. 56th ed. Philadelphia, PA: Saunders; 2004:100–5.
Ooi WW, Moschella SL. Update on leprosy in immigrants in the United States: status in the year 2000. Clin Infect Dis 2001;32:930–7.
Scollard DM, Adams LB, Gillis TP, et al. The continuing challenges of leprosy. Clin Microbiol Rev 2006;19:338–81.
Hantavirus Pulmonary Syndrome
CDC. Hantavirus pulmonary syndrome—United States: updated recommendations for risk reduction. MMWR Recomm Rep 2002;51(No. RR-9).
Khan AS, Khabbaz RF, Armstrong LR, et al. Hantavirus pulmonary syndrome—the first 100 US cases. J Infect Dis 1996;173:1297–303.
Knust B, Rollin PE. Twenty-year summary of surveillance for human hantavirus infections, United States. Emerg Infect Dis 2013;19:1934–7.
MacNeil A, Ksiazek TG, Rollin PE. Hantavirus Pulmonary Syndrome, United States, 1993–2009. Emerg Infect Dis 2011;17:1195–201.
MacNeil A, Nichol ST, Spiropoulou CF. Hantavirus pulmonary syndrome. Virus Res 2011;162:138–47.
Hemolytic Uremic Syndrome
Gould L, Demma L, Jones TF, et al. Hemolytic uremic syndrome and death in persons with Escherichia coli O157:H7 infection, Foodborne Diseases Active Surveillance Network Sites, 2000–2006. Clin Infect Dis 2009;49:1480–5.
Mody RK, Luna-Gierke RE, Jones TF, et al. Infections in pediatric postdiarrheal hemolytic uremic syndrome: factors associated with identifying shiga toxin-producing Escherichia coli. Arch Pediatr Adolesc Med 2012;166:902–9.
Ong KL, Apostal M, Comstock N, et al. Strategies for surveillance of pediatric hemolytic uremic syndrome: Foodborne Diseases Active Surveillance Network (FoodNet), 2000–2007. Clin Infect Dis 2012;54(Suppl 5):424–31.
Tarr PI, Gordon CA, Chandler WL. Shiga toxin-producing Escherichia coli and haemolytic uraemic syndrome. Lancet 2005;365:1073–86.
Hepatitis
Bender TJ, Sharapov UM, Utah O, et al. Evaluation of Hepatitis B vaccine immunogenicity among assisted living facility residents vaccinated during an outbreak response—Virginia, 2010. Vaccine 2014;32:852–6.
Denniston MM, Jiles RB, Drobeniuc J, et al. Chronic Hepatitis C virus infection in the United States: National Health and Nutrition Examination Survey 2003 to 2010. Ann Intern Med 2014;160:293–300.
Gordon SC, Lamerato LE, Rupp LB, et al. Antiviral therapy for chronic Hepatitis B virus infection and development of hepatocellular carcinoma in a U.S. population, the Chronic Hepatits Cohort Study (CHeCS). Clin Gastroenterol Hepatol;2014;12:885–93.
Holmberg SD, Spradling PR, Moorman AC, Denniston MM. Hepatitis C in the United States. N Engl J Med 2013;368:1859–61.
Klevens RM, Liu S, Roberts H, Jiles RB, Holmberg SD. Estimating acute viral Hepatitis infections from nationally reported cases. Am J Public Health 2014;104:482–7.
Liu G, Holmberg SD, Kamili S, Xu F. (2014). Racial disparities in the proportion of current, unresolved Hepatitis C virus infections in the United States, 2003–2010. Dig Dis Sci 2014;59:1950–7.
Liu SJ, Iqbal K, Shallow S, et al. Characterization of chronic Hepatitis B cases among foreign-born persons in six population-based surveillance sites, United States 2001–2010. J Immigr Minor Health 2014;17:7–12.
Ly KN, Roberts H, Williams RE, et al. (2014). Hepatitis B vaccination for healthcare personnel in American Samoa: pre-implementation survey for policy decision. Epidemiol Infect 2014;142:2610–5.
Mahajan R, Xing J, Liu S, et al. Mortality among Persons in Care with Hepatitis C Virus Infection–The Chronic Hepatitis Cohort Study (CHeCS), 2006–2010. Clin Infect Dis 2014;58:1055–61.
Middleman AB, Baker CJ, Kozinetz CA, et al. Duration of protection after infant hepatitis B vaccination series. Pediatrics 2014;133:346.
Roberts HW, Utuama OA, Klevens M, Teshale E, Hughes E, Jiles R. The contribution of viral hepatitis to the burden of chronic liver disease in the United States. Am J Gastroenterol 2014;109:387–93.
Valdiserri RO, Khalsa J, Dan C, Holmberg S, et al. Confronting the emerging epidemic of Hepatitis C virus among young injection drug users. Am J Public Health 2014 [VOL:pages].
Vijayadeva V, Spradling P, Moorman A, et al. Hepatitis B virus testing and prevalence by country of origin among Asian/Pacific Islanders. Am J Manag Care 2014;20.
HIV Infection
CDC. Estimated HIV incidence in the United States, 2007–2010. HIV Surveillance Supplemental Report 2012;17(No.4). Available at http://www.cdc.gov/hiv/pdf/statistics_hssr_vol_17_no_4.pdf.
CDC. HIV Surveillance Report, 2012; vol. 24. Available at http://www.cdc.gov/hiv/library/reports/surveillance.
CDC. Monitoring selected national HIV prevention and care objectives by using HIV surveillance data—United States and 6 dependent areas, 2012. HIV Surveillance Supplemental Report 2014;19(No.3).
CDC. Revised surveillance case definitions for HIV infection among adults, adolescents, and children aged <18 months and for HIV infection and AIDS among children aged 18 months to <13 years—United States, 2008. MMWR Recomm Rep 2008;57(No. RR-10).
Cohen SM, Gray KM, Ocfemia MC, Johnson AS, Hall HI. The status of the National HIV Surveillance System, United States, 2013. Public Health Rep 2014;129:335–41.
Johnson AS, Hall HI, Hu X, Lansky A, Holtgrave DR, Mermin J. Trends in diagnoses of HIV infection in the United States, 2002–2011. JAMA 2014;312:432–4.
Influenza-Associated Pediatric Mortality
Bhat N, Wright JG, Broder KR, et al. Influenza-associated deaths among children in the United States, 2003–2004. N Engl J Med 2005;352:2559–67.
Blanton L, Peacock G, Cox CM, l Jhung, M Finelli, L, Moore C. Neurologic disorders among pediatric deaths associated with the 2009 pandemic influenza. Pediatrics 2012;130:390–6.
CDC. Update: Influenza-associated deaths reported among children aged <18 years—United States, 2003–04 influenza season. MMWR Morb Mort Wkly Rep 2004;52:1254–5.
CDC. Update: influenza-associated deaths reported among children aged <18 years—United States, 2003–04 influenza Season. MMWR Morb Mort Wkly Rep 2004;52:1286–8.
CDC. Mid-year addition of influenza-associated pediatric mortality to the list of nationally notifiable diseases, 2004. MMWR Morb Mort Wkly Rep 2004;53:951–2.
CDC. Prevention and control of influenza: recommendations of the Advisory Committee on Immunization Practices (ACIP). MMWR Morb Mort Wkly Rep 2011;60;1128–32.
Council of State and Territorial Epidemiologists (CSTE). Influenza-associated pediatric mortality, 2004. Atlanta, GA: Council of State and Territorial Epidemiologists; 2004. Available at http://www.cste.org/PositionStatementsResolutions2.htm.
CSTE. Position statement 04-ID-04: influenza-associated pediatric mortality 2004. Atlanta, GA: Council of State and Territorial Epidemiologists; 2004. Available at http://www.cste.org/ps/2004pdf/04-ID-04-final.pdf.
Cox CM, Blanton L, Dhara R, Brammer L, Finelli L. 2009 Pandemic influenza A (H1N1) deaths among children—United States, 2009–2010. Infect Dis 2011);52 (suppl 1):69–74.
Finelli L, Fiore A, Dhara R, et al. Influenza-associated pediatric mortality in the United States: increase of staphylococcus aureus coinfection. Pediatrics 2008;122:805–11.
Guarner J, Paddock CD, Shieh WJ, et al. Histopathologic and immunohistochemical features of fatal influenza virus infection in children during the 2003–2004 season. Clin Infect Dis 2006:43;132–4.
Peebles PJ, Dhara R, Brammer L, Fry AM, Finelli L. Influenza-associated mortality among children—United States: 2007–2008. Influenza and Other Respiratory Viruses 2011;5:25–31.
Quandelacy TM, Viboud C, Charu V, Lipsitch M, Goldstein E. Age- and sex-related risk factors for influenza-associated mortality in the United States between 1997–2007. Am J Epidemiol 2014);179:156–67.
Wong K, Jain S, Blanton L, Dhara R, Brammer L, Fry AM, Finelli L. Influenza-associated pediatric deaths in the United States, 2004–2012. Pediatrics 2013;132:796–804.
Invasive Pneumococcal Disease and Drug-Resistant Streptococcus pneumoniae
CDC. Antibiotic resistance threats in the United States, 2013. Available at http://www.cdc.gov/drugresistance/threat-report-2013.
CDC. Use of 13-valent pneumococcal conjugate vaccine and 23-Valent pneumococcal polysaccharide vaccine among children aged 6–18 years with immunocompromising conditions: recommendations of the Advisory Committee on Immunization Practices (ACIP). MMWR Morb Mort Wkly Rep 2013;62:521–4.
CDC. Use of 13-valent pneumococcal conjugate vaccine and 23-valent pneumococcal polysaccharide vaccine for adults with immunocompromising conditions: Recommendations of the Advisory Committee on Immunization Practices (ACIP). MMWR Morb Mort Wkly Rep 2012; 61;816–9.
Nuorti JP, Whitney CG. Prevention of pneumococcal disease among infants and children—use of 13-valent pneumococcal conjugate vaccine and 23-valent pneumococcal polysaccharide vaccine: recommendations of the Advisory Committee on Immunization Practices (ACIP). MMWR Recomm Rep 2010;59(No. RR-11).
Tomczyk S, Bennett NM, Stoecker C, et al. Use of 13-valent pneumococcal conjugate vaccine and 23-valent pneumococcal polysaccharide vaccine among adults aged ≥65 years: recommendations of the Advisory Committee on Immunization Practices (ACIP). MMWR Morb Mort Wkly Rep 2014;63:822–5.
Legionellosis
CDC. Legionellosis—United States, 2000–2009. MMWR Morb Mort Wkly Rep 2011;60:1083–6.
CDC. Surveillance for waterborne disease outbreaks associated with drinking water and other nonrecreational water—United States, 2009–20010. MMWR Morb Mort Wkly Rep 2013;62:714–20.
CDC. Surveillance for waterborne disease outbreaks and other health events associated with recreational water—United States, 2007–2008. MMWR Surveill Summ 2011;60(No. SS-12).
CDC. Surveillance for travel-associated legionnaires' disease—United States, 2005–2006. MMWR Morb Mort Wkly Rep 2007;56:1261–3.
European Centre for Disease Prevention and Control. Legionnaires disease in Europe, 2011. Stockholm, Sweden: ECDC; 2013. Available at http://ecdc.europa.eu/en/publications/publications/legionnaires-disease-in-europe-2011.pdf.
European Working Group on Legionella Infections. EWGLI technical guidelines for the investigation, control, and prevention of travel associated Legionnaires' disease. Stockholm, Sweden: ECDC; 2011. Available at http://ecdc.europa.eu/en/activities/surveillance/ELDSNet/ Documents/EWGLI-Technical-Guidelines.pdf.
Fields BS, Benson RF, Besser RE. Legionella and Legionnaires' disease: 25 years of investigation. Clin Microbiol Rev 2002;15:506–26.
Marston BJ, Lipman HB, Breiman RF. Surveillance for Legionnaires' disease: risk factors for morbidity and mortality. Arch Intern Med 1994;154:2417–22.
Neil K, Berkelman R. Increasing incidence of legionellosis in the United States: changing epidemiological trends. Clin Infect Dis 2008;47:591–9.
Listeriosis
Cartwright EJ, Jackson KA, Johnson SD, et al. Listeriosis Outbreaks and Associated Food Vehicles, United States, 1998–2008. Emerg Infect Dis 2013;19:1–9.
CDC. Vital signs: Listeria illnesses, deaths, and outbreaks—United States, 2009–2011. MMWR Morb Mort Wkly Rep 2013;62:448–52.
de Noordhout CM, Devleesschauwer B, Angulo FJ, et al. The global burden of listeriosis: a systematic review and meta-analysis. Lancet 2014;14:1027–8.
Jackson KA, Biggerstaff M, Tobin-D'Angelo M, et al. Multistate outbreak of Listeria monocytogenes associated with Mexican-style cheese made from pasteurized milk among pregnant, Hispanic women. J Food Prot 2011;74:949–53.
Jackson KA, Iwamoto M, Swerdlow DL. Pregnancy-associated listeriosis. Epidemiol Infect 2010;138:1503–9.
McCollum JT, Cronquist AB, Silk BJ, et al. Multistate outbreak of listeriosis associated with cantaloupe. N Engl J Med 2013;639:944–53.
Pouillot R, Hoelzer K, Jackson KA, et al. Relative risk of listeriosis in Foodborne Diseases Active Surveillance Network (FoodNet) sites according to age, pregnancy, and ethnicity. Clin Infect Dis 2012;54:S396–S404.
Scallan E, Hoekstra RM, Angulo FJ, et al. Foodborne illness acquired in the United States—major pathogens. Emerg Infect Dis 2011;17:7–15.
Silk BJ, Date KA, Jackson KA, et al. Invasive listeriosis in the Foodborne Diseases Active Surveillance Network (FoodNet), 2004–2009: Further targeted prevention needed for higher-risk groups. Clin Infect Dis 2012;54:S405–S410.
Silk BJ, McCoy MH, Iwamoto M, et al. Foodborne Listeriosis Acquired in Hospitals. Clin Infect Dis 2014;4:532–40.
Lyme disease
Bacon RM, Kugeler KJ, Mead PS. Surveillance for Lyme disease—United States, 1992–2006. MMWR Surveill Summ 2008;57(No. SS-10).
CDC. Caution regarding testing for Lyme disease. MMWR Morb Mort Wkly Rep 2005;54:125.
CDC. Concerns regarding a new culture method for Borrelia burgdorferi not approved for the diagnosis of Lyme disease. MMWR Morb Mort Wkly Rep 2014;63:333.
CDC. Three Sudden Cardiac Deaths Associated with Lyme Carditis—United States, November 2012–July 2013. MMWR Morb Mort Wkly Rep 2013;62:993–6.
Hayes EG, Piesman J. How can we prevent Lyme disease? N Engl J Med 2003;348:2424–30.
Hinckley AF, Connally NP, Meek JI, et al. Lyme disease testing by large commercial laboratories in the United States. Clin Infect Dis 2014;59:676–81.
Stafford KC III. Tick management handbook: an integrated guide for homeowners, pest control operators, and public health officials for the prevention of tick-associated disease. New Haven, CT: Connecticut Agricultural Experiment Station; 2004. Available at http://www.cdc.gov/lyme/resources/index.html.
Wormser GP, Dattwyler RJ, Shapiro ED, et al. The clinical assessment, treatment, and prevention of Lyme disease, human granulocytic, anaplasmosis, and babesiosis: clinical practice guidelines by the Infectious Disease Society of America. Clin Infect Dis 2006;43:1089–134.
Malaria
Abanyie FA, Agguin PM, Gutman J. State of malaria diagnostic testing at clinical laboratories in the United States, 2010: a nationwide survey. Malar J 2011;10:340.
Cullen KA, Arguin PM. Malaria surveillance—United States, 2011. MMWR Surveill Summ 2013;62(No. SS-5).
Jensenius M, Han PV, Schlagenhauf P, et al. Acute and potentially life-threatening tropical diseases in western travelers—a GeoSentinel multicenter study, 1996–2011. Am J Trop Med 2013;88:397–404.
Krause G, Schoneberg I, Altmann D, Stark K. Chemoprophylaxis and malaria death rates. Emerg Infect Dis 2006;12:447–51.
Measles
CDC. Prevention of measles, rubella, congenital rubella syndrome, and mumps, 2013: summary recommendations of the Advisory Committee on Immunization Practices (ACIP). MMWR Recomm Rep 2013;62(No. RR-4).
Papania MJ, Wallace GS, Rota PA, et al. Elimination of endemic measles, rubella, and congenital rubella syndrome from the western hemisphere: the US experience. JAMA Pediatr 2014;168:148–55.
Meningococcal disease
CDC. Prevention and control of meningococcal disease: recommendations of the Advisory Committee on Immunization Practices (ACIP). MMWR Recomm Rep 2013;62(No.RR-2).
Cohn AC, MacNeil JR, Harrison LH, et al. Changes in Neisseria meningitidis disease epidemiology in the United States, 1998–2007: implications for prevention of meningococcal disease. Clin Infect Dis 2010:50:184–91.
Rosenstein NE, Perkins BA, Stephens DS, et al. Meningococcal disease. N Engl J Med 2001;334:1378–88.
Mumps
Fiebelkorn AP, Lawler J, Curns AT, Brandeburg C, Wallace GS. Mumps postexposure prophylaxis with a third dose of measles-mumps-rubella vaccine, Orange County, New York, USA. Emerg Infect Dis 2013;19:1411–7.
Fiebelkorn AP, Rosen JB, Brown C, et al. Environmental factors potentially associated with mumps transmission in Yeshivas during a mumps outbreak among highly vaccinated students Brooklyn, New York, 2009–2010. Human Vaccines & Immunotherapeutics 2013;9:195–200.
Novel influenza A virus
CDC. Antibodies cross-reactive to influenza A (H3N2) variant virus and impact of 2010–11 seasonal influenza vaccination on cross-reactive antibodies—United States. MMWR Morb Mort Wkly Rep 2012;61:237–41.
Duchatez MF, Hause B, Stigger-Rosser E, et al. Multiple reassortment between pandemic (H1N1) 2009 and endemic influenza viruses in pigs, United States. Emerg Infect Dis 2011;17:1624–9.
Epperson S, Jhung M, Richards S, et al. Human infections with influenza A (H3N2) variant virus in the United States, 2011–12. Clin Infect Dis 2013;57:S4–S11.
Jhung MA, Epperson S, Biggerstaff M, et al. Outbreak of variant influenza A (H3N2) virus in the United States. Clin Infect Dis 2013;57:1703–12.
Myers KP, Olsen CW, Gray GC. Cases of swine influenza in humans: a review of the literature. Clin Infect Dis 2007;44:1084–8.
Olsen CW. The emergence of novel swine influenza viruses in North America. Virus Res 2002;85:199–210.
Shinde V, Bridges CB, Uyeki TM, et al. Triple-reassortant swine influenza A (H1) in humans in the United States, 2005–2009. N Engl J Med 2009;360:2616–25.
Vincent AL, Ma W, Lager KM, et al. Swine influenza viruses: a North American perspective. Adv Virus Res 2008;72:127–54.
Vincent AL, Swenson SL, Lager KM, et al. Characterization of an influenza A virus isolated from pigs during an outbreak of respiratory disease in swine and people during a county fair in the United States. Vet Microbiol 2009;137:51–9.
Pertussis
CDC. Pertussis Epidemic—Washington, 2012. MMWR Morb Mort Wkly Rep 2012;61;517–22.
CDC. Updated recommendations for use of tetanus toxoid, reduced diphtheria toxoid and acellular pertussis (Tdap) vaccine in adults aged 65 years and older—Advisory Committee on Immunization Practices (ACIP), 2012. MMWR Morb Mort Wkly Rep 2012;61;468–70.
CDC. Updated recommendations for use of tetanus toxoid, reduced diphtheria toxoid, and acellular pertussis vaccine (Tdap) in pregnant women—Advisory Committee on Immunization Practices (ACIP), 2012. MMWR Morb Mort Wkly Rep 2013;62;131–5.
Clark TA, Messonnier NE, Hadler SC. Pertussis control: time for something new? Trends Microbiol 2012;20:211–3.
Misegades LK, Winter K, Harriman K, et al. Association of childhood pertussis with receipt of 5 doses of pertussis vaccine by time since last vaccine dose, California, 2010. JAMA 2012;308:2126–32.
Plague
CDC. Human plague—four states, 2006. MMWR Morb Mort Wkly Rep 2006;55:940–3.
Dennis DT, Gage KL, Gratz N, Poland JD, Tikhomirov E. Plague manual: epidemiology, distribution, surveillance, and control. Geneva, Switzerland: World Health Organization; 1999.
Gould LH, Pape J, Ettestadt P, et al. Dog-associated risk factors for human plague. Zoonoses Public Health 2008;55:448–54.
Inglesby TV, Dennis DT, Henderson DA, et al. Plague as a biological weapon: medical and public health management. Working Group on Civilian Defense. JAMA 2000;283:2281–90.
Tourdjman M, Ibraheem M, Brett M, et al. Misidentification of Yersinia pestis by automated systems resulting in delayed diagnosis of human plague infections—Oregon and New Mexico, 2010–2011. Clin Infect Dis 2012;55:58–60.
Polio
Alexander JP, Wallace G, Wassilak SG. Poliomyelitis. In: The yellow book: CDC health information for international travel, 2012. New York, NY: Oxford University Press; 2012.
Q Fever
Anderson A, Bijlmer H, Fournier PE, et al. Diagnosis and management of Q Fever—United States, 2013 recommendations from CDC and the Q Fever working group. MMWR Recom Rep 2013;62(No. RR-3).
Angelakis E, Raoult D. Q fever. Vet Micro 2010;140:297–309.
Kersh GJ, Fitzpatrick KA, Self JS, et al. Presence and persistence of Coxiella burnetii in the environments of goat farms associated with a Q fever outbreak. Appl Environ Microbiol 2013;79:1697–703.
McQuiston JH, Holman RC, McCall CL, et al. National surveillance and the epidemiology of Q fever in the United States, 1978–2004. Am J Trop Med Hyg 2006;75:36–40.
Parker N, Barralet J, Bell A. Q fever. Lancet 2006;367:679–88.
Tissot-Dupont D, Raoult D. Q fever. Infect Dis Clin North Am 2008;22:505–14.
Rabies
CDC. Compendium of animal rabies prevention and control, 2011: National Association of State Public Health Veterinarians, Inc. MMWR Recomm Rep 2011;60(No. RR-6).
CDC. Human rabies prevention—United States, 2008: recommendation of the Advisory Committee on Immunization Practices (ACIP). MMWR Recomm Rep 2008;57(No. RR-3).
CDC. Use of a reduced (4-dose) vaccine schedule for postexposure prophylaxis to prevent human rabies: recommendations of the Advisory Committee on Immunization Practices. MMWR Recomm Rep 2010;59(No. RR-2).
Rubella, Congenital Rubella Syndrome
CDC. Three cases of congenital rubella syndrome in the postelimination era—Maryland, Alabama, and Illinois, 2012. MMWR Morb Mort Wkly Rep 2013;62:226–9.
Salmonellosis
Chai SJ, White PL, Lathrop SL, et al. Salmonella enterica serotype Enteritidis: increasing incidence of domestically acquired infections. Clin Infect Dis 2012;54(Suppl 5):488–97.
Gaffga NH, Barton Behravesh C, Ettestad PJ, et al. Outbreak of salmonellosis linked to live poultry from a mail-order hatchery. N Engl J Med 2012;366:2065–73.
Guo C, Hoekstra RM, Schroeder CM, et al. Application of Bayesian techniques to model the burden of human salmonellosis attributable to US food commodities at the point of processing: adaptation of a Danish model. Foodborne Pathog Dis 2011;8:509–16.
Jackson BR, Griffin PM, Cole D, Walsh KA, Chai SJ. Outbreak-associated Salmonella enterica serotypes and food Commodities, United States, 1998–2008. Emerg Infect Dis 2013;19:1239–44.
Jones TF, Ingram LA, Cieslak PR, et al. Salmonellosis outcomes differ substantially by serotype. J Infect Dis 2008;198:109–14.
Medalla F, Hoekstra RM, Whichard JM, et al. Increase in resistance to ceftriaxone and nonsusceptibility to ciprofloxacin and decrease in multidrug resistance among Salmonella strains, United States, 1996–2009. Foodborne Pathog Dis 2013;10:302–9.
Painter JA, Hoekstra RM, Ayers T, et al. Attribution of foodborne illnesses, hospitalizations, and deaths to food commodities by using outbreak data, United States, 1998–2008. Emerg Infect Dis 2013;19:407–15.
Scallan E, Mahon B, Hoekstra RM, Griffin PM. Estimates of illnesses, hospitalizations and deaths caused by major bacterial enteric pathogens in young children in the United States. Ped Infect Dis J 2013;32:217–21.
Shiga toxin-producing Escherichia coli (STEC)
Brooks JT, Sowers EG, Wells JB, et al. Non-O157 Shiga toxin-producing Escherichia coli infections in the United States, 1983–2002. J Infect Dis 2005;192:1422–9.
Cronquist AB, Mody RK, Atkinson R, Besser J, Tobin D'Angelo M, Hurd S, Robinson T, Nicholson C, Mahon BE. Impacts of culture-independent diagnostic practices on public health surveillance for bacterial enteric pathogens. Clin Infect Dis 2012;54(Suppl 5):432–9.
Gould LH, Mody RK, Ong KL, et al. Increased recognition of non-O157 Shiga toxin-producing Escherichia coli infections in the United States during 2000–2010: epidemiologic features and comparison with E. coli O157 infections. 2013. Foodborne Pathogens and Disease 2013;10:453–60.
Hale CR, Scallan E, Cronquist AB, et al. Estimates of enteric illness attributable to contact with animals and their environments in the United States. Clin Infect Dis 2012;54(Suppl 5):472–9.
Jones TF, Gerner-Smidt P. Nonculture diagnostic tests for enteric diseases. Emerg Infect Dis 2012;18:513–4.
Mody RK, Luna-Gierke RE, Jones TF, et al. Infections in pediatric postdiarrheal hemolytic uremic syndrome: factors associated with identifying shiga toxin-producing Escherichia coli. Arch Pediatr Adolesc Med 2012;166:902–9.
Tarr PI, Gordon CA Chandler WL. Shiga-toxin-producing Escherichia coli and haemolytic uraemic syndrome. Lancet 2005;365:1073–86.
Shigellosis
Arvelo W, Hinkle CJ, Nguyen TA, et al. Transmission risk factors and treatment of pediatric shigellosis during a large daycare center-associated outbreak of multidrug resistant Shigella sonnei: implications for the management of shigellosis outbreaks among children. Pediatr Infect Dis J 2009;976–80.
CDC. Notes from the field: emergence of Shigella flexneri 2a resistant to ceftriaxone and ciprofloxacin—South Carolina, October 2010. MMWR Morb Mortal Wkly Rep 2010;59:1619.
CDC. Outbreaks of multidrug-resistant Shigella sonnei gastroenteritis associated with day care centers—Kansas, Kentucky, and Missouri, 2005. MMWR Morb Mortal Wkly Rep 2006;55:1068–71.
CDC. Outbreak of infections caused by Shigella sonnei with decreased susceptibility to azithromycin—Los Angeles, California, 2012. MMWR Morb Mortal Wkly Rep 2013;62:171.
Folster JP, Pecic G, Bowen A, et al. Decreased susceptibility to ciprofloxacin among Shigella isolates in the United States, 2006 to 2009. Antimicrob Agents Chemother 2011;55:1758–60.
Garrett V, Bornschlegel K, Lange D, et al. A recurring outbreak of Shigella sonnei among traditionally observant Jewish children in New York City: the risks of daycare and household transmission. Epidemiol Infect 2006;134:1231–6.
Gupta A, Polyak CS, Bishop RD, Sobel J, Mintz ED. Laboratory-confirmed shigellosis in the United States, 1989–2002: epidemiologic trends and patterns. Clin Infect Dis 2004;38:1372–7.
Haley CC, Ong KL, Hedberg K, et al. Risk factors for sporadic shigellosis, FoodNet 2005. Foodborne Pathog Dis 2010;7:741–7.
Howie RL, Folster JP, Bowen A, et al. Reduced azithromycin susceptibility in Shigella sonnei, United States. Microb Drug Resist 2010;16:245–8.
Nygren B, Schilling K, Blanton E, Silk B, Cole D, Mintz E. Foodborne outbreaks of shigellosis in the USA, 1998–2008. Epidemiol Infect 2012;140:1–9.
Shane A, Crump J, Tucker N, Painter J, Mintz E. Sharing Shigella: risk factors and costs of a multi-community outbreak of shigellosis. Arch Pediatr Adolesc Med 2003;157:601–3.
Wallender EK, Ailes EC, Yoder JS, Roberts VA, Brunkard JM. Contributing Factors to Disease Outbreaks Associated with Untreated Groundwater. Ground Water 2013;52:886–97.
Spotted Fever Rickettsiosis (Including Rocky Mountain Spotted Fever)
CDC. Diagnosis and management of tickborne rickettsial diseases: Rocky Mountain spotted fever, ehrlichioses, and anaplasmosis—United States. MMWR Recomm Rep 2006;55(No. RR-4).
Dahlgren FS, Holman RC, Paddock CD, Callinan LS, McQuiston JH. Fatal Rocky Mountain spotted fever in the United States, 1999–2007. Am J Trop Med Hyg 2012;86:713–9.
Demma LJ, Traeger MS, Nicholson WL, et al. Rocky Mountain spotted fever from an unexpected tick reservoir in Arizona. N Engl J Med 2005;353:587–94.
Openshaw JJ, Swerdlow DL, Krebs JW, et al. Rocky Mountain spotted fever in the United States, 2000–2007: interpreting contemporary increases in incidence. Am J Trop Med Hyg 2010;83:174–82.
Walker D. Rickettsiae and rickettsial infections: the current state of knowledge. Clin Infect Dis 2007;45(Suppl 1):539–44.
Zientek J, Dahlgren FS, McQuiston JH, Regan J. Self-reported treatment practices by healthcare providers could lead to death from Rocky Mountain spotted fever. J Pediatr 2013;2014:416–8.
Streptococcal Toxic Shock Syndrome
CDC. 2013. Active Bacterial Core Surveillance Report, Emerging Infections Program Network, Group A Streptococcus, 2013—provisional. Available at http://www.cdc.gov/abcs/reports-findings/survreports/gas13.pdf.
CDC. Investigating clusters of group A streptococcal disease. Atlanta, GA: US Department of Health and Human Services, CDC; 2009. Available at www.cdc.gov/strepAcalculator.
Dale JB, Fischetti VA, Carapatis JR, et al. Group A streptococcal vaccines: Paving a path for accelerated development. Vaccine 2013;31S:B216–22.
O'Loughlin RE, Roberson A, Cieslak PR, et al. The epidemiology of invasive group A streptococcal infections and potential vaccine implications, United States, 2000–2004. Clin Infect Dis 2007;45:853–62.
Prevention of Invasive Group A Streptococcal Infections Workshop Participants. Prevention of invasive group A streptococcal disease among household contacts of case patients among postpartum and postsurgical patients: recommendations from the Centers for Disease Control and Prevention. Clin Infect Dis 2002;35:950–9.
Syphilis, Congenital
CDC. Sexually transmitted disease surveillance, 2013. Atlanta, GA: US Department of Health and Human Services; 2014.
CDC. Sexually transmitted diseases treatment guidelines, 2015. MMWR Recomm Rep 2015;64(No. RR-3).
Syphilis, Primary and Secondary
CDC. Sexually transmitted disease surveillance, 2013. Atlanta, GA: US Department of Health and Human Services; 2014.
CDC. Sexually transmitted diseases treatment guidelines, 2015. MMWR Recomm Rep 2015;64(No. RR-3).
CDC. Primary and secondary syphilis—United States, 2005–2013. MMWR Morb Mort Wkly Rep 2014;63:402–6.
Su JR, Beltrami JF, Zaidi AA, Weinstock HS. Primary and secondary syphilis among black and Hispanic men who have sex with men: case report data from 27 states. Ann Intern Med 2011;155:145–51.
Tetanus
CDC. Tetanus—Puerto Rico, 2002. MMWR Morb Mort Wkly Rep 2002;51:613–5.
Khetsuriani N, Zakikhany K, Jabirov S, et al. Seroepidemiology of diphtheria and tetanus among children and young adults in Tajikistan: nationwide population-based survey, 2010. Vaccine 2013;31:4917–22.
McQuillan GM, Kruszon-Moran D, Deforest A, Chu SY, Wharton M. Serologic immunity to diphtheria and tetanus in the United States. Ann Intern Med 2002;136:660–6.
Pascual FB, McGinley EL, Zanardi LR, Cortese MM, Murphy TV. Tetanus surveillance—United States, 1998–2000. MMWR Surveill Summ 2003;52(No. SS-3).
Roper M, Wassilak S, Tiwari T, Orenstein W. Tetanus Toxoid (Chapter 33) In: Plotkin O, Orenstein W, Offitt P, eds. Vaccines 2013.
Trichinellosis
CDC. Trichinellosis caused by consumption of wild boar meat—Illinois, 2013. MMWR Morb Mort Wkly Rep 2013;63:451.
Gamble HR, Bessonov AS, Cuperlovic K, et al. International Commission on Trichinellosis: recommendations on methods for the control of Trichinella in domestic and wild animals intended for human consumption. Vet Parasitol 2000;93:393–408.
Gottstein B, Pozio E, Nockler K. Epidemiology, diagnosis, treatment, and control of trichinellosis. Clin Microbiol Rev 2009;22:127–45.
Holzbauer M, Agger W, Hall R, et al. Outbreak of Trichinella spiralis infections associated with a wild boar hunted at a game farm in Iowa. Clin Infect Dis 2014;59:1750–6.
Kennedy ED, Hall RL, Montgomery SP, et al. Trichinellosis surveillance—United States, 2002–2007. In: Surveillance Summaries, December 4, 2009. MMWR Surveill Summ 2009;58(No. SS-9).
Roy SL, Lopez AS, Schantz PM. Trichinellosis surveillance—United States, 1997–2001. MMWR Surveill Summ 2003;52(No. SS-6).
Tuberculosis
Alami NN, Courtney MY, Roque M, et al. Trends in tuberculosis—United States, 2013. MMWR Morb Mortal Wkly Rep, 2014;63:229–33.
Manangan LP, Tryon C, Magee E, Miramones R. Innovative quality-assurance strategies for tuberculosis surveillance in the United States. Tuberc Res Treat 2012:481230.
CDC. Reported tuberculosis in the United States, 2013. Atlanta, GA: U.S. Department of Health and Human Services, CDC, October 2014.
Woodruff RS, Winston CA, Miramontes R. Predicting U.S. tuberculosis case counts through 2020. PLoS One 2013;8:e65276.
Tularemia
CDC. Tularemia—United States, 2001–2010. MMWR Morb Mort Wkly Rep 2013;62:963–6.
CDC. Tularemia—United States, 1990–2000. MMWR Morb Mort Wkly Rep 2002;51:182–4.
Dennis DT, Inglesby TV, Henderson DA, et al. Tularemia as a biological weapon: medical and public health management. JAMA 2001;285:2763–73.
Kugeler KJ, Mead PS, Janusz AM, et al. Molecular epidemiology of Francisella tularensis in the United States. Clin Infect Dis 2009;48:863–70.
Tarnvik A. WHO guidelines on tularemia. Vol. WHO/CDS/EPR/2007.7. Geneva, Switzerland: World Health Organization; 2007.
Weber IB, Turabelidze G, Patrick S, et al. Clinical recognition and management of tularemia in Missouri: a retrospective records review of 121 cases. Clin Infect Dis 2012;55:1283–90.
Typhoid Fever
Loharikar A, Newton A, Rowley P. et al. Typhoid fever outbreak associated with frozen mamey pulp imported from Guatemala to the western United States, 2010. Clin Infect Dis 2012;55:61–6.
Lynch MF, Blanton EM, Bulens S, et al. Typhoid fever in the United States, 1999–2006. JAMA 2009;302:859–65.
Mahon BE, Newton AE, Mintz ED. Effectiveness of typhoid vaccination in US travelers. Vaccine 2014;32:3577–9.
Olsen SJ, Bleasdale SC, Magnano AR, et al. Outbreaks of typhoid fever in the United States, 1960–1999. Epidemiol Infect 2003;130:13–21.
Steinberg EB, Bishop RB, Dempsey AF, et al. Typhoid fever in travelers: who should be targeted for prevention? Clin Infect Dis 2004;39:186–91.
Varicella
Bialek SR, Perella D, Zhang J, et al. Impact of a routine two-dose varicella vaccination program on varicella epidemiology. Pediatrics 2013;132:1134–40.
CDC. Evolution of varicella surveillance—selected states, 2000–2010. MMWR Morb Mort Wkly Rep 2012;61:609–12.
CDC. Prevention of varicella: recommendations of the Advisory Committee on Immunization Practices (ACIP). MMWR Recomm Rep 2007;56(No. RR-4).
Lopez AS, Zhang J, Brown C, Bialek S. Varicella-related hospitalizations in the United States, 2000–2006: the 1-dose varicella vaccination era. Pediatrics 2011;127:238–45.
Marin M, Zhang JX, Seward JF. Near elimination of varicella deaths in the US after implementation of the vaccination program. Pediatrics 2011;128:214–20.
Vibriosis
Daniels NA, MacKinnon L, Bishop R, et al. Vibrio parahaemolyticus infections in the United States, 1973–1998. J Infect Dis 2000;181:1661–6.
Dechet A, Yu PA, Koram N, Painter J. Nonfoodborne Vibrio infections: an important cause of morbidity and mortality in the United States, 1997– 2006. Clin Infect Dis 2008;46:970–6.
McLaughlin JB, DePaola A, Bopp CA, et al. Outbreak of Vibrio parahaemolyticus gastroenteritis associated with Alaskan oysters. N Engl J Med 2005;353:1463–70.
Newton AE, Garrett N, Stroika SG, Halpin JL, Turnsek M, Mody RK. Increase in Vibrio parahaemolyticus Infections Associated with Consumption of Atlantic Coast Shellfish—2013. MMWR Morb Mort Wkly Rep 2014;63:335–6.
Newton A, Kendall M, Vugia DJ, Henao OL, Mahon BE. Increasing rates of vibriosis in the United States, 1996–2010: review of surveillance data from 2 systems. Clin Infect Dis. 2012;54(Suppl 5):391–5.
Shapiro RL, Altekruse S, Hutwagner L, et al. The role of Gulf Coast oysters in warmer months in Vibrio vulnificus infections in the United States, 1998–1996. J Infect Dis 1998;178:752–9.
Tobin-D'Angelo M, Smith AR, Bulens SN, et al. Severe diarrhea caused by cholera toxin-producing Vibrio cholerae serogroup O75 infections acquired in the southeastern United States. Clin Infect Dis 2008;47:1035–40.
Vugia DJ, Tabnak F, Newton AE, Hernandez M, Griffin PM. Impact of 2003 state regulation on raw oyster–associated Vibrio vulnificus illnesses and deaths, California, USA. Emerg Infect Dis 2013;19:1276–80.
Viral Hemorrhagic Fevers
Amorosa V, MacNeil A, McConnell R, et al. Imported Lassa fever, Pennsylvania, USA, 2010. Emerg Infect Dis 2010;16:1598–600.
CDC. Imported case of Marburg Hemorrhagic fever—Colorado, 2008. MMWR Morb Mort Wkly Rep 2009;58:1377–81.
Ergonul O. Crimean-Congo Haemorrhagic Fever. Lancet 2006;6:203–14.
Fichet-Calvet E, Rogers DJ. Risk maps of Lassa fever in West Africa. PLoS Negl Trop Dis 2009;3:e388.
Rollin PE, Nichol ST, Zaki S, Ksiazek TG. Arenaviruses and filoviruses. In: Murray PR, Baron EJ, Landry ML, Jorgensen JH, Pfaller MA, eds. Manual of clinical microbiology, 9th edition. Washington, DC: ASM Press; 2007:1510–22.