Persons using assistive technology might not be able to fully access information in this file. For assistance, please send e-mail to: mmwrq@cdc.gov. Type 508 Accommodation and the title of the report in the subject line of e-mail.
Tularemia — United States, 2001–2010
Tularemia is a rare but potentially serious bacterial zoonosis that has been reported from all U.S. states except Hawaii. The etiologic agent, Francisella tularensis, is highly infectious and can be transmitted through arthropod bites, direct contact with infected animal tissue, inhalation of contaminated aerosols, and ingestion of contaminated food or water (1). F. tularensis has been designated a Tier 1 select agent because it meets several criteria, including low infectious dose, ability to infect via aerosol, and a history of being developed as a bioweapon (2). This report summarizes tularemia cases reported to CDC during 2001–2010 via the National Notifiable Diseases Surveillance System (NNDSS) and compares the epidemiology of these cases with those reported during the preceding decade. During 2001–2010, a total of 1,208 cases were reported (median: 126.5 cases per year; range: 90–154). Incidence was highest among children aged 5–9 years and men aged >55 years. Clinicians and public health practitioners should be familiar with the current epidemiology and clinical features of tularemia to identify and adequately treat individual cases and recognize unusual patterns that might signal an outbreak or bioterrorism event.
In humans, F. tularensis causes distinct clinical syndromes depending on the route of exposure. Percutaneous inoculation typically produces ulceroglandular tularemia, characterized by a cutaneous ulcer at the site of inoculation and tender regional lymphadenopathy. A less common presentation after percutaneous inoculation is glandular tularemia, in which patients develop regional lymphadenopathy without ulcer. Inhalation of F. tularensis can result in a primary pneumonia, whereas ingestion causes oropharyngeal disease consisting of tonsillitis or pharyngitis with cervical lymphadenopathy. Other forms of tularemia include oculoglandular (infection of the eye) and typhoidal (fever without localizing signs) (3). Certain strains of F. tularensis subspecies tularensis (also known as type A) are associated with more severe disease and a greater risk for death (4,5). Mortality is less than 2% overall but ranges up to 24% depending on the strain (1,4).
For national surveillance purposes, a confirmed case of tularemia is defined as clinically compatible illness with either a four-fold or greater change in serum antibody titer to F. tularensis antigen or isolation of F. tularensis from a clinical specimen. A probable case is defined as clinically compatible illness with either a single elevated antibody titer to F. tularensis antigen or detection of F. tularensis in a clinical specimen by fluorescent assay (6). In this report, incidence is calculated using 2005 census population estimates.
A total of 1,208 cases of tularemia were reported via NNDSS during 2001–2010. The median number of cases per year was 126.5, with a range of 90–154 cases per year. Of these 1,208 reported cases, 64% were categorized as confirmed and 35% as probable (Figure 1). Median age of patients was 39 years (range: 1–92 years), and 68% were male. Average annual incidence was 0.041 cases per 100,000 persons. By age group and sex, annual incidence was highest among children aged 5–9 years (0.071) and among men aged 65–69 years (0.11) (Figure 2). Race was recorded for 887 patients (73%). Among these, 86% were white, 9% were American Indian/Alaska Native, and 3% were black. Ethnicity was recorded for 718 patients (59%), of whom 5% were Hispanic. The highest annual incidence by race was among American Indians/Alaska Natives (0.3 per 100,000 persons).
Cases were reported from 47 states (Figure 3). Six states accounted for 59% of reported cases: Missouri (19%), Arkansas (13%), Oklahoma (9%), Massachusetts (7%), South Dakota (5%), and Kansas (5%). Among the 10 states with the highest incidence of tularemia, all but Massachusetts were located in the central or western United States (Table).
Tularemia cases were reported from 505 U.S. counties (16%) during 2001–2010. County of residence was available for 1,198 patients (99%), although in some cases this might not have been the county of exposure. Among these, 53% of patients resided in counties classified as rural by CDC National Center for Health Statistics' Urban-Rural Classification Scheme for Counties (7), although rural counties accounted for only 17% of the U.S. population in 2006. The county with the highest annual incidence was Dukes County (Martha's Vineyard and the Elizabeth Islands), Massachusetts (67 cases; 43 per 100,000 persons). Cases in Dukes County were reported consistently during the 10-year period (range: 2–16 cases per year), with substantial increases in 2005 (11 cases), 2006 (10 cases), and 2008 (16 cases). Additional counties with high incidence rates were Buffalo County, South Dakota (six cases; 29 per 100,000), and Shannon County, South Dakota (24 cases; 18 per 100,000).
The majority of cases (77%) occurred during May through September, consistent with peak arthropod activity and increased outdoor human activity. However, seasonal patterns varied by region. In the New England states, no cases occurred in the nonpeak winter months of December through March. In contrast, 20% of cases in the South Atlantic states, 15% in the East South Central states, and 14% in the Pacific states occurred from December through March.
The total number of cases reported during 2001–2010 was similar to the number reported during the 10-year period 1991–2000 (1,208 versus 1,216, respectively). Nevertheless, notable changes occurred in the number of cases reported from some individual states: Montana (72% decrease), Arkansas (42% decrease), South Dakota (29% decrease), Massachusetts (155% increase), Nebraska (120% increase), and Oklahoma (35% increase) (8).
Reported by
Christina Nelson, MD, Kiersten Kugeler, MPH, Jeannine Petersen, PhD, Paul Mead, MD, Div of Vector-Borne Diseases, National Center for Emerging and Zoonotic Infectious Diseases, CDC. Corresponding contributor: Christina Nelson, wje1@cdc.gov, 970-225-4259.
Editorial Note
During 2001–2010, the number and demographic features of reported tularemia cases were similar to those reported during the preceding decade. Nevertheless, several differences were noted between the two periods. The geographic distribution of reported cases was slightly less concentrated in the central states during 2001–2010, with a greater proportion of cases reported from the Northeast and the Pacific states of Washington and California than in previous years. In addition, four states that had not reported cases during 1991–2000 (Connecticut, New Hampshire, Vermont, and West Virginia) reported cases during 2001–2010. Further investigation is needed to determine whether the change in distribution was caused by alterations in reporting patterns, vector distribution, human behavior, or other factors.
Seasonal variations by region are likely attributable in part to climate differences, because states with milder climates have longer arthropod activity and thus extended periods of risk. Seasonal variations might also reflect, to some extent, hunting activities that can occur year-round, in contrast to landscaping and other outdoor recreational activities that are concentrated in the summer months. Hunting can result in human exposure to tularemia through direct contact with infected animals and ingestion of infected meat. Hunting of rabbits, which typically occurs in the fall and winter, might explain the higher proportion of winter cases in South Atlantic and East South Central states, where small game hunting is common (9).
In a previous surveillance report for the period 1990–2000, CDC recommended improving surveillance by increasing documentation of laboratory confirmation and collecting more detailed epidemiologic and clinical data (8). Documentation of laboratory confirmation has indeed improved; during 1990–2000, only 65% of case reports included documentation indicating whether they met the probable versus confirmed case definition, compared with 99% during 2001–2010. Although the amount of epidemiologic and clinical data collected through NNDSS has not changed, CDC does regularly request additional patient information from health departments to better characterize the disease.
The findings in this report are subject to at least two limitations. First, the tularemia cases described in this report might not be fully representative of all cases diagnosed in the United States because case ascertainment and reporting might be incomplete and differ by state. Second, missing data and small numbers limit statistical comparisons and interpretation.
Tularemia is not a common disease, but it continues to cause approximately 100 reported human cases annually in the United States and is a serious and potentially fatal disease. Although outbreaks do occur (10), the majority of reported tularemia cases in the United States are sporadic. Clinicians should consider tularemia in patients with a compatible clinical profile, particularly in children and elderly males with acute fever and regional lymphadenopathy. This report shows that the distribution of tularemia might be gradually changing; therefore, tularemia should be considered even in areas where it has rarely been reported.
State and local public health departments are encouraged to report tularemia cases in a timely manner and provide additional patient information, including exposure history, clinical syndrome, and outcome, to CDC when possible. Because the threat of bioterrorism remains, clinicians and health departments should remain vigilant; for example, an urban cluster of tularemia cases among persons without a common natural exposure could be the first sign of a bioterrorism attack.
Acknowledgments
State and local health departments.
References
- Dennis DT, Inglesby TV, Henderson DA, et al. Tularemia as a biological weapon: medical and public health management. JAMA 2001;285:2763–73.
- US Department of Health and Human Services. Possession, use, and transfer of select agents and toxins; biennial review. Fed Regist 2012;77(194).
- Eliasson H, Broman T, Forsman M, Bäck E. Tularemia: current epidemiology and disease management. Infect Dis Clin N Am 2006;20:289–311.
- Kugeler KJ, Mead PS, Janusz AM, et al. Molecular epidemiology of Francisella tularensis in the United States. Clin Infect Dis 2009;48:863–70.
- Staples JE, Kubota KA, Chalcraft LG, Mead PS, Petersen JM. Epidemiologic and molecular analysis of human tularemia, United States, 1964–2004. Emerg Infect Dis 2006;12:1113–8.
- CDC. Tularemia surveillance case definition. Atlanta, GA: US Department of Health and Human Services, CDC; 2013. Available at http://wwwn.cdc.gov/nndss/script/casedef.aspx?condyrid=880&datepub=1/1/1999%2012:00:00%20am.
- Ingram DD, Franco SJ. NCHS urban-rural classification scheme for counties. Vital Health Stat 2012;2(154).
- CDC. Tularemia—United States, 1990–2000. MMWR 2002;51:182–4.
- US Fish and Wildlife Service; US Census Bureau. 2006 national survey of fishing, hunting, and wildlife-associated recreation. Washington, DC: US Department of the Interior, US Fish and Wildlife Service; US Census Bureau, US Department of Commerce; 2008. Available at http://www.census.gov/prod/2008pubs/fhw06-nat.pdf.
- Calanan R, Rolfs R, Summers J, et al. Tularemia outbreak associated with outdoor exposure along the western side of Utah Lake, Utah, 2007. Public Health Rep 2010;125:870–6.
What is already known on this topic?
Tularemia is a bacterial zoonosis that can be acquired through various exposure routes. It has been reported in every state except Hawaii, but cases most commonly occur in central U.S. states. It is caused by Francisella tularensis, an organism classified as a Tier 1 select agent based on its potential use for bioterrorism.
What is added by this report?
The total number of tularemia cases reported via the National Notifiable Diseases Surveillance System during 2001–2010 did not differ from the number reported during the preceding decade. Geographic distribution was less centrally concentrated; 66% of northeastern states and two Pacific states reported more cases during 2001–2010 compared with 1991–2000. Although the majority of patients with tularemia (53%) resided in rural counties, a substantial proportion of patients (47%) resided in urban counties.
What are the implications for public health practice?
Although aspects of tularemia surveillance have improved, such as documentation of laboratory confirmation, underreporting and other limitations remain. It is important to maintain and enhance surveillance and collect detailed clinical information on each case to enhance understanding of the disease and elucidate the causes of recent epidemiologic shifts.
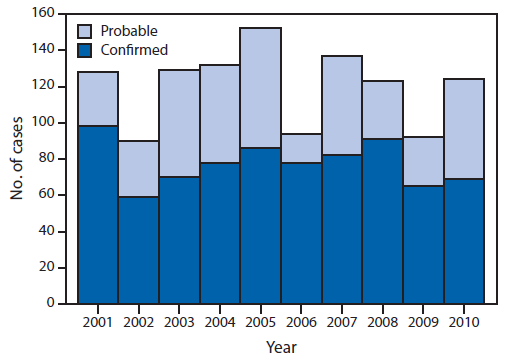
Alternate Text: The figure above shows the number of reported cases of tularemia, by case status and year, in the United States during 2001-2010. A total of 1,208 cases of tularemia were reported during 2001-2010. The median number of cases per year was 126.5, with a range of 90-154 cases per year. Of these 1,208 reported cases, 64% were categorized as confirmed and 35% as probable.
Alternate Text: The figure above shows the average annual incidence of tularemia, by age group and sex, in the United States during 2001-2010. Median age of patients was 39 years (range: 1-92 years), and 68% were male. Average annual incidence was 0.041 cases per 100,000 persons. By age group and sex, annual incidence was highest among children aged 5-9 years and among men aged >55 years.
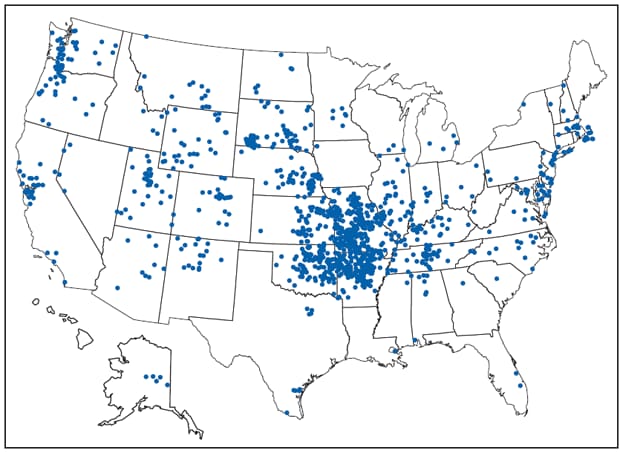
* One dot is placed randomly within county of residence for each reported case.
Alternate Text: The figure above shows reported cases of tularemia in the United States during 2001-2010. Cases were reported from 47 states. Six states accounted for 59% of reported cases: Missouri (19%), Arkansas (13%), Oklahoma (9%), Massachusetts (7%), South Dakota (5%), and Kansas (5%).
Use of trade names and commercial sources is for identification only and does not imply endorsement by the U.S. Department of
Health and Human Services.
References to non-CDC sites on the Internet are
provided as a service to MMWR readers and do not constitute or imply
endorsement of these organizations or their programs by CDC or the U.S.
Department of Health and Human Services. CDC is not responsible for the content
of pages found at these sites. URL addresses listed in MMWR were current as of
the date of publication.
All MMWR HTML versions of articles are electronic conversions from typeset documents.
This conversion might result in character translation or format errors in the HTML version.
Users are referred to the electronic PDF version (http://www.cdc.gov/mmwr)
and/or the original MMWR paper copy for printable versions of official text, figures, and tables.
An original paper copy of this issue can be obtained from the Superintendent of Documents, U.S.
Government Printing Office (GPO), Washington, DC 20402-9371;
telephone: (202) 512-1800. Contact GPO for current prices.
**Questions or messages regarding errors in formatting should be addressed to
mmwrq@cdc.gov.
