Persons using assistive technology might not be able to fully access information in this file. For assistance, please send e-mail to: mmwrq@cdc.gov. Type 508 Accommodation and the title of the report in the subject line of e-mail.
Giardiasis Surveillance — United States, 2009–2010
Corresponding author: Jonathan S. Yoder, MPH, Division of Foodborne, Waterborne, and Environmental Diseases, National Center for Emerging and Zoonotic Infectious Diseases, CDC. 1600 Clifton Rd, NE, Atlanta, GA 30333; Telephone: 404-718-4696; Fax: 404-929-1932; E-mail: jyoder@cdc.gov.
Abstract
Problem/Condition: Giardiasis is a nationally notifiable gastrointestinal illness caused by the protozoan parasite Giardia intestinalis.
Reporting Period: 2009–2010.
System Description: State, commonwealth, territorial, and two metropolitan health departments voluntarily report cases of giardiasis through CDC's National Notifiable Diseases Surveillance System.
Results: During 2009–2010, the total number of reported cases of giardiasis increased slightly from 19,403 for 2009 to 19,888 for 2010. During this period, 50 jurisdictions reported giardiasis cases. A larger number of case reports were received for children aged 1–9 years than with other age groups. The number of cases peaked annually during early summer through early fall.
Interpretation: Transmission of giardiasis occurs throughout the United States, with more frequent diagnosis or reporting occurring in northern states. However, state incidence figures should be compared with caution because surveillance capacity differs between states. Giardiasis is reported more frequently in young children, which might reflect increased contact with contaminated water or ill persons.
Public Health Action: Local and state health departments can use giardiasis surveillance data to better understand the epidemiologic characteristics and the disease burden of giardiasis in the United States, design efforts to prevent the spread of disease, and establish research priorities.
Introduction
Giardia intestinalis (also known as G. lamblia and G. duodenalis) is the most common intestinal parasite of humans identified in the United States (1). This flagellated protozoan causes a generally self-limited clinical illness (i.e., giardiasis) typically characterized by diarrhea, abdominal cramps, bloating, weight loss, and malabsorption; asymptomatic infection also occurs frequently (2–4). Case reports and epidemiologic studies have associated giardiasis with the development of chronic enteric disorders, allergies, chronic fatigue, and reactive arthritis (5–10).
Giardia infection is transmitted through the fecal-oral route and results from the ingestion of Giardia cysts through the consumption of fecally contaminated food or water or through person-to-person (or, to a lesser extent, animal-to-person) transmission (11). The cysts are infectious immediately upon being excreted in feces (12). The infectious dose is low; ingestion of 10 cysts has been reported to cause infection (12). Infected persons have been reported to shed 108–109 cysts in their stool per day and to excrete cysts for months (12–14). Effective therapies are available for patients with symptomatic giardiasis, including metronidazole, tinidazole, nitazoxanide, paromomycin, furazolidone, and quinacrine (15).
Giardiasis is often detected in travelers to areas where disease is endemic (16,17) and among internationally adopted children (18). Transmission can occur to close contacts of infected persons, including to children in childcare settings and their caregivers (14,19). Participation in backpacking, camping, and swimming, having contact with some animal species, and certain sexual practices might increase the risk for giardiasis (20).
Because Giardia cysts can be excreted intermittently, multiple stool collections (i.e., three stool specimens collected on separate days) increase test sensitivity (21). Use of concentration methods and trichrome staining might not be sufficient to identify Giardia because variability in the concentration of organisms in stool can make this infection difficult to diagnose. For this reason, fecal immunoassays that are more sensitive and specific should be used (22). Direct fluorescent antibody (DFA) testing is an extremely sensitive and specific detection method, and is considered the benchmark for accuracy by many laboratorians. Other immunodiagnostic kits that do not require microscopy (e.g., enzyme immunoassay [EIA] testing and rapid immunochromatographic cartridge assays) also are available (22); they do not take the place of routine ova and parasite examination and DFA.
In 1992, the Council of State and Territorial Epidemiologists assigned a reporting number for giardiasis (code 11570) to facilitate transmission of reported giardiasis data to CDC. Surveillance data for 1992–2008 have been published previously (23–26). Reporting of giardiasis as a nationally notifiable disease began in 2002. This report summarizes national giardiasis surveillance data for 2009–2010 and the annual percentage change in national rates for the years 1995–2010.
Methods
Case Definition
Confirmed and probable cases of giardiasis are reported voluntarily to CDC. A confirmed case of giardiasis (i.e., one that has a positive laboratory finding) is defined as the detection of Giardia intestinalis organisms, antigen, or DNA in stool, intestinal fluid, tissue samples, biopsy specimens, or other biological sample (27).
A probable case of giardiasis is a clinically compatible case that is linked epidemiologically to a confirmed case (27).
Reporting
States, the District of Columbia (DC), New York City (NYC), the Commonwealth of Puerto Rico, and Guam voluntarily report cases of giardiasis to CDC through the National Notifiable Diseases Surveillance System (NNDSS). Giardiasis is not reportable in Kentucky, Mississippi, North Carolina, or Texas. It became nonreportable in Tennessee starting in January 2010 and in Oklahoma starting in July 2010. Reports include the patient's place of residence (i.e., state and county), age, sex, race, ethnicity (i.e., Hispanic or non-Hispanic), and date of symptom onset, and indicate whether the reporting jurisdiction classified the case as outbreak-associated. Because data in this report were finalized at a different time, the number of cases differs slightly from the number reported in CDC's annual summary of notifiable diseases.
Analysis
National giardiasis surveillance data for 2009–2010 were analyzed using SAS v.9.3 (SAS Institute Inc.; Cary, North Carolina). Population data from the U.S. Census Bureau using intercensal estimates for April 1, 2000 to July 1, 2010, were used to calculate rates by year, age, and sex. Data were analyzed regionally on the basis of U.S. Census Bureau-defined regions (Northeast, Midwest, South, and West). To account for differences in the seasonal use of recreational water, the West region was further subdivided into Northwest and Southwest.
Results
During 2009–2010, the total number of reported cases of giardiasis increased 1.9%, from 19,562 for 2009 to 19,927 for 2010 (Table 1). During this period, 50 jurisdictions (46 states, two cities (DC and NYC), Puerto Rico, and Guam) reported giardiasis cases. Giardiasis rates in the United States remained relatively stable at 7.3–7.6 cases per 100,000 population.
For 2010, among reported cases, the rate of giardiasis per 100,000 population ranged from 2.6 in Arizona to 29.6 in Vermont (Table 1, Figure 1). Vermont reported the highest rate for both years of the reporting period, at 35.4 in 2009 and 29.6 in 2010. The Midwest region reported the highest rate of giardiasis in 2010 at 11.4 per 100,000 population, followed by the Northwest at 10.3 (Table 1 Figure 1).
Surveillance data displayed a bimodal age distribution, with the greatest number and rate of reported cases occurring among children aged 1–9 years, with a smaller, flatter peak among adults aged 35–49 years (Figure 2). When reports for which a patient's sex was missing or unknown were excluded (1%–2.5%), the percentage of cases reported to have occurred among males remained consistent at 56.2% (10,635 of 18,911) for 2009 and 56.7% (11,138 of 19,638) for 2010 (Table 2). Analysis of rates by age and sex revealed that giardiasis was more often reported among males in each age group (Figure 3). This difference was most pronounced among men aged 35–54 years.
Most cases for which data on race were available for 2009–2010 occurred among whites, followed by blacks, Asians/Pacific Islanders, and American Indians/Alaska Natives (Table 2). However, data on race were not included for 41.9%–43.7% of total cases reported annually. Although 6.9%–9.6% of patients were identified as Hispanic, data on ethnicity were lacking for 48.9% of total annual case reports.
A twofold increase in reported giardiasis cases occurred during the peak month of reporting in August compared with the lowest month, December (Figure 4). The increased number of cases began in mid-May, peaked in August, and declined through September.
Among all jurisdictions that reported cases of giardiasis, the rate has declined from 13.8 to 7.6 (45%) since the peak in case reporting in 1995. Since 2002, when giardiasis became nationally notifiable, the incidence rates have remained relatively stable, ranging from 8.7–7.2 (Figure 5).
Discussion
National giardiasis surveillance data are used to assess the epidemiologic characteristics and disease burden of giardiasis in the United States. Following a gradual decline in case reports during 1996–2001 (23,24), the number of cases reported and rates appears to have stabilized, coinciding with the disease becoming nationally notifiable in 2002 (Figure 1). Although giardiasis is reported throughout the United States, the rates are highest in northern states (Figure 1), and Vermont has reported the highest rate for each of the last 5 years. It is difficult to determine whether this finding is of biologic significance or if it reflects different surveillance capacities among states.
Giardia is primarily transmitted through ingestion of infected human waste, either through exposure to fecally contaminated water or food, through contact with an infected person (e.g., exposure during diaper changing), or occupational exposure to human waste (28,29). Drinking water is an important vehicle for Giardia transmission. G. intestinalis was the single most frequently identified pathogen in all drinking water outbreaks reported in the United States during 1971–2006, responsible for 121 (28%) of 432 outbreaks with an identified etiology (30). Untreated drinking water was identified as a risk factor for sporadic giardiasis in studies in the United States (31,32) and New Zealand (17). Untreated groundwater appeared to be particularly risky if it was acquired from poorly constructed or maintained wells that might have been subject to surface water contamination (17).
Treated or untreated recreational water also has been implicated as a vehicle of giardiasis transmission. During 1999–2008, Giardia was identified as a causal agent of eight (3.5%) of 228 reported recreational water-associated gastroenteritis outbreaks (33). In studies of sporadic giardiasis, swallowing water while swimming and during other recreational contact with fresh water were both risk factors for contracting Giardia (17,20). Giardia can be frequently detected in fecal material in pools (34) and transmission has been documented among diapered children (35–37) who use swimming venues regularly.
Reported foodborne outbreaks of giardiasis have generally been caused by direct contamination by an infected food handler (38,39) or by animal contamination of food (40). However, foodborne outbreaks of giardiasis are infrequently reported in the United States; during 2000–2010, <1% of foodborne outbreaks with an identified etiology were attributed to Giardia (41). Infections from contamination of widely distributed foods (e.g., fresh produce) might be more difficult to detect. In a study of sporadic giardiasis in England, eating lettuce was associated with increased risk for giardiasis (20). Use of reclaimed wastewater for irrigation is associated with finding Giardia cysts on fresh produce (42), highlighting the necessity of using noncontaminated irrigation water to prevent foodborne disease.
Person-to-person transmission of Giardia also occurs. Persons attending or working in childcare settings or those who have close contact with persons with giardiasis are at increased risk for being infected (31,32,43). Exposure to feces through handling diapers (28) and poor hygiene, particularly after toileting, in childcare settings (35) might contribute to increased risk.
Although G. intestinalis infects both humans and animals, the importance of zoonotic transmission to humans and the role of animal contamination of food and water are being reexamined as a result of advances in molecular epidemiology. Giardia has been detected in nearly all classes of vertebrates, including domestic animals and wildlife (44). However, molecular characterization of Giardia has identified relatively species-specific genetic assemblages. Humans are primarily infected with assemblages A and B, although these assemblages are also found in other species (44). Animal contamination has been suspected of causing outbreaks associated with drinking water (45,46). In the United States and Australia, livestock are infected predominately with the bovine-specific genetic assemblage E (11). Although human-pathogenic assemblage A can be found in a small proportion of cattle, investigations of contaminated water supplies typically incriminate effluent from human waste as the source (11,44). Thus farm run-off and land application of animal waste might not be major contributors to human giardiasis as was previously thought. Household pets represent a potential source of zoonotic transmission; however, findings from molecular studies of human and animal Giardia species and assemblages suggest that the risk for G. intestinalis zoonotic transmission is not as high as previously thought (11). Giardia was identified in 9.4% of otherwise healthy pet dogs in Australia; however, assemblages C and D (rarely infectious to humans) were identified most frequently (47). Data implicating pets as a risk factor for giardiasis are limited, and additional molecular epidemiology studies are needed to clarify this question (48). No molecular data are reported to CDC surveillance systems, limiting the ability to understand the role of zoonotic transmission.
The rate of giardiasis varies by age and sex. The rate of reported giardiasis is higher in males than in females in most age groups, particularly among adults aged 35–54 years (Table 2, Figure 3). Although giardiasis affects persons in all age groups, the number of reported cases was highest among children aged 1–9 years. Data for younger age groups are consistent with reports published previously documenting higher rates of giardiasis among younger children (23–26). Higher rates of giardiasis in children might be related to increased recreational water exposures, poor sanitation and hygiene skills, and close contact with other potentially infected children in childcare settings (4,49,50). Giardia was identified as the cause of nondysenteric diarrhea in 15% of children examined in outpatient clinics (51), and transmission from children who are ill to household contacts has been documented in outbreak investigations (37,52).
A marked increase in the number of giardiasis cases occurred during the summer, similar to the profile observed for other bacterial and parasitic enteric diseases. This seasonal variation also has been noted in state, Canadian provincial, and previous U.S. national surveillance data for giardiasis and cryptosporidiosis (23–26,49,50). This might be attributable to increased outdoor activities during the summer. Transmission associated with outdoor activities is facilitated by the substantial number of Giardia cysts that can be shed by a single person (13), the environmental hardiness of the organism (53), the extended periods of time that cysts can be shed (14), and the low infectious dose (12).
Its low infectious dose, protracted communicability, and moderate chlorine tolerance make Giardia ideally suited for transmission through drinking and recreational water, and person-to-person contact. Strategies to reduce the incidence of giardiasis have focused on reducing waterborne and person-to-person transmission. The U.S. Environmental Protection Agency (EPA) enacted the Surface Water Treatment Rule (SWTR) in 1989 and the Interim Enhanced SWTR in 1998. These regulations have decreased the number of giardiasis outbreaks associated with community drinking water systems (30). In 2006, EPA finalized the Ground Water Rule to address contamination of public ground water (well) systems, which might reduce the number of groundwater-associated outbreaks of giardiasis. For treated recreational water venues, conducting proper pool maintenance (i.e., sufficient disinfection, filtration, and recirculation of water) and implementing exclusion criteria (i.e., prohibiting persons with diarrhea from swimming) should decrease transmission of Giardia through treated recreational water. Person-to-person transmission of Giardia is difficult to interrupt in a systematic fashion, particularly in childcare settings (54). Adherence to appropriate infection control (e.g., exclusion or separation of children ill with diarrhea, hand washing, and diaper changing) policies is recommended for controlling giardiasis and other enteric pathogens in these group settings (55).
Limitations
The data provided in this report are subject to at least three limitations. First, NNDSS data are incomplete on race, ethnicity, and symptom onset date, and do not include data on exposures. Second, incidence of giardiasis is likely to be underestimated by these national surveillance data because of underreporting (e.g., not all infected persons are symptomatic, persons who are symptomatic do not always seek medical care, health-care providers do not always include laboratory diagnostics in their evaluation of nonbloody diarrheal diseases, and case reports are not always completed for positive laboratory results or forwarded to public health officials). Finally, giardiasis is not a reportable disease in all states.
Conclusion
Although giardiasis is the most common enteric parasitic infection in the United States, knowledge of its epidemiology is still lacking in public health research. The majority of data on giardiasis transmission comes from outbreak investigations; however, the overwhelming majority of reported giardiasis cases occur sporadically. During 2009–2010, <1% of reported giardiasis cases were associated with outbreaks (Table 1). Relative contributions of person-to-person, animal-to-person, foodborne, and waterborne transmission to sporadic human giardiasis in the United States are not well understood. It is unclear whether the geographic variability noted in this report reflects true differences in transmission patterns and disease burden. Ecological studies could characterize the potential contributions of private wells, septic systems, land application of biosolids, and agricultural operations in giardiasis transmission. Infected persons can shed Giardia for several weeks, and symptomatology is variable; however, until recently, no reliable serologic assays for Giardia have been available, and no population studies of Giardia seroprevalence have been conducted. With recent laboratory advances (56), such studies might now be feasible and would contribute substantially to our understanding of the prevalence of giardiasis in the United States. Enhanced genotyping methods would increase our knowledge of the molecular epidemiology of Giardia, including elucidating species-specific subassemblages. These tools, combined with traditional epidemiology and surveillance, would improve understanding of giardiasis risk factors, identify outbreaks by linking cases currently classified as sporadic infections, and provide risk factor information needed to inform prevention strategies. Although recent studies indicate a potential for chronic sequelae from giardiasis (5–10), additional research is needed to further improve understanding of the burden and scope of these conditions.
The burden and cost of acute giardiasis in the United States continue to be substantial. An estimated 1.2 million cases occur annually (57). Each year, hospitalizations resulting from giardiasis cost approximately $34 million; additionally, each ambulatory care visit for giardiasis costs $121–$273, depending on the patient's type of health-care insurance coverage (58). Because giardiasis is the most commonly reported intestinal parasitic infection in the United States and no declines in incidence have occurred in recent years, new epidemiologic studies are needed to identify effective public health measures.
Measures to prevent (Box 1) and improve surveillance for giardiasis, and increase understanding of its epidemiology and the associated disease burden (Box 2) have been recommended. Additional information about giardiasis is available at http://www.cdc.gov/parasites/giardia/.
Acknowledgments
This report is based, in part, on contributions by jurisdiction surveillance coordinators Ruth Ann Jajosky, DMD, and Willie Anderson, Office of Surveillance, Epidemiology, and Laboratory Services, CDC.
References
- Kappus KD, Lundgren RG, Jr., Juranek DD, Roberts JM, Spencer HC. Intestinal parasitism in the United States: update on a continuing problem. Am J Trop Med Hyg 1994;50:705–13.
- Hellard ME, Sinclair MI, Hogg GG, Fairley CK. Prevalence of enteric pathogens among community based asymptomatic individuals. J Gastroenterol Hepatol. 2000 Mar;15:290–3.
- Rodriguez-Hernandez J, Canut-Blasco A, Martin-Sanchez AM. Seasonal prevalences of Cryptosporidium and Giardia infections in children attending day care centres in Salamanca (Spain) studied for a period of 15 months. Eur J Epidemiol 1996;12:291–5.
- Thompson RC. Giardiasis as a re-emerging infectious disease and its zoonotic potential. Int J Parasitol 2000;30:1259–67.
- Cantey PT, Roy S, Lee B, et al. Study of nonoutbreak giardiasis: novel findings and implications for research. Am J Med 2011;124:1175.
- D'Anchino M, Orlando D, De Feudis L. Giardia lamblia infections become clinically evident by eliciting symptoms of irritable bowel syndrome. J Infect 2002;45:169–72.
- Di Prisco MC, Hagel I, Lynch NR, Barrios RM, Alvarez N, Lopez R. Possible relationship between allergic disease and infection by Giardia lamblia. Ann Allergy 1993;70:210–3.
- Tupchong M, Simor A, Dewar C. Beaver fever—a rare cause of reactive arthritis. J Rheumatol. 1999;26:2701–2.
- Wensaas KA, Langeland N, Rortveit G. Post-infectious gastrointestinal symptoms after acute Giardiasis. A 1-year follow-up in general practice. Fam Pract 2010;27:255–9.
- Wensaas KA, Langeland N, Hanevik K, Morch K, Eide GE, Rortveit G. Irritable bowel syndrome and chronic fatigue 3 years after acute giardiasis: historic cohort study. Gut 2012;61:214–9.
- Xiao L, Fayer R. Molecular characterisation of species and genotypes of Cryptosporidium and Giardia and assessment of zoonotic transmission. Int J Parasitol 2008;38:1239–55.
- Rendtorff RC. The experimental transmission of human intestinal protozoan parasites. II. Giardia lamblia cysts given in capsules. Am J Hygiene 1954;59:209–20.
- Danciger M, Lopez M. Numbers of Giardia in the feces of infected children. Am J Trop Med Hyg 1975;24:237–42.
- Pickering LK, Woodward WE, DuPont HL, Sullivan P. Occurrence of Giardia lamblia in children in day care centers. J Pediatr 1984;104:522–6.
- The Medical Letter. Giardiasis. In: Abramowicz M, editor. Drugs for parasitic infections. New Rochelle, NY: The Medical Letter; 2007.
- Ekdahl K, Andersson Y. Imported giardiasis: impact of international travel, immigration, and adoption. Am J Trop Med Hyg 2005;72:825–30.
- Snel SJ, Baker MG, Kamalesh V, French N, Learmonth J. A tale of two parasites: the comparative epidemiology of cryptosporidiosis and giardiasis. Epidemiol Infect 2009;137:1641–50.
- Staat MA, Rice M, Donauer S, et al. Intestinal parasite screening in internationally adopted children: importance of multiple stool specimens. Pediatrics 2011;128:e613–22.
- Cordell RL. The risk of infectious diseases among childcare providers. Journal of the American Medical Women's Association 2001;56:109–12.
- Stuart JM, Orr HJ, Warburton FG, et al. Risk factors for sporadic giardiasis: a case-control study in southwestern England. Emerg Infect Dis 2003;9:229–33.
- Clinical and Laboratory Standards Institute. Procedures for the recovery and identification of parasites from the intestiinal tract; approved guideline; 2nd ed. Wayne, Pennsylvania: Clinical Laboratory Standards Institute; 2005.
- Johnston SP, Ballard MM, Beach MJ, Causer L, Wilkins PP. Evaluation of three commercial assays for detection of Giardia and Cryptosporidium organisms in fecal specimens. J Clin Microbiol 2003;41:623–6.
- Furness BW, Beach MJ, Roberts JM. Giardiasis surveillance—United States, 1992–1997. MMWR 2000;49(No. SS-7).
- Hlavsa MC, Watson JC, Beach MJ. Giardiasis surveillance—United States, 1998–2002. MMWR 2005;54(No. SS-1).
- Yoder JS, Beach MJ. Giardiasis surveillance—United States, 2003–2005. MMWR 2007;56(No. SS-7).
- Yoder JS, Harral C, Beach MJ. Giardiasis surveillance—United States, 2006–2008. MMWR 2010;59(No. SS-6).
- CDC. Giardiasis: 2011 Case Definition. 2011. Available at http://www.cdc.gov/osels/ph_surveillance/nndss/casedef/giardiasis_current.htm. Accessed June 7, 2012.
- Hoque ME, Hope VT, Kjellstrom T, Scragg R, Lay-Yee R. Risk of giardiasis in Aucklanders: a case-control study. Int J Infect Dis 2002;6:191–7.
- Huang DB, White AC. An updated review on Cryptosporidium and Giardia. Gastroenterology Clinics of North America 2006;35:291.
- Craun GF, Brunkard JM, Yoder JS, et al. Causes of outbreaks associated with drinking water in the United States from 1971 to 2006. Clin Microbiol Rev 2010;23:507–28.
- Dennis DT, Smith RP, Welch JJ, et al. Endemic giardiasis in New Hampshire: a case-control study of environmental risks. J Infect Dis 1993;167:1391–5.
- Chute CG, Smith RP, Baron JA. Risk factors for endemic giardiasis. Am J Public Health 1987;77:585–7.
- Hlavsa MC, Roberts VA, Anderson AR, et al. Surveillance for waterborne disease outbreaks and other health events associated with recreational water—United States, 2007–2008. MMWR 2011;60(No. SS-12).
- Shields JM, Gleim ER, Beach MJ. Prevalence of Cryptosporidium spp. and Giardia intestinalis in swimming pools, Atlanta, Georgia. Emerg Infect Dis 2008;14:948–50.
- Ang LH. Outbreak of giardiasis in a daycare nursery. Communicable disease and public health / PHLS 2000;3:212–3.
- Harter L, Frost F, Grunenfelder G, Perkins-Jones K, Libby J. Giardiasis in an infant and toddler swim class. Am J Public Health 1984;74:155–6.
- Polis MA, Tuazon CU, Alling DW, Talmanis E. Transmission of Giardia lamblia from a day care center to the community. Am J Public Health 1986;76:1142–4.
- Quick R, Paugh K, Addiss D, Kobayashi J, Baron R. Restaurant-associated outbreak of giardiasis. J Infect Dis 1992;166:673–6.
- Budu-Amoako E, Greenwood SJ, Dixon BR, Barkema HW, McClure JT. Foodborne Illness Associated with Cryptosporidium and Giardia from Livestock. J Food Prot 2011;74:1944–55.
- Smith HV, Caccio SM, Cook N, Nichols RA, Tait A. Cryptosporidium and Giardia as foodborne zoonoses. Vet Parasitol 2007;149:29–40.
- CDC. Foodborne Outbreak Online Database. Atlanta, GA: US Department of Health and Human Services, CDC; 2012.
- Amahmid O, Asmama S, Bouhoum K. The effect of waste water reuse in irrigation on the contamination level of food crops by Giardia cysts and Ascaris eggs. Int J Food Microbiol 1999;49:19–26.
- Sagebiel D, Weitzel T, Stark K, Leitmeyer K. Giardiasis in kindergartens: prevalence study in Berlin, Germany, 2006. Parasitology Research 2009;105:681–7.
- Thompson RC. The zoonotic significance and molecular epidemiology of Giardia and giardiasis. Vet Parasitol 2004;126:15–35.
- Daly ER, Roy SJ, Blaney DD, et al. Outbreak of giardiasis associated with a community drinking-water source. Epidemiol Infect. 2010;138:491–500.
- Navin TR, Juranek DD, Ford M, Minedew DJ, Lippy EC, Pollard RA. Case-control study of waterborne giardiasis in Reno, Nevada. Am J Epidemiol 1985;122:269–75.
- Palmer CS, Traub RJ, Robertson ID, Devlin G, Rees R, Thompson RC. Determining the zoonotic significance of Giardia and Cryptosporidium in Australian dogs and cats. Vet Parasitol 2008;154:142–7.
- Thompson RC, Palmer CS, O'Handley R. The public health and clinical significance of Giardia and Cryptosporidium in domestic animals. Veterinary J 2008;177:18–25.
- Naumova EN, Chen JT, Griffiths JK, Matyas BT, Estes-Smargiassi SA, Morris RD. Use of passive surveillance data to study temporal and spatial variation in the incidence of giardiasis and cryptosporidiosis. Public Health Rep 2000;115:436–47.
- Greig JD, Michel P, Wilson JB, et al. A descriptive analysis of giardiasis cases reported in Ontario, 1990-1998. Can J Public Health 2001;92:361–5.
- Caeiro JP, Mathewson JJ, Smith MA, Jiang ZD, Kaplan MA, Dupont HL. Etiology of outpatient pediatric nondysenteric diarrhea: a multicenter study in the United States. Ped Infect Dis J 1999;18:94–7.
- Katz DE, Heisey-Grove D, Beach M, Dicker RC, Matyas BT. Prolonged outbreak of giardiasis with two modes of transmission. Epidemiol Infect 2006;134:935–41.
- Erickson MC, Ortega YR. Inactivation of protozoan parasites in food, water, and environmental systems. J Food Prot 2006;69:2786–808.
- Steketee RW, Reid S, Cheng T, Stoebig JS, Harrington RG, Davis JP. Recurrent outbreaks of giardiasis in a child day care center, Wisconsin. Am J Public Health 1989;79:485–90.
- Pickering LK, Bartlett AV, Woodward WE. Acute infectious diarrhea among children in day care: epidemiology and control. Rev Infect Dis 1986;8:539–47.
- Priest JW, Moss DM, Visvesvara GS, Jones CC, Li A, Isaac-Renton JL. Multiplex assay detection of immunoglobulin G antibodies that recognize Giardia intestinalis and Cryptosporidium parvum antigens. Clin Vaccine Immunol 2010;17:1695–707.
- Scallan E, Hoekstra RM, Angulo FJ, et al. Foodborne illness acquired in the United States—major pathogens. Emerg Infect Dis 2011; 17:7–15.
- Collier SA, Stockman LJ, Hicks LA, et al. Direct healthcare costs of selected diseases primarily or partially transmitted by water. Epidemiol Infect 2012;11:1–11.
|
TABLE 1. (Continued) Number, percentage,* and rate† of giardiasis case reports, by region/state/territory — National Notifiable Diseases Surveillance System, United States, 2009–2010 |
||||||||
|---|---|---|---|---|---|---|---|---|
|
Region/State/Territory |
2009 |
2010 |
||||||
|
No. |
(%) |
Rate |
No. of outbreak cases§ |
No. |
(%) |
Rate |
No. of outbreak cases§ |
|
|
Northwest |
1,413 |
(7.2) |
9.9 |
4 |
1,479 |
(7.4) |
10.3 |
5 |
|
Alaska |
111 |
(0.6) |
15.9 |
98 |
(0.5) |
13.7 |
||
|
Idaho |
208 |
(1.1) |
13.4 |
1 |
215 |
(1.1) |
13.7 |
3 |
|
Montana |
133 |
(0.7) |
13.5 |
110 |
(0.6) |
11.1 |
||
|
Oregon |
421 |
(2.2) |
11.1 |
3 |
481 |
(2.4) |
12.5 |
|
|
Washington |
467 |
(2.4) |
7.0 |
521 |
(2.6) |
7.7 |
||
|
Wyoming |
73 |
(0.4) |
13.0 |
54 |
(0.3) |
9.6 |
2 |
|
|
Southwest |
3,084 |
(15.8) |
5.4 |
11 |
3,228 |
(16.2) |
5.6 |
26 |
|
Arizona |
198 |
(1.0) |
3.1 |
4 |
167 |
(0.8) |
2.6 |
7 |
|
California |
1832 |
(9.4) |
5.0 |
1783 |
(8.9) |
4.8 |
||
|
Colorado |
499 |
(2.6) |
10.0 |
691 |
(3.5) |
13.7 |
||
|
Hawaii |
21 |
(0.1) |
1.6 |
59 |
(0.3) |
4.3 |
||
|
Nevada |
109 |
(0.6) |
4.1 |
5 |
107 |
(0.5) |
4.0 |
18 |
|
New Mexico |
113 |
(0.6) |
5.5 |
108 |
(0.5) |
5.2 |
||
|
Utah |
312 |
(1.6) |
11.5 |
2 |
313 |
(1.6) |
11.3 |
1 |
|
Total region/state |
19,403 |
(99.2) |
7.3 |
152 |
19,831 |
(99.5) |
7.6 |
183 |
|
Territory |
159 |
5.8 |
152 |
96 |
4.2 |
183 |
||
|
Guam |
3 |
(<0.1) |
1.7 |
3 |
(<0.1) |
1.7 |
||
|
Puerto Rico |
156 |
(0.8) |
4.1 |
93 |
(0.5) |
2.5 |
||
|
Total |
19,562 |
(100.0) |
— |
152 |
19,927 |
(100.0) |
— |
183 |
|
Abbreviation: NR = not reportable. Sources: Population estimates are from the U.S. Census Bureau. Intercensal estimates of the resident population for the United States, regions, states, and Puerto Rico: April 1, 2000 to July 1, 2010. Available at http://www.census.gov/popest/data/index.html. Estimates of the New York City population are from Intercensal estimates of the resident population for counties: April 1, 2000 to July 1, 2010 (summing populations of Bronx, Kings, New York, Richmond, and Queens counties). Available at www.census.gov/popest/data/intercensal/county/county2010.html. Estimates of the population of Guam are from the International Data Base (IDB) Data Access – Spreadsheet. Available at http://www.census.gov/ipc/www/idbsprd.html. * Percentages might not total 100% because of rounding. † Incidence per 100,000 population on the basis of U.S. Census Bureau population estimates. § Number of cases linked to a detected outbreak. ¶ New York State case reports include New York City. ** Oklahoma reported through June 2010; rate reflects the reduced person-time of observation. |
||||||||
FIGURE 1. Incidence* of giardiasis, by state/area — National Notifiable Diseases Surveillance System, United States, 2010
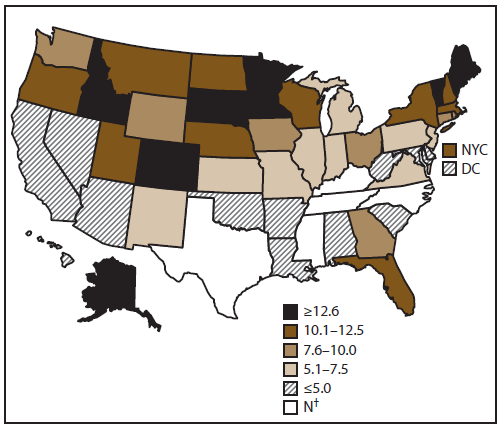
Abbreviations: NYC = New York City; DC = District of Columbia.
* Per 100,000 population.
† Not a reportable disease in these states
Alternate Text: This figure is a map of the United States that reflects the incidence (per 100,000 population) of giardiasis, by state/area, for 2010, as reported to the National Notifiable Diseases Surveillance System, United States. For 2010, among reported cases, the rate of giardiasis per 100,000 population ranged from 1.6 in Hawaii to 29.7 in Vermont.
FIGURE 2. Number* and average annual rate† of giardiasis case reports, by age group and year — National Notifiable Diseases Surveillance System, 2009–2010
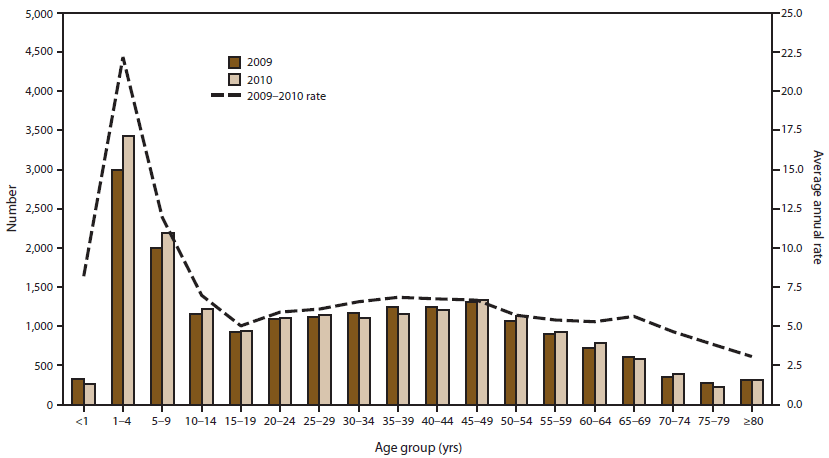
* N = 39,234; age is unknown for 1,041 cases.
† Incidence per 100,000 population.
Alternate Text: This figure is a bar graph that reflects the number of giardiasis case reports, by age group and year, for 2009-2010, as reported to the National Notifiable Diseases Surveillance System, United States. Surveillance data displayed a bimodal age distribution, with the greatest number and rate of reported cases occurring among children aged 1-9 years, with a smaller, flatter peak among adults aged 35-49 years.
FIGURE 3. Incidence* of giardiasis case reports, by age group and sex — National Notifiable Diseases Surveillance System, United States, 2009–2010
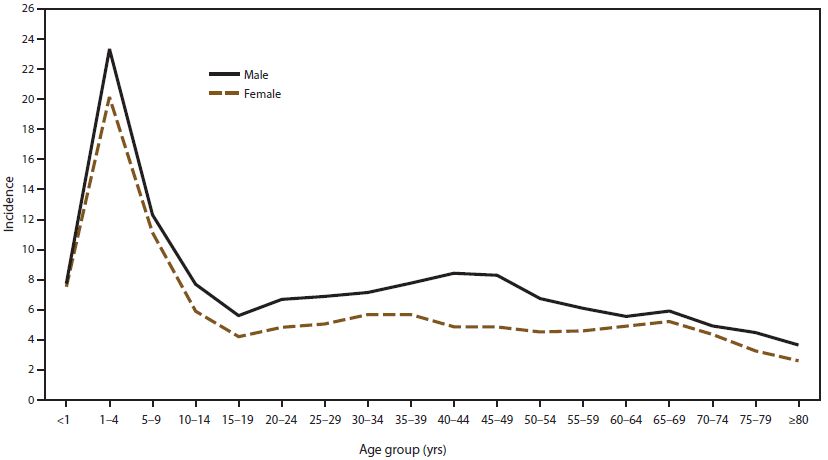
* Per 100,000 population.
Alternate Text: This figure is a line graph that reflects the incidence of giardiasis, by age group and sex, for 2009-2010, as reported to the National Notifiable Diseases Surveillance System, United States. Analysis of rates by age and sex revealed that giardiasis was more often reported among males in each age group, particularly among adults aged 35-44 years.
FIGURE 4. Number* of giardiasis case reports, by date of illness onset — National Notifiable Diseases Surveillance System, United States, 2009–2010
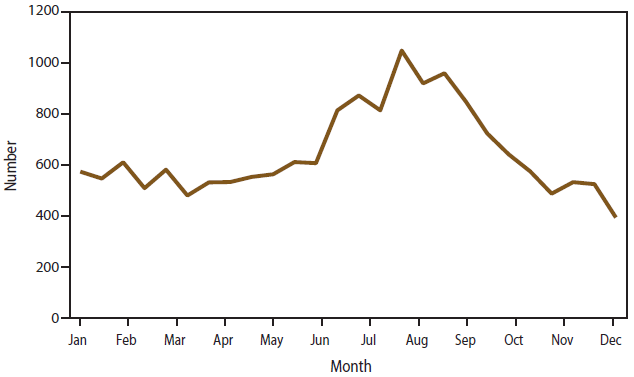
* N = 39,234; onset date was unknown for 19,636 cases.
Alternate Text: This figure is a line graph that reflects the number of giardiasis case reports, by date of illness onset, for 2009-2010, as reported to the National Notifiable Diseases Surveillance System, United States. The denominator is 39,291; onset date was unknown for 19,636 cases. A twofold increase in reported giardiasis cases occurred during the peak month of reporting in August compared with the lowest month, December.
FIGURE 5. Incidence* of giardiasis, by year — National Notifiable Diseases Surveillance System, United States, 1993–2010†
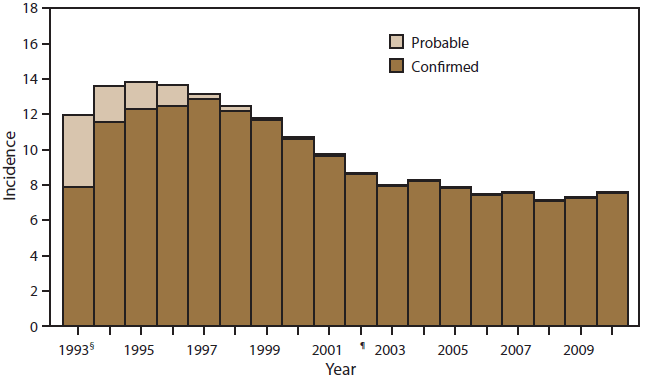
* Per 100,000 population. Population estimates are from the Population Division, US Census Bureau.
Available at http://www.census.gov/popest/. Accessed August 15, 2011.
† N = 391,492.
§ First year that giardiasis case reports were assigned a reporting number.
¶ Giardiasis became nationally notifiable in 2002.
Alternate Text: This figure is a bar graph that reflects the incidence (per 100,000 population) of giardiasis, by year, during 1993-2009, as reported to the National Notifiable Diseases Surveillance System, United States. Data is presented by probable case rate and confirmed case rate. The year 1993 was the first year that assigned case reports were given an assigned reported number. The denominator is 391,492.
|
BOX 1. CDC recommendations to prevent and control giardiasis |
|---|
|
Practice good hygiene.
Information about hand hygiene is available from CDC at http://www.cdc.gov/healthywater/hygiene/hand/handwashing.html.
Information about recreational water illnesses and how to stop them from spreading is available from CDC at http://www.cdc.gov/healthywater/swimming.
Avoid water (drinking and recreational) that might be contaminated.
Information about water filters is available from CDC at http://www.cdc.gov/parasites/crypto/gen_info/filters.html. Avoid eating food that might be contaminated.
Practice extra caution when traveling. Information about how to prevent illnesses while traveling is available from CDC at http://wwwnc.cdc.gov/travel/content/safe-food-water.aspx. Prevent contact and contamination with feces during sex.
__________________________ Information about giardiasis prevention and control is available from CDC at http://www.cdc.gov/parasites/giardia/prevent.html. |
Use of trade names and commercial sources is for identification only and does not imply endorsement by the U.S. Department of Health and Human Services. |
All MMWR HTML versions of articles are electronic conversions from typeset documents. This conversion might result in character translation or format errors in the HTML version. Users are referred to the electronic PDF version (http://www.cdc.gov/mmwr) and/or the original MMWR paper copy for printable versions of official text, figures, and tables. An original paper copy of this issue can be obtained from the Superintendent of Documents, U.S. Government Printing Office (GPO), Washington, DC 20402-9371; telephone: (202) 512-1800. Contact GPO for current prices.
**Questions or messages regarding errors in formatting should be addressed to mmwrq@cdc.gov.
