Persons using assistive technology might not be able to fully access information in this file. For assistance, please send e-mail to: mmwrq@cdc.gov. Type 508 Accommodation and the title of the report in the subject line of e-mail.
Surveillance for Waterborne Disease Outbreaks and Other Health Events Associated with Recreational Water --- United States, 2007--2008
Please note: An erratum has been published for this article. To view the erratum, please click here.
Corresponding author: Michele C. Hlavsa, MPH, Division of Foodborne, Waterborne, and Environmental Diseases, National Center for Emerging Zoonotic and Infectious Diseases, CDC, 1600 Clifton Road, N.E., MS C-9, Atlanta, GA 30333. Telephone: 404-639-1700; E-mail: healthywater@cdc.gov.
Abstract
Problem/Condition: Since 1978, CDC, the U.S. Environmental Protection Agency, and the Council of State and Territorial Epidemiologists have collaborated on the Waterborne Disease and Outbreak Surveillance System (WBDOSS) for collecting and reporting data on waterborne disease outbreaks associated with recreational water. This surveillance system is the primary source of data concerning the scope and health effects of waterborne disease outbreaks in the United States. In addition, data are collected on other select recreational water--associated health events, including pool chemical--associated health events and single cases of Vibrio wound infection and primary amebic meningoencephalitis (PAM).
Reporting Period: Data presented summarize recreational water--associated outbreaks and other health events that occurred during January 2007--December 2008. Previously unreported data on outbreaks that have occurred since 1978 also are presented.
Description of the System: The WBDOSS database includes data on outbreaks associated with recreational water, drinking water, water not intended for drinking (excluding recreational water), and water use of unknown intent. Public health agencies in the states, the District of Columbia, U.S. territories, and Freely Associated States are primarily responsible for detecting and investigating waterborne disease outbreaks and voluntarily reporting them to CDC using a standard form. Only data on outbreaks associated with recreational water are summarized in this report. Data on other recreational water--associated health events reported to CDC, the Agency for Toxic Substances and Disease Registry (ATSDR), and the U.S. Consumer Product Safety Commission (CPSC) also are summarized.
Results: A total of 134 recreational water--associated outbreaks were reported by 38 states and Puerto Rico for 2007--2008. These outbreaks resulted in at least 13,966 cases. The median outbreak size was 11 cases (range: 2--5,697 cases). A total of 116 (86.6%) outbreaks were associated with treated recreational water (e.g., pools and interactive fountains) and resulted in 13,480 (96.5%) cases. Of the 134 outbreaks, 81 (60.4%) were outbreaks of acute gastrointestinal illness (AGI); 24 (17.9%) were outbreaks of dermatologic illnesses, conditions, or symptoms; and 17 (12.7%) were outbreaks of acute respiratory illness. Outbreaks of AGI resulted in 12,477 (89.3%) cases.
The etiology was laboratory-confirmed for 105 (78.4%) of the 134 outbreaks. Of the 105 outbreaks with a laboratory-confirmed etiology, 68 (64.8%) were caused by parasites, 22 (21.0%) by bacteria, five (4.8%) by viruses, nine (8.6%) by chemicals or toxins, and one (1.0%) by multiple etiology types. Cryptosporidium was confirmed as the etiologic agent of 60 (44.8%) of 134 outbreaks, resulting in 12,154 (87.0%) cases; 58 (96.7%) of these outbreaks, resulting in a total of 12,137 (99.9%) cases, were associated with treated recreational water. A total of 32 pool chemical--associated health events that occurred in a public or residential setting were reported to WBDOSS by Maryland and Michigan. These events resulted in 48 cases of illness or injury; 26 (81.3%) events could be attributed at least partially to chemical handling errors (e.g., mixing incompatible chemicals). ATSDR's Hazardous Substance Emergency Events Surveillance System received 92 reports of hazardous substance events that occurred at aquatic facilities. More than half of these events (55 [59.8%]) involved injured persons; the most frequently reported primary contributing factor was human error. Estimates based on CPSC's National Electronic Injury Surveillance System (NEISS) data indicate that 4,574 (95% confidence interval [CI]: 2,703--6,446) emergency department (ED) visits attributable to pool chemical--associated injuries occurred in 2008; the most frequent diagnosis was poisoning (1,784 ED visits [95% CI: 585--2,984]). NEISS data indicate that pool chemical--associated health events occur frequently in residential settings. A total of 236 Vibrio wound infections were reported to be associated with recreational water exposure; 36 (48.6%) of the 74 hospitalized vibriosis patients and six (66.7%) of the nine vibriosis patients who died had V. vulnificus infections. Eight fatal cases of PAM occurred after exposure to warm untreated freshwater.
Interpretations: The 134 recreational water--associated outbreaks reported for 2007--2008 represent a substantial increase over the 78 outbreaks reported for 2005--2006 and the largest number of outbreaks ever reported to WBDOSS for a 2-year period. Outbreaks, especially the largest ones, were most frequently associated with treated recreational water and characterized by AGI. Cryptosporidium remains the leading etiologic agent. Pool chemical--associated health events occur frequently but are preventable. Data on other select recreational water--associated health events further elucidate the epidemiology of U.S. waterborne disease by highlighting less frequently implicated types of recreational water (e.g., oceans) and detected types of recreational water--associated illness (i.e., not AGI).
Public Health Actions: CDC uses waterborne disease outbreak surveillance data to 1) identify the types of etiologic agents, recreational water venues, and settings associated with waterborne disease outbreaks; 2) evaluate the adequacy of regulations and public awareness activities to promote healthy and safe swimming; and 3) establish public health priorities to improve prevention efforts, guidelines, and regulations at the local, state, and federal levels.
Introduction
During 1920--1970, data on waterborne disease outbreaks in the United States were collected by multiple researchers and federal agencies (1). Since 1971, CDC, the U.S. Environmental Protection Agency (EPA), and the Council of State and Territorial Epidemiologists (CSTE) have collaborated on the Waterborne Disease and Outbreak Surveillance System (WBDOSS), which tracks outbreaks associated with drinking water and other water exposures (2--12). Data on outbreaks associated with recreational water have been collected by WBDOSS* since 1978 (13--15). Data on 2007--2008 outbreaks associated with drinking water are presented separately (16).
Since 1978, surveillance activities have expanded to include multiple types of outbreaks and other health events associated with recreational water. Recreational water--associated outbreaks of Pontiac fever (PF) were first included in the 1981 surveillance summary (17); recreational water--associated outbreaks of Legionnaires' disease (LD) were added in the 2001--2002 surveillance summary; however, no LD outbreaks were reported for those years (15). Data on single cases of recreational water--associated vibriosis were first added to the 2003--2004 surveillance summary (14). Pool chemical--associated health events reported to CDC were first included in the 2005--2006 surveillance summary (13). Agency for Toxic Substances and Disease Registry (ATSDR) and U.S. Consumer Product Safety Commission (CPSC) data on pool chemical--associated health events have been added to this 2007--2008 surveillance summary.
The data provided in this report represent only a portion of the burden of illness and injury associated with recreational water. They do not include endemic waterborne disease cases (i.e., sporadic cases not known to be associated with an outbreak), all types of other recreational water--associated health events, nor estimates of the number of unrecognized and unreported waterborne disease outbreaks or other health events.
Background
Regulation of Recreational Water Quality
In the United States, state and local governments establish and enforce regulations for protecting recreational water from naturally occurring and human-made contaminants. No federal regulatory agency has authority over treated recreational water (e.g., pools and interactive fountains), and no minimum federal design, construction, operation, disinfection, or filtration standards exist, except the Virginia Graeme Baker Pool and Spa Safety Act (15 U.S.C. §§ 8001 et seq.), which aims to prevent entrapment. Swimming pool codes are developed and enforced by individual state and local public health agencies, resulting in substantial variation across the country in terms of regulation, compliance, and enforcement.
EPA sets water quality guidelines for natural, untreated recreational water (e.g., lakes, rivers, and oceans). In 1986, EPA developed recommended bacterial water quality criteria for coastal recreational waters (18) and, in 2004, established federal standards for those states and territories that had not yet adopted water quality criteria that met or exceeded the 1986 criteria (19). For freshwater, full-body contact beaches (e.g., lakes and rivers), EPA recommends that the monthly geometric mean water quality indicator concentration be <33 CFU/100mL for enterococci or <126 CFU/100mL for Escherichia coli. For marine water, full-body contact beaches, EPA recommends that the monthly geometric mean water quality indicator concentration be <35 CFU/100mL for enterococci. However, state and local jurisdictions have discretionary authority to adopt specific criteria for a designated use, determine the extent and frequency of monitoring and testing, and choose which interventions should be implemented when state limits are exceeded (e.g., posting signs to alert visitors to water contamination or closing the beach to swimmers). EPA provides grants to eligible coastal and Great Lakes states to help them implement programs to monitor water quality at the beach and to notify the public when problems are detected. Beach Watch, EPA's Action Plan for Beaches and Recreational Waters, was published in 1999 as part of the Clean Water Action Plan. The mission of Beach Watch is to assist state, tribal, and local authorities in strengthening and extending existing programs to protect users of fresh and marine recreational waters. Congress enacted the BEACH Act of 2000 (33 U.S.C. §§ 1346 and 1375a), which directed EPA to update its guidelines for recreational water use on the basis of improved water quality indicators and testing. To this end, since 2002, EPA has been collaborating with CDC on the National Epidemiologic and Environmental Assessment of Recreational (NEEAR) Water Study.
Methods
Data Sources
Public health agencies in the states, the District of Columbia (DC), U.S. territories, and the Freely Associated States (FAS)† have the primary responsibility for detecting and investigating waterborne disease outbreaks, which they report voluntarily to CDC using a standard form (CDC 52.12).§ The form solicits data on characteristics of outbreaks (e.g., number of cases, time, and location), results from epidemiologic and environmental investigations, and results from clinical specimen and water sample testing. CDC annually requests reports of outbreaks from persons designated as waterborne disease coordinators and obtains additional information regarding epidemiologic investigations, water quality, and water treatment to supplement submitted outbreak reports as needed. Data on all of the outbreaks in this summary were collected through paper-based reporting. Numeric and text data are abstracted from outbreak report forms and supporting documents and analyzed by using SAS 9.2 (SAS Institute, Inc. Cary, North Carolina).
National reporting includes only data on waterborne disease outbreaks. Data on pool chemical--associated health events that occurred in a public or residential setting and on single cases of primary amebic meningoencephalitis (PAM) caused by Naegleria fowleri also are solicited from coordinators.
To ensure completeness of legionellosis outbreak data, CDC reviewed and compared data from WBDOSS with data from the Travel-Associated Legionellosis in the United States System. In addition, legionellosis outbreak data were abstracted from historic Epidemic Intelligence Service outbreak investigation reports and peer-reviewed publications and entered into the WBDOSS database.
Other data presented in this surveillance summary have been reported to ATSDR's Hazardous Substance Emergency Events Surveillance (HSEES) System,¶ CPSC's National Electronic Injury Surveillance System (NEISS), and CDC's Cholera and Other Vibrio Illness Surveillance (COVIS) System. For this report, the HSEES database was searched for data on hazardous substance events that occurred at aquatic facilities during 2007--2008. To identify such events, comment and synopsis variables were queried for the terms "pool," "Jacuzzi," "spa," "hot tub," "whirlpool," "chlorine," "fountain," and "water park" (20). Although "chlorine" was the only chemical term queried, other chemicals were not excluded from the analysis. Only events that occurred on-site at aquatic facilities, regardless of setting (e.g., hotel/motel or waterpark), were included in the analysis. Events that were caused by pool chemicals but did not occur on-site at aquatic facilities (e.g., at a warehouse) were excluded. NEISS captures data on emergency department (ED) visits for injuries associated with consumer products, specifically diagnosis and patient demographic data. The methodology for analysis of NEISS data on pool chemical--associated health events and the findings of a detailed analysis of 2007 NEISS data are presented elsewhere (21); this report includes a summary of 2008 NEISS data. Data on cases of vibriosis are reported to CDC by use of a COVIS report form.** Vibriosis was added to the list of nationally notifiable diseases in January 2007 and is reportable in 50 states. As described previously, this report summarizes COVIS System data on cases with a reported recreational water exposure but no reported seafood consumption (14). Cases reported to have occurred in another jurisdiction were reassigned to the jurisdiction of exposure for analysis.
Definitions
Waterborne Disease Outbreak
Two criteria must be met for a health event to be defined as a waterborne disease outbreak associated with recreational water: 1) two or more persons must be linked epidemiologically by time, location of exposure to water, and illness characteristics, and 2) the epidemiologic evidence must implicate recreational water or volatilization of water-associated compounds into the air surrounding the water as the probable source of illness. Outbreak reports with limited or no environmental data might be included in WBDOSS, but outbreak reports that lack epidemiologic data linking the outbreak to water are excluded. Two outbreak reports that were received are not included in this summary. After swimming in April 2008, a total of 13 members of a swim team in Florida developed AGI caused by norovirus. However, the epidemiologic evidence implicated a restaurant in which they had shared a meal. An outbreak of cryptosporidiosis in Maine in July 2007 among four persons who swam in a residential pool was not included because other common exposures could not be ruled out.
Recreational water venues include but are not limited to pools, interactive fountains, spas (or hot tubs), waterslides, and fresh or marine bodies of water. For this report, outbreaks are categorized by association with treated or untreated recreational water and by location of the water exposure (i.e., not on state of residence of the ill persons). Waterborne disease outbreaks occurring on cruise ships are not reported to WBDOSS; CDC's Vessel Sanitation Program tracks outbreaks of acute gastrointestinal illness (AGI) occurring on cruise ships (22).
Other Recreational Water--Associated Health Events
Other recreational water--associated health events that do not meet the definition of an outbreak associated with recreational water are included in this summary because of their implications to the health and safety of the swimming public and aquatics staff. Some pool chemical--associated health events reported to WBDOSS do not meet the outbreak definition (i.e., one case identified or not associated with recreational water). The HSEES System and NEISS do not focus on water exposure, and whether pool chemical--associated health events reported to these systems involved recreational water exposure is not always clear. Consequently, some pool chemical--associated health events reported to WBDOSS, the HSEES System, and NEISS are analyzed and presented separately from outbreak data.
Additional terms used in this report are defined elsewhere (Appendix A).
Strength-of-Evidence Classification for Waterborne Disease Outbreaks
In this report, all outbreaks reported to WBDOSS for 2007--2008 have been classified according to the strength of 1) epidemiologic and clinical laboratory data and 2) environmental data implicating water as the vehicle of transmission (Table 1). The classification (i.e., Classes I--IV) of outbreak investigations in this report is based on the epidemiologic and environmental data reported to WBDOSS. These classes were first delineated in the 1989--1990 surveillance report (10) and have since been updated.
Outbreaks and subsequent investigations occur under different circumstances, and not all outbreaks can be investigated rigorously. Classifications of II, III, or IV do not necessarily imply that the investigation was inadequate or incomplete because multiple factors (e.g., timeliness of outbreak detection) contribute to the ability to collect optimal epidemiologic, clinical laboratory, and environmental data.
Changes in 2007--2008 Surveillance Summary
Strength-of-Evidence Classification
Molecular epidemiology is being used increasingly to understand pathogen transmission patterns, detect outbreaks, and identify important risk factors and outbreak sources. The criteria used to determine the strength-of-evidence classifications have been revised to reflect the increasing use of molecular characterization of pathogens identified in clinical specimens and environmental samples collected during outbreak investigations. Molecular data that link multiple persons who had an identical water exposure now are considered adequate epidemiologic data to support a Class I or Class II assignment; previously, epidemiologic study data were required to receive a strength-of-evidence classification of I or II. Molecular data that link at least one person to the implicated water exposure now are considered adequate water quality data to support a Class I or Class III assignment. In this report, the previously used categories "epidemiologic data" and "water quality data" have been renamed "epidemiologic and clinical laboratory data" and "environmental data," respectively.
Number of Cases
For this surveillance summary, case counts were based on the estimated number of total cases if sufficient supporting evidence was provided. For example, this might include applying the attack rate found during a cohort study to the entire population exposed to contaminated water to estimate the total number of ill persons associated with an outbreak. If no "estimated ill" number was provided, the actual number of reported cases (e.g., laboratory-confirmed and probable cases as reported by the coordinator) was used. CDC requests that coordinators report only cases with primary exposure to water, so secondary cases (e.g., those resulting from person-to-person transmission among household members) are not included in case counts of waterborne disease outbreaks in WBDOSS.
Results
Waterborne Disease Outbreaks
A total of 134 outbreaks associated with recreational water (84 in 2007 and 50 in 2008) were reported to CDC by 38 states and Puerto Rico (Tables 2--5; Figure 1). These 134 outbreaks resulted in at least 13,966 cases of illness (Table 6); the median number of cases associated with an outbreak was 11 (range: 2--5,697 cases). Minnesota reported 12 outbreaks, Florida reported 11, and New York reported eight. Short narratives on select outbreaks are provided in Appendix B.
Treated recreational water venues were associated with 116 (86.6%) outbreaks (Figure 2), resulting in 13,480 (96.5%) cases; the median number of cases in these outbreaks was 10.5 (range: 2--5,697 persons) (Tables 2 and 3). Of the 116 outbreaks, 50 (43.1%) were associated with exposures in settings in which recreational water was not the focus of activities (i.e., apartment complex, assisted living facility, child care center, farm, hotel/motel, membership club, school, or zoo).
Untreated venues were associated with the remaining 18 (13.4%) outbreaks (Figure 2), resulting in 486 (3.5%) cases; the median number of cases in these outbreaks was 13 (range: 2--200) (Tables 4 and 5). Of these 18 outbreaks, 15 (83.3%) were associated with fresh water and three (16.7%) with marine water.
The 134 outbreaks occurred in every calendar month (Figure 3); 83 (61.9%) started during June, July, or August. The route of entry implicated for each outbreak was ingestion for 81 outbreaks (60.4%), contact for 25 (18.7%), inhalation for 18 (13.4%), combined routes for six (4.5%), and unknown for four (3.0%) (Figure 2).
Illness and Etiologies
Of the 134 outbreaks, 81 (60.4%) were of AGI; 24 (17.9%) of dermatologic illnesses, conditions, or symptoms; 17 (12.7%) of acute respiratory illness (ARI); one (0.7%) of ear-related illnesses, conditions, or symptoms; and one (0.7%) of other illness (Table 6; Figure 2). The remaining 10 (7.5%) outbreaks were of combined illness types, nine of which included ARI. Outbreaks of AGI accounted for 12,477 (89.3%) of the total outbreak-related cases; 64 (79.0%) of the 81 AGI outbreaks started during June, July, or August (Figures 3 and 4).
The etiologic agent was confirmed for 105 (78.4%) outbreaks (Table 7; Figure 2). Of the outbreaks with a confirmed etiology, 68 (64.8%) were caused by parasites; 22 (21.0%) by bacteria; five (4.8%) by viruses; nine (8.6%) by chemicals or toxins; and one (1.0%) by multiple etiology types. Outbreaks caused by parasites accounted for almost 50 times more cases than those caused by bacteria (12,492 and 254, respectively). Of the 90 outbreaks associated with treated recreational water and caused by an identified etiologic agent: 62 (68.4%) were caused by parasites, 18 (20.0%) by bacteria, eight (8.9%) by chemicals or toxins, and two (2.2%) by viruses (Table 7). Of the 15 outbreaks associated with untreated recreational water and caused by an identified etiologic agent, six (40.0%) were caused by parasites, four (26.7%) by bacteria, three (20.0%) by viruses, one (6.7%) by multiple pathogen types, and one (6.7%) by a toxin.
Parasites
All 62 outbreaks associated with treated recreational water and caused by parasites were outbreaks of AGI. A total of 58 (93.5%) outbreaks were caused by Cryptosporidium, resulting in 12,137 cases. Some of the cryptosporidiosis outbreaks were communitywide outbreaks. A communitywide cryptosporidiosis outbreak typically starts as a focal outbreak associated with one recreational water venue and evolves into an outbreak associated with multiple recreational water venues or other settings (e.g., child care centers). As the outbreak progresses, recreational water exposure might decrease in its importance as a risk factor while secondary transmission (i.e., contact with an infected person) might become increasingly important. The statewide cryptosporidiosis outbreak in Utah in 2007 is an example of a communitywide cryptosporidiosis outbreak. Of the remaining four outbreaks of parasitic disease associated with treated recreational water, three were caused by Giardia intestinalis, and one was caused by both Cryptosporidium and Giardia. A July 2007 outbreak associated with a Florida interactive fountain is suspected, on the basis of common exposures to the implicated interactive fountain of persons with primary cases and diagnostic laboratory results of persons with secondary cases, to have been caused by Cryptosporidium.
Six outbreaks associated with untreated recreational water were caused by parasites including two by Cryptosporidium, resulting in 17 cases. Four additional outbreaks of cercarial dermatitis (sometimes called "swimmer's itch") were caused by avian schistosomes; three of these outbreaks were associated with fresh water and one with marine water.
Bacteria
A total of 18 outbreaks were associated with treated recreational water and caused by bacteria. Four were outbreaks of AGI. An April 2007 outbreak, caused by Escherichia coli O157:H7 and linked epidemiologically to a temporary inflatable waterslide at a California home, resulted in 11 persons becoming ill. The waterslide was not designed for disinfection or filtration equipment. In June 2007, another outbreak caused by E. coli O157:H7 resulted in 31 cases and was linked epidemiologically to an interactive fountain at an Idaho waterpark. An environmental health investigation of the implicated, unregulated recreational water venue noted free chlorine levels <0.5 mg/L (or parts per million [ppm]). A shigellosis outbreak in July 2007 was associated with a pool or temporary inflatable waterslide at a Tennessee camp and resulted in 17 cases. An outbreak in Maryland in July 2008 caused by Shigella sonnei that resulted in illness in 12 persons was linked epidemiologically to a waterslide or dunk tank at a farm. Municipal water with no additional disinfection or filtration was used for the recreational water activities. Four outbreaks caused by Pseudomonas were each linked epidemiologically to hotel/motel pools or spas and resulted in 52 cases of skin- or ear-related illnesses, conditions, or symptoms. Ten outbreaks caused by Legionella were linked epidemiologically to pools or spas and resulted in 122 persons developing legionellosis (i.e., LD or PF). The largest legionellosis outbreak resulted in 98 cases of PF and was linked epidemiologically to a New Jersey pay-on-entry spa. Exposures leading to seven of the outbreaks occurred in a hotel/motel setting.
Four outbreaks of AGI were caused by bacteria and associated with untreated water. These included two outbreaks caused by Shigella, an outbreak caused by Plesiomonas shigelloides, and an outbreak caused by E. coli O157:H7.
Six additional outbreaks, resulting in a total of 57 cases, had unidentified etiologies but were suspected, on the basis of the clinical symptoms and common exposures to implicated pools or spas, to have been caused by Pseudomonas; exposures leading to four of these outbreaks occurred in a hotel/motel setting. An additional outbreak of an unidentified etiology was suspected, on the basis of the clinical symptoms and common exposure to a pond, to have been caused by Leptospira.
Viruses
Five outbreaks of AGI had a viral etiology and resulted in 121 cases. Norovirus was identified as the etiologic agent in each of the outbreaks; two were associated with treated water and three with lakes. The two treated venue--associated outbreaks were caused by norovirus genogroup II. One of them occurred in June 2007 and was linked epidemiologically to a California interactive fountain; an environmental health investigation noted inadequacies in facility design. Design plans were not submitted to public health officials for review before construction. Two of the three outbreaks associated with lakes were caused by norovirus genogroup I.
Chemicals/Toxins
Nine outbreaks associated with chemicals or toxins resulted in a total of 747 cases. The largest outbreak occurred during January--March 2007 and was associated with an indoor Ohio waterpark. Swimmers and employees at the waterpark experienced respiratory and eye irritation. An environmental health investigation revealed elevated trichloramine and endotoxin levels (23,24). Three outbreaks were caused by exposure to toxic chlorine gas at pools at one apartment complex and two membership clubs. Environmental health investigations of two of these outbreaks noted that the circulation pump shut down while the chlorine and muriatic (i.e., hydrochloric) acid feed pumps continued to run, allowing the chlorine and acid to mix within the circulation system plumbing without dilution, thus generating toxic chlorine gas. When the circulation pumps were restarted, the gas was released into the pools and caused respiratory distress in swimmers. Two outbreaks were attributed to release of excess chlorine caused by issues related to the automatic chemical controllers and poolside water testing. In addition, one outbreak was caused by the release of excess muriatic acid during filter backwash. Another outbreak was caused by one or more pool chemicals; however, which chemical(s) caused the outbreak was unclear. Both outbreaks occurred at outdoor waterparks. The remaining outbreak was linked epidemiologically to untreated water and was caused by exposure to brevetoxins released by algae, specifically Karenia brevis (25).
Nine additional outbreaks, resulting in 112 cases, of unidentified etiologies were suspected, on the basis of clinical symptoms and common exposures to implicated pools or spas, to have been caused by excessive levels of chlorine, pool disinfection by-products, or altered pool chemistry. Exposures leading to four of these outbreaks occurred in a hotel/motel setting. Two outbreaks, resulting in 79 cases, were suspected to have been caused by chloramines and were associated with an indoor Massachusetts waterpark and an indoor New York school pool.
Previously Unreported Outbreaks
Data on five previously unreported recreational water--associated outbreaks were received (Table 8). Four children at a residential school became ill with AGI after using a fill-and-drain pool. All four tested positive for Campylobacter. Published and unpublished data on four legionellosis outbreaks that were associated with recreational water and occurred during 1993--1999 were added to the WBDOSS database (26,27). Three of the legionellosis outbreaks resulted in four deaths; these deaths are included in the respective outbreak case counts. Data on these five outbreaks are summarized but not included in the analysis for this report.
Pool Chemical--Associated Health Events
Maryland and Michigan reported 32 pool chemical--associated health events that did not meet the definition of an outbreak associated with recreational water and occurred during 2007--2008 (Table 9). These health events resulted in 48 cases of illness or injury; the median number of cases associated with an event was one (range: 1--15 cases). No deaths were reported. Nineteen (59.3%) of the events resulted in ARI, six (18.8%) in ocular symptoms, three (9.4%) in AGI, and four (12.5%) in ARI and other illness. Almost half (15 [46.9%]) of the events occurred at a private residence. Six (18.8%) occurred at a public setting and 11 (34.4%) at an unknown setting. All six events affecting a single child aged ≤13 years occurred at private residences. Of the 32 events, 26 (81.3%) were the result of pool chemical--exposures that occurred in June, July, or August. Twenty-six (81.3%) events could be attributed at least in part to chemical handling errors, such as mixing incompatible chemicals (e.g., acid and chlorine or different chlorines) and not using personal protective equipment (PPE).
Hazardous Substances Emergency Events Surveillance Associated With Aquatic Facilities
For 2007--2008, a total of 12 state health departments†† reported 92 hazardous substance events involving aquatic facilities, 55 (59.8%) of which involved injured persons. The 92 events led to 663 persons being evacuated, 231 being injured (median number of persons injured in an event with injuries: one; range: 1--44), and 111 persons (84 [75.7%] of whom were injured) being decontaminated (Table 10). No deaths were reported.The majority of injured persons (132 [57.1%]) were members of the general public; 50 (21.6%) were students. Over half of the injured persons (140 [60.6%]) had injuries/symptoms requiring hospital treatment but not admission. Although injured persons primarily reported respiratory irritation or gastrointestinal injuries/symptoms, they also reported suffering from a wide range of injuries/symptoms (Table 11). A total of 33 (35.9%) of the overall events and 22 (40.0%) of the events with injured persons occurred in residential areas (Table 12).
A primary contributing factor was reported for 88 (95.7%) of events overall and 52 (94.5%) of events with injured persons (Figure 5). Among this subset of events, human error was the leading primary contributing factor for events overall and those with injured persons (51 [58.0%] and 36 [69.2%], respectively). Equipment failure was also frequently reported to be the primary contributing factor of events overall and those with injured persons (31 [35.2%] and 16 [30.8%], respectively).
National Electronic Injury Surveillance System
During 1999--2008, the median estimated number of annual ED visits for pool chemical--associated injuries was 4,120 (range: 3,315--5,216) (Figure 6). In 2008, an estimated 4,574 persons (1.5 per 100,000 population [95% confidence interval (CI): 0.9--2.1]) visited an ED for pool chemical--associated injuries (Table 13). The most common injury diagnoses were poisoning, which includes ingestion of pool chemicals as well as inhalation of their vapors, fumes, or gases (1,784 [95% CI: 585--2,984]) and dermatitis/conjunctivitis (1,452 [95% CI: 936--1,969]); more than half of the injuries occurred at a residence (2,870; [95% CI: 1,363--4,377]). Almost three quarters of the injuries occurred during June, July, or August. No deaths were documented.
Vibriosis
During 2007--2008, a total of 236 individual vibriosis cases associated with recreational water exposure were reported by 25 states, representing 20.6% (236/1,148) of the total number of vibriosis cases reported for these years (28,29). Of the 236 patients, 74 (31.4%) were hospitalized, and nine (3.8%) patients died (Table 14). The most frequently isolated Vibrio species was Vibrio alginolyticus, which was isolated from clinical specimens from 106 (44.9%) patients overall, 11 (14.9%) of those hospitalized, and two (22.2%) of those who died. V. vulnificus was isolated from clinical specimens from 48 (20.3%) patients overall, 36 (48.6%) of those hospitalized, and six (66.7%) of those who died. Recreational water--associated Vibrio infections occurred most commonly during summer months (Figure 7).
Nearly all vibriosis patients reported that they were exposed to recreational water in coastal states (Figure 8). The most frequently reported exposure location was the Atlantic coastal states (86 [36.4%); followed by the Gulf Coast states, which include Florida (81 [34.3%]); Pacific coastal states (59 [25.0%]); and noncoastal states (10 [4.2%]) (Table 15). Florida, Hawaii, California, and Texas had the highest number of reported exposures in their jurisdictions (31, 29, 27, and 27, respectively).
Primary Amebic Meningoencephalitis
Eight individual fatal cases of PAM caused by Naegleria fowleri were reported for 2007--2008 (Table 16). Illness occurred after exposure to warm untreated freshwater in Florida (three cases), Texas (two cases), Arizona (one case), California (one case), and Oklahoma (one case). The median age at death was 13 years (range: 9--22 years); seven (87.5%) patients were male.
Discussion
Overview of Outbreaks
A total of 134 recreational water--associated outbreaks were reported to CDC for 2007--2008. They occurred year-round, but almost two thirds of them started during the traditional summer swim season (Memorial Day through Labor Day). The 2007--2008 outbreak count represents a 71.8% increase over that for 2005--2006 (n = 78) and the largest number of outbreaks ever reported for a 2-year period (Figure 9). The number of drinking water--associated outbreaks reported to CDC concurrently increased 80%, from 20 for 2005--2006 to 36 for 2007--2008 (16). Overall, the number of recreational water--associated outbreaks reported annually has increased substantially since reporting to CDC began in 1978. Possible contributing factors to the increased recreational water--associated outbreak reporting include but are not limited to 1) changes in detection, investigation, and reporting of waterborne disease outbreaks and 2) the emergence of Cryptosporidium.
Dedicating human resources to waterborne disease detection, investigation, and reporting could be contributing to the observed increase. In late 2006, CDC and its state, DC, territorial, and FAS partners began developing a waterborne disease network and identified points of contact for water-related issues in each reporting jurisdiction, and CDC hired a permanent full-time surveillance coordinator dedicated to running WBDOSS. Having staff dedicated to water-related complaints and inquiries has been reported to be key in optimizing waterborne disease surveillance (30). This network allows CDC and its partners to share outbreak investigation tools (e.g., water testing, Cryptosporidium subtyping, questionnaires, and press releases) and lessons learned (e.g., via webinars and newsletters). In addition, CDC, EPA, and state partners have been collaborating to strengthen waterborne disease outbreak detection, investigation, response, and reporting under the umbrella of the Environmental Health Specialists Network (EHS-Net) Water program, which provides funding for waterborne disease staff and projects in state public health agencies. One EHS-Net Water project that involved conducting a retrospective review of state-specific waterborne disease outbreak data at the states and at CDC identified outbreaks that had not been reported previously to CDC (13).
The increasing number of outbreaks of AGI is driving the overall increase in outbreak reporting (Figures 9 and 10). Since the first reported U.S. recreational water--associated cryptosporidiosis outbreak was identified in 1988 (31), Cryptosporidium has emerged as the single most important etiologic agent of recreational water--associated outbreaks (Figure 11). In 2007--2008, of 81 outbreaks of AGI, 60 (74.0%) were caused by Cryptosporidium; all but two were associated with treated recreational water venues. The percentage of outbreaks of AGI caused by Cryptosporidium and associated with treated recreational water was 82.9% (Figure 4) for both 2007--2008 (58/70) and 2005--2006 (29/35) (13). In contrast, it was 68.2% (15/22), 50.0% (9/18), and 55.6% (10/18) in 1999--2000, 2001--2002, and 2003--2004, respectively (5,14,15). Its predominance as an etiologic agent, particularly among outbreaks associated with treated recreational water venues, is related to its chlorine tolerance, which allows it to survive in properly chlorinated recreational water >10 days (32). Since 2004, the number of cases of cryptosporidiosis reported to CDC annually has more than tripled (33). Although the reasons for increased cryptosporidiosis case and outbreak reporting are not understood completely, treated recreational water venues continue to play a key role in Cryptosporidium transmission.
Treated Recreational Water Venues and Pathogens
In treated recreational water venues, chlorine and bromine are the primary barriers to pathogen transmission. Maximizing disinfectant effectiveness requires maintaining appropriate pH levels and circulating the water through a filter to remove particulates that deplete disinfectants. Chlorine- and bromine-susceptible pathogens (e.g., Shigella, norovirus, and Giardia) caused 23 (25.6%) of 90 treated recreational water--associated outbreaks of known etiology and indicate lapses in operation. Such lapses also are identified frequently on routine inspection. An analysis of data from >121,000 pool inspections conducted across the United States in 2008 indicated that 10.7% of inspections identified disinfectant level violations, and 12.1% of inspections resulted in immediate closure because of violations that threatened public health or safety (34). Implementation of proper pool operation practices (e.g., adequate disinfection) has been demonstrated to stop transmission of chlorine-susceptible pathogens effectively and quickly (35), which underscores the need for improved operator training.
Molecular epidemiology data from investigations of the 2007--2008 outbreaks caused by norovirus suggested a possible association between recreational water type and genogroup. This led to a review of 19 reports of outbreaks (1990--2006) confirmed to be caused by norovirus, a chlorine-susceptible pathogen (36). The investigation of one (20.0%) of five treated recreational water--associated outbreaks included molecular typing of isolates, which belonged to genogroup II. Investigations of three (21.4%) of 14 untreated recreational water--associated outbreaks included molecular typing of isolates. Two of the outbreaks were caused by norovirus genogroup I and one by norovirus genogroup II. Data on further characterization by genotyping were not available. Only genogroup II was isolated from implicated treated recreational water venues; however, the limited number of outbreaks with genogroup data precludes further interpretation of these data and underscores the need for molecular typing to elucidate the epidemiology of waterborne disease outbreaks caused by norovirus (37).
In contrast to chlorine-susceptible pathogens, Cryptosporidium requires extended contact time for inactivation at typically required or recommended free chlorine levels (1--3 mg/L). Thus, Cryptosporidium transmission can occur even in well-maintained treated recreational water venues. During 1999--2008, the parasite caused 74.4% (122/164) of treated recreational water--associated outbreaks of AGI (Figure 10). During 2007--2008, treated recreational water--associated outbreaks of cryptosporidiosis accounted for 86.9% (12,137/13,966) of cases overall; the communitywide cryptosporidiosis outbreak in Utah in 2007 alone accounted for 40.8% (5,697/13,966). Such communitywide cryptosporidiosis outbreaks can occur for the following reasons: Cryptosporidium can survive in properly chlorinated recreational water >10 days (32); it has a protracted incubation period (approximately 7 days) (38), which prolongs the amount of time that elapses between infection and epidemiologic implication of the outbreak source; and swimmers who continue to swim while ill can introduce the parasite to multiple recreational water venues. By the time reported cryptosporidiosis cases are linked epidemiologically to a particular venue, transmission already might be occurring at another venue in the community despite public health efforts to control the outbreak. An investigation of a communitywide cryptosporidiosis outbreak in Utah indicated that 20% of case-patients swam while ill with diarrhea and identified approximately 450 potentially contaminated recreational water venues (39).
Modifying swimmer behavior is a critical component of reducing recreational water--associated outbreaks, particularly those caused by chlorine-tolerant Cryptosporidium. Fecal-oral transmission associated with recreational water can occur when swimmers ingest contaminated water. The water can be contaminated by pathogens that cause AGI when a person has a fecal incident in the water or fecal material washes off of a swimmer's body. Diarrhea-exclusion policies for all patrons should be established, implemented, and enforced at all recreational water venues and particularly for young children and visitors from high-risk settings (e.g., child care centers), which have diarrhea-exclusion policies but might not always enforce them (40). In addition, policies for restricting staff who are ill with diarrhea from entering the water, similar to those restricting ill foodhandlers from food preparation, should be established, implemented, and enforced (41).
For water contamination to be minimized, good swimmer hygiene is imperative. Swimmers should wash with soap, especially the perianal area, before entering the water; washing young children thoroughly with soap and water before they enter the water is particularly important (42). An adequate number of clean, functioning, well-stocked (e.g., with soap) and easily accessible facilities with showers, toilets, and handwashing sinks located near the water might promote good swimmer hygiene. Taking frequent bathroom breaks, particularly for young children, and checking swim diapers every 30--60 minutes also might help minimize water contamination. Diaper-changing facilities with handwashing stations should be located close to the water to encourage hygienic diaper-changing and handwashing. Increased awareness of the risk for recreational water--associated illness, its potential severity, and the efficacy and the simplicity of the prevention steps (e.g., not swimming while ill with diarrhea and not swallowing water) (43,44) might make the public more likely to adopt healthy swimming behaviors.
The increasing number of reports of treated recreational water--associated outbreaks of cryptosporidiosis and their potential to evolve into communitywide outbreaks also call for prevention measures beyond conventional chlorination and filtration (45). Ultraviolet (46--48) and ozone (49,50) disinfection systems can effectively inactivate Cryptosporidium and are available for use at treated recreational water venues. Remedial biocidal treatment (i.e., hyperchlorination: 20 mg/L free chlorine for 12.75 hours or the equivalent at water pH ≤7.5 and temperature at ≥77°F [25°C] in the absence of stabilized chlorine [32] or 40 mg/L free chlorine for approximately 30 hours at water pH 6.5 and temperature at ≥77°F [25°C] in the presence of stabilized chlorine [51]) is another potential risk-reduction option. Increased circulation flow rates and occupancy-dependent water replacement might also help reduce risk (45).
Finally, Cryptosporidium's ability to cause communitywide outbreaks underscores the need for more rapid implementation of control measures once an increase in case reporting is noted rather than waiting for an outbreak investigation to implicate a specific source of transmission. A response plan should include 1) establishing a strong communication network with community partners likely to be affected by a cryptosporidiosis outbreak (e.g., operators of treated recreational water venues and child care centers), 2) setting a pre-outbreak disease action threshold (e.g., a two- to threefold increase in number of cases over baseline), and 3) rapid mobilization of community partners to implement intensified control measures (e.g., communitywide hyperchlorination of treated recreational water venues) once the threshold is exceeded (52). To address the concerns of communitywide cryptosporidiosis outbreaks, Salt Lake County, Utah, and Idaho each developed a cryptosporidiosis prevention campaign before the 2008 summer swim season. Both campaigns engaged community partners and educated the public about healthy swimming behaviors. For 2008, Utah reported no waterborne cryptosporidiosis outbreaks, and Idaho reported only one outbreak with two identified cases.
Venue-Specific Challenges to Prevention of Pathogen Transmission in Treated Recreational Water Venues
Spas and interactive fountains present particular challenges to prevention of recreational water--associated illness. They typically hold smaller volumes of water than pools, resulting in a relatively high bather load to water volume ratio, and aeration of the water depletes disinfectants.
Spas (hot tubs). The higher water temperatures of spas make it difficult to maintain proper disinfectant levels. As a result, poorly maintained spas are ideal for amplification of naturally occurring thermophilic environmental contaminants (e.g., Pseudomonas aeruginosa and Legionella). Common recurring themes in outbreaks of P. aeruginosa and Legionella infection include 1) epidemiologically implicating both the pool and spa in a given setting; 2) exposure occurring in a hotel/motel setting, in which spa operation is not a full-time job; 3) exposure occurring in the context of a group event (e.g., a wedding or birthday party), which can lead to the rapid depletion of disinfectant levels; and 4) the group event taking place on a weekend, when trained staff might not be on duty.
Frequent co-location and use of both spas and pools can make it difficult epidemiologically to implicate one or the other. However, Pseudomonas and Legionella are most likely to multiply in the higher water temperatures in spas (53,54). Group events might lead multiple participants to use a given spa simultaneously, possibly leading to a substantial number of bathers, which can rapidly overwhelm its disinfection capacity and spur bacterial amplification. Group events also might facilitate detection of an outbreak. Conversely, the repeated identification of these outbreaks in the hotel/motel setting highlights the role of travel in pathogen transmission and the potentially decreased likelihood of outbreak detection when travelers disperse to their resident states or countries.
To prevent spa-associated outbreaks, operators must understand the factors that contribute to bacterial amplification and take steps to limit contamination and prevent infection, particularly by thermophilic pathogens. Proper chlorination or bromination are effective in killing Pseudomonas and other skin-infecting bacteria. A review of 18 outbreaks caused by Pseudomonas demonstrated that the implicated spas with recorded chlorine levels all had levels ≤0.5 mg/L (55). Maintaining free chlorine or bromine levels at 2--6 mg/L and pH levels in a range of 7.2--7.8 can minimize bacterial amplification and biofilm build-up, although pathogens might not be eliminated completely from the water. Pseudomonas and Legionella can persist in spa biofilms, even in the presence of adequate disinfectant, and proliferate rapidly if the disinfectant level drops (54,56). A review of data from >5,200 spa inspections conducted across the United States in 2002 revealed that 17.1% of inspections identified improper disinfectant levels, and 11.0% of inspections resulted in immediate closure because of violations that threatened public health or safety, again underscoring the need for improved operator training (57).
The greater frequency of outbreaks of Pseudomonas and Legionella infections associated with hotel/motel spas underscores the importance of proper operation in these settings. Hotels and motels should consider having only trained employees operate and maintain pools and spas, particularly on weekends, when usage might increase, and enhance water quality monitoring when large groups or events are scheduled.
Interactive fountains (splash pads or water play areas). Interactive fountains are particularly prone to contamination by fecal material, vomit, and particulates because of open access to young users, persons in street clothes and shoes, and animals. Contaminants can drain into the water reservoir and be recirculated (i.e., sprayed back on users), increasing the likelihood of ingestion of contaminated water. Because interactive fountains typically do not have standing water above ground, they might be inadvertently exempt from pool codes. The lack of public health oversight in some jurisdictions might increase the likelihood of improper design, maintenance, or operation of these venues. An investigation of a 2008 Texas cryptosporidiosis outbreak epidemiologically linked multiple laboratory-confirmed cases to interactive-fountain exposures. At the time, interactive fountains were not regulated under the Texas state pool code; consequently, emergency regulations for interactive fountains were enacted in 2009, and the 2010 pool code was amended to include interactive fountains (Tex. Health & S § 341.0645 and Tex. Health & S § 0695).
Fill-and-drain pools/temporary water slides. The use of tap water to fill temporary venues used by young children continues to be a public health challenge. Lack of additional disinfection and filtration has resulted in multiple outbreaks being associated with use in residential and public settings (58). The potential risk for infection associated with using temporary venues filled with tap water without additional disinfection and filtration should be considered before use in residential settings. To reduce the risk for pathogen transmission, in addition to exclusion of persons with AGI, these pools should be emptied and cleaned at least daily. CDC recommendations on cleaning fill-and-drain pools are available at http://www.cdc.gov/healthywater/swimming/pools/inflatable-plastic-pools.html. On the basis of documented outbreaks such as the previously unreported campylobacteriosis outbreak associated with a fill-and-drain pool at a Maryland residential school (Table 8), these temporary venues should be eliminated from public use (e.g., at child care centers).
Treated Recreational Water Venues and Chloramines
Three outbreaks of ARI or eye irritation, two of which occurred in January, were caused or suspected to be caused by an accumulation of chloramines in the water and air of two indoor waterparks and an indoor school pool. Chloramines are disinfection by-products that result from chlorine oxidation of nitrogenous compounds (e.g., perspiration, saliva, urine, and body oils) commonly shed into the water by swimmers. Chloramines are generated in the water and can volatilize into the surrounding air. Swimmers' water activities and features that splash, spray, and aerate water disturb the water surface and promote the dispersion of chloramines into the atmosphere surrounding indoor treated recreational water venues (59,60). Air in these enclosed settings might be recycled more often in the winter to minimize heating costs, limiting the amount of fresh, cold air that is introduced and the amount of warm chloramine-polluted air that is exhausted. The resulting high levels of chloramines can cause ocular, respiratory tract, and mucous membrane irritation and also might be linked to asthma (61). As swimming in the United States evolves from a summertime into a year-round activity, indoor air-quality issues are likely to increase, and chloramines could become an increasingly important etiologic agent of treated recreational water--associated outbreaks. Two of the three outbreaks occurred at indoor waterparks. Such waterparks might be more prone to accumulation of chloramines in the air than traditional indoor recreational water venues with one or two pools because of larger bather loads (i.e., more nitrogenous compounds are introduced into the water); more features such as wave pools, fountains, and slides that splash, spray, and aerate the water; and increased cost of maintaining the air temperature of an increased number of enclosed cubic square feet. An investigation of an outbreak associated with the indoor Ohio waterpark revealed that the high placement of air supply and return ducts caused chloramines to accumulate in the air at the pool surface and deck level (23). After the ventilation system was reconstructed considerably, no new cases of respiratory and ocular symptoms were detected.
The variability in indoor air quality and shortage of laboratories that perform analyses for airborne chloramines impedes investigators' ability to respond to reports of ocular and respiratory distress. The length of time required for testing makes it difficult to obtain rapid and quantitative measurements of contamination of the air surrounding implicated indoor treated recreational water venues. Using the water's measured total chlorine (i.e., the sum of free and combined chlorine levels) and free chlorine levels to calculate the level of combined chlorine, of which chloramines are a subset, might be useful for evaluating indoor air quality. Levels that exceed test kit capacity should be remeasured by making dilutions using distilled water. These outbreaks underscore the need to train pool operators to routinely monitor combined chlorine levels to protect the health of patrons and staff and the need for public health authorities to include the calculation of the water's combined chlorine level as a standard part of pool inspections.
Accumulation of chloramines in the air surrounding indoor treated recreational water can be prevented by improving water treatment, swimmer hygiene, and air ventilation. Studies suggest that installation of ultraviolet or ozone treatment devices in circulation systems can reduce chloramine levels in the water (62--64) and also can effectively inactivate pathogens, including chlorine-tolerant Cryptosporidium. Because the nitrogenous compounds introduced into the water by swimmers are precursors to chloramine formation, swimmers must be engaged in any chloramine-reduction plan. Such an effort should raise public awareness about the role of urine and sweat in creating the ocular and respiratory irritants at treated recreational water venues. Plans to improve air quality also can be aided by working with the public to improve swimmer hygiene. Aquatics staff should encourage swimmers to at least rinse before entering the water and facilitate frequent bathroom breaks, particularly for young children (e.g., instituting adult-only swim times or short closures for water quality testing). Showering for 17 seconds has been demonstrated to decrease by 35%--60% the load of sweat and other pollutants that wash off of swimmers' bodies (65).
Pool Chemical--Associated Outbreaks and Health Events
Nine pool chemical--associated outbreaks and 32 additional pool chemical--associated health events were reported to WBDOSS by Florida, Illinois, Kentucky, Maryland, Michigan, and New York. Data on additional pool chemical--associated health events are captured by the HSEES System and NEISS. Pool chemical--associated health events not only have the potential to impact individual and public health adversely but also have a negative financial impact. Approximately 60% of the injured individuals in the HSEES cohort and 100% of those in the NEISS cohort sought treatment in hospital EDs. Pool chemical--associated health events also might require responses from multiple government agencies and officials (e.g., fire fighters, police officers, paramedics, and hazardous materials personnel).
Analysis of HSEES data examined factors contributing to hazardous substance releases of pool chemicals. The most frequently reported factors contributing to HSEES events were human error and equipment failure. A review of the reports of 2007--2008 pool chemical--associated outbreaks and other health events reported to WBDOSS revealed common themes, including mixing of incompatible chemicals, improper handling of chemicals, and overreliance on automatic controllers. These findings indicate that pool chemical--associated health events are preventable through engineering, education, and enforcement. Examples of engineering-based prevention measures include electric interlocks and flow switch sensors, which shut down the chemical feed pumps when the circulation pump shuts down or during filter backwash and thus prevent concentrated chlorine and acid from mixing and generating toxic chlorine gas. Previous studies underscore that requiring pool operator training can reduce the number of water quality violations (66,67). Thus, future prevention efforts should require training for all public pool operators on preventive maintenance and how to read pool chemical labels and material safety data sheets, which include information on which chemicals are incompatible and proper chemical handling. Education efforts need to include operators in settings in which recreational water is not the primary focus (e.g., schools or hotels/motels). Given that pool chemical--associated health events frequently occur in the residential setting, messages about safe chemical handling (e.g., not handling chemicals in the presence of children) should also target residential pool owners.
Untreated Recreational Water Venues
The proportion of AGI outbreaks associated with untreated venues relative to treated venues decreased over the previous decade. However, the number of outbreaks associated with untreated venues has remained relatively constant. During 2007--2008, a total of 11 outbreaks of AGI associated with untreated freshwater venues were reported; all of these were linked to a lake, river, stream, or spring. Untreated venues have a higher proportion of outbreaks caused by chlorine-susceptible pathogens compared with treated venues.
Studies have determined the utility of monitoring (18) and testing for fecal indicator bacteria to assess the risk for recreational water--associated gastrointestinal illness (68--70) in large bodies of water (e.g., the Great Lakes and oceans). The NEEAR study is being conducted to evaluate rapid water quality testing methods that can produce results in <2 hours and to correlate these indicators with health effects among beachgoers. Results from freshwater Great Lakes beaches have demonstrated an association between an increasing signal detected by a quantitative polymerase chain reaction--based test method for enterococci and human health effects (68,71). Children aged <10 years were at greater risk for AGI following exposure to water with elevated levels of enterococci. The small inland water bodies associated with the outbreaks described in this report do not have consistent or identified external sources of contamination (e.g., sewage releases or overflows), suggesting that swimmers might be an important source of water contamination and pathogen transmission.
As with treated recreational water, human behavior plays a key role in the transmission of pathogens in untreated recreational water. Modification of swimmer behavior is critical in untreated water given the lack of disinfection and filtration barriers to pathogen transmission. Recommendations for swimmer hygiene in untreated recreational waters are the same as those discussed previously for treated recreational water. In addition, beach managers and swimmers should be aware that shallow, poorly circulated swimming areas, which are particularly desirable for young children learning toileting skills or wearing diapers, might pose a higher risk for exposure to swimmer-introduced pathogens compared with deeper, well-circulated swimming areas. Potential methods to improve circulation of water through beach areas should be explored to reduce the longevity of focal, swimmer-derived contamination and thus risk for pathogen transmission. In addition to improved swimmer hygiene, exposure to high bacteria levels also can be reduced by avoiding swimming after heavy rainfall at sites affected by runoff to reduce exposure to any increase in contaminants and by not swimming near storm drains or pipes that might release contamination into water bodies (72).
Chlorine was added routinely to both an Ohio lake associated with an outbreak of multiple infectious etiologies and a man-made lake associated with a 2008 Texas cryptosporidiosis outbreak. The Ohio beach manager reported adding chlorine to the water to improve water clarity, not to disinfect. Public health and environmental concerns about the addition of chlorine to untreated recreational water include swimmers believing mistakenly that the water is microbiologically safe.
Four outbreaks of confirmed and suspected cercarial dermatitis caused by avian schistosomes were reported during 2007--2008. Three were associated with fresh water and one with marine water. This self-limited disease is known to occur among persons exposed to lakes in which infected birds contaminate water inhabited by the intermediate host snail (73). The risk for acquiring cercarial dermatitis might be reduced by avoiding potentially contaminated lakes, avoiding shallow swimming areas in which infected snails reside, instituting a snail control program, and not attracting birds that transmit the schistosomes into swimming areas (e.g., not feeding them).
Marine Water
Three outbreaks were associated with exposure to contaminated marine recreational water. Since 1978, only six such outbreaks have been reported to WBDOSS. Although outbreaks associated with marine waters are reported infrequently, evidence from multiple sources demonstrates that contamination of marine waters is common and that swimming in marine waters is associated with increased risk for AGI (69,70). States and territories report water quality testing results and notification data for their coastal and Great Lakes recreational water to EPA. In 2009, one or more advisories or closure notices were issued for 1,642 (43.0%) of the 3,819 monitored coastal beaches because monitoring results for bacteria exceeded state or EPA standards (74). This represents an increase over previous years that might be attributable to increased monitoring, increased precipitation during the summer swim season in some coastal states, or the inclusion of preemptive closings made because of rainfall. Multiple studies have linked these water quality indicators with increased risk for recreational water--associated illnesses (69,70,75) although such pathogen transmission also can occur when water quality indicators are within established limits (76). The reasons for the infrequency of reported marine-associated outbreaks might include the wide geographic dispersion of residences of beachgoers and the fact that illnesses might not be attributed to swimming in marine waters. Prospective epidemiologic studies indicate that these beaches can be associated with illness despite an absence of reported outbreaks (68,71,77).
Algae toxicity. Toxin- or chemical-associated outbreaks can occur naturally. One outbreak that was caused by exposure to brevetoxins released by Karenia brevis near the Florida coast in 2007 resulted in at least 15 cases of illness (25). The outbreak investigation focused on dredging company workers, who reported symptoms such as throat and ocular irritation and coughing. The effects of this red-tide event on other populations are unknown. A study of the economic impact of Karenia brevis in one Florida county during 2001--2006 estimated the marginal costs of illness to be between $500,000 and $4 million dollars (78). Closure or restricted recreational use of marine beaches and freshwater lakes and ponds because of algal blooms might also result in concerns about lost revenue at the local or regional level (79). No U.S. federal regulations or official EPA guidelines specify allowable concentrations of toxins related to harmful algal blooms in water.
Other Recreational Water--Associated Health Events
Vibriosis
The number of Vibrio infections associated with water exposures during 2007--2008 (n = 236) was higher than the number reported in 2005--2006 (n = 189) (28,29). The majority of deaths and hospitalizations were caused by V. vulnificus infection, which occurs predominantly in the Gulf Coast. V. vulnificus wound infection can cause severe illness and sequelae, including septicemia, and require amputation. Disease is more common and severe among persons with preexisting wounds and chronic medical conditions (e.g., diabetes, heart disease, or liver disease) (80,81). In general, swimmers with open wounds or sores should refrain from swimming.
Primary Amebic Meningoencephalitis
Eight fatal cases of PAM caused by Naegleria fowleri were reported for 2007--2008 (Table 16). This rare disease is of public health importance because of the high (>99%) fatality rate associated with infection (82) and the public alarm it raises about the recreational use of freshwater. N. fowleri is a free-living ameba that proliferates in warm freshwater and hot springs. Disease occurs when the ameba coincidentally enters the nasal passages, travels to the olfactory lobe of the brain, and infects brain tissue. The eight cases all resulted from warm freshwater exposures in southern states during the summer.
The limited number of PAM cases makes it difficult to determine why certain persons become infected. As a result, the efficacy of existing risk-reduction strategies is uncertain. Lake water surveys conducted in southern states have frequently detected Naegleria (83--85), and PAM case reports demonstrate recent exposure to swimming in warm, freshwater lakes, rivers, or hot springs. Swimmers might reduce their risk for Naegleria infection by avoiding water-related activities in warm freshwater during periods of high water temperature and low water levels; holding the nose shut or using nose clips when taking part in water-related activities in bodies of warm freshwater; and refraining from digging in or stirring up sediment while swimming in shallow, warm, freshwater areas (86). CDC is collaborating with CSTE and individual states to improve case investigations by collecting exposure, symptom, treatment, and environmental data. Systematic collection of these data could help refine current risk-reduction measures and guidance.
Prevention
Recreational water--associated illness can be prevented through concerted efforts by public health professionals, recreational water venue operators, and the general public. Given the different stakeholders required to promote healthy and safe swimming, good communication among these groups is imperative.
Public health professionals regulate recreational water facilities and investigate outbreaks as a multidisciplinary team (e.g., including laboratorians, environmental health specialists, and epidemiologists within and among jurisdictions). They also function as an important source of information for operators and the swimming public. Public health professionals should
- have opportunities to maintain and build upon current knowledge about recreational water--associated illness and operation,
- update and improve codes to stay current with changing designs and needs demonstrated by findings of outbreak investigations,
- lead and collaborate with the aquatics industry to educate the general public,
- use inspection and beach monitoring data as surveillance data to inform public health decision-making and program planning, and
- develop expertise in detecting and investigating recreational water--associated outbreaks and other health events.
Various tools are available to operators of treated recreational water venues to protect the health and safety of swimmers and aquatics staff. The traditional paradigm of two barriers (disinfection and filtration) to pathogen transmission in treated recreational water needs to shift to include in-line (i.e., usually installed after filtration and before disinfection) secondary or supplemental treatment (e.g., ultraviolet treatment or ozonation). Ultraviolet and ozone treatment not only will increase the level of protection against chlorine-tolerant Cryptosporidium but also will break down chloramines. Because these systems depend on circulation, they alone will not eliminate outbreaks; a commitment to monitoring and maintaining water quality and educating the public (e.g., including healthy swimming messages in posters in bathrooms, on the back of ticket stubs, and in contracts for group events) also is critical. To maximize their ability to protect the health and safety of swimmers and aquatics staff, pool operators working in all public settings should complete training that includes such topics as disinfection, water chemistry, preventive maintenance, chemical safety, and illness and injury prevention. In response to the lack of protective barriers at untreated recreational water venues (e.g., lakes and oceans), beach managers and public health officials should implement water quality testing programs and educate swimmers about prevention measures specific to untreated recreational water venues (e.g., not swimming after heavy rainfall) and for illnesses unlikely to be prevented by current water quality guidelines (e.g., vibriosis, PAM, and otitis externa).
Swimmers are an important source of recreational water contamination (i.e., pathogens and nitrogenous compounds); thus, it is imperative to educate the public about healthy swimming behaviors. The general public also can participate in the healthy swimming effort by checking chlorine and pH levels before getting into treated recreational water, asking operators of treated recreational water venues about the latest inspection score, encouraging operators to take steps known to kill Cryptosporidium, educating other swimmers about healthy swimming, and reporting operational issues, if not corrected, to public health agencies.
Limitations
The findings in this report are subject to at least four main limitations. First, differences in the numbers of outbreaks reported by different jurisdictions might be attributable to factors such as the variable requirements for notifiable diseases and variable public health capacity to detect, investigate, and report recreational water--associated outbreaks. Thus, the jurisdictions reporting outbreaks most frequently might not be the jurisdictions in which the outbreaks most frequently occur (87). Second, factors such as incubation period, size and location of the outbreak exposure, severity of illness, and geographic dispersion of ill swimmers also likely influence the detection, investigation, and reporting of recreational water--associated outbreaks. Larger outbreaks are more likely to be identified by public health authorities. In contrast, smaller outbreaks (e.g., those associated with residential pools and spas) might go undetected because fewer persons are ill, and they might attribute illness to other common exposures. In addition, outbreaks associated with venues that draw from a wide geographic range (e.g., large lakes and marine beaches or hotel/motel pools or spas) might be difficult to detect because potentially infected persons disperse widely from the site of exposure and, therefore, cases of illness might be less likely to be identified as part of an outbreak. Prospective epidemiology studies, such as EPA's NEEAR Water Study (68), have revealed elevated rates of AGI in swimmers compared with nonswimmers at all beaches studied. Multiple other prospective studies of AGI associated with beach swimming have also indicated elevated rates of illness associated with swimming in lakes and oceans, though few outbreaks have been detected (69,76). Data on endemic recreational water--associated illnesses are not captured by WBDOSS, highlighting the need for more studies to estimate the magnitude of risk for illness for routine, nonoutbreak-associated exposures at recreational water venues. Third, the incidence of recreational water--associated outbreaks of cryptosporidiosis in 2007 might be overestimated in this report. The statewide outbreak in Utah and the individual outbreaks in neighboring Idaho and Wyoming might have been a single multistate outbreak. Of note, Colorado also detected a statewide increase in cryptosporidiosis cases in the summer of 2007 that was determined to be associated with multiple risk factors in multiple counties (88). In 2007, had Cryptosporidium isolates from each health event been available for subtyping, investigators might have been able to determine if they were linked to each other. Finally, few outbreak reports included findings from environmental health investigations of the implicated venue. It is unclear whether environmental health investigations were not conducted or the findings were not included in reports. Whereas epidemiologic investigations provide data that characterize outbreaks, data from environmental health investigations can be used to identify factors that contributed to the outbreak to help prevent future outbreaks.
This is the first surveillance summary to present pool chemical--associated health event data from multiple surveillance systems, and the data provided in this report regarding such events are subject to at least six additional limitations. First, injuries, illness, or pool chemical spills might not be serious enough to require outside assistance and thus are not detected. Second, because communication channels might not be established between public health agencies and emergency responders, certain pool chemical--associated health events might not be reported. Such communication is important because the outbreaks and other health events caused by pool chemicals might be more likely to involve first responders and hazardous materials personnel than waterborne disease coordinators, who voluntarily report outbreaks to WBDOSS. This in part might be the reason why pool chemical--associated outbreaks and other health events were reported to WBDOSS by only six states. Third, water chemistry can change quickly and contaminated air can be ventilated rapidly, making it difficult to determine the etiology of a pool chemical--associated health event. This might explain why the etiologies of nine outbreaks were not determined but are suspected to have been caused by excess chlorine, disinfection by-product levels, or altered pool chemistry. Fourth, the approximately 100 hospitals participating in NEISS and the 12 states participating in HSEES and reporting events might not be representative of the United States, and therefore the findings might not be generalizable. Fifth, the fact that "chlorine" was the only chemical term used to search the HSEES system database might have created a bias for not identifying events caused by other pool chemicals. Finally, no one surveillance system collects data on all events, but, rather, each collects data on a subset of the events. This leads to the possibility of not collecting data on events that do not meet the case definition of any of the systems but could also lead to duplicate reporting. For example, health event data reported to NEISS also might be reported to either WBDOSS or the HSEES System. NEISS location data are limited to type of setting (e.g., residence or school) and do not include information such as the state or county in which the event occurred; this precludes de-duplication of reports across all surveillance datasets.
Conclusion
CDC and ATSDR can lead the effort to prevent recreational water--associated outbreaks and other health events by 1) spearheading the efforts to set minimum national standards to protect the health and safety of swimmers and aquatics staff at treated recreational water venues; 2) providing data to advocate for waterborne disease prevention and control efforts; 3) continuing to provide web-based and other healthy swimming resources for public health partners, the public, and the aquatics industry; and 4) coordinating efforts among agencies to prevent pool chemical--associated health events. Multiple federal organizations provide assistance with investigations of recreational water--associated outbreaks and other health events (Box).
In 2005, at the request of CSTE, experts from local, state, and federal public health agencies and representatives from the aquatics industry met in Atlanta at a CDC-sponsored workshop on preventing recreational water--associated illnesses at treated recreational water venues. Setting uniform national aquatic standards was determined to be a key prevention and control measure.
Since 2007, the New York State Department of Health and CDC have spearheaded an all-stakeholder effort to develop a Model Aquatic Health Code (MAHC) (available at http://www.cdc.gov/healthywater/swimming/pools/mahc). MAHC has two primary objectives: 1) to be a free, science-based health code that reduces risk for illness and injury at treated recreational water venues, and 2) to serve as a model available for voluntary adoption by state and local public health agencies to facilitate an evolution from disparate pool regulations across the country into a set of national uniform standards. The 12 MAHC modules cover such topics as disinfection and water quality, operator training, hygiene facilities, and ventilation and air quality; it is anticipated that the modules will be made publicly available in 2012.
To help support waterborne disease detection, investigation, and reporting, CDC should collect and report on data through research initiatives that underscore the importance of waterborne disease in the United States. Estimates of the magnitude and cost of waterborne disease and magnitude of recreational water exposure can be used to advocate for prevention and control measures. In addition, bolstering waterborne disease surveillance can promote prevention and control. For example, given that Cryptosporidium is the predominant etiologic agent of recreational water--associated outbreaks and has the ability to cause communitywide outbreaks, CDC should systemically collect stool specimens and utilize molecular epidemiology tools to subtype isolates to help elucidate the epidemiology of cryptosporidiosis (89).
Since 2001, CDC has posted healthy swimming messages and resources on its Healthy Swimming website.§§ This communication tool allows CDC to share outbreak investigation resources and lessons learned with public health partners, educate the public about healthy swimming, and provide recommendations to the aquatics industry. The website highlights Recreational Water Illness and Injury Prevention Week, which is the week before Memorial Day and represents a health communications opportunity to educate the public about healthy swimming behaviors.
Finally, ATSDR and CDC collect data on pool chemical--associated health events. The data suggest that such events are both common and preventable. The data also indicate the need for a coordinated effort to establish the magnitude of these health events, more completely characterize their epidemiology, refine prevention and spill response recommendations, and develop prevention tools. To optimize health communication to operators, residential pool owners, and pool chemical manufacturers, ATSDR/CDC messages should balance the needs to chemically disinfect to prevent and control pathogen transmission and to reduce the incidence pool chemical--associated health events.
In 2009, CDC transitioned to electronic reporting through the National Outbreak Reporting System (NORS)¶¶ for waterborne disease outbreaks occurring on or after January 1, 2009. As waterborne disease outbreak reporting to CDC transitions from a paper-based to an electronic system, the number of reported recreational water--associated outbreaks might increase. Efforts to improve the quality and completeness of WBDOSS data include activities such as NORS webinars for and e-mail updates to epidemiology, environmental health, and laboratory partners at the local, state, and federal levels; web-accessible training materials for public health staff responsible for voluntary reporting; and collaboration across CDC programs to streamline reporting, provide technical support, and develop new NORS reporting tools. One of the key improvements in NORS reporting is the inclusion of more standardized fields to report environmental health investigation data. All of these efforts aim to generate surveillance data that better inform the development and implementation of more effective waterborne disease prevention and control guidelines and standards such as the MAHC and ultimately reduce the burden of recreational water--associated illness and injury.
Acknowledgments
This report is based in part on data provided by state, territorial, local, and FAS waterborne disease coordinators; state, territorial, local, and FAS epidemiologists and environmental health personnel and on contributions by Sarah A. Collier, MPH, Lina I. Brou, MPH, Alexandra L. Shevach, Kelly A. Jackson, MPH, Ezra J. Barzilay, MD, Division of Foodborne, Waterborne, and Environmental Diseases, National Center for Emerging and Zoonotic Infectious Diseases; Rose A. Rudd, MSPH, Division of Unintentional Injury Prevention, National Center for Injury Prevention and Control; Aron J. Hall, DVM, Veronica P. Costantini, PhD, Division of Viral Diseases, National Center for Immunization and Respiratory Diseases; Lorraine C. Backer, PhD, Division of Environmental Hazards and Health Effects, National Center for Environmental Health; Charles Otto, MPA, Division of Emergency and Environmental Health Services, National Center for Environmental Health, CDC.
References
- Craun GF. Waterborne diseases in the United States. Boca Raton, FL: CRC Press; 1986.
- Yoder JS, Roberts V, Craun GF, et al. Surveillance for waterborne disease and outbreaks associated with drinking water and water not intended for drinking---United States, 2005--2006. MMWR 2008;57(No. SS-9):39--62.
- Liang JL, Dziuban EJ, Craun GF, et al. Surveillance for waterborne disease and outbreaks associated with drinking water and water not intended for drinking---United States, 2003--2004. MMWR 2006;55(No. SS-12):31--65.
- Blackburn BG, Craun GF, Yoder JS, et al. Surveillance for waterborne-disease outbreaks associated with drinking water---United States, 2001--2002. MMWR 2004;53(No. SS-8):23--45.
- Lee SH, Levy DA, Craun GF, et al. Surveillance for waterborne-disease outbreaks---United States, 1999--2000. MMWR 2002;51(No. SS-8):1--47.
- Barwick RS, Levy DA, Craun GF, et al. Surveillance for waterborne-disease outbreaks---United States, 1997--1998. MMWR 2000;49(No. SS-4):1--21.
- Levy DA, Bens MS, Craun GF, Calderon RL, Herwaldt BL. Surveillance for waterborne-disease outbreaks---United States, 1995--1996. MMWR 1998;47(No. SS-5):1--34.
- Kramer MH, Herwaldt BL, Craun GF, Calderon RL, Juranek DD. Surveillance for waterborne-disease outbreaks---United States, 1993--1994. MMWR 1996;45(No. SS-1).
- Moore AC, Herwaldt BL, Craun GF, Calderon RL, Highsmith AK, Juranek DD. Surveillance for waterborne disease outbreaks---United States, 1991--1992. MMWR 1993;42(No. SS-5):1--22.
- Herwaldt BL, Craun GF, Stokes SL, Juranek DD. Waterborne-disease outbreaks, 1989--1990. MMWR 1991;40(No. SS-3):1--21.
- Levine WC, Stephenson WT, Craun GF. Waterborne disease outbreaks, 1986--1988. MMWR 1990;39(No. SS-1):1--13.
- St Louis ME. Water-related disease outbreaks, 1985. MMWR 1988;37(No. SS-2):15--24.
- Yoder JS, Hlavsa MC, Craun GF, et al. Surveillance for waterborne disease and outbreaks associated with recreational water use and other aquatic facility-associated health events---United States, 2005--2006. MMWR 2008;57(No. SS-9):1--29.
- Dziuban EJ, Liang JL, Craun GF, et al. Surveillance for waterborne disease and outbreaks associated with recreational water---United States, 2003--2004. MMWR 2006;55(No. SS-12):1--30.
- Yoder JS, Blackburn BG, Craun GF, et al. Surveillance for waterborne-disease outbreaks associated with recreational water---United States, 2001--2002. MMWR 2004;53(No. SS-8):1--22.
- Brunkard JM, Ailes E, Roberts VA, et al. Surveillance for waterborne disease outbreaks associated with drinking water---United States, 2007--2008. MMWR 2011;60(No. SS-10):38--75.
- CDC. Water-related disease outbreaks annual summary, 1981. Atlanta, GA: US Department of Health and Human Services, CDC; 1982.
- Environmental Protection Agency. Bacterial ambient water quality criteria for marine and fresh recreational waters. Cincinnati, OH: National Service Center for Environmental Publications; 1986.
- Environmental Protection Agency. Water quality standards for coastal and Great Lakes recreation waters. Federal Register 2004;69:67217-43.
- Agency for Toxic Substances and Disease Registry. Hazardous Substance Emergency Events Surveillance System, biennial report 2007--2008. Available at http://www.atsdr.cdc.gov/hs/hsees. Accessed August 12, 2011.
- CDC. Pool chemical--associated health events in public and residential settings---United States, 1983--2007. MMWR 2009;58:489--93.
- CDC. Vessel Sanitation Program: outbreak updates for international cruise ships. Available at http://www.cdc.gov/nceh/vsp/surv/GIlist.htm#years. Accessed August 12, 2011.
- CDC. Respiratory and ocular symptoms among employees of a hotel indoor waterpark resort---Ohio, 2007. MMWR 2009;58:81--5.
- Dang B, Chen L, Mueller C, et al. Ocular and respiratory symptoms among lifeguards at a hotel indoor waterpark resort. J Occup Environ Med 2010;52:207--13.
- CDC. Illness associated with red tide---Nassau County, Florida, 2007. MMWR 2008;57:717--20.
- Benin AL, Benson RF, Arnold KE, et al. An outbreak of travel-associated Legionnaires disease and Pontiac fever: the need for enhanced surveillance of travel-associated legionellosis in the United States. J Infect Dis 2002;185:237--43.
- Benkel DH, McClure EM, Woolared D, et al. Outbreak of Legionnaires' disease associated with a display whirlpool spa. Int J Epidemiol 2000;29:1092--8.
- CDC. Summary of human Vibrio cases reported to CDC, 2007. Available at http://www.cdc.gov/nationalsurveillance/PDFs/CSTEVibrio2007.pdf. Accessed August 12, 2011.
- CDC. Summary of human Vibrio isolates reported to CDC, 2008. Available at http://www.cdc.gov/nationalsurveillance/PDFs/Jackson_Vibrio_CSTE2008_FINAL.pdf. Accessed August 12, 2011.
- Hopkins RS, Shillam P, Gaspard B, Eisnach L, Karlin RJ. Waterborne disease in Colorado: three years' surveillance and 18 outbreaks. Am J Public Health 1985;75:254--7.
- CDC. Swimming-associated cryptosporidiosis---Los Angeles County. MMWR 1990;39:343--5.
- Shields JM, Hill VR, Arrowood MJ, Beach MJ. Inactivation of Cryptosporidium parvum under chlorinated recreational water conditions. J Water Health 2008;6:513--20.
- Yoder JS, Beach MJ. Cryptosporidium surveillance and risk factors in the United States. Exp Parasitol 2010;124:31--9.
- CDC. Violations identified from routine swimming pool inspections---selected states and counties, United States, 2008. MMWR 2010;59:582--7.
- Podewils LJ, Zanardi Blevins L, Hagenbuch M, et al. Outbreak of norovirus illness associated with a swimming pool. Epidemiol Infect 2007;135:827--33.
- Shin GA, Sobsey MD. Inactivation of norovirus by chlorine disinfection of water. Water Res 2008;42:4562--8.
- Zheng DP, Widdowson MA, Glass RI, Vinje J. Molecular epidemiology of genogroup II-genotype 4 noroviruses in the United States between 1994 and 2006. J Clin Microbiol 2010;48:168--77.
- Jokipii L, Jokipii AM. Timing of symptoms and oocyst excretion in human cryptosporidiosis. N Engl J Med 1986;315:1643--7.
- CDC. Communitywide cryptosporidiosis outbreak---Utah, 2007. MMWR 2008;57:989--93.
- Turabelidze G, Lin M, Weisner T, Zhu BP. Communitywide outbreak of cryptosporidiosis in rural Missouri associated with attendance at child care centers. Arch Pediatr Adolesc Med 2007;161:878--83.
- Wheeler C, Vugia DJ, Thomas G, et al. Outbreak of cryptosporidiosis at a California waterpark: employee and patron roles and the long road towards prevention. Epidemiol Infect 2007;135:302--10.
- Gerba CP. Assessment of enteric pathogen shedding by bathers during rcreational activity and its impact on water quality. Quant Microbiol 2000;2:55--68.
- Liguori G, Castaldi S, Signorelli C, et al. [Hygienic risks in swimming pool: knowledge and behaviours of consumers of three structures in Crema, Parma and Naples]. Ann Ig 2007;19:325--35.
- McClain J, Bernhardt JM, Beach MJ. Assessing parents' perception of children's risk for recreational water illnesses. Emerg Infect Dis 2005;11:670--6.
- CDC. Cryptosporidiosis outbreaks associated with recreational water use---five states, 2006. MMWR 2007;56:729--32.
- Betancourt WQ, Rose JB. Drinking water treatment processes for removal of Cryptosporidium and Giardia. Vet Parasitol 2004;126:219--34.
- Craik SA, Weldon D, Finch GR, Bolton, JR, Belosevic M. Inactivation of Cryptosporidium parvum oocysts using medium- and low-pressure ultraviolet radiation. Water Res 2001;35:1387--98.
- Rochelle PA, Upton SJ, Montelone BA, Woods K. The response of Cryptosporidium parvum to UV light. Trends Parasitol 2005;21:81--7.
- Corona-Vasquez B, Samuelson A, Rennecker JL, Marinas BJ. Inactivation of Cryptosporidium parvum oocysts with ozone and free chlorine. Water Res 2002;36:4053--63.
- Korich DG, Mead JR, Madore MS, Sinclair NA, Sterling CR. Effects of ozone, chlorine dioxide, chlorine, and monochloramine on Cryptosporidium parvum oocyst viability. Appl Environ Microbiol 1990;56:1423--8.
- Shields JM, Arrowwood MJ, Hill VR, Beach MJ. The effect of cyanuric acid on the disinfection rate of Cryptosporidium parvum in 20-ppm free chlorine. J Water Health 2009;7:109--14.
- CDC. Cryptosporidiosis Outbreak Response & Evaluation (CORE) guidelines. Available at http://www.cdc.gov/parasites/crypto/resources/core_guidelines.pdf. Accessed August 12, 2011.
- Fields BS, Benson RF, Besser RE. Legionella and Legionnaires' disease: 25 years of investigation. Clin Microbiol Rev 2002;15:506--26.
- Price D, Ahearn DG. Incidence and persistence of Pseudomonas aeruginosa in whirlpools. J Clin Microbiol 1988;26:1650--4.
- Gustafson TL, Band JD, Hutcheson RH Jr, Schaffner W. Pseudomonas folliculitis: an outbreak and review. Rev Infect Dis 1983;5:1--8.
- Storey MV, Winiecka-Krusnell J, Ashbolt NJ, Stenstrom TA. The efficacy of heat and chlorine treatment against thermotolerant Acanthamoebae and Legionellae. Scand J Infect Dis 2004;36:656--62.
- CDC. Surveillance data from public spa inspections---United States, May--September 2002. MMWR 2004;53:553--5.
- CDC. Shigellosis outbreak associated with an unchlorinated fill-and-drain wading pool---Iowa, 2001. MMWR 2001;50:797--800.
- Emanuel BP. The relationship between pool water quality and ventilation. J Environ Health 1998;61:17.
- Hery M, Hecht G, Gerber JM, Gendre JC, Hubert G, Rebuffaud J. Exposure to chloramines in the atmosphere of indoor swimming pools. Ann Occup Hyg 1995;39:427--39.
- Weisel CP, Richardson SD, Nemery B, et al. Childhood asthma and environmental exposures at swimming pools: state of the science and research recommendations. Environ Health Perspect 2009;117:500--7.
- Cassan D, Mercier B, Castex F, Rambaud A. Effects of medium-pressure UV lamps radiation on water quality in a chlorinated indoor swimming pool. Chemosphere 2006;62:1507--13.
- Li J, Blatchley ER 3rd. UV photodegradation of inorganic chloramines. Environ Sci Technol 2009;43:60--5.
- Hagg WR, Hoigne J. Ozonation of water containing chlorine or chloramines. Water Res 1983;17:1397--402.
- Keuten M, Verberk JQJC, Pleumeekers O, van Spengen J, van Dijk JC. Determination and reduction of bathing loads in public swimming pools [Presentation]. Swimming Pool & Spa International Conference, London, UK; March 17--20, 2009.
- Johnston K, Kinziger M. Certified operators: does certification provide significant results in real-world pool and spa chemistry? Int J Aquatic Res Educ 2007;1:18--22.
- Buss BF, Safranek TJ, Magri JM, Torok TJ, Beach MJ, Foley BP. Association between swimming pool operator certification and reduced pool chemistry violations---Nebraska, 2005--2006. J Environ Health 2009;71:36--40.
- Wade TJ, Calderon RL, Sams E, et al. Rapidly measured indicators of recreational water quality are predictive of swimming-associated gastrointestinal illness. Environ Health Perspect 2006;114:24--8.
- Pruss A. Review of epidemiological studies on health effects from exposure to recreational water. Int J Epidemiol 1998;27:1--9.
- Wade TJ, Pai N, Eisenberg JN, Colford JM, Jr. Do U.S. Environmental Protection Agency water quality guidelines for recreational waters prevent gastrointestinal illness? A systematic review and meta-analysis. Environ Health Perspect 2003;111:1102--9.
- Wade TJ, Calderon RL, Brenner KP, et al. High sensitivity of children to swimming-associated gastrointestinal illness: results using a rapid assay of recreational water quality. Epidemiology 2008;19:375--83.
- Schiff KC, Morton J, Weisberg SB. Retrospective evaluation of shoreline water quality along Santa Monica Bay beaches. Marine Environmental Research;56:245--53.
- Verbrugge LM, Rainey JJ, Reimink RL, Blankespoor HD. Swimmer's itch: incidence and risk factors. Am J Public Health 2004;94:738--41.
- Environmental Protection Agency. U.S. EPA's beach report: 2009 swimming season. May 2010. EPA 820-F-10-003. Available at http://water.epa.gov/type/oceb/beaches/upload/report2009.pdf. Accessed August 12, 2011.
- Nobles RE, Brown P, Rose J, Lipp E. The investigation and analysis of swimming-associated illness using the fecal indicator enterococcus in southern Florida's marine water. J Environ Health 2000;169:13--9.
- Colford JM Jr, Wade TJ, Schiff KC, et al. Water quality indicators and the risk of illness at beaches with nonpoint sources of fecal contamination. Epidemiology 2007;18:27--35.
- Wade TJ, Sams E, Brenner KP, et al. Rapidly measured indicators of recreational water quality and swimming-associated illness at marine beaches: a prospective cohort study. Environ Health 2010;9:66.
- Hoagland P, Anderson DM, Kaoru Y, White AW. The economic effects of harmful algal blooms in the United States: estimates, assessment issues, and information needs. Estuaries 2002;25:819--37.
- Rabinovici SJ, Bernknopf RL, Wein AM, Coursey DL, Whitman RL. Economic and health risk trade-offs of swim closures at a Lake Michigan beach. Environ Sci Technol 2004;38:2737--45.
- Dechet AM, Yu PA, Koram N, Painter J. Nonfoodborne Vibrio infections: an important cause of morbidity and mortality in the United States, 1997--2006. Clin Infect Dis 2008;46:970--6.
- Oliver JD. Wound infections caused by Vibrio vulnificus and other marine bacteria. Epidemiol Infect 2005;133:383--91.
- Yoder JS, Eddy BA, Visvesvara GS, Capewell L, Beach MJ. The epidemiology of primary amoebic meningoencephalitis in the USA, 1962--2008. Epidemiol Infect 2010;138:968--75.
- Ettinger MR, Webb SR, Harris SA, McIninch SP, Garmon GC, Brown BL. Distribution of free-living amoebae in James River, Virginia, USA. Parasitol Res 2003;89:6--15.
- John DT, Howard MJ. Seasonal distribution of pathogenic free-living amebae in Oklahoma waters. Parasitology Research 1995;81:193--201.
- Wellings FM, Amuso PT, Chang SL, Lewis AL. Isolation and identification of pathogenic Naegleria from Florida lakes. Appl Environ Microbiol 1977;34:661--7.
- CDC. Primary amebic meningoencephalitis---Arizona, Florida, and Texas, 2007. MMWR 2008;57:573--7.
- Middaugh JP, Hammond RM, Eisenstein L, Lazensky R. Using the Electronic Foodborne Outbreak Reporting System (eFORS) to improve foodborne outbreak surveillance, investigations, and program evaluation. J Environ Health 2010;73:8--11.
- Valderrama AL, Hlavsa MC, Cronquist A, et al. Multiple risk factors associated with a large statewide increase in cryptosporidiosis. Epidemiol Infect 2009;137:1781--8.
- Chalmers RM, Elwin K, Thomas AL, Guy EC, Mason B. Long-term Cryptosporidium typing reveals the aetiology and species-specific epidemiology of human cryptosporidiosis in England and Wales, 2000 to 2003. Euro Surveill 2009;14:9--14.
* Available at http://www.cdc.gov/healthywater/statistics/wbdoss/index.html.
† Comprising the Republic of the Marshall Islands, the Federated States of Micronesia, and the Republic of Palau; formerly part of the U.S.-administered Trust Territory of the Pacific Islands.
§ Available at http://www.cdc.gov/healthywater/statistics/wbdoss/nors/forms_archive.html.
¶ Participating states: Colorado, Florida, Iowa, Louisiana, Michigan, Minnesota, North Carolina, New Jersey, New York, Oregon, Texas, Utah, Washington, and Wisconsin.
** Available at http://www.cdc.gov/nationalsurveillance/PDFs/CDC5279_COVISvibriosis.pdf.
†† Florida, Iowa, Louisiana, Michigan, Minnesota, North Carolina, New Jersey, New York, Oregon, Texas, Utah, and Wisconsin.
§§ Available at http://www.cdc.gov/healthywater/swimming.
¶¶ Available at http://www.cdc.gov/healthywater/statistics/wbdoss/nors/index.html.
|
TABLE 2. (Continued) Waterborne disease outbreaks associated with treated recreational water (n = 74), by state/jurisdiction --- Waterborne Disease and Outbreak Surveillance System, United States, 2007 |
|||||||
|---|---|---|---|---|---|---|---|
|
State/Jurisdiction |
Month |
Class* |
Etiology |
Predominant illness† |
No. of cases§ (n = 10,749) |
Venue |
Setting |
|
Pennsylvania |
Jul |
III |
Cryptosporidium |
AGI |
51 |
Pool |
Camp/Cabin |
|
Pennsylvania |
Jul |
IV |
C. parvum |
AGI |
39 |
Pool |
Membership club |
|
Puerto Rico |
Aug |
II |
C. hominis |
AGI |
107 |
Interactive fountain |
Waterpark |
|
Tennessee |
May |
IV |
L. pneumophila serogroup 1 |
ARI |
2 |
Spa |
Hotel/Motel |
|
Tennessee |
Jul |
IV |
Shigella |
AGI |
17 |
Pool, temporary waterslide |
Camp/Cabin |
|
Tennessee |
Jul |
IV |
Cryptosporidium |
AGI |
18 |
Pool |
Community/Municipality |
|
Tennessee |
Jul |
IV |
Cryptosporidium |
AGI |
16 |
Splash pad |
Waterpark |
|
Tennessee |
Aug |
IV |
C. hominis |
AGI |
24 |
Pool |
Private residence |
|
Utah |
May |
I |
Cryptosporidium |
AGI |
5,697 |
Pools |
Community/Municipality |
|
Virginia |
Jul |
IV |
G. intestinalis |
AGI |
6 |
Pool |
Community/Municipality |
|
Washington |
Aug |
IV |
Cryptosporidium |
AGI |
14 |
Pool |
Membership club |
|
West Virginia |
Apr |
II |
Unidentified** |
Skin |
15 |
Wading pool |
Community/Municipality |
|
West Virginia |
Nov |
IV |
Unidentified |
Skin |
7 |
Spa |
Camp/Cabin |
|
Wisconsin |
Aug |
IV |
Cryptosporidium |
AGI |
35 |
Pool |
Community/Municipality |
|
Wisconsin |
Aug |
IV |
Cryptosporidium |
AGI |
38 |
Pool |
Aquatic facility |
|
Wyoming |
Jul |
IV |
Cryptosporidium |
AGI |
27 |
Pool |
Community/Municipality |
|
Abbreviations: AGI = acute gastrointestinal illness; ARI = acute respiratory illness; Ear = illnesses, conditions, or symptoms related to the ears; Eye = illnesses, conditions, or symptoms related to the eyes; Skin = illnesses, conditions, or symptoms related to the skin. * On the basis of epidemiologic and clinical laboratory data, and environmental data (see Table 1) provided to CDC. † The category of illness reported by ≥50% of ill respondents. § No deaths were reported in cases associated with outbreaks reported during 2007. ¶ Etiology unidentified: Cryptosporidium suspected on the basis of clinical diagnoses of secondary cases. ** Etiology unidentified: P. aeruginosa suspected on the basis of clinical syndrome and setting. †† Etiology unidentified: contamination from excess chlorine levels, pool disinfection by-products (e.g., chloramines), or altered pool chemistry suspected. §§ The implicated pool was located at a membership club but functioned as a community pool. |
|||||||
FIGURE 1. Number of waterborne disease outbreaks associated with recreational water (n = 134), by state/jurisdiction --- Waterborne Disease and Outbreak Surveillance System, United States, 2007--2008*
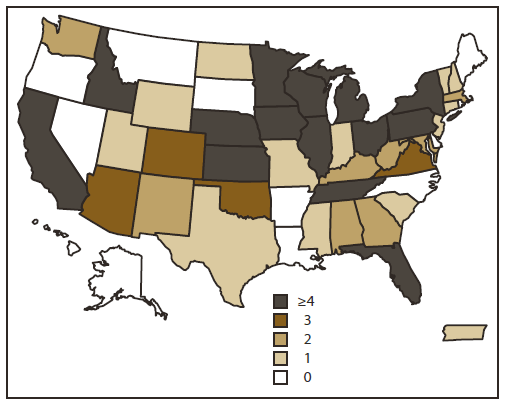
* Note: These numbers are largely dependent on surveillance and reporting activities in individual states/jurisdictions and do not necessarily indicate the true incidence of waterborne disease outbreaks.
Alternative Text: The figure shows a map of the United States indicating where 134 reported waterborne disease outbreaks associated with recreational water occurred during 2007-2008. These numbers are largely dependent on surveillance and reporting activities in individual states/jurisdictions and do not necessarily indicate the true incidence of waterborne disease outbreaks.
FIGURE 2. Recreational water--associated outbreaks, by type of exposure, predominant illness,* etiology, and route of entry --- Waterborne Disease and Outbreak Surveillance System, United States, 2007--2008
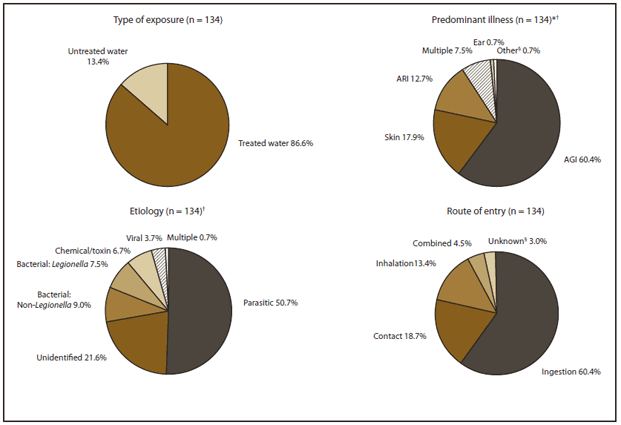
Abbreviations: AGI = acute gastrointestinal illness; ARI = acute respiratory illness; Ear = illnesses, conditions, or symptoms related to the ears; Skin = illnesses, conditions, or symptoms related to the skin; Multiple = a combination of predominant illnesses; Other = undefined illnesses, conditions, or symptoms.
* The category of illness reported by ≥50% of ill respondents.
† Percentages do not add up to 100.0% due to rounding.
§ Etiology was not identified for one outbreak. Reported symptoms were consistent with leptospirosis but clinical specimens tested negative for Leptospira infection. Route of transmission was unclear.
Alternative Text: The figure shows recreational water-associated outbreaks that were reported in the United States during 2007-2008; 86.6% of these outbreaks were associated with treated water and 13.4% with untreated water. Predominant illnesses included acute gastrointestinal illness (60.4%); illnesses, conditions, or symptoms related to the skin (17.9%), acute respiratory illness (12.7%); illnesses, conditions, or symptoms related to the ears (0.7%), multiple illnesses (7.5%); and other (0.7%). Route of entry was ingestion (60.4%), contact (18.7%), inhalation (13.4%), combined (4.5%), and unknown (3.0%) Etiology was parasitic (50.7%), bacterial (7.5% Legionella and 9.0% non-Legionella), chemnical/toxin (6.7%), viral (3.7%), and multiple (0.7%).
FIGURE 3. Number of waterborne disease outbreaks associated with recreational water (n = 134), by predominant illness* and month --- Waterborne Disease and Outbreak Surveillance System, United States, 2007--2008
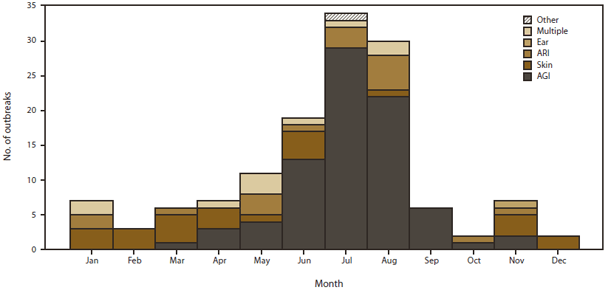
Abbreviations: AGI = acute gastrointestinal illness; ARI = acute respiratory illness; Ear = illnesses, conditions, or symptoms related to the ears; Skin = illnesses, conditions, or symptoms related to the skin; Multiple = a combination of predominant illnesses; Other = undefined illnesses, conditions, or symptoms.
* The category of illness reported by ≥50% of ill respondents.
Alternative Text: The figure shows the number of waterborne disease outbreaks associated with recreational water that were reported in the United States during 2007-2008, by predominant illness and month. The predominant illness is the category of illness reported by ≥50 of ill respondents. The majority of outbreaks occurred during June, July, and August. Predominant illnesses included acute gastrointestinal illness; illnesses, conditions, or symptoms related to the skin , acute respiratory illness; illnesses, conditions, or symptoms related to the ears, multiple illnesses; and other.
FIGURE 4. Recreational water--associated outbreaks of acute gastrointestinal illness, by type of exposure and etiology --- Waterborne Disease and Outbreak Surveillance System, United States, 2007--2008
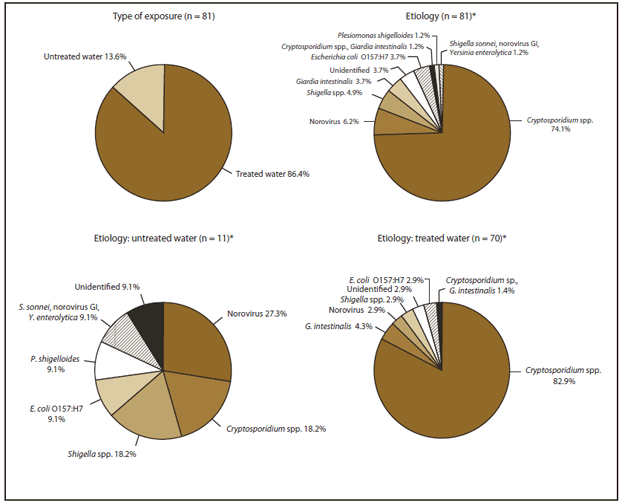
* Percentages do not add up to 100.0% due to rounding.
Alternative Text: The figure shows recreational water-associated outbreaks of acute gastrointestinal illness (AGI) that were reported in the United States during 2007-2008, by type of exposure and etiology; 70 (86.4%) of the 81 exposures of AGI were associated with treated water and 11 (13.6%) with untreated water. Cryptosporidium spp. accounted for 74.1% of these exposures.
FIGURE 5. Distribution of primary contributing factors reported for pool chemical--associated health events --- Hazardous Substance Emergency Events Surveillance System, 12 states,* 2007--2008
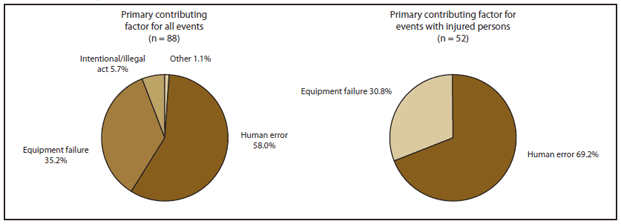
* Florida, Iowa, Louisiana, Michigan, Minnesota, North Carolina, New Jersey, New York, Oregon, Texas, Utah, and Wisconsin.
Alternative Text: The figure shows the distribution of primary contributing factors reported to the Hazardous Substance Emergency Events Surveillance System for pool chemical-associated health events for 14 states (Colorado, Florida, Iowa, Louisiana, Michigan, Minnesota, North Carolina, New Jersey, New York, Oregon, Texas, Utah, Washington, and Wisconsin) during 2007-2008. The primary contributing factor for all 88 events was equipment failure (35.2%), human error (58.0%), intentional/illegal act (5.7%), and other (1.1%). The primary contributing factor for 52 events in which persons were injured was human error (69.2%) and equipment failure (30.8%).
FIGURE 6. Number of estimated emergency department (ED) visits for injuries attributed to pool chemicals (n = 40,803), by year --- National Electronic Injury Surveillance System (NEISS), United States, 1999--2008
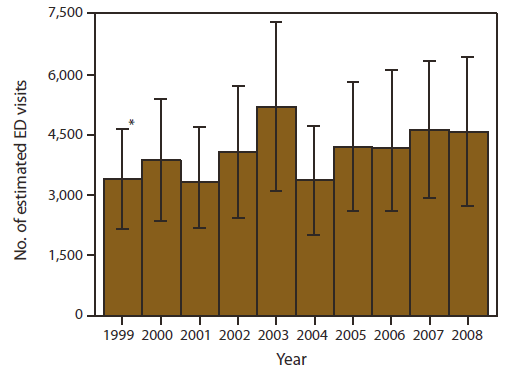
Source: NEISS. Estimates Query Builder. Bethesda, Maryland: U.S. Consumer Product Safety Commission. 1999--2008. Code 938, swimming pool chemicals. Available at http://cpsc.gov/cgibin/NEISSQuery/home.aspx.
* 95% confidence interval.
Alternative Text: The figure shows the number of emergency department visits for injuries attributed to pool chemicals reported to the National Electronic Injury Surveillance System during 1999-2008.
|
TABLE 13. Estimated number, percentage, and rate of pool chemical--associated injuries treated in hospital emergency departments --- National Electronic Injury Surveillance System (NEISS), United States, 2008*† |
||||||
|---|---|---|---|---|---|---|
|
Characteristic |
No. |
Weighted estimate§¶ |
95% CI |
%** |
Annual rate†† |
95% CI |
|
Injury diagnosis |
||||||
|
Poisoning§§ |
38 |
1,784 |
585--2,984 |
39.0 |
---¶¶ |
--- |
|
Dermatitis/conjunctivitis |
38 |
1,452 |
936--1,969 |
31.7 |
0.5 |
0.3--0.6 |
|
Other (e.g., chemical burns) |
35 |
1,338 |
725--1,951 |
29.3 |
0.4 |
0.2--0.6 |
|
Affected body part |
||||||
|
All parts of the body (>50% of body) *** |
48 |
2,181 |
862--3,500 |
47.7 |
--- |
--- |
|
Eyeball |
39 |
1,452 |
838--2,066 |
31.7 |
0.5 |
0.3--0.7 |
|
Other (e.g., hand) or not recorded (n = three) |
24 |
942 |
447--1,436 |
20.6 |
--- |
--- |
|
Patient disposition |
||||||
|
Treated and released, or examined and released without treatment |
101 |
4,214 |
2,903--5,526 |
92.1 |
1.4 |
1.0--1.8 |
|
Other††† |
10 |
360 |
0--731 |
7.9 |
--- |
--- |
|
Incident location |
||||||
|
Residence |
60 |
2,870 |
1,363--4,377 |
62.7 |
--- |
--- |
|
Public location (e.g., school or place of recreation or sports) |
16 |
352 |
71--632 |
7.7 |
--- |
--- |
|
Unknown |
35 |
1,352 |
580--2,124 |
29.6 |
--- |
--- |
|
Patient age (yrs) |
||||||
|
0--17 |
55 |
2,051 |
1,168--2,934 |
44.8 |
2.8 |
1.6--3.9 |
|
18--45 |
35 |
1,698 |
1,012--2,384 |
37.1 |
1.4 |
0.9--2.0 |
|
≥46 |
21 |
825 |
90--1,561 |
18.0 |
--- |
--- |
|
Patient sex |
||||||
|
Male |
60 |
2,403 |
1,313--3,493 |
52.5 |
1.6 |
0.9--2.3 |
|
Female |
51 |
2,171 |
1,374--2,969 |
47.5 |
1.4 |
0.9--1.9 |
|
Patient race/ethnicity |
||||||
|
White |
60 |
3,039 |
1,713--4,364 |
66.4 |
--- |
--- |
|
Other |
14 |
365 |
76--655 |
8.0 |
--- |
--- |
|
Unknown |
37 |
1,170 |
404--1,937 |
25.6 |
--- |
--- |
|
Total |
111 |
4,574 |
2,703--6,446 |
100.0 |
1.5 |
0.9--2.1 |
|
Abbreviation: CI = confidence interval. * Source: NEISS. Estimates Query Builder. Bethesda, Maryland: U.S. Consumer Product Safety Commission. 1999--2008. Code 938, swimming pool chemicals. Available at http://www.cpsc.gov/cgibin/NEISSQuery/home.aspx. † For 2007 NEISS summary data, refer to CDC. Pool chemical--associated health events in public and residential settings---United States, 1983--2007. MMWR, 2009; 58:489--93. Available at http://www.cdc.gov/mmwr/preview/mmwrhtml/mm5818a1.htm. § Each injured person was weighted based on the inverse probability of the hospital being selected, and the weights were summed to produce national estimates. ¶ Categorical weighted counts might not add up to 4,574 due to rounding. ** Categorical percentages might not add up to 100.0% due to rounding. †† Rates per 100,000 population were calculated using U.S. Census Bureau population estimates accessed September 10, 2010; 95% confidence intervals were calculated by using SAS survey procedures that accounted for the sample weights and complex sampling design. §§ Poisoning includes ingestion and inhalation of vapors, fumes, or gases. ¶¶ If the sample count was <20, weighted count was <1,200, or the coefficient of variation >30%, the estimate was considered unstable and rates were not reported. Rates by location and race are not reported because of the high percentage of unreported location and race. *** For a poisoning injury diagnosis, NEISS requires that affected body part be coded as "all parts of the body (more than 50% of body)." ††† Treated and transferred to another hospital (n = three), treated and admitted for hospitalization (within same facility) (n = four), or left without being seen/left against medical advice (n = three). |
||||||
FIGURE 7. Number of vibriosis cases associated with recreational water exposure (n = 236), by species and month --- Cholera and Other Vibrio Illness Surveillance System, United States, 2007--2008
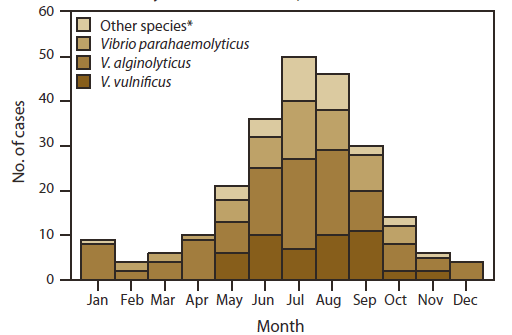
* Includes V. cholerae (non-O1, non-O139) (n = 11), V. damsela (n = two), V. fluvialis (n = three), unidentified Vibrio co-infection (n = two), and Vibrio species not identified (n = 13).
Alternative Text: The figure shows the number of vibriosis cases associated with recreational water exposure that were reported in the United States during 2007-2008, by species and month. A total of 236 cases were reported. The greatest numbers of cases occurred in May, June, July, August, and September.
FIGURE 8. Number of vibriosis cases associated with recreational water exposure (n = 236) --- Cholera and Other Vibrio Illness Surveillance System, United States, 2007--2008*
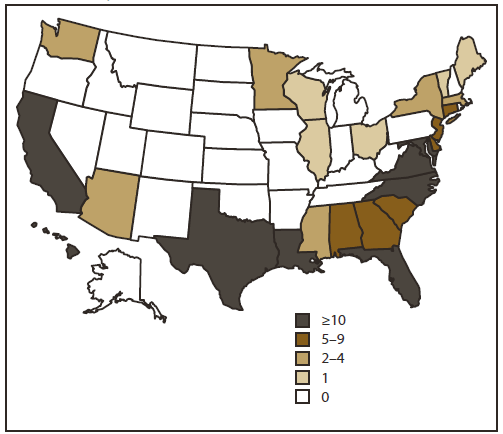
* These numbers are largely dependent on surveillance and reporting activities in individual states and do not necessarily indicate the true incidence of vibriosis cases.
Alternative Text: The figure shows a map of the United States indicating where the 236 reported cases of vibriosis associated with recreational water exposure occurred during 2007-2008. The numbers shown by state are largely dependent on surveillance and reporting activities in individual states and do not necessarily indicate the true incidence of vibriosis cases.
FIGURE 9. Number of waterborne disease outbreaks associated with recreational water (n = 696),* by predominant illness† and year --- Waterborne Disease and Outbreak Surveillance System, United States, 1978--2008
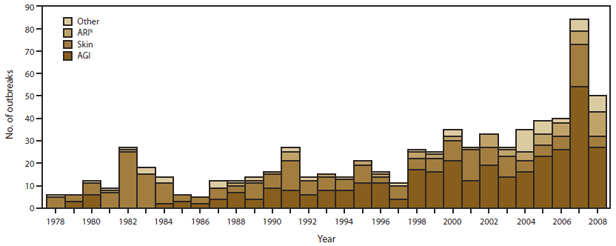
Abbreviations: AGI = acute gastrointestinal illness; ARI = acute respiratory illness; Skin = illnesses, conditions, or symptoms related to the skin; Other = includes bronchitis; illnesses, conditions, or symptoms related to the ears; illnesses, conditions, or symptoms related to the eyes; hepatitis; leptospirosis; meningitis; meningoencephalitis; and multiple predominant illnesses.
* Single cases of primary amebic meningoencephalitis are not included in this figure, which therefore is not comparable with figures included in summaries prior to the 2005--2006 report.
† The category of illness reported by ≥50% of ill respondents.
§ All outbreaks of legionellosis (i.e., Legionnaires' disease and Pontiac fever) are classified as ARI.
Alternative Text: The figure shows the number of waterborne disease outbreaks associated with recreational water that were reported in the United States during 1978-2008, by predominant illness (the category of illness reported by ≥50 of ill respondents) and year. Predominant illnesses included acute gastrointestinal illness; acute respiratory illness; illnesses, conditions, or symptoms related to the skin; and other, which includes bronchitis; illnesses, conditions, or symptoms related to the ears; illnesses, conditions, or symptoms related to the eyes; hepatitis; leptospirosis; meningitis; meningoencephalitis; and multiple predominant illnesses.
FIGURE 10. Number of outbreaks of acute gastrointestinal illness associated with recreational water (n = 341), by type of exposure and year --- Waterborne Disease and Outbreak Surveillance System, United States, 1978--2008
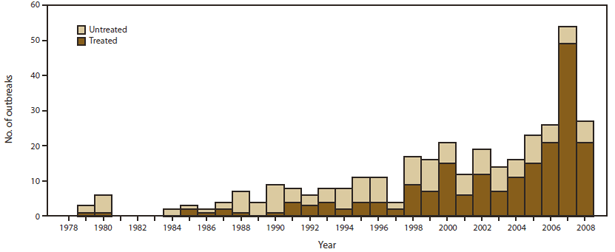
Alternative Text: The figure shows the number of outbreaks of acute gastrointestinal illness associated with recreational water that were reported in the United States during 1978-2008. Of the 341 outbreaks reported, the highest numbers were reported during 2007-2008.
FIGURE 11. Recreational water--associated outbreaks of acute gastrointestinal illness, by type of exposure and etiology --- Waterborne Disease and Outbreak Surveillance System, United States, 1999--2008
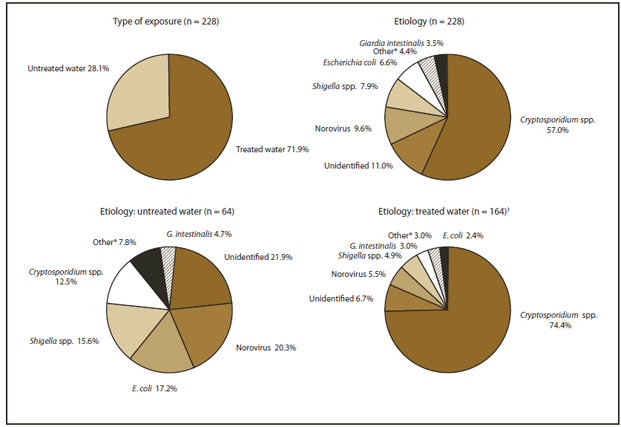
* These include outbreaks caused by Salmonella, Campylobacter, Plesiomonas and outbreaks caused by multiple etiologies.
† Percentages do not add up to 100.0% due to rounding.
Alternative Text: The figure shows recreational water-associated outbreaks of acute gastrointestinal illness that were reported in the United States during 1999-2008, by type of exposure and etiology. Of 228 exposures, treated water accounted for 71.9% and untreated water for 28.1%. Cryptosporidium spp. were associated with 57.0% of the 228 exposures and with 74.4% of the 164 exposures involving treated water.
|
BOX. Federal organizations that provide assistance with investigations of recreational water--associated outbreaks and other health events |
|---|
|
State health departments and other reporting jurisdictions can request epidemiologic assistance and laboratory testing from CDC. CDC also can be consulted regarding engineering and environmental health aspects of recreational water treatment and collection of proper water samples to identify pathogenic viruses, bacteria, and parasites. Requests for assistance with waterborne disease outbreak investigations (e.g., epidemiologic assistance, water testing, diagnosis of free-living ameba infection, or molecular characterization of Cryptosporidium and Giardia) Waterborne Disease Prevention Branch Division of Foodborne, Waterborne, and Environmental Diseases National Center for Emerging and Zoonotic Infectious Diseases, CDC Telephone: 404-639-1700 Email: healthywater@cdc.gov Internet: http://www.cdc.gov/healthywater Requests for diagnostic testing for viral pathogens Division of Viral Diseases National Center for Immunization and Respiratory Diseases, CDC Telephone: 800-232-4636 Requests for diagnostic testing for enteric bacterial pathogens Enteric Diseases Laboratory Branch Division of Foodborne, Waterborne, and Environmental Diseases National Center for Emerging and Zoonotic Infectious Diseases, CDC Telephone: 404-639-3334 Requests for information or diagnostic testing for parasites (except for Cryptosporidium, Giardia, or free-living amebas) Division of Parasitic Diseases and Malaria Center for Global Health, CDC Telephone: 404-718-4745 Internet: http://www.cdc.gov/parasites Requests for information or testing for Legionella Division of Bacterial Diseases National Center for Immunization and Respiratory Diseases, CDC Telephone: 404-639-2215 Internet: http://www.cdc.gov/legionella Resources for pool chemical--associated health events ATSDR National Toxic Substances Incidents Program (NTSIP) Internet: http://www.atsdr.cdc.gov/ntsip 24 hours/7 days chemical spill hotlines --- To report chemical spills, telephone the National Response Center (NRC) at 800-424-8802 or report via the Internet: www.nrc.uscg.mil --- For medical advice, telephone the National Poison Center at 800-222-1222 --- For public health assistance during a chemical emergency, telephone the CDC Emergency Operations Center at 770-488-7100. Resources for harmful algal blooms Health Studies Branch Division of Environmental Hazards and Health Effects National Center for Environmental Health, CDC Telephone: 866-556-0544 |
Use of trade names and commercial sources is for identification only and does not imply endorsement by the U.S. Department of
Health and Human Services.
References to non-CDC sites on the Internet are
provided as a service to MMWR readers and do not constitute or imply
endorsement of these organizations or their programs by CDC or the U.S.
Department of Health and Human Services. CDC is not responsible for the content
of pages found at these sites. URL addresses listed in MMWR were current as of
the date of publication.
All MMWR HTML versions of articles are electronic conversions from typeset documents.
This conversion might result in character translation or format errors in the HTML version.
Users are referred to the electronic PDF version (http://www.cdc.gov/mmwr)
and/or the original MMWR paper copy for printable versions of official text, figures, and tables.
An original paper copy of this issue can be obtained from the Superintendent of Documents, U.S.
Government Printing Office (GPO), Washington, DC 20402-9371;
telephone: (202) 512-1800. Contact GPO for current prices.
**Questions or messages regarding errors in formatting should be addressed to
mmwrq@cdc.gov.
