Persons using assistive technology might not be able to fully access information in this file. For assistance, please send e-mail to: mmwrq@cdc.gov. Type 508 Accommodation and the title of the report in the subject line of e-mail.
Legionellosis --- United States, 2000--2009
Legionnaires disease (LD), a serious, sometimes lethal pneumonia, and Pontiac fever (PF), an influenza-like, self-limited illness, are the two most common forms of legionellosis, which is caused by Legionella bacteria. Legionellosis cases are reported to CDC through the National Notifiable Disease Surveillance System (NNDSS) and a Supplemental Legionnaires Disease Surveillance System (SLDSS) designed to manage surveillance data on travel-related cases and enhance outbreak detection. For this report, cases reported to NNDSS during 2000--2009 from the 50 states and the District of Columbia (DC) were assessed, and crude and age-adjusted incidence rates per 100,000 persons were calculated. U.S. legionellosis cases reported annually increased 217%, from 1,110 in 2000 to 3,522 in 2009, and the crude national incidence rate increased 192%, from 0.39 per 100,000 persons in 2000 to 1.15 in 2009. Because NNDSS is a passive surveillance system dependent on health-care providers and laboratories reporting cases, the actual incidence of legionellosis in the United States likely is higher. Although NNDSS does not record legionellosis cases by type, 99.5% of the legionellosis cases reported to SLDSS during 2005--2009 were classified as LD and 0.5% as PF. Legionellosis surveillance was added to the population-based Active Bacterial Core surveillance (ABCs) system in January 2011 to assess reasons for these increases in numbers of reported cases. The rise in reported cases reinforces the need for health-care providers in all parts of the United States to test and treat adults with severe community-acquired pneumonia for LD, to be vigilant for health-care--associated LD, and to report legionellosis cases to public health authorities.
NNDSS receives reports of cases of nationally notifiable diseases from state health departments, including data on case demographics, the earliest date associated with the patient's illness in public health records (i.e., the date of symptom onset, date of diagnosis, date of confirmatory laboratory test, or the date of the report of the case to the county or state, whichever is earliest), the date of report to CDC, the case status (i.e., confirmed, probable, or suspected), and whether or not the case is part of an outbreak. NNDSS data for 2000--2009 were used to describe legionellosis case demographics, assess seasonal patterns of legionellosis infection, and, using denominators from the 2000 U.S. standard population (1) and U.S. Census Bureau estimates, calculate crude and age-standardized incidence rates for the entire United States (excluding U.S. territories) and for each of the nine U.S. Census divisions.* Only cases considered confirmed under the 2005 Council of State and Territorial Epidemiologists' (CSTE) legionellosis case definitions are described in this report.† To be classified as confirmed, cases must be clinically compatible with legionellosis (i.e., fever, myalgia, cough, and/or clinical or radiographic evidence of pneumonia) and meet at least one of the confirmatory laboratory criteria (i.e., recovery of Legionella sp. in culture, detection of Legionella pneumophila serogroup 1 antigen in urine, or fourfold or greater rise in L. pneumophila serogroup 1-specific serum antibodies).
States also are encouraged to report cases to SLDSS to enhance detection of travel-related outbreaks and to provide information on additional legionellosis case variables not captured by NNDSS.§ Legionellosis cases ideally should be reported to both NNDSS and SLDSS. SLDSS collects information related to case demographics, diagnosis, diagnostic testing, hospitalization, outcome, outbreak involvement, nosocomial classification, and recent travel history. In addition to the reports of cases among U.S. residents received from state health departments, SLDSS reports occasionally come from cruise lines, health-care providers, and private citizens. Those additional reports are verified with the relevant state health departments before inclusion in the SLDSS database. Foreign public health authorities also report cases to SLDSS, usually among travelers to the United States. In 2005, CSTE issued a position statement (2) requesting that all legionellosis cases be reported to SLDSS, but such reporting is not mandatory, and case follow-up varies by state and county based on staffing availability and perceived public health importance. For this report, SLDSS data were used to characterize diagnoses, diagnostic testing, outcomes, outbreak involvement, and recent travel.¶ Because of potential differences in data received by SLDSS before and after the 2005 CSTE position statement, separate analyses were conducted using cases with onset during 2000--2009 (NNDSS data) and 2005--2009 (SLDSS data).
During 2000--2009, the 50 states and DC reported 22,418 cases of legionellosis to NNDSS. The crude national incidence rate increased 192%, from 0.39 per 100,000 persons in 2000 to 1.15 in 2009, and the age-adjusted incidence of legionellosis in the United States increased 170%, from 0.40 to 1.08 cases per 100,000 persons. In 2000, the age-adjusted incidence varied substantially by U.S. Census division, from 0.09 cases per 100,000 persons in the West South Central division to 0.73 cases in the Middle Atlantic division. This disparity increased absolutely over the decade (Middle Atlantic division: 2.60 cases per 100,000 persons and West South Central division: 0.44 cases in 2009) (Table 1). All reporting divisions had an increase in age-adjusted legionellosis incidence from 2000--2001 to 2008--2009, ranging from a 101% increase in the West North Central division to 294% in the West South Central division. Nationally, 16,595 cases (74%) were in persons aged ≥50 years, and 14,255 (64%) persons were male (Table 2). Legionellosis incidence increased for all age groups from 2000 to 2009, ranging from 8% for persons aged ≤9 years to 287% for persons aged ≥80 years.
Among the 18,392 cases (82%) reported to NNDSS with available information on race, 78% were white, 19% were black, and 3% were American Indian/Alaska Native, Asian, or other (Table 2).** Cases tended to occur in the summer and early fall, with the June--October period accounting for 62% of the cases reported each year (Figure).
During 2005--2009, a total of 5,080 confirmed legionellosis cases among U.S. residents were reported to SLDSS by 47 states,†† accounting for 35% of the 14,554 confirmed cases reported to NNDSS during the same period by all 50 states and DC. An additional 82 confirmed legionellosis cases were reported among foreign visitors to the United States. A total of 1,220 (24%) cases involving U.S. residents were travel-associated; 81% of these involved domestic travel only, and 5% involved cruise ship travel. Travel-associated cases accounted for at least two thirds of the cases reported to SLDSS from 21 states, 11 of which reported only travel-associated cases, suggesting a bias against reporting nontravel-associated cases to SLDSS from some states. Of 3,872 (76%) U.S. resident cases with data available, 4% were associated with a known legionellosis outbreak or possible cluster. Information on clinical outcomes was available for 4,478 (88%) U.S. resident cases, 8% of which resulted in deaths. Urine antigen tests were used to confirm 97% of U.S. resident cases reported during 2005--2009. Only 5% of cases were confirmed by culture during this period, and <1% were confirmed by either serologic or direct fluorescent antigen testing.
Reported by
Lauri A. Hicks, DO, Laurel E. Garrison, MPH, Respiratory Diseases Br, Div of Bacterial Diseases, National Center for Immunization and Respiratory Diseases; George E. Nelson, MD, Lee M. Hampton, MD, EIS officers, CDC. Corresponding contributor: Lee M. Hampton, lhampton@cdc.gov, 404-639-4722.
Editorial Note
Reported legionellosis incidence rates increased nearly threefold during 2000--2009. In 2009, NNDSS received 3,522 case reports, the most since legionellosis became a reportable disease in 1976 (3,4). Increased rates were observed across all age groups and geographic regions. The reported case totals likely underestimate the actual disease burden; the most recent completed U.S. population--based pneumonia etiology study estimated that 8,000--18,000 persons are hospitalized each year with LD (5).
An increasing population of older persons contributed to the increase in reported legionellosis cases. Other factors that might have contributed include an increasing population of persons at high risk for infection; improved diagnosis and reporting, possibly stimulated by the 2005 CSTE endorsement of more timely and sensitive legionellosis surveillance; and increased use of urine Legionella antigen testing. However, because increases in urine antigen testing began in the 1980s, its use is unlikely to account for the entire increase in legionellosis cases since 2000 (3,4).
Urine antigen tests are easy to perform and provide timely, accurate results (sensitivity: 60%--80%; specificity: >99%) for detecting L. pneumophila serogroup 1, the causative agent in 70%--80% of LD cases (6). In contrast, culture of respiratory samples from possible LD cases (sensitivity: 20%--80%; specificity: >99%) can detect all forms of Legionella but has a lengthy turnaround time, and its sensitivity is highly dependent on the skill of laboratory personnel. Similarly, identifying legionellosis through paired serology (sensitivity: 70%--80%; specificity: >95%) involves substantial logistical challenges, whereas direct fluorescent antigen testing for LD (sensitivity: 25%--75%; specificity: >95%) can be technically demanding and can result in false positives resulting from cross-reactions with other bacteria. Only urine antigen and serology are useful for detecting PF, but the sensitivity of these tests for confirmation of PF is substantially lower than for LD (7).
Similar to the findings of previous studies, males accounted for >60% of cases, and increasing age was a major risk factor for legionellosis (3,4). However, the finding that blacks accounted for a disproportionately high number of cases relative to their 12% share of the population was unexpected. Insufficient information is available to confirm whether these patterns might be the result of differences in underlying risk factors or exposures to Legionella, and the high proportion of cases in persons of unknown race limits the interpretation of the racial differences observed.
Legionellosis demonstrates seasonal and geographic variability. During 2000--2009, nearly all regions reported their highest proportion of cases during the summer and early fall. The reported 2009 age-adjusted legionellosis rate in the Middle Atlantic division was nearly six times higher than the rate in the West South Central division. Whether these differences are related to the frequency of testing or reporting is unclear; nonetheless, clinicians should be particularly vigilant for possible LD during the summer and early fall and in geographic areas of relatively high legionellosis incidence. Although use of a urine antigen test for Legionella is recommended for cases of severe community-acquired pneumonia (8), collection of respiratory specimens for Legionella-specific culture also is encouraged as a means to detect all species and subgroups of Legionella and enable strain identification in the event of an outbreak. Urine antigen tests and Legionella-specific culture also are recommended for suspected cases of health-care--associated LD (9).
The findings in this report are subject to at least four limitations. First, current passive surveillance systems cannot determine whether the observed increase in legionellosis cases is actual or an artifact of improved detection or reporting. Second, surveillance likely is biased toward capture of more severe LD cases that are more likely to be tested for Legionella, missing those that have been empirically treated with antibiotics active against Legionella spp. and those not requiring hospitalization. Third, the nonspecific symptoms of and lack of good diagnostic tests for PF likely result in substantial underdiagnosis of this form of legionellosis. Finally, the proportion of cases that are potentially travel-associated likely is an overestimate resulting from a bias in many states toward primarily reporting travel-associated cases to SLDSS.
A better understanding of the disease burden and the epidemiology of legionellosis is important, but current passive surveillance systems cannot provide all the information required. In January 2011, active laboratory-based and population-based surveillance was launched in 10 ABCs sites around the country.§§ Data from this surveillance will be used to obtain population-based estimates of disease incidence; further describe demographic, seasonal, and geographic variability; and evaluate and improve legionellosis prevention efforts, such as the guidance provided by the American Society of Heating, Refrigerating, and Air Conditioning Engineers on preventing legionellosis associated with building water systems (10).
References
- National Cancer Institute. Standard populations---19 age groups. Bethesda, MD: Surveillance Epidemiology and End Results (SEER) program, National Cancer Institute; 2010. Available at http://seer.cancer.gov/stdpop.19ages.html. Accessed September 20, 2010.
- CDC. Surveillance for travel-associated Legionnaires disease---United States, 2005--2006. MMWR 2007;56:1261--3.
- Benin AL, Benson RF, Besser RE. Trends in Legionnaires disease, 1980--1998: declining mortality and new patterns of diagnosis. Clin Infect Dis 2002;35:1039--46.
- Neil K, Berkelman R. Increasing incidence of legionellosis in the United States, 1990--2005: changing epidemiologic trends. Clin Infect Dis 2008;47:591--9.
- Marston BJ, Plouffe JF, File TM, et al. Incidence of community-acquired pneumonia requiring hospitalization---results of a population-based active surveillance study in Ohio. Arch Intern Med 1997;157:1709--18.
- Fields BS, Benson RF, Besser RE. Legionella and Legionnaires' disease: 25 years of investigation. Clin Micro Rev 2002;15:506--26.
- Jones TF, Benson RF, Brown EW, Rowland JR, Crosier SC, Schaffner W. Epidemiologic investigation of a restaurant-associated outbreak of Pontiac fever. Clin Infect Dis 2003;37:1292--7.
- Mandell LA, Wunderink RG, Anzueto A, et al. Infectious Diseases Society of America/American Thoracic Society consensus guidelines on the management of community-acquired pneumonia in adults. Clin Infect Dis 2007;44:S27--72.
- CDC. Guidelines for preventing health-care--associated pneumonia, 2003: recommendations of CDC and the Healthcare Infection Control Practices Advisory Committee. MMWR 2004;53(No. RR-3):10--3.
- American Society of Heating, Refrigerating, and Air-Conditioning Engineers. ASHRAE Guideline 12-2000: minimizing the risk of legionellosis associated with building water systems. Atlanta, GA: American Society of Heating, Refrigerating, and Air-Conditioning Engineers; 2000.
* New England: Connecticut, Maine, Massachusetts, New Hampshire, Rhode Island, and Vermont; Middle Atlantic: New Jersey, New York, and Pennsylvania; East North Central: Illinois, Indiana, Michigan, Wisconsin, and Ohio; West North Central: Iowa, Kansas, Missouri, Minnesota, Nebraska, North Dakota, and South Dakota; South Atlantic: Delaware, District of Columbia, Florida, Georgia, Maryland, North Carolina, South Carolina, Virginia, and West Virginia; East South Central: Alabama, Kentucky, Mississippi, and Tennessee; West South Central: Arkansas, Louisiana, Oklahoma, and Texas; Mountain: Arizona, Colorado, Idaho, Montana, Nevada, New Mexico, Utah, and Wyoming; Pacific: Alaska, California, Hawaii, Oregon, and Washington.
† The previous case definition, in use during 1996--2004, also included detection of Legionella pneumophila serogroup 1 through direct fluorescent antibody testing as a confirmatory laboratory test. The 2005 case definition is available at http://www.cdc.gov/osels/ph_surveillance/nndss/casedef/legionellosis_current.htm. The 1996 case definition is available at http://www.cdc.gov/osels/ph_surveillance/nndss/casedef/legionellosis1996.htm.
§ A legionellosis case report form is available to state and local health departments at http://www.cdc.gov/legionella/files/legionella_case_report.pdf.
¶ A case of legionellosis was considered to be potentially travel-associated if the patient reported spending at least one night away from home during the 2 weeks before illness onset.
** Data on the ethnicity of cases reported to NNDSS were not included because 39% of cases were in persons of unknown ethnicity.
†† Nebraska, North Dakota, Wyoming, and DC did not report any confirmed legionellosis cases to SLDSS during 2005--2009. During this period, 29--40 states reported cases to SLDSS each year.
§§ Additional information is available at http://www.cdc.gov/abcs/index.html.
What is already known on this topic?
Thousands of cases of legionellosis occur each year in the United States as either Legionnaires disease, an often severe form of pneumonia, or Pontiac fever, an influenza-like, self-limited illness.
What is added by this report?
The incidence of reported legionellosis in the United States nearly tripled during 2000--2009, from 0.39 per 100,000 persons to 1.15. The reasons for this increase are unknown, but increases in the number of older persons and persons at high risk for infection and increased case detection or reporting might have played a role. Incidence increased with age and was highest in the Northeast.
What are the implications for public health practice?
Active, population-based legionellosis surveillance is needed to better assess the epidemiology and apparently increasing incidence of legionellosis in the United States. The rise in reported cases reinforces the need for health-care providers to test adults with severe community-acquired pneumonia or health-care--associated pneumonia for Legionnaires disease and report legionellosis cases to public health authorities.
FIGURE. Annual average percentage of legionellosis cases occurring annually, by month and U.S. Census region* --- United States, 2000--2009
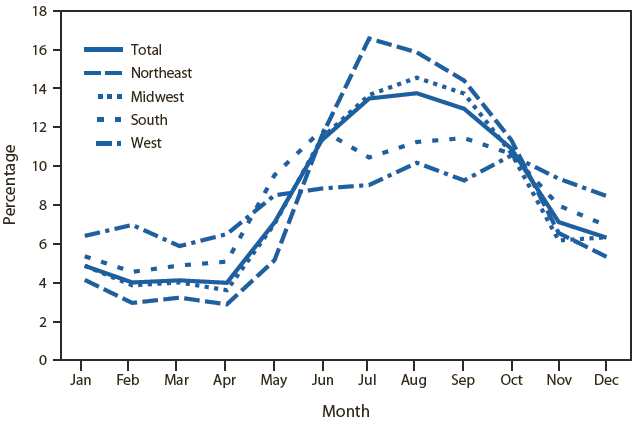
* Northeast: Connecticut, Maine, Massachusetts, Rhode Island, Vermont, New Jersey, New York, and Pennsylvania; Midwest: Indiana, Illinois, Michigan, Ohio, Iowa, Nebraska, Kansas, North Dakota, Minnesota, and Missouri; South: Delaware, District of Columbia, Florida, South Carolina, West Virginia, Kentucky, Louisiana, Oklahoma, and Texas; West: Colorado, Idaho, New Mexico, Montana, Utah, Nevada, Wyoming, Alaska, California, Hawaii, Oregon, and Washington.
Alternate Text: The figure above shows the average percentage of legionellosis cases occurring in the United States annually, by month and U.S. Census region during 2000-2009. Cases tended to occur in the summer and early fall, with the June-October period accounting for 62% of the cases reported each year.
Use of trade names and commercial sources is for identification only and does not imply endorsement by the U.S. Department of
Health and Human Services.
References to non-CDC sites on the Internet are
provided as a service to MMWR readers and do not constitute or imply
endorsement of these organizations or their programs by CDC or the U.S.
Department of Health and Human Services. CDC is not responsible for the content
of pages found at these sites. URL addresses listed in MMWR were current as of
the date of publication.
All MMWR HTML versions of articles are electronic conversions from typeset documents.
This conversion might result in character translation or format errors in the HTML version.
Users are referred to the electronic PDF version (http://www.cdc.gov/mmwr)
and/or the original MMWR paper copy for printable versions of official text, figures, and tables.
An original paper copy of this issue can be obtained from the Superintendent of Documents, U.S.
Government Printing Office (GPO), Washington, DC 20402-9371;
telephone: (202) 512-1800. Contact GPO for current prices.
**Questions or messages regarding errors in formatting should be addressed to
mmwrq@cdc.gov.
