|
EXHIBIT. Print criteria for conditions reported to the National Notifiable Diseases Surveillance System, January 2010 |
||
|---|---|---|
|
Code |
Event |
Print Criteria* |
|
11090 |
Anaplasma phagocytophilum |
Confirmed and probable; unknown from California (CA) |
|
10350 |
Anthrax |
Confirmed and probable; unknown reported from CA |
|
10530 |
Botulism, foodborne |
Confirmed; unknown from CA |
|
10540 |
Botulism, infant |
Confirmed; unknown from CA |
|
10550 |
Botulism, other (includes wound) |
Confirmed; unknown from CA |
|
10548 |
Botulism, other (unspecified) |
Confirmed; unknown from CA |
|
10549 |
Botulism, wound |
Confirmed; unknown from CA |
|
10020 |
Brucellosis |
Confirmed and probable; unknown from CA |
|
10054 |
California serogroup virus, neuroinvasive disease |
Data for publication received from ArboNET |
|
10061 |
California serogroup virus, nonneuroinvasive disease |
Data for publication received from ArboNET |
|
10273 |
Chancroid |
All reports are printed. |
|
10274 |
infection |
All reports are printed. |
|
10470 |
Cholera (toxigenic O1 or O139) |
Confirmed; unknown from CA verified as confirmed |
|
11580 |
Cryptosporidiosis |
Confirmed and probable; unknown from CA |
|
11575 |
Cyclosporiasis |
Confirmed and probable; unknown from CA |
|
10680 |
Dengue fever (DF) |
Confirmed and probable |
|
10685 |
Dengue hemorrhagic fever (DHF) |
Confirmed and probable |
|
10040 |
Diphtheria |
Confirmed, probable, and unknown case status are printed. |
|
10053 |
Eastern equine encephalitis virus, neuroinvasive disease |
Data for publication received from ArboNET |
|
10062 |
Eastern equine encephalitis virus, nonneuroinvasive disease |
Data for publication received from ArboNET |
|
11088 |
Ehrlichia chaffeensis |
Confirmed and probable; unknown from CA |
|
11089 |
Ehrlichia ewingii |
Confirmed and probable; unknown from CA |
|
11087 |
Ehrlichiosis, human, other or unspecified agent |
— |
|
11091 |
Ehrlichiosis/Anaplasmosis, undetermined |
Confirmed and probable; unknown from CA |
|
11570 |
Giardiasis |
Confirmed and probable; unknown from CA |
|
10280 |
Gonorrhea |
All reports are printed. |
|
10590 |
Haemophilus influenzae, invasive disease |
CSTE VPD print criteria are used. Cases with confirmed, probable, and unknown case status are printed. |
|
10380 |
Hansen disease (Leprosy) |
Confirmed; unknown from CA |
|
11590 |
Hantavirus pulmonary syndrome |
Confirmed and unknown |
|
11550 |
Hemolytic uremic syndrome postdiarrheal |
Confirmed, probable, and unknown from CA |
|
10110 |
Hepatitis A, acute |
Confirmed; unknown from CA |
|
10100 |
Hepatitis B, acute |
Confirmed; unknown from CA |
|
10101 |
Hepatitis C, acute |
Confirmed; unknown from CA |
|
11061 |
Influenza-associated pediatric mortality |
Cases with confirmed case status are printed. |
|
10490 |
Legionellosis |
Confirmed; unknown from CA |
|
10640 |
Listeriosis |
Confirmed; unknown from CA |
|
11080 |
Lyme disease |
Confirmed and probable; unknown from CA |
|
10130 |
Malaria |
Confirmed; unknown from CA |
|
10140 |
Measles (rubeola), total |
CSTE VPD print criteria are used. Cases with confirmed and unknown case status are printed. |
|
10150 |
Meningococcal disease (Neisseria meningitidis) |
Confirmed and probable; unknown from CA |
|
10180 |
Mumps |
CSTE VPD print criteria are used. Cases with confirmed, probable, and unknown case status are printed. |
|
10317 |
Neurosyphilis |
All reports are printed. |
Persons using assistive technology might not be able to fully access information in this file. For assistance, please send e-mail to: mmwrq@cdc.gov. Type 508 Accommodation and the title of the report in the subject line of e-mail.
Summary of Notifiable Diseases — United States, 2010
Please note: An erratum has been published for this article. To view the erratum, please click here.
Preface
The Summary of Notifiable Diseases United States, 2010 contains the official statistics, in tabular and graphic form, for the reported occurrence of nationally notifiable infectious diseases in the United States for 2010. Unless otherwise noted, the data are final totals for 2010, reported as of June 30, 2011. These statistics are collected and compiled from reports sent by state health departments and territories to the National Notifiable Diseases Surveillance System (NNDSS), which is operated by CDC in collaboration with the Council of State and Territorial Epidemiologists (CSTE). The is available at http://www.cdc.gov/mmwr/mmwr_su/mmwr_nd/. This site also includes publications from previous years.
The Highlights section presents noteworthy epidemiologic and prevention information from 2010 for selected diseases and additional information to aid in the interpretation of surveillance and disease-trend data. Part 1 contains tables illustrating incidence data for the nationally notifiable infectious diseases reported during 2010.* The tables provide the number of cases reported to CDC for 2010 and the distribution of cases by month, geographic location, and the patients' demographic characteristics (age, sex, race, and ethnicity). Part 2 contains graphs and maps that depict summary data for certain notifiable infectious diseases described in tabular form in Part 1. Part 3 contains tables that list the number of cases of notifiable diseases reported to CDC since 1979. This section also includes a table enumerating deaths associated with specified notifiable diseases reported to CDC's National Center for Health Statistics (NCHS) during 2002–2008. The Selected Reading section presents general and disease-specific references for notifiable infectious diseases. These references provide additional information on surveillance and epidemiologic concerns, diagnostic concerns, and disease-control activities.
Comments and suggestions from readers are welcome. To increase the usefulness of future editions, comments regarding the current report and descriptions of how information is or could be used are invited. Comments should be sent to Data Operations Team NNDSS, Division of Notifiable Diseases and Healthcare Information (proposed), Public Health Surveillance and Informatics Program Office (proposed) at soib@cdc.gov.
Background
The infectious diseases designated as notifiable at the national level during 2010 are listed in this section. A notifiable disease is one for which regular, frequent, and timely information regarding individual cases is considered necessary for the prevention and control of the disease. A brief history of the reporting of nationally notifiable infectious diseases in the United States is available at http://www.cdc.gov/osels/ph_surveillance/nndss/nndsshis.htm. In 1961, CDC assumed responsibility for the collection and publication of data on nationally notifiable diseases. NNDSS is neither a single surveillance system nor a method of reporting. Certain NNDSS data are reported to CDC through separate surveillance information systems and through different reporting mechanisms; however, these data are aggregated and compiled for publication purposes.
Notifiable disease reporting at the local level protects the public's health by ensuring the proper identification and follow-up of cases. Public health workers ensure that persons who are already ill receive appropriate treatment; trace contacts who need vaccines, treatment, quarantine, or education; investigate and halt outbreaks; eliminate environmental hazards; and close premises where spread has occurred. Surveillance of notifiable conditions helps public health authorities to monitor the effect of notifiable conditions, measure disease trends, assess the effectiveness of control and prevention measures, identify populations or geographic areas at high risk, allocate resources appropriately, formulate prevention strategies, and develop public health policies. Monitoring surveillance data enables public health authorities to detect sudden changes in disease occurrence and distribution, identify changes in agents and host factors, and detect changes in health-care practices.
The list of nationally notifiable infectious diseases is revised periodically. A disease might be added to the list as a new pathogen emerges, or a disease might be deleted as its incidence declines. Public health officials at state health departments and CDC collaborate in determining which diseases should be nationally notifiable. CSTE, with input from CDC, makes recommendations annually for additions and deletions. Although disease reporting is mandated by legislation or regulation at the state and local levels, state notification to CDC is voluntary. Reporting completeness of notifiable diseases is highly variable and related to the condition or disease being reported (1). The list of diseases considered notifiable varies by state and year. Current and historic national public health surveillance case definitions used for classifying and enumerating cases consistently across reporting jurisdictions are available at http://www.cdc.gov/osels/ph_surveillance/nndss/nndsshis.htm.
Infectious Diseases Designated as Notifiable at the National Level during 2010*
Anthrax†
Arboviral diseases, neuroinvasive and nonneuroinvasive
California serogroup virus
Eastern equine encephalitis virus
Powassan virus
St. Louis encephalitis virus
West Nile virus
Western equine encephalitis virus
Botulism
foodborne
infant
other (wound and unspecified)
Brucellosis†
Chancroid
infection
Cholera
Cryptosporidiosis
Cyclosporiasis†
Dengue Virus Infection
Dengue fever
Dengue hemorrhagic fever
Dengue shock syndrome
Diphtheria
Ehrlichiosis/Anaplasmosis†
Undetermined
Giardiasis
Gonorrhea
Haemophilus influenzae, invasive disease†
Hansen disease (leprosy)
Hantavirus pulmonary syndrome†
Hemolytic uremic syndrome, post-diarrheal
Hepatitis, viral
Hepatitis A, acute
Hepatitis B, acute
Hepatitis B virus, perinatal infection
Hepatitis B, chronic
Hepatitis C, acute
Hepatitis C, chronic§
Human Immunodeficiency Virus (HIV) infection**
Influenza-associated pediatric mortality
Legionellosis
Listeriosis
Lyme disease
Malaria†
Measles
Meningococcal disease
Mumps
Novel influenza A virus infections
Pertussis
Plague
Poliomyelitis, paralytic
Poliovirus infection, nonparalytic
Psittacosis†
Q fever†
Acute
Chronic
Rabies
Animal
Human†
Rubella
Rubella, congenital syndrome
Salmonellosis
Severe acute respiratory syndrome-associated coronavirus (SARS-CoV) disease
Shiga toxin-producing (STEC)
Shigellosis
Smallpox
Spotted fever rickettsiosis†¶
Streptococcal toxic-shock syndrome†
Streptococcus pneumoniae, invasive disease
Syphilis
Syphilis, congenital
Tetanus
Toxic-shock syndrome (other than streptococcal)
Trichinellosis
Tuberculosis†
Tularemia
Typhoid fever
Vancomycin-intermediate (VISA) infection
Vancomycin-resistant (VRSA) infection
Varicella (morbidity)
Varicella (mortality)
Vibriosis
Viral hemorrhagic fevers
New World Arenavirus
Crimean-Congo hemorrhagic fever virus
Ebola virus
Lassa virus
Marburg virus
Yellow fever
* This list reflects position statements CSTE approved in 2009 for national surveillance, which were implemented beginning in January 2010. The following changes were made to the 2010 list of nationally notifiable diseases: a) dengue virus and viral hemorrhagic fever were added to the list; b) coccidioidomycosis and invasive Group A disease were deleted from the list; and c) e invasive disease replaced two previously notifiable conditions: drug-resistant and , invasive disease non-drug–resistant in children aged < 5 years.
† 2010 reflects a modified surveillance case definition for this condition, per approved 2009 CSTE position statements.
¶ Previously named Rocky Mountain Spotted Fever
§ Previously named hepatitis C virus infection, past or present
** AIDS has been reclassified as HIV stage III.
Data Sources
Provisional data concerning the reported occurrence of nationally notifiable infectious diseases are published weekly in . After each reporting year, staff in state health departments finalize reports of cases for that year with local or county health departments and reconcile the data with reports previously sent to CDC throughout the year. These data are compiled in final form in the .
Notifiable disease reports are the authoritative and archival counts of cases. They are approved by the appropriate chief epidemiologist from each submitting state or territory before being published in the . Data published in or other surveillance reports produced by CDC programs might not agree exactly with data reported in the annual because of differences in the timing of reports, the source of the data, or surveillance methodology.
Data in the were derived primarily from reports transmitted to CDC from health departments in the 50 states, five territories, New York City, and the District of Columbia. Data were reported for weeks 1–52, which correspond to the period for the week ending January 9, 2010, through the week ending January 1, 2011. More information regarding infectious notifiable diseases, including case definitions, is available at http://www.cdc.gov/osels/ph_surveillance/nndss/nndsshis.htm. Policies for reporting notifiable disease cases can vary by disease or reporting jurisdiction. The case-status categories used to determine which cases reported to NNDSS are published by disease or condition and are listed in the print criteria column of the 2010 NNDSS event code list (Exhibit) available at http://www.cdc.gov/osels/ph_surveillance/nndss/nndsshis.htm.
Final data for certain diseases are derived from the surveillance records of the CDC programs listed below. Requests for further information regarding these data should be directed to the appropriate program.
Office of Surveillance, Epidemiology and Laboratory Services
National Center for Health Statistics (NCHS)
Office of Vital and Health Statistics Systems (deaths from selected notifiable diseases)
Office of Infectious Diseases (Proposed)
National Center for HIV/AIDS, Viral Hepatitis, STD and TB Prevention
Division of HIV/AIDS Prevention (HIV infection diagnoses) Division of STD Prevention (chancroid; C, genital infection; gonorrhea; and syphilis) Division of Tuberculosis Elimination (tuberculosis)
National Center for Immunization and Respiratory Diseases
Influenza Division (influenza-associated pediatric mortality)
Division of Viral Diseases, (poliomyelitis, varicella [morbidity and mortality], and SARS-CoV)
National Center for Emerging and Zoonotic Infectious Diseases
Division of Vector-Borne Diseases (arboviral diseases)
Division of High-Consequence Pathogens and Pathology (animal rabies)
NCHS postcensal estimates of the resident population of the United States for July 1, 2000–July 1, 2009, by year, county, age, bridged race, Hispanic origin, and sex (Vintage 2009), prepared under a collaborative arrangement with the U.S. Census Bureau and released June 20, 2010. Available from: www.cdc.gov/nchs/nvss/bridged_race.htm as of July 23, 2010.
Populations for territories are 2009 estimates from the U.S. Census Bureau International Data Base, available at http://www.census.gov/population/international/data/idb/informationGateway.php. The choice of population denominators for incidence reported in is based on 1) the availability of census population data at the time of preparation for publication and 2) the desire for consistent use of the same population data to compute incidence reported by different CDC programs. Incidence in the is calculated as the number of reported cases for each disease or condition divided by either the U.S. resident population for the specified demographic population or the total U.S. resident population, multiplied by 100,000. When a nationally notifiable disease is associated with a specific age restriction, the same age restriction is applied to the population in the denominator of the incidence calculation. In addition, population data from states in which the disease or condition was not reportable or was not available were excluded from incidence calculations. Unless otherwise stated, disease totals for the United States do not include data for American Samoa, Guam, Puerto Rico, the Commonwealth of the Northern Mariana Islands, or the U.S. Virgin Islands.
Interpreting Data
Incidence data in the are presented by the date of report to CDC as determined by the week and year assigned by the state or territorial health department, except for the domestic arboviral diseases, which are presented by date of diagnosis. Data are reported by the state in which the patient resided at the time of diagnosis. For certain nationally notifiable infectious diseases, surveillance data are reported independently to different CDC programs. For this reason, surveillance data reported by other CDC programs might vary from data reported in the because of differences in 1) the date used to aggregate data (e.g., date of report or date of disease occurrence), 2) the timing of reports, 3) the source of the data, 4) surveillance case definitions, 5) policies regarding case jurisdiction (i.e., which state should report the case to CDC), and print criteria.
Data reported in the are useful for analyzing disease trends and determining relative disease burdens. However, reporting practices affect how these data should be interpreted. Disease reporting is likely incomplete, and completeness might vary, depending on the disease and reporting state. The degree of completeness of data reporting might be influenced by the diagnostic facilities available, control measures in effect, public awareness of a specific disease, and the resources and priorities of state and local officials responsible for disease control and public health surveillance. Finally, factors such as changes in methods for public health surveillance, introduction of new diagnostic tests, or discovery of new disease entities can cause changes in disease reporting that are independent of the true incidence of disease.
Public health surveillance data are published for selected racial/ethnic populations because these variables can be risk markers for certain notifiable diseases. Race and ethnicity data also can be used to highlight populations for focused prevention programs. However, caution must be used when drawing conclusions from reported race and ethnicity data. Different racial/ethnic populations might have different patterns of access to health care, potentially resulting in data that are not representative of actual disease incidence among specific racial/ethnic populations. Surveillance data reported to NNDSS are in either individual case-specific form or summary form (i.e., aggregated data for a group of cases). Summary data often lack demographic information (e.g., race); therefore, the demographic-specific rates presented in the might be underestimated.
In addition, not all race and ethnicity data are collected or reported uniformly for all diseases, the standards for race and ethnicity have changed over time, and the transition in implementation to the newest race and ethnicity standard has taken varying amounts of time for different CDC surveillance systems. For example, in 1990, the National Electronic Telecommunications System for Surveillance (NETSS) was established to facilitate data collection and submission of case-specific data to CDC's National Notifiable Diseases Surveillance System, except for selected diseases. In 1990, NETSS implemented the 1977 Office of Management and Budget (OMB) standard for race and ethnicity, in which race and ethnicity were collected in one variable. Other surveillance programs implemented two variables for collection of race and ethnicity data. The 1997 OMB race and ethnicity standard, which requires collection of multiple races per person using multiple race variables, should have been implemented by federal programs beginning January 1, 2003. In 2003, the CDC Tuberculosis and HIV/AIDS programs were able to update their surveillance information systems to implement 1997 OMB standards. In 2005, the Sexually Transmitted Diseases Management Information System also was updated to implement the 1997 OMB standards. However, other diseases reported to the NNDSS using NETSS were undergoing a major change in the manner in which data were collected and reported to CDC. This change is known as the transition from NETSS to the National Electronic Disease Surveillance System (NEDSS). NEDSS implemented the newer 1997 OMB standard for race and ethnicity. However, the transition from NETSS to NEDSS was slower than originally expected relative to reporting data to CDC using NEDSS; thus, some data are currently reported to CDC using NETSS formats, even if the data in the reporting jurisdictions are collected using NEDSS. Until the transition to NEDSS is complete, race and ethnicity data collected or reported to NETSS using different race and ethnicity standards will need to be converted to one standard. The data are now converted to the 1977 OMB standard originally implemented in NETSS.
Although the recommended standard for classifying a person's race or ethnicity is based on self-reporting, this procedure might not always be followed.
Transition in NNDSS Data Collection and Reporting
Before 1990, data were reported to CDC as cumulative counts rather than individual case reports. In 1990, using NETSS, states began electronically capturing and reporting individual case reports to CDC without personal identifiers. In 2001, CDC launched NEDSS, now a component of the Public Health Information Network, to promote the use of data and information system standards that advance the development of efficient, integrated, and interoperable surveillance information systems at the local, state, and federal levels. One of the objectives of NEDSS is to improve the accuracy, completeness, and timeliness of disease reporting at the local, state, and national levels. To meet this objective, CDC has developed the NEDSS Base System (NBS), a public health surveillance information system. At the time of publication, the system had been adopted by 19 reporting jurisdictions; 29 reporting jurisdictions had a state or vendor-developed NEDSS-compatible system; and 9 remaining jurisdictions were either in the process of adopting or changing their NEDSS-compatible system or were using a non-NEDSS-compatible system. A major feature of all NEDSS-compatible solutions, which includes NBS, is the ability to capture data already in electronic form (e.g., electronic laboratory results, which are needed for case confirmation) rather than enter these data manually as in NETSS. In 2010, 16 states used NBS to transmit nationally notifiable infectious diseases to CDC, 32 states used a NEDSS-compatible based system, and the remaining state and territorial jurisdictions continued to use a non-NEDSS-compatible system. Additional information concerning NEDSS is available at http://www.cdc.gov/phin/activities/applications-services/nedss/index.html.
Methodology for Identifying which Nationally Notifiable Infectious Diseases are Reportable
States and jurisdictions are sovereign entities. Reportable conditions are determined by laws and regulations of each state and jurisdiction, and some conditions deemed nationally notifiable might not be reportable in certain states or jurisdictions. Determining which nationally notifiable infectious diseases are reportable in NNDSS reporting jurisdictions was determined by analyzing results of the 2010 CSTE State Reportable Conditions Assessment (SRCA). This assessment solicited information from each NNDSS reporting jurisdiction (all 50 U.S. states, the District of Columbia, New York City, and five U.S. territories) regarding which public health conditions were reportable for more than 6 months in 2010 by clinicians, laboratories, hospitals, or other public health reporters, as mandated by law or regulation. To assist in the implementation of SRCA, the NNDSS program provided technical assistance to the CSTE for the 2010 SRCA.
In 2007, SRCA became the first collaborative project of such technical magnitude ever conducted by CSTE and CDC. Previously, CDC and CSTE had gathered public health reporting requirements independently. The 2010 SRCA collected information regarding whether each reportable condition was 1) explicitly reportable (i.e., listed as a specific disease or as a category of diseases on reportable disease lists); 2) whether it was implicitly reportable (i.e., included in a general category of the reportable disease list, such as rare diseases of public health importance); or 3) not reportable. Only explicitly reportable conditions were considered reportable for the purpose of national public health surveillance and thus reflected in NNDSS. Moreover, to determine whether a condition included in SRCA was reportable in at least one public health reporter category for a specific nationally notifiable infectious disease (NNID) in a reporting jurisdiction, CDC developed and applied an algorithm to run on the data collected in SRCA. Analyzed results of the 2010 SRCA were used to determine whether a NNID was not reportable in a reporting jurisdiction in 2010 and thus noted with an "N" indicator (for "not reportable") in the front tables of this report.
Unanalyzed results from the 2007, 2008, 2009 and 2010 SRCA are available using CSTE's web query tool at http://www.cste.org/dnn/programsandactivities/publichealthinformatics/statereportableconditionsqueryresults/tabid/261/default.aspx. Background information about the CSTE SRCA have been published previously (2).
Revised International Health Regulations
In May 2005, the World Health Assembly adopted revised International Health regulations (IHR) (3) that went into effect in the United States on July 18, 2007. This international legal instrument governs the role of the World Health Organization (WHO) and its member countries, including the United States, in identifying, responding to, and sharing information about Public Health Emergencies of International Concern (PHEIC). A PHEIC is an extraordinary event that 1) constitutes a public health risk to other countries through international spread of disease, and 2) potentially requires a coordinated international response.
The IHR are designed to prevent and protect against the international spread of diseases while minimizing the effect on world travel and trade. Countries that have adopted these rules have a much broader responsibility to detect, respond to, and report public health emergencies that potentially require a coordinated international response in addition to taking preventive measures. The IHR will help countries work together to identify, respond to, and share information about PEHIC.
The revised IHR is a conceptual shift from a predefined disease list to a framework of reporting and responding to events on the basis of an assessment of public health criteria, including seriousness, unexpectedness, and international travel and trade implications. PHEIC are events that fall within those criteria (further defined in a decision algorithm in Annex 2 of the revised IHR). Four conditions always constitute a PHEIC and do not require the use of the IHR decision instrument in Annex 2: Severe Acute Respiratory Syndrome (SARS), smallpox, poliomyelitis caused by wild-type poliovirus, and human influenza caused by a new subtype. Any other event requires the use of the decision algorithm in Annex 2 of the IHR to determine if it is a potential PHEIC. Examples of events that require the use of the decision instrument include, but are not limited to, cholera, pneumonic plague, yellow fever, West Nile fever, viral hemorrhagic fevers, and meningococcal disease. Other biologic, chemical, or radiologic events might fit the decision algorithm and also must be reportable to WHO. All WHO member states are required to notify WHO of a potential PHEIC. WHO makes the final determination about the existence of a PHEIC.
Health-care providers in the United States are required to report diseases, conditions, or outbreaks as determined by local, state, or territorial law and regulation, and as outlined in each state's list of reportable conditions. All health-care providers should work with their local, state, and territorial health agencies to identify and report events that might constitute a potential PHEIC occurring in their location. U.S. State and Territorial Departments of Health have agreed to report information about a potential PHEIC to the most relevant federal agency responsible for the event. In the case of human disease, the U.S. State or Territorial Departments of Health will notify CDC rapidly through existing formal and informal reporting mechanisms (4). CDC will further analyze the event based on the decision algorithm in Annex 2 of the IHR and notify the U.S. Department of Health and Human Services (DHHS) Secretary's Operations Center (SOC), as appropriate.
DHHS has the lead role in carrying out the IHR, in cooperation with multiple federal departments and agencies. The DHHS SOC is the central body for the United States responsible for reporting potential events to WHO. The United States has 48 hours to assess the risk of the reported event. If authorities determine that a potential PHEIC exists, the WHO member country has 24 hours to report the event to WHO.
An IHR decision algorithm in Annex 2 has been developed to help countries determine whether an event should be reported. If any two of the following four questions can be answered in the affirmative, then a determination should be made that a potential PHEIC exists and WHO should be notified:
- Is the public health impact of the event serious?
- Is the event unusual or unexpected?
- Is there a significant risk of international spread?
- Is there a significant risk of international travel or trade restrictions?
Additional information concerning IHR is available at http://www.who.int/csr/ihr/en, http://www.globalhealth.gov, http://www.cdc.gov/globalhealth/ihregulations.htm, and http://www.cste.org/PS/2007ps/2007psfinal/ID/07-ID-06.pdf. At its annual meeting in June 2007, CSTE approved a position statement to support the implementation of IHR in the United States (4). CSTE also approved a position statement in support of the 2005 IHR adding initial detections of novel influenza A virus infections to the list of nationally notifiable diseases reportable to NNDSS, beginning in January 2007 (5).
- Doyle TJ, Glynn MK, Groseclose LS. Completeness of notifiable infectious disease reporting in the United States: an analytical literature review. Am J Epidemiol 2002;155:86–74.
- Jajosky R, Park M, Macdonald S, Ferland L. Findings from the Council of State and Territorial Epidemiologists' 2008 assessment of state reportable and nationally notifiable conditions in the United States and considerations for the future. J Public Health Manag Pract 2011;17:255–64. Available at http://journals.lww.com/jphmp/Abstract/2011/05000/ findings from the Council of State and Territorial.9.aspx.
- World Health Organization. Third report of Committee A. Annex 2. Geneva, Switzerland: World Health Organization; 2005. Available at http://www.who.int/gb/ebwha/pdf_files/WHA58/A58_55-en.pdf.
- Council of State and Territorial Epidemiologists. Events that may constitute a public health emergency of international concern. Position statement 07-ID-06. Available at http://www.cste.org/PS/2007ps/2007psfinal/ID/07-ID-06.pdf.
- Available at http://www.cste.org/PS/2007ps/2007psfinal/ID/07-ID-01.pdf.
* No cases of anthrax; diphtheria; eastern equine encephalitis virus disease, non-neuroinvasive; poliomyelitis, paralytic; poliovirus infection, nonparalytic; Powassan virus disease, non-neuroinvasive; rubella, congenital syndrome; severe acute respiratory syndrome-associated coronavirus disease (SARS-CoV); smallpox; western equine encephalitis virus disease, neuroinvasive and non-neuroinvasive; and yellow fever were reported in 2010. Data on hepatitis B, perinatal infection, chronic hepatitis B, and chronic hepatitis C virus infection are not included because they are undergoing data quality review.
|
EXHIBIT. (Continued) Print criteria for conditions reported to the National Notifiable Diseases Surveillance System, January 2010 |
||
|---|---|---|
|
Code |
Event |
Print Criteria* |
|
11062 |
Novel influenza A virus infections, initial detections of |
Cases with confirmed status and cases reported from CA with unknown status, later verified to be confirmed, are printed. |
|
10190 |
Pertussis |
CSTE VPD print criteria are used. Cases with confirmed, probable, and unknown case status are printed. |
|
10440 |
Plague |
All reports are printed. |
|
10410 |
Poliomyelitis, paralytic |
Confirmed; unknown from CA that are verified as confirmed |
|
10405 |
Poliovirus infection, nonparalytic |
Confirmed; unknown from CA that are verified as confirmed |
|
10057 |
Powassan virus, neuroinvasive disease |
Data for publication received from ArboNET |
|
10063 |
Powassan virus, nonneuroinvasive disease |
Data for publication received from ArboNET |
|
10450 |
Psittacosis (Ornithosis) |
Confirmed and probable; unknown from CA |
|
10257 |
Q fever, acute |
Confirmed and probable; unknown from CA |
|
10258 |
Q fever, chronic |
Confirmed and probable; unknown from CA |
|
10340 |
Rabies, animal |
Confirmed and unknown from CA |
|
10460 |
Rabies, human |
Confirmed; unknown from CA verified as confirmed |
|
10200 |
Rubella |
CSTE VPD print criteria are used. Cases with confirmed and unknown case status are printed. |
|
10370 |
Rubella, congenital syndrome |
CSTE VPD print criteria are used. Cases with confirmed, probable, and unknown case status are printed. |
|
11000 |
Salmonellosis |
Confirmed and probable; unknown from CA |
|
10575 |
Severe acute respiratory syndrome (SARS)-associated coronavirus disease (SARS-CoV) |
Cases with confirmed and probable case status are printed. |
|
11563 |
Shiga toxin-producing (STEC) |
All reports printed |
|
11010 |
Shigellosis |
Confirmed and probable; unknown from CA |
|
11800 |
Smallpox |
Cases with confirmed and probable case status are printed. |
|
10250 |
Spotted Fever Rickettsiosis |
Confirmed, probable, and unknown |
|
10051 |
St. Louis encephalitis virus, neuroinvasive disease |
Data for publication received from ArboNET |
|
10064 |
St. Louis encephalitis virus, nonneuroinvasive disease |
Data for publication received from ArboNET |
|
11700 |
Streptococcal toxic-shock syndrome |
Confirmed and probable; unknown from CA |
|
11723 |
Streptococcus pneumoniae, invasive disease (IPD) (all ages) |
Confirmed; unknown from CA |
|
10316 |
Syphilis, congenital |
All reports are printed. |
|
10313 |
Syphilis, early latent |
All reports are printed. |
|
10314 |
Syphilis, late latent |
All reports are printed. |
|
10318 |
Syphilis, late with clinical manifestations other than neurosyphilis |
All reports are printed. |
|
10311 |
Syphilis, primary |
All reports are printed. |
|
10312 |
Syphilis, secondary |
All reports are printed. |
|
10310 |
Syphilis, total primary and secondary |
All reports are printed. |
|
10315 |
Syphilis, unknown latent |
All reports are printed. |
|
10210 |
Tetanus |
CSTE VPD criteria are used. All reports are printed. |
|
10520 |
Toxic-shock syndrome (staphylococcal) |
Confirmed and probable; unknown from CA |
|
10270 |
Trichinellosis |
Confirmed; unknown from CA |
|
10220 |
Tuberculosis |
Print criteria are determined by the CDC Tuberculosis program. |
|
10230 |
Tularemia |
All reports are printed. |
|
10240 |
Typhoid fever (caused by ) |
Confirmed and probable; unknown from CA |
|
11663 |
Vancomycin-intermediate (VISA) |
Confirmed; unknown from CA verified as confirmed |
|
11665 |
Vancomycin-resistant (VRSA) |
Confirmed; unknown from CA verified as confirmed |
|
EXHIBIT. (Continued) Print criteria for conditions reported to the National Notifiable Diseases Surveillance System, January 2010 |
||
|---|---|---|
|
Code |
Event |
Print Criteria* |
|
10030 |
Varicella (Chickenpox) |
VPD print criteria are used. Cases with confirmed, probable, and unknown case status from CA are printed. |
|
11545 |
Vibriosis (non-cholera species infections) |
Confirmed, probable, and unknown from California |
|
11647 |
Viral hemorrhagic fever |
Confirmed; footnote will denote the specific VHF (Ebola or Marburg, Lassa, new world Arenaviruses, or Crimean-Congo) reported to CDC |
|
10056 |
West Nile virus, neuroinvasive disease |
Data for publication received from ArboNET |
|
10049 |
West Nile virus, nonneuroinvasive disease |
Data for publication received from ArboNET |
|
10052 |
Western equine encephalitis virus, neuroinvasive disease |
Data for publication received from ArboNET |
|
10065 |
Western equine encephalitis virus, nonneuroinvasive disease |
Data for publication received from ArboNET |
|
10660 |
Yellow fever |
Data for publication received from ArboNET |
|
* Print policy for the National Notifiable Diseases Surveillance System (NNDSS): For a case report of a nationally notifiable disease to print in the , the reporting state or territory must have designated the disease reportable in their state or territory for the year corresponding to the data year of report to CDC. After this criterion is met, the disease-specific criteria listed in the Exhibit are applied. When the above-listed table indicates that all reports will be earmarked for printing, this means that cases designated with unknown or suspect case confirmation status will print just as probable and confirmed cases will print. Print criteria for Vaccine Preventable Diseases reflect the case confirmation status print criteria described by 1999 Position Statement #ID-08 entitled Vaccine Preventable Diseases Surveillance Data, and subsequent CSTE position statements. Because CSTE position statements are not customarily finalized until July each year, the NNDSS data for the newly added conditions are not available from all reporting jurisdictions until January of the year following the approval of the CSTE position statement. Abbreviations and other notes: ArboNET Software for Arboviral Surveillance and Case Management CCID Coordinating Center for Infectious Disease CDC Centers for Disease Control and Prevention CSTE Council of State and Territorial Epidemiologists NCIRD National Center for Immunization and Respiratory Diseases, CDC NCPDCID National Center for Preparedness, Detection, and Control of Infectious Disease NCZVED National Center for Zoonotic, Vector-Borne, and Enteric Diseases NEDSS National Electronic Disease Surveillance System NETSS National Electronic Telecommunications System for Surveillance NNDL National Notifiable Disease List (infectious diseases reportable to CDC) NNDSS National Notifiable Diseases Surveillance System STD*MIS Sexually Transmitted Diseases Management Information System–software for STD surveillance and case management TIMS Tuberculosis Information Management System–software for TB surveillance and case management VPD Vaccine Preventable Diseases NA Indicated by — For purposes of this document, "line-listed" data are meant to mean "case-specific" data. |
||
Highlights for 2010
Below are summary highlights for certain national notifiable diseases. Highlights are intended to assist in the interpretation of major occurrences that affect disease incidence or surveillance trends (e.g., outbreaks, vaccine licensure, or policy changes).
Domestic Arboviral, Neuroinvasive and Nonneuroinvasive
During 2010, West Nile virus (WNV) disease cases were reported from 40 states and the District of Columbia. The number of reported WNV neuroinvasive disease cases increased 62% from that reported in 2009, and the reported incidence of neuroinvasive disease was 0.20 cases per 100,000 population. Despite the decline in neuroinvasive disease incidence over previous years, the overall morbidity caused by WNV continues to be substantial. Based on serosurvey results, for every case of neuroinvasive disease, there are an estimated 26.5 nonneuroinvasive disease cases. Using the 629 reported neuroinvasive disease cases, an estimated 16,669 cases of WNV nonneuroinvasive disease occurred in 2010. However, only 392 nonneuroinvasive disease cases were diagnosed and reported; 2% of the cases that are estimated to have occurred. Evidence of WNV human disease was detected in all geographic regions of the United States.The states with the highest incidence of neuroinvasive disease were Arizona (1.60 per 100,000), New Mexico (1.03), Nebraska (0.55), and Colorado (0.51). Among the neuroinvasive disease cases, 345 (55%) cases were reported from four states: Arizona (107 cases), New York (89), Texas (77), and California (72). Arizona reported 17% of all WNV neuroinvasive disease cases in 2010. New York, which reported only six neuroinvasive disease cases in 2009, reported 89 (14%) cases in 2010 (1).
Among the other domestic arboviral disease in the United States, La Crosse virus remained the most common cause of neuroinvasive disease in children and eastern equine encephalitis virus disease, although rare, remained the most severe with a 50% case-fatality rate. In 2010, the District of Columbia reported two nonneuroinvasive disease cases of St. Louis encephalitis virus (SLEV); cases of SLEV haven't been reported from this jurisdiction since 1975.
Botulism
Botulism is a severe paralytic illness caused by toxins produced by Clostridium botulinum. Exposure to toxin can occur by ingestion (foodborne botulism), by in situ production from C. botulinum colonization of a wound (wound botulism), or the gastrointestinal tract (infant botulism and adult intestinal colonization botulism) (1). Cases of botulism caused by all of these exposure routes were reported in 2010. Health-care providers should report suspected botulism cases immediately to their state health departments; all states maintain 24-hour telephone services for reporting botulism and other public health emergencies. CDC maintains intensive surveillance for cases of botulism in the United States and offers a 24 hour/7 day a week consultation service. The CDC botulism duty officer can be reached via the CDC Emergency Operations Center, telephone 770-488-7100.
- Sobel J. Botulism. Clin Infect Dis 2005;41:1167–73.
Brucellosis
Compared with 2009, no change occurred in the number of reported brucellosis cases in 2010. Cases were reported from 27 states and the District of Columbia. No cases were reported from any of the U.S. territories. California, Texas, Arizona, and Florida accounted for approximately half (56.5%) of the reported cases. The geographic distribution of cases differs from those reported in 2009 when California, Florida, Georgia, Michigan, and Texas accounted for 56.5% of the reported cases. During 2010, Michigan and Georgia reported 40% and 20% decreases in cases respectively. The reason for the decline is unknown. In 2010, the number of cases reported by Arizona increased by 33%.The reason for the increase is unknown. A total of 61.3% of cases with known ethnicity occurred among Hispanics; this proportion was similar to that reported in 2009 (61.5%).
Brucellosis is a zoonotic disease caused by Brucella species. The three common pathogenic Brucella species are B. abortus, B. melitensis, and B. suis. The incubation period varies from 5 to 60 days and up to 6 months. Human infections usually occur following occupational exposure (in laboratory or veterinary settings), consumption of contaminated animal products (unpasteurized milk or cheese), or hunting.
To prevent the risk of contracting brucellosis, consumers should avoid eating or drinking unpasteurized milk and milk products or products processed through unknown methods.More information on raw milk and pasteurization can be found at http://www.cdc.gov/foodsafety/rawmilk/raw-milk-questions-and-answers.html#history.
Hunters are at an elevated risk for brucellosis from handling the carcasses or meat of infected animals. The use of gloves, aprons, or other barriers is recommended when handling animal tissue. Wild game meat also should be thoroughly cooked before consumption. Laboratory staff members should only manipulate Brucella and/or unknown isolates using biosafety level 3 (BSL-3) containment equipment and facilities. Veterinarians are considered to be at risk because of possible exposure to infected animals' blood, excretion, or other fluids. In case of accidental needle-stick injury with RB-51 vaccine, post exposure prophylaxis and serologic testing are recommended.
B. abortus, B. melitensis and B. suis are included on the list of category B bioterrorism agents. In addition to reporting cases to CDC's Bacterial Special Pathogens Branch, all laboratory exposures should be reported to the Division of Select Agents and Toxins by completing and submitting a form 3 (Report of Theft, Loss or Release of Select Agents and Toxins) as required by regulation (7 CFR 331.19, 9 CFR 121.19, and 42 CFR 73.19). The form can be downloaded from: http://www.selectagents.gov/.
- CDC. Bioterrorism agents/diseases, by category. Atlanta, GA: US Department of Health and Human Services, CDC; 2006. Available at: http://www.bt.cdc.gov/agent/agentlist-category.asp#adef.
- CDC, National Institutes of Health. Biosafety in microbiological and biomedical laboratories (BMBL). 5th ed. Washington, DC: US Department of Health and Human Services, CDC, National Institutes of Health; 2007. Available at: http://www.cdc.gov/biosafety/publications/bmbl5/index.htm.
- CDC. Laboratory-acquired brucellosis—Indiana and Minnesota, 2006. MMWR 2008;57:39–42.
- National Select Agent Registry: http://www.selectagents.gov/.
Cholera
Cholera continues to be rare in the United States. It is most often acquired during travel in countries where Vibrio cholerae is circulating (1). Epidemic cholera emerged in Haiti in October 2010, and six cases in travelers to Haiti were reported in the United States toward the end of 2010. Of the 13 cholera infections reported in the United States in 2010, all were travel-associated; six related to travel in Haiti, and the other seven reported travel to other cholera-affected countries. Until the cholera epidemic in Hispaniola wanes, more associated cases are expected in the United States (2). Cholera remains a global threat to health, particularly in areas with poor access to improved water and sanitation, such as Haiti and sub-Saharan Africa (3,4).
- Steinberg EB, Greene KD, Bopp CA, Cameron DN, Wells JG, Mintz ED. Cholera in the United States, 1995–2000: trends at the end of the twentieth century. J Infect Dis 2001;184:799–802.
- Newton AE, Heiman KE, Schmitz A, et al. Cholera in United States associated with epidemic in Hispaniola. Emerg Infect Dis 2011;17:2166–8.
- Tappero J, Tauxe RV. Lessons learned during public health response to cholera epidemic in Haiti and the Dominican Republic. Emerg Infect Dis 2011;17:2087–93.
- Mintz ED, Guerrant RL. A lion in our village – the unconscionable tragedy of cholera in Africa. New Engl J Med 2009;360:1061–3.
Cryptosporidiosis
Cryptosporidiosis incidence remained relatively stable during 2008–2010, following a >3-fold increase during 2004–2007. Whether the changes in cryptosporidiosis reporting reflect a true change in cryptosporidiosis incidence, revision to the case definition as of 2009 (i.e., adding clinical criteria to the case definition), or changing diagnosis, testing, and reporting patterns is unclear. Concerns about rapid cartridge tests led to the revision of the 2011 cryptosporidiosis case definition (1).
Although cryptosporidiosis affects persons in all age groups, cases are most frequently reported in children aged 1–9 years. A substantial increase in transmission of Cryptosporidium in these children occurs during summer through early fall, coinciding with increased use of recreational water, which is a known risk factor for cryptosporidiosis. Good hygiene practices are essential to prevention, especially in high-risk settings. Persons also should avoid food and water that might be contaminated. Cryptosporidium oocysts can be detected routinely in treated recreational water (2). Contamination of, and the subsequent transmission through, recreational water is facilitated by the substantial number of Cryptosporidium oocysts that can be shed by a single person; the extended time that oocysts can be shed (3); the low infectious dose (4); and the chlorine tolerance of Cryptosporidium oocysts (5). The application of molecular epidemiology (i.e., genotyping and subtyping Cryptosporidium specimens) to clinical and environmental samples has demonstrated potential to expand our knowledge of Cryptosporidium epidemiology (6).
- CDC. Cryptosporidiosis 2011 case definition. Atlanta, GA: US Department of Health and Human Services, CDC; 2009. Available at http://www.cdc.gov/osels/ph_surveillance/nndss/casedef/cryptosporidiosis_current.htm.
- Shields JM, Gleim ER, Beach MJ. Prevalence of Cryptosporidium spp. and Giardia intestinalis in swimming pools, Atlanta, Georgia. Emerg Inf Dis 2008;14:948–50.
- Chappell CL, Okhuysen PC, Sterling CR, DuPont HL. Cryptosporidium parvum: intensity of infection and oocyst excretion patterns in healthy volunteers. J Infect Dis 1996;173:232–6.
- Chappell CL, Okhuysen PC, Langer-Curry R, et al. Cryptosporidium hominis: experimental challenge of healthy adults. Am J Trop Med Hyg 2006;75:851–7.
- Shields JM, Hill VR, Arrowood MJ, Beach MJ. Inactivation of Cryptosporidium parvum under chlorinated recreational water conditions. J Water Health 2008;6:513–20.
- Xiao L. Molecular epidemiology of cryptosporidiosis: an update. Exp Parasitol 2010;124:80–89.
Dengue
During 2010, dengue became a nationally notifiable disease for the first time. In the United States, disease occurs in three epidemiologic settings. Dengue is endemic in tropical and subtropical areas, including Puerto Rico, U.S. Virgin Islands, and U.S.-affiliated Pacific Islands. In the remainder of the country, the majority of cases occur among travelers returning from dengue-endemic countries worldwide, whereas sporadic outbreaks occur from importations of dengue virus (DENV) into areas where the mosquito vector exists, such as along the U.S.-Mexico border (1), Hawaii (2), and Florida.
Dengue cases reached historically high levels in Puerto Rico during a periodic epidemic that is common to the epidemiology of this disease (3) and mirrored a period of markedly increased disease activity in the region (4). Traveler-associated dengue remains a substantial problem throughout the United States, with 642 reported cases in 2010. In October 2010, state health authorities reported a cluster of dengue-like illnesses in six of 28 missionary workers from Nebraska and Georgia who recently returned after 7–11 days in Haiti. Dengue was confirmed by laboratory testing in seven persons, all of whom had symptoms of dengue, and five were hospitalized (5).Overall, based on information reported by 85.4% of affected persons, travel-associated dengue cases originated from the following countries: Puerto Rico (93), Dominican Republic (82), India (51), Haiti (38), Nicaragua (26), Venezuela (23), Philippines (22), Colombia (21), Honduras (21), Mexico (14), Costa Rica (13), Granada (11), Guatemala (10), Jamaica (10), Bangladesh (8), Indonesia (8), St Bart's (8), Brazil (7), St. Martin (7), El Salvador (6), Guyana (6),Thailand (6), Viet Nam (6), Ecuador (5), Martinique (5), and <5 cases each from Belize, Curacao, Tanzania, Trinidad & Tobago, Cambodia, Ghana, Guadalupe, Laos, Netherlands Antilles, Pakistan, Peru, St. Thomas, Barbados, Cayman Islands, Cuba, East Timor, Liberia, Malaysia, Nigeria, Sri Lanka, St. Kitts, and Vanuatu.
In Florida, dengue reemerged in 2009 (6,7) and during 2010, 58 locally acquired dengue cases were reported. All the cases were in Key West, except for two cases in more northern counties. Clinicians should be vigilant for dengue among travelers returning from international destinations where DENV transmission is endemic or likely to be endemic (8) and should consider dengue in the differential diagnosis for persons living in areas of the United States where the disease has occurred previously. Suspected cases of dengue should be reported to public health authorities.
- CDC. Dengue fever at the U.S.-Mexico border, 1995–1996. MMWR 1996;45:841–4.
- Effler PV, Pang L, Kitsutani P, et.al. Dengue fever, Hawaii, 2001–2002. Emerg Infect Dis 2005;11:742–9
- Sharp TM, Rivera A, Rodriquez-Acosta R, et al. An island-wide dengue epidemic – Puerto Rico, 2010. Am J trop Med Hyg 2011;85(suppl):400.
- http://new.paho.org/hg/index.php?option=com_content&task=view&id=3409&itemid=1091&lang=en.
- Sharp T, Pillai P, Hunsperger E, et. al. A cluster of dengue cases in American missionaries returning from Haiti, 2010. Am J Trop Med Hyg 2012; 86:16–22.
- CDC. Locally acquired dengue—Key West, Florida, 2009–2010. MMWR. 2010;59:77–81.
- Radke EG, Gregory CJ, Kintziger KW, et al. Dengue outbreak in Key West, Florida, USA, 2009. Emerg Infect Dis 2012; 18:135–7.
- Streit JA, Yang M, Cavanaugh JE, Polgreen PM.Upward trend in dengue incidence among hospitalized patients, United States. Emerg Infect Dis 2011; 17:914–6
Ehrlichiosis and Anaplasmosis
Four categories of ehrlichiosis and anaplasmosis were reportable during 2010: 1) Ehrlichia chaffeensis, 2) Ehrlichia ewingii, 3) Anaplasma phagocytophilum, and 4) Human ehrlichiosis/anaplasmosis - undetermined.
During 2010, infections caused by E. chaffeensis were reported primarily from the lower Midwest, the Southeast, and the east coast, reflecting the currently known range of the primary tick vector species (Amblyomma americanum). Infections caused by A. phagocytophilum were reported primarily from the upper Midwest and coastal New England, reflecting both the range of the primary tick vector species (Ixodes scapularis) and preferred animal hosts for tick feeding. A total of ten cases of ehrlichiosis resulting from E. ewingii infection were reported from Missouri, Tennessee, and Delaware. The category "Human ehrlichiosis/anaplasmosis - undetermined" includes cases for which a specific etiologic agent could not be identified using available serologic tests. The high numbers of "Human ehrlichiosis/anaplasmosis - undetermined" cases reported from certain northern states (1) continue to reflect state-specific classifications based on indistinguishable antigenic cross-reactivity or situations in which physicians ordered single or inappropriate tests (e.g., ordering only ehrlichiosis tests in a region where anaplasmosisis expected to predominate).
During 2010, cases attributed to E. chaffeensis declined almost 22% (944 to 740), whereas those cases attributed to A. phagocytophilum infection increased by 52% (1,161 to 1,761). Cumulative declines in ehrlichiosis were reported by states in all geographic divisions. Increases in anaplasmosis were primarily the result of increases in numbers of cases reported by Minnesota and Wisconsin, two states that reported more than two thirds of all cases of anaplasmosis in 2010. Changes in the numbers of reported cases might be the result of several factors, including ecological changes influencing vector tick populations and disease transmission, changes in diagnostic approaches that alter detection rates, or changes in surveillance and reporting.
Giardiasis
Giardia infection is the most common intestinal parasitic infection reported in the United States (1). The disease is thought to be highly underreported with an estimated 1.2 million infections occurring annually (2). Multiple factors might contribute to this under diagnosis. Giardiasis patients sometimes experience diarrhea intermittently, which might contribute to delayed diagnosis (3). Furthermore, shedding of the parasite is often intermittent, even if the symptoms are not (4). These observations form the basis for the recommendation that health-care providers test at least three stool samples collected on multiple daysr to rule out giardiasis as a cause of diarrhea (3).
Emerging evidence points to the existence of extra-intestinal and prolonged symptoms of giardiasis. A recent study of non-outbreak giardiasis cases reported that one third of patients experienced extra-intestinal symptoms, including joint pain, rash, and urinary symptoms; these symptoms often persisted more than 30 days (3). Other sequelae, including irritable bowel syndrome and fatigue, were strongly associated with a history of giardiasis 3 years after a large outbreak (5). Although these findings need further study, it is important to recognize that giardiasis symptoms can be highly variable and might cause considerable morbidity even after successful eradication of the parasite.
- Kappus KD, Lundgren RG, Jr., Juranek DD, Roberts JM, Spencer HC. Intestinal parasitism in the United States: update on a continuing problem. Am J Trop Med Hyg. 1994;50:705–13.
- Scallan E, Hoekstra RM, Angulo FJ, et al. Foodborne illness acquired in the United States—major pathogens. Emerg Infect Dis. 2011;17:7–15.
- Cantey PT, Roy S, Lee B, et al. Study of nonoutbreak giardiasis: novel findings and implications for research. Am J Med. 2011 [Epub ahead of print].
- Clinical and Laboratory Standards Institute. Procedures for the recovery and identification of parasites from the intestinal tract; approved guideline. CLSI document M28-A2 Second Edition ed. Wayne, PA: Clinical and Laboratory Standards Institute; 2005.
- Wensaas KA, Langeland N, Hanevik K, Morch K, Eide GE, Rortveit G. Irritable bowel syndrome and chronic fatigue 3 years after acute giardiasis: historic cohort study. Gut. 2011 [Epub ahead of print].
Hansen Disease (Leprosy)
In 2010, the number of reported cases of leprosy decreased by 4.8% from 2009. Cases were reported from 18 states. No cases were reported from any of the U.S. territories. Florida, Texas, California, and Hawaii accounted for 79.6% of the reported cases. Fifty percent of cases reported location of acquisition of infection as "unknown" and 24.5% did not provide a location; 25.5 % reported a location where the infection was acquired. Of those who reported a location, 72% were reported to have been acquired outside of the United States. All cases might not be newly diagnosed in the year surveillance data were collected. Providers are encouraged to contact the National Hansen Disease Program http://www.hrsa.gov/hansensdisease/ for guidance on clinical management and treatment.
Hantavirus Pulmonary Syndrome
In 2010, an imported case of hantavirus pulmonary syndrome was confirmed in a traveler from Brazil who experienced an acute illness in transit and was hospitalized in the United States. This case, along with a confirmed 2009 case of Seoul virus hemorrhagic fever and renal syndrome that occurred in a Wisconsin patient who recently traveled in China (1), serves as a reminder that hantaviral disease should be considered in patients with compatible clinical illness and a history of travel in countries endemic for hantavirus.
- Nielsen CF, Sethi V, Petroll AE, et al. Seoul virus infection in a Wisconsin patient with recent travel to China, March 2009: first documented case in the Midwestern United States. Am J Trop Med Hyg 2010; 83: 1266–1268.
Influenza-Associated Pediatric Mortality
In June 2004, the Council of State and Territorial Epidemiologists added influenza-associated pediatric mortality (i.e., among persons aged <18 years) to the list of conditions reportable to the National Notifiable Diseases Surveillance System. Cumulative year-to-date incidence is published each week in MMWR Table I for low-incidence nationally notifiable diseases. MMWR counts of deaths are by date of report in a calendar year and not by date of occurrence. This highlight reports 61 influenza-associated pediatric deaths reported to CDC during the year 2010. Thirty two of these deaths occurred in 2009 and were reported several months later in 2010. Twenty nine deaths occurred in 2010. This compares with a mean of 65 deaths (range: 43–90) per year that have been reported for seasonal influenza during the period 2005– 2009.
Of the 61 influenza-associated pediatric deaths reported to CDC during the year 2010, the majority of pediatric deaths (53) occurred from September 2009 to June 2010. Of the 61 influenza-associated pediatric deaths reported, 56 (92%) were associated with influenza A viruses, four (7%) with influenza B viruses, and one (1%) with an untyped influenza virus. Of the 56 influenza A viruses, the subtype was determined for 39 (70%): 35 were 2009 A (H1N1) pdm09, one was seasonal A(H1N1), and three were A(H3N2) viruses.
In 2010, the median age at the time of death was 8.2 years (range: 33 days – 17.9 years). This is higher than that observed (4 – 7.5 years) before the 2009 A (H1N1) pandemic for the years 2006–2008 and January – April 2009 but lower than that seen during May 2009 – December 2009 after A (H1N1)pdm09 viruses began to circulate (9.3 years). Seven children (11%) who died were aged <6 months; 8 (13%) were aged 6–23 months; 7 (11%) were aged 24–59 months; 15 (26%) were aged 5–8years; 8 (13%) were aged 9–12 years; and the remaining 16 (26%) were aged 13–17 years. Information on death location was available for 59 of 61 children: 36 (61%) children died after being admitted to the hospital; 14 (24%) died in the emergency room; and nine (15%) died outside the hospital. Information on underlying or chronic medical condition was reported for 57 children: 36 (63%) children had one or more underlying or chronic medical conditions placing them at increased risk for influenza-associated complications (1). The most commonly reported chronic medical conditions were developmental delay (18), asthma (11), and seizure disorder (10). Of 28 children who had specimens collected for bacterial culture from normally sterile sites, test results for 14 (50%) resulted in positive cultures. Staphylococcus aureus was detected in 8 of 14 (57%) of the positive cultures; four were methicillin-resistant, three were methicillin-sensitive, and one had unknown sensitivity. The remaining specimens were positive for Pseudomonas aeruginosa, Group A Streptococcus, Streptococcus pneumoniae, Acinetobacter, Enterococcus, and Hemophilus influenzae, not type B. Of the 40 children aged ≥6 months for whom seasonal vaccination status was known, 7 (18%) were vaccinated against influenza as recommended by the Advisory Committee on Immunization Practices for 2010 (1). Continued surveillance of influenza-associated mortality is important to monitor both the effects of seasonal and novel influenza and the effect of interventions in children.
Listeriosis
Listeria monocytogenes infection (listeriosis) causes rare but severe invasive disease (e.g., sepsis, meningitis, fetal death). Listeriosis has been nationally notifiable since 2000. Listeriosis is primarily acquired through contaminated food and occurs most frequently among older adults, persons who are immunocompromised, and pregnant women. Pregnancy-associated listeriosis is usually a mild illness in women but is often associated with fetal death or severe neonatal disease. During 2010, most cases occurred among persons aged ≥65 years.
Molecular subtyping of L. monocytogenes isolates and sharing that information through the National Molecular Subtyping Network for Foodborne Disease Surveillance (PulseNet) has enhanced the ability of public health officials to detect and investigate outbreaks (1). Outbreaks in 2010 were linked to pre-cut celery served in chicken salad, hogs head cheese (2), and Mexican-style cheese made from pasteurized milk.
CDC recommends that all clinical isolates be submitted routinely to a state public health laboratory for molecular subtyping using pulsed-field gel electrophoresis (PFGE). Also, all persons with listeriosis should be interviewed promptly by a public health official using the standard Listeria Initiative case form, available in English and Spanish at http://www.cdc.gov/listeria_surveillance.html. Rapid analysis of molecular and epidemiologic data allows for timely identification and removal of contaminated food during outbreaks.
- http://www.cdc.gov/pulsenet/
- CDC. Outbreak of invasive listeriosis associated with the consumption of hog head cheese— Louisiana, 2010. MMWR 2011;60:401–05.
Lyme disease
In North America, Lyme disease is caused by Borrelia burgdorferi sensu stricto, a spirochete transmitted by certain species of Ixodes ticks. Manifestations of infection include erythema migrans, arthritis, carditis, and neurologic deficits.Human illness occurs in two major foci, one in the Northeastern and mid-Atlantic states, and one in the North-central states. Additional endemic areas occur along the Pacific coast. Effective January 2008, the national surveillance case definition was revised to include reporting of probable cases and to update laboratory criteria to reflect current testing practices.
During 2006–2009, the total number of Lyme disease cases reported to CDC increased each year, albeit with no consistent trend across states. In 2010, however, confirmed cases decreased 25% and probable cases decreased 11% as compared with 2009. In addition, regional trends were apparent. Among 12 high-incidence states in the Northeastern and mid-Atlantic regions, all but Virginia reported a decrease in confirmed cases. Conversely, the number of confirmed cases increased >20% in Minnesota and Wisconsin. The reasons for these patterns are unknown. Given the observed regional consistencies, surveillance artifact is an unlikely explanation.
Measles
Measles was declared eliminated from the United States in 2000. Since then, elimination has been maintained through high population immunity along with early detection of cases and rapid public health intervention (including contact tracing, isolation, and vaccination) (1,2). Nonetheless, because measles remains endemic in much of the world, importations continue to result in sporadic cases and outbreaks in the United States, which can be costly to control (2). In recent years, the majority (87%) of measles cases in 2010 were import associated (3). Measles was classified as internationally imported in 39 cases, 24 of which were in U.S. residents exposed while traveling abroad, and 15 of which were among international visitors. Source countries for imported cases included India (5 cases), Italy (5 cases), Ethiopia (4 cases), South Africa (3 cases), Germany, Ireland, Philippines, Switzerland, and Zambia (2 cases each), Austria, Belgium, Canada, France, Indonesia, Kuwait, Malawi, Morocco, Ukraine, United Kingdom, and Vietnam (1 case each). For the 14 internationally imported cases for which the genotype is known, genotype B3 accounted for 4 cases (2 from Ethiopia, 1 from Zambia, 1 from Germany), 3 cases were D4 (1 from India, 1 from Italy, 1 from Switzerland), 4 cases were D8 (all from India), 1 case was D9 (Indonesia), and 2 were H1 (1 from Canada and 1 from Vietnam).
Thirty-three states reported no measles cases in 2010; 10 states reported fewer than 3 cases. Four outbreaks (defined as 3 or more epidemiologically linked cases) occurred in 2010. Outbreaks were small, ranging in size from 3 to 4 cases (median: 3). Of the 47 cases that occurred in U.S. residents, 41 (87%) were unvaccinated or had undocumented vaccination status, 2 (4%) had received 1 dose of MMR vaccine, and 4 (9%) had received 2 doses of MMR vaccine. Of the 41 unvaccinated U.S. residents with measles in 2010, 36% (17/47) held personal or religious beliefs opposing vaccination. Another 13% (6/47) were missed opportunities in young U.S. resident travelers who should have been vaccinated on schedule and before their international travel (2).
- Hutchins SS, Bellini W, Coronado V, et al. Population immunity to measles in the United States. J Infect Dis 2004;189(Suppl 1):S91–97.1.
- CDC. Measles, mumps, and rubella–vaccine use and strategies for elimination of measles, rubella, and congenital rubella syndrome and control of mumps: Recommendations of the Advisory Committee on Immunization Practices (ACIP). MMWR 1998;47:1–57.
- Parker AA, Staggs W, Dayan G, et al. Implications of a 2005 measles outbreak in Indiana for sustained elimination of measles in the United States, N Engl J Med 2006; 355:447–55.
- Council of State and Territorial Epidemiologists. Revision of measles, rubella, and congenital syndrome case classification as part of elimination goals in the United States. Position statement 2006-ID-16. Available at http://www.cste.org/PS/2006pdfs/PSFINAL2006/06-ID-16FINAL.pdf.
Mumps
The majority (66%) of mumps cases reported in the United States during 2010 continued to be associated with a large outbreak focused in the Northeastern states (primarily New York and New Jersey) that began in New York in June 2009 (1). A total of 1,724 cases occurred January 1, 2010 through June 27, 2010.The outbreak primarily affected adolescent boys in Orthodox Jewish communities. Fewer than 3% of the cases associated with this outbreak occurred among persons outside this community.The majority (65%) of these cases occurred among males and 19% were among adolescents aged 13–17 years. Among the patients for whom vaccination status was reported, 90% had received at least 1 dose of mumps-containing vaccine, and 74% had received 2 doses. This was the largest mumps outbreak to occur in the United States since 2006 (2).
- CDC. Update: mumps outbreak—New York and New Jersey, June 2009–January 2010. MMWR 2010; 59(5):125–30.
- Dayan G, Quinlisk P, et al. Recent resurgence of mumps in the United States. New Engl J Med 2008;358:1580–9.
Novel Influenza A
In 2007, the Council of State and Territorial Epidemiologists added novel influenza A virus infection to the list of conditions reportable to the National Notifiable Diseases Surveillance System (1). Novel influenza A virus infections are human infections with influenza A viruses that are different from currently circulating human influenza A (H1) and A (H3) viruses. These viruses include those that are subtyped as non-human in origin and those that cannot be subtyped with standard methods and reagents used for currently circulating influenza viruses.Non-human influenza virus infections rarely result in human-to-human transmission, but the implications of sustained ongoing transmission between humans is potentially severe; therefore prompt and thorough identification and investigation of these sporadic human infections with non-human influenza viruses are needed to reduce the risk for sustained transmission (2).
In 2010, four cases of human infection with novel influenza A viruses were reported from three states: (Minnesota [2], Pennsylvania, and Wisconsin) [3]).These four cases were sporadic cases of human infection with swine-origin influenza A (H3N2) viruses. These viruses are similar to those swine influenza A (H3N2) viruses that have been circulating among U.S. pigs since 1998 (4) and ten other swine-origin influenza A (H3N2) viruses identified from previous human infections since 2009 (2).One case occurred in September (Wisconsin), one case in October (Pennsylvania), and two cases in November (Minnesota). Two of the four patients were hospitalized; all four recovered fully from their illness.Three of the four affected persons had contact with or had a likely exposure to swine and the fourth likely acquired infection from one of the persons with a confirmed case. The Wisconsin patient reported contact with pigs in the week preceding symptom onset and no direct contact with pigs was identified in the Pennsylvania case; however, the patient lives in an area close to pig farms. The two cases from Minnesota occurred in a father and child. The father had direct swine exposure 6 days before illness onset. The child had no history of recent swine exposure and her symptom onset occurred 3 days after her father's symptom onset, suggesting that she acquired the infection from exposure to her father during his illness. A nasopharyngeal swab was collected from the child and initially tested negative; her infection with swine-origin influenza A (H3N2) virus was confirmed several weeks later by serologic testing. An additional three members in the same household also had ILI during the same period, but serologic results were negative.
Transmission of swine-origin influenza A viruses to humans usually occurs among people in direct contact with pigs or in those who have visited places where pigs were present (e.g., agricultural fairs, farms, and petting zoos). CDC conducts surveillance for human infections with novel influenza A viruses year-round and carries out epidemiologic investigations on each case.Surveillance for human infections with novel influenza A viruses is essential; early identification and investigation of these cases are critical to evaluate the extent of outbreaks and the potential for human-to-human transmission.
- Council of State and Territorial Epidemiologists. National reporting for initial detections of novel influenza A viruses. Position statement 07-ID01. Available at http://www.cste.org/PS/2007ps/2007psfinal/ID/07-ID-06.pdf.
- CDC. Swine-origin influenza A (H3N2) virus infection in two children—Indiana and Pennsylvania, July–August 2011.MMWR2011;60:1213–5
- CDC. Update: influenza activity—United States, 2010–11 season, and composition of the 2011–12 influenza vaccine. MMWR 2011;60:705–12
- Vincent AL, MA W, Lager KM, Janke BH, Richt JA.Swine influenza viruses: a North American perspective. In: Maramorosch K, Slatkin AJ, Murphy FA, eds. Advances in virus research, Vol 72. Burlington:Academic Press; 2008:127–54
Psittacosis
Psittacosis is a respiratory infection resulting from exposure to the bacterium Chlamydophila (Chlamydia) psittaci through the feces, respiratory secretions, plumage, or tissues of infected birds. Persons with psittacosis generally have high fever, cough, and malaise within 5–14 days of exposure. A minority of cases might progress to severe pneumonia with respiratory compromise. The Council of State and Territorial Epidemiologists position statement and case definition for psittacosis was revised in June 2009 to include more stringent laboratory criteria for confirmed and probable cases. In 2010, a total of four psittacosis cases were reported, compared with an average of 16 (range: 9–25) cases reported during the period 2000– 2009. Additional information about psittacosis and case-reporting tools can be found at http://www.nasphv.org/documentsCompendiaPsittacosis.html.
Q fever
During 2010, both acute and chronic Q fever infections were considered notifiable. Among the 131 cases reported in 2010, 106 were acute infection, and 25 were chronic Q fever. Cases remained distributed across the United States, consistent with Q fever being enzootic in ruminants (sheep, goats, and cattle) throughout the country.
During 2010, the number of cases of Q fever reported increased 16% over those reported during the previous year. Although few human cases are reported annually, Q fever is believed to be substantially underreported because of its nonspecific presentation and the subsequent failure of physicians to suspect infection and request appropriate diagnostic tests.
Rabies
During 2010, two cases of human rabies were reported in the United States: an imported case reported from Louisiana and a domestically acquired case reported from Wisconsin. The Louisiana case originated from Mexico, and is the second imported human rabies case not associated with a canine rabies virus variant; it is also the first imported case of a human infected with the vampire bat rabies virus variant in the United States (1). The human rabies case reported from Wisconsin was associated with a bat (Perimyotis subflavus) rabies virus variant (2); in each incident, the patient died (1,2).
Each year, specimens from more than 100,000 animals are submitted for rabies diagnosis in the United States. However, during 2010, specimens for rabies diagnosis declined by more than 12% compared with 2009. The national surveillance network for rabies consists of more than 125 laboratories (state health, state agriculture, and university veterinary pathology laboratories) that perform primary diagnosis. This network is supported by local health departments, animal control services, law enforcement, private veterinarians, and the general public to ensure animals are appropriately captured, euthanized, and submitted for testing. The rabies surveillance system is robust because of the role of rabies diagnosis in animals to determine human postexposure prophylaxis decisions, yet it is susceptible to fluctuations in local policies and budgetary restrictions that affect the collection, submission, and testing of animals. (3)
Despite the overall decline in submissions and reported rabid animals during 2010, some notable epizootics occurred. Most notably a sizeable rabies epizootic in raccoons occurred around Central Park in New York City, accounting for a 400% increase in the number of reported rabid animals in the city, compared with 2009.
- CDC. Human rabies from exposure to a vampire bat in Mexico— Louisiana, 2010. MMWR 2011; 60(31):1050–2.
- CDC. Human rabies—Wisconsin, 2010. MMWR 2011;60(34):1164–6.
- Blanton JD, Palmer D, Dyer J, Rupprecht CE. Rabies surveillance in the United States during 2010. J Am Vet Med Assoc. 2011;239(6):773–83.
Salmonellosis
During 2010, as in previous years, the age group with the highest incidence of salmonellosis was children aged <5 years.Salmonellosis is reported most frequently in late summer and early fall; in 2010, this seasonality was evident, with the highest number of reports in August, September, and October. Salmonella infections have not declined during the past 10 years.In 2010, the incidence was nearly three times the 2010 national health objective target (6.8 infections per 100,000 population) (1).
In the United States, Salmonella causes an estimated 1.2 million illnesses annually, approximately 1 million of which are transmitted by food consumed in the United States (2). Salmonella can contaminate several foods, and different serotypes tend to have different animal reservoirs and food sources, making control challenging. During 2010, a national outbreak of Salmonella serotype Enteritidis infections led to a massive recall of approximately 500 million eggs (3,4). This occurred just before implementation of new egg regulations, implementation of which could have prevented the outbreak and the associated recall (5).Other multistate outbreaks of Salmonella infection were linked to frozen rodents used as reptile feed (serotype I, 4,[5], 12:i:-) and to the consumption of salami products made with contaminated imported black and red pepper (serotype Montevideo), alfalfa sprouts (serotypes Newport and I, 4,[5],12:i:-), and a commercially distributed frozen chicken and rice entrée (serotype Chester).
Public health actions to prevent and control Salmonella infections are based on serotype characterization; in 2005, the Council of State and Territorial Epidemiologists adopted a position statement calling for serotype-specific reporting of laboratory-confirmed salmonellosis cases (6).Infections with certain Salmonella serotypes are more likely to be invasive and to lead to poor outcomes than infections with other serotypes (7).
- US Department of Health and Human Services. Healthy People 2010 (midcourse review). Washington, DC: US Department of Health and Human Services; 2000.
- Scallan E, Hoekstra Rm, Angulo FJ, et al. Foodborne illness acquired in the United States— major pathogens. Emerg Infect Dis 2011;7–15.
- Final multistate outbreak investigation update (December 2, 2010) available at http://www.cdc.gov/salmonella/enteritidis/index.html
- Kuehn BM. Salmonella cases traced to egg producers: findings trigger recall of more than 500 million eggs. JAMA. 2010;304(12):1316.
- Food and Drug Administration, US Department of Agriculture, Food Safety and Inspection Service. Prevention of Salmonella Enteritidis in shell eggs during production, storage, and transportation. Final rule. Federal Register 2009;74:33029–101.
- Council of State and Territorial Epidemiologists. Position statement 05-ID-09. Serotype specific national reporting for salmonellosis. Atlanta, GA: Council of State and Territorial Epidemiologists, 2005. Available at http://www.cste.org/PS/2005pdf/final2005/05-ID-09final.pdf.
- Jones TF, Ingram LA, Cieslak PR, et al. Salmonellosis outcomes differ substantially by serotype. J Infect Dis 2008;198:109–14.
Shigellosis
Shigella sonnei infections continue to account for >75% of shigellosis in the United States (1). Most cases occur among young children, and large day care-associated outbreaks are common and often difficult to control (2). Some cases of shigellosis are acquired during international travel (3,4). In addition to spreading from one person to another, Shigellae can be transmitted through contaminated foods, sexual contact, and water used for drinking or recreational purposes (1). Resistance to ampicillin and trimethoprim-sulfamethoxazole among S. sonnei strains in the United States remains common (5). Shigellosis does not demonstrate marked seasonality, likely reflecting the importance of person-to-person transmission. Public health actions to prevent and control Shigella infections are based on species characterization; in 2005, the Council of State and Territorial Epidemiologists adopted a position statement calling for species-specific reporting of laboratory-confirmed shigellosis cases (6).
- Gupta A, Polyak CS, Bishop RD, Sobel J, Mintz ED. Laboratory confirmed shigellosis in the United States, 1989–2002: epidemiologic trends and patterns. Clin Infect Dis 2004;38:1372–7.
- Arvelo W, Hinkle J, Nguyen TA, et al. Transmission risk factors and treatment of pediatric shigellosis during a large daycare center-associated outbreak of multidrug resistant Shigella sonnei. Pediatr Infect Dis J 2009;11:976–80
- Ram PK, Crump JA, Gupta SK, Miller MA, Mintz, ED. Review article: part II. Analysis of data gaps pertaining to Shigella infections in low and medium human development index countries, 1984–2005. Epidemiol Infect 2008;136:577–603.
- Gupta SK, Strockbine N, Omondi M, Hise K, Fair MA, Mintz ED. Short report: emergence of Shiga toxin 1 genes within Shigella dysenteriae Type 4 isolates from travelers returning from the island of Hispanola. Am J Trop Med Hyg 2007;76:1163–5.
- CDC. National Antimicrobial Resistance Monitoring System for enteric bacteria (NARMS): Human isolates final report, 2006. Atlanta, GA: US Department of Health and Human Services, CDC; 2009. Available at http://www.cdc.gov/narms.
- Council of State and Territorial Epidemiologists. Position statement 05-ID-08. Serotype specific national reporting for shigellosis. Atlanta, GA: Council of State and Territorial Epidemiologists, 2005. Available at http://www.cste.org/PS/2005pdf/final2005/05-ID-08final.pdf.
Spotted Fever Rickettsiosis (including Rocky Mountain Spotted Fever)
Because serologic tests commonly used to diagnose Rocky Mountain spotted fever (RMSF) exhibit cross-reactivity between spotted fever rickettsial pathogens, some cases reported as RMSF might actually be disease caused by other spotted fever rickettsial infections, and therefore are more correctly referred to as spotted fever rickettsiosis (SFR). The Council of State and Territorial Epidemiologists approved this change at their 2009 annual meeting. The change became effective in January 2010 (1).
During 2010, SFR cases increased 9% over those reported in 2009 (1,815 to 1,985). Cases reported in 2010 were distributed across the United States, reflecting the endemic status of SFR and the widespread ranges of the primary tick vectors (primarily Dermacentor variabilis and Dermacentor andersoni) responsible for transmission. SFR cases associated with infections caused by Rhipicephalus sanguineus, first reported in 2004 (2), continued to be reported from Arizona during 2010.
Although SFR case reports increased more than 400% from 2000 through 2008 (495 to 2,563), reported case totals in 2009 and 2010 have been 29% and 23% lower. Reporting fluctuations might be the result of several factors, including ecological changes influencing vector tick populations and disease transmission, changes in diagnostic approaches that alter detection rates, or changes in surveillance and reporting practices.
- Council of State and Territorial Epidemiologists. Revision of the surveillance case definitions for Spotted Fever Rickettsiosis (including Rocky Mountain spotted fever). Position statement 09-ID-16. Atlanta, GA: Council of State and Territorial Epidemiologists; 2009. Available at http://www.cste.org/ps2009/09-ID-16.pdf.
- L Demma, Traeger M, Nicholson W, et al. Rocky Mountain spotted fever from an unexpected tick vector in Arizona. New Engl J Med 2005;353:587–94.
Shiga Toxin-Producing Escherichia coli (STEC)
In 2010, more Shiga toxin-producing Escherichia coli (STEC) infections were reported than in 2009. In the Foodborne Diseases Active Surveillance Network (FoodNet), which conducts active surveillance for STEC infection, the reported incidence of STEC O157 infection decreased and incidence of STEC non-O157 infection increased. Development of post-diarrheal hemolytic uremic syndrome (HUS), a severe complication of STEC infection, is most strongly associated with STEC O157. STEC non-O157 a diverse group that varies in virulence, comprises approximately 50 other serogroups. The national Healthy People 2010 target for STEC O157 infection (≤1.0 case per 100,000 population as measured in FoodNet) was met in both 2009 and 2010; the Healthy People 2020 target is 0.6 cases per 100,000 population (1).
Escherichia coli O157:H7 infection has been nationally notifiable since 1994 (2). Shiga toxin-producing E. coli (STEC) infection caused by any serotype was made nationally notifiable in 2001, originally using the nomenclature enterohemorrhagic E. coli (EHEC) and changing to STEC in 2006 (3). Public health actions to monitor, prevent, and control STEC infections are based on serogroup characterization. Increased use of assays for the detection of Shiga toxins in clinical laboratories in recent years has led to increased reporting of STEC non-O157 infection (4). Stool specimens from patients with community-acquired diarrhea submitted to clinical laboratories should be tested routinely both by culture for STEC O157 and by an assay that detects Shiga toxins (5). Detection of Shiga toxin alone is inadequate for outbreak detection; characterizing STEC isolates by serogroup and by pulsed-field gel electrophoresis pattern is important to detect, investigate, and control outbreaks.
- CDC. Incidence and trends of infection with pathogens transmitted commonly through food—Foodborne Diseases Active Surveillance Network, 10 U.S. Sites, 1996–2010. MMWR 2011;60(22);749–55.
- Mead PS, Griffin PM. Escherichia coli O157:H7. Lancet 1998;352:1207–12.
- Council of State and Territorial Epidemiologists. Revision of the Enterohemorrhagic Escherichia coli (EHEC) condition name to Shiga toxin-producing Escherichia coli (STEC) and adoption of serotype specific national reporting for STEC. Position statement 05-ID-07. Atlanta, GA: Council of State and Territorial Epidemiologists; 2005. Available at http://www.cste.org/position%20statements/searchbyyear2005.asp.
- Hoefer, D., Hurd, S. Laboratory practices for the identification of Shiga toxin–producing Escherichia coli in the United States, FoodNet Sites, 2007. Foodborne Pathogens and Disease 8(4): 555–60.
- CDC. Recommendations for diagnosis of Shiga toxin-producing Escherichia coli infections by clinical laboratories, 2009. MMWR 2009;58(No.RR12):1–14.
Congenital Syphilis
Rates of congenital syphilis decreased during 2010 for the second consecutive year. During 2008–2010, rates decreased 16%. This decrease parallels a similar rate decrease in primary and secondary syphilis among women during 2008–2010. However, rates of congenital syphilis among black and Hispanic women were 12.3 and 3.1 times, respectively, the rate among white women during 2010 (1).
- CDC. Sexually Transmitted Disease Surveillance, 2010. Atlanta: U.S. Department of Health and Human Services; 2011.
Primary and Secondary Syphilis
Rates of primary and secondary syphilis reached historic lows in 2000, but increased each year during 2001–2009. During 2010, overall rates of primary and secondary syphilis decreased for the first time since 2000 (1). Rates among women increased during 2004–2008 but decreased 27% during 2008–2010. Rates among men, however, continued to increase, but only by 1% during 2009–2010; this was the tenth consecutive year of increasing rates among men. Rates among men were highest among those aged 20–24 years, a marked shift from 2005, when rates were highest among men aged 35–39 years. In particular, rates among black and Hispanic men aged 20–24 years (92.5 cases and 19.8 cases per 100,000 population, respectively) were 15 times and 3 times the rate among white men aged 20–24 years (6.2 cases per 100,000 population), respectively. During 2006–2010, rates among black men aged 20–24 years increased 134%; the magnitude of this rate increase (53 cases per 100,000 population) was the greatest of any sex, age group, or race/ethnicity group (1). Recent analyses indicate that these trends of increasing primary and secondary syphilis occur mostly among young men having sex with men. (1,2)
- CDC. Sexually Transmitted Disease Surveillance, 2010. Atlanta: U.S. Department of Health and Human Services; 2011.
- Su JR, Beltrami JF, Zaidi AA, Weinstock HS. Primary and secondary syphilis among black and Hispanic men who have sex with men: case report data from 27 states. Ann Int Med 2011;155:145–51.
Trichinellosis
No outbreaks were reported in 2010, that was the first year since 2004 that no trichinellosis outbreaks were reported (1–3). Wild game meat was reported as the source of Trichinella infection in two cases; one person consumed wild boar and another consumed both bear and raccoon meat. Pork was the suspected source in four cases; one person reported consuming store-bought pork, one person likely acquired the infection from pork consumed during international travel, and two persons reported consuming pork frequently either at home or at restaurants. No information on source of infection was given for one case.
In May 2011, USDA lowered its recommended cooking temperature of whole cuts of pork from 160°F to 145°F. Ground pork should still be cooked to 160°F (4). Both whole cuts and ground game meat should still be cooked to 160°F (5). National trichinellosis surveillance will continue to monitor for changes in incidence following this new recommendation.
- Kennedy ED, Hall RL, Montgomery SP, Pyburn DG, Jones JL. Trichinellosis surveillance—United States, 2002–2007. In: Surveillance Summaries, December 4, 2009. MMWR 2009;58 (No. SS-9).
- CDC. Summary of Notifiable Diseases — United States, 2008. MMWR 2010;57(No. 54).
- CDC. Summary of Notifiable Diseases — United States, 2009. MMWR 2011;58(No. 53).
- U.S. Department of Agriculture (USDA), 2011. USDA Revises Recommended Cooking Temperature for All Whole Cuts of Meat, Including Pork, to 145 °F. USDA News & Events. Published May 24, 2011. Accessed November 2, 2011. http://www.fsis.usda.gov/News_&_Events/NR_052411_01/index.asp.
- U.S. Department of Agriculture (USDA), 2011. Fact Sheets. Meat preparation: game from farm to table. Washington, D.C. Last updated May 27, 2011. Accessed November 2, 2011.
Typhoid Fever
Typhoid fever is rare in the United States, and approximately 75% of cases are associated with international travel (1). The risk of infection is highest for international travelers visiting friends and relatives in countries where typhoid fever is endemic, perhaps because they are less likely than other travelers to seek pre-travel vaccination and to observe strict safe water and food practices.The risk also is higher for travelers who visit the most highly endemic areas, such as the Indian subcontinent, even for a short time (2). From 1960 through 1999, a total of 60 outbreaks of typhoid fever were reported in the United States (3). The first domestically acquired outbreak of typhoid fever in over a decade occurred in 2010. Twelve cases were identified, and illness was linked to consumption of imported frozen mamey fruit. Mamey from the same producer in Guatemala also was implicated in the previous domestic typhoid fever outbreak, which occurred in 1999 (4).
- Lynch MF, Blanton EM, Bulens S, et al. Typhoid fever in the United States, 1999–2006. JAMA 2009;302:898–9
- Steinberg EB, Bishop RB, Dempsey AF, et al. Typhoid fever in travelers: who should be targeted for prevention? Clin Infect Dis 2004;39:186–91.
- Outbreaks of typhoid fever in the United States, 1960–1999. Epidemiol Infect 2003;130:13–21.
- Katz D, Cruz MA, Trepka MJ, Suarez JA, Fiorella PD, Hammond RM. An outbreak of typhoid fever in Florida associated with an imported frozen fruit. Clin Infect Dis 2002;186:234–9.
Varicella
Varicella was added to the nationally notifiable diseases list in 2003. Surveillance for varicella is conducted through the National Notifiable Disease Surveillance System (NNDSS). The number of states reporting varicella data to NNDSS has increased over time. In 2010, a total of 37 states and DC reported varicella cases to CDC through NNDSS, including limited varicella-specific data (e.g., vaccination status, disease severity). Information on vaccination status and disease severity was reported for 32% and 11% of the varicella cases, respectively. Sixty percent of the varicella cases that had information on vaccination history and disease severity had received varicella vaccine and 50% of those reported mild disease (<50 lesions). Collecting standard demographic, clinical, and epidemiologic data, including information on disease severity (e.g., number of lesions, hospitalizations), vaccination status (e.g., whether received varicella-containing vaccine, number of doses), and age of patients, is needed to update varicella vaccination policy.
Vibriosis
Vibriosis became a nationally notifiable condition in 2007 (1). California, Florida, and Texas report the largest numbers of cases.Vibrio parahaemolyticus, vulnificus, and alginolyticus account for approximately 75% of reported infections. In 2010, a cluster of toxigenic (producing cholera toxin) V. mimicus infections was associated with consumption of cooked crayfish (2).
- Council of State and Territorial Epidemiologists. National reporting for non-cholera Vibrio infections (vibriosis). Position statement 06-ID-05. Atlanta, GA: Council of State and Territorial Epidemiologists; 2006.
- CDC. Vibrio mimicus infection from consuming crayfish—Spokane, Washington 2010. MMWR; 59(42):1374.
Viral Hemorrhagic Fever
Viral hemorrhagic fever infections became reportable to the National Notifiable Diseases Surveillance System for the first time in 2010. These included infections with Ebola virus, Marburg virus, Crimean-Congo hemorrhagic fever virus, Lassa virus, Lujo virus, and the New World arenaviruses (Guaranito, Machupo, Junin, and Sabia). None of these viruses are endemic in the United States. In January 2010, a case of Lassa virus infection was confirmed in a patient who had recently traveled to Liberia, where the virus is endemic (1). The patient developed clinical illness in Liberia and sought medical attention upon return to the United States. No secondary cases were identified. This patient represents the sixth known occurrence of imported Lassa fever in the United States.
- Amorosa V, MacNeil A, McConnell R, et al. Imported lassa fever, Pennsylvania, USA, 2010. Emerg Infect Dis 2010; 16: 1598—1600.
PART 1
Summaries of Notifiable Diseases in the United States, 2010
Abbreviations and Symbols Used in Tables
U Data not available.
N Not reportable (i.e., report of disease is not required in that jurisdiction).
— No reported cases.
Notes: Rates <0.01 after rounding are listed as 0.
Data in the MMWR Summary of Notifiable Diseases — United States, 2010 might not match data in other CDC surveillance reports because of differences in the timing of reports, the source of the data, the use of different case definitions and print criteria.
|
TABLE 1. Reported cases of notifiable diseases,* by month — United States, 2010 |
||||||||||||||
|---|---|---|---|---|---|---|---|---|---|---|---|---|---|---|
|
Name |
Jan. |
Feb. |
Mar. |
Apr. |
May |
June |
July |
Aug. |
Sept. |
Oct. |
Nov. |
Dec. |
Month not stated |
Total |
|
Arboviral diseases† |
||||||||||||||
|
California serogroup virus |
||||||||||||||
|
neuroinvasive |
— |
— |
1 |
— |
— |
3 |
16 |
22 |
16 |
9 |
1 |
— |
— |
68 |
|
nonneuroinvasive |
— |
— |
— |
— |
— |
— |
2 |
4 |
1 |
— |
— |
— |
— |
7 |
|
Eastern equine encephalitis virus |
— |
— |
— |
— |
— |
1 |
5 |
4 |
— |
— |
— |
— |
— |
10 |
|
Powassan virus |
— |
— |
— |
1 |
2 |
1 |
1 |
— |
— |
1 |
1 |
1 |
— |
8 |
|
St. Louis encephalitis virus |
||||||||||||||
|
neuroinvasive |
— |
— |
— |
— |
— |
1 |
1 |
1 |
4 |
1 |
— |
— |
— |
8 |
|
nonneuroinvasive |
— |
— |
— |
— |
— |
— |
— |
— |
1 |
— |
1 |
— |
— |
2 |
|
West Nile virus |
||||||||||||||
|
neuroinvasive |
1 |
— |
— |
— |
— |
13 |
79 |
218 |
246 |
65 |
5 |
2 |
— |
629 |
|
nonneuroinvasive |
— |
— |
1 |
2 |
4 |
17 |
80 |
161 |
106 |
20 |
1 |
— |
— |
392 |
|
Botulism, total |
6 |
6 |
6 |
10 |
9 |
7 |
8 |
11 |
13 |
13 |
5 |
18 |
— |
112 |
|
foodborne |
1 |
— |
1 |
2 |
1 |
— |
— |
— |
1 |
— |
— |
1 |
— |
7 |
|
infant |
5 |
5 |
5 |
7 |
5 |
5 |
8 |
7 |
9 |
8 |
4 |
12 |
— |
80 |
|
other (wound and unspecified) |
— |
1 |
— |
1 |
3 |
2 |
— |
4 |
3 |
5 |
1 |
5 |
— |
25 |
|
Brucellosis |
2 |
8 |
5 |
11 |
15 |
14 |
17 |
10 |
8 |
5 |
4 |
16 |
— |
115 |
|
Chancroid§ |
9 |
1 |
2 |
3 |
3 |
— |
2 |
— |
1 |
1 |
2 |
— |
— |
24 |
|
Chlamydia trachomatis infection§ |
93,152 |
98,253 |
101,265 |
97,729 |
128,123 |
96,251 |
123,111 |
102,644 |
101,825 |
129,882 |
98,268 |
137,390 |
— |
1,307,893 |
|
Cholera |
— |
— |
1 |
1 |
— |
1 |
3 |
— |
— |
— |
1 |
6 |
— |
13 |
|
Cryptosporidiosis, total |
465 |
383 |
419 |
494 |
636 |
590 |
1,207 |
1,526 |
1,252 |
906 |
444 |
622 |
— |
8,944 |
|
confirmed |
458 |
379 |
411 |
483 |
616 |
571 |
1,150 |
1,354 |
1,151 |
826 |
413 |
563 |
— |
8,375 |
|
probable |
7 |
4 |
8 |
11 |
20 |
19 |
57 |
172 |
101 |
80 |
31 |
59 |
— |
569 |
|
Cyclosporiasis |
16 |
5 |
9 |
6 |
11 |
19 |
58 |
14 |
15 |
14 |
7 |
5 |
— |
179 |
|
Denque fever |
29 |
20 |
19 |
15 |
26 |
51 |
163 |
168 |
92 |
63 |
25 |
19 |
— |
690 |
|
Denque hemorrhagic fever |
— |
— |
1 |
— |
2 |
— |
1 |
2 |
3 |
— |
1 |
— |
— |
10 |
|
Ehrlichiosis/Anaplasmosis |
||||||||||||||
|
Ehrlichia chaffeensis |
12 |
12 |
16 |
17 |
81 |
110 |
153 |
98 |
55 |
37 |
24 |
125 |
— |
740 |
|
Ehrlichia ewingii |
— |
— |
— |
— |
— |
2 |
7 |
1 |
— |
— |
— |
— |
— |
10 |
|
Anaplasma phagocytophilum |
9 |
4 |
13 |
38 |
189 |
493 |
460 |
136 |
94 |
136 |
99 |
90 |
— |
1,761 |
|
Undetermined |
— |
— |
2 |
3 |
14 |
19 |
26 |
8 |
3 |
7 |
4 |
18 |
— |
104 |
|
Giardiasis |
1,255 |
1,348 |
1,406 |
1,302 |
1,735 |
1,340 |
2,027 |
2,064 |
2,023 |
2,174 |
1,365 |
1,772 |
— |
19,811 |
|
Gonorrhea§ |
22,916 |
22,020 |
22,143 |
21,759 |
29,831 |
23,166 |
30,356 |
24,928 |
25,196 |
31,325 |
22,942 |
32,759 |
— |
309,341 |
|
Haemophilus influenzae, invasive disease, all ages serotypes |
277 |
242 |
256 |
283 |
285 |
256 |
266 |
173 |
198 |
235 |
252 |
428 |
— |
3,151 |
|
age<5 yrs |
||||||||||||||
|
serotype b |
— |
3 |
2 |
1 |
2 |
1 |
4 |
2 |
3 |
1 |
1 |
3 |
— |
23 |
|
nonserotype b |
23 |
21 |
24 |
20 |
23 |
16 |
13 |
9 |
6 |
9 |
15 |
21 |
— |
200 |
|
unknown serotype |
28 |
15 |
16 |
13 |
17 |
7 |
18 |
12 |
15 |
21 |
26 |
35 |
— |
223 |
|
Hansen disease (leprosy) |
9 |
8 |
9 |
11 |
7 |
6 |
11 |
6 |
11 |
11 |
6 |
3 |
— |
98 |
|
Hantavirus pulmonary syndrome |
1 |
2 |
1 |
— |
2 |
2 |
3 |
5 |
— |
2 |
— |
2 |
— |
20 |
|
Hemolytic uremic syndrome post-diarrheal |
8 |
10 |
10 |
12 |
18 |
23 |
31 |
29 |
40 |
36 |
24 |
25 |
— |
266 |
|
Hepatitis, virus, acute |
||||||||||||||
|
A |
102 |
130 |
130 |
107 |
161 |
98 |
143 |
157 |
151 |
170 |
138 |
183 |
— |
1,670 |
|
B |
177 |
243 |
244 |
261 |
327 |
252 |
317 |
302 |
278 |
320 |
232 |
421 |
— |
3,374 |
|
C |
43 |
67 |
57 |
61 |
86 |
63 |
90 |
60 |
81 |
69 |
83 |
89 |
— |
849 |
|
HIV diagnoses¶ |
3,573 |
3,414 |
4,004 |
3,741 |
3,441 |
3,502 |
3,442 |
3,290 |
2909 |
2,515 |
1,611 |
291 |
8 |
35,741 |
|
Influenza-associated pediatric mortality** |
30 |
9 |
4 |
4 |
5 |
2 |
— |
2 |
— |
1 |
1 |
3 |
— |
61 |
|
Legionellosis |
171 |
143 |
146 |
143 |
248 |
378 |
429 |
368 |
332 |
477 |
218 |
293 |
— |
3,346 |
|
Listeriosis |
51 |
49 |
55 |
38 |
67 |
83 |
104 |
112 |
77 |
71 |
54 |
60 |
— |
821 |
|
Lyme disease, total |
875 |
757 |
973 |
1,366 |
2,577 |
5,375 |
7,222 |
3,416 |
2,377 |
2,489 |
1,317 |
1,414 |
— |
30,158 |
|
confirmed |
595 |
505 |
650 |
914 |
1,855 |
4,302 |
5,726 |
2,553 |
1,750 |
1,820 |
935 |
956 |
— |
22,561 |
|
probable |
280 |
252 |
323 |
452 |
722 |
1,073 |
1,496 |
863 |
627 |
669 |
382 |
458 |
— |
7,597 |
|
Malaria |
103 |
101 |
72 |
93 |
132 |
132 |
205 |
229 |
190 |
184 |
113 |
219 |
— |
1,773 |
|
Measles, total |
3 |
3 |
7 |
2 |
15 |
4 |
7 |
8 |
3 |
3 |
4 |
4 |
— |
63 |
|
indigenous |
— |
1 |
5 |
— |
11 |
1 |
3 |
1 |
— |
— |
1 |
— |
— |
23 |
|
imported |
3 |
2 |
2 |
2 |
4 |
3 |
4 |
7 |
3 |
3 |
3 |
4 |
— |
40 |
|
Meningococcal disease., invasive, all serogroups |
75 |
67 |
81 |
73 |
85 |
57 |
62 |
47 |
36 |
73 |
60 |
117 |
— |
833 |
|
serogroup A,C,Y, and W-135 |
23 |
25 |
31 |
31 |
32 |
19 |
19 |
8 |
10 |
28 |
19 |
35 |
— |
280 |
|
serogroup B |
12 |
15 |
12 |
11 |
11 |
13 |
9 |
10 |
6 |
13 |
6 |
17 |
— |
135 |
|
serogroup other |
1 |
— |
2 |
1 |
2 |
1 |
1 |
2 |
1 |
— |
1 |
— |
— |
12 |
|
serogroup unknown |
39 |
27 |
36 |
30 |
40 |
24 |
33 |
27 |
19 |
32 |
34 |
65 |
— |
406 |
|
Mumps |
278 |
314 |
369 |
180 |
518 |
475 |
161 |
45 |
49 |
66 |
62 |
95 |
— |
2,612 |
|
Pertussis |
774 |
912 |
912 |
1,083 |
1,716 |
1,757 |
2,955 |
2,927 |
2,711 |
3,360 |
2,694 |
5,749 |
— |
27,550 |
|
Plague |
— |
— |
— |
— |
— |
— |
— |
1 |
1 |
— |
— |
— |
— |
2 |
|
Psittacosis |
1 |
— |
1 |
2 |
— |
— |
— |
— |
— |
— |
— |
— |
— |
4 |
|
Q fever, total |
4 |
10 |
10 |
5 |
14 |
13 |
15 |
7 |
13 |
17 |
4 |
19 |
— |
131 |
|
acute |
1 |
8 |
9 |
4 |
13 |
12 |
14 |
5 |
12 |
11 |
4 |
13 |
— |
106 |
|
chronic |
3 |
2 |
1 |
1 |
1 |
1 |
1 |
2 |
1 |
6 |
— |
6 |
— |
25 |
|
TABLE 1. (Continued) Reported cases of notifiable diseases,* by month — United States, 2010 |
||||||||||||||
|---|---|---|---|---|---|---|---|---|---|---|---|---|---|---|
|
Name |
Jan. |
Feb. |
Mar. |
Apr. |
May |
June |
July |
Aug. |
Sept. |
Oct. |
Nov. |
Dec. |
Month not stated |
Total |
|
Rabies |
||||||||||||||
|
animal |
180 |
345 |
311 |
398 |
446 |
331 |
484 |
508 |
398 |
376 |
249 |
305 |
— |
4,331 |
|
human |
— |
— |
— |
— |
— |
— |
1 |
— |
— |
— |
— |
1 |
— |
2 |
|
Rubella |
1 |
— |
— |
1 |
3 |
— |
— |
— |
— |
— |
— |
— |
— |
5 |
|
Salmonellosis |
2,499 |
1,962 |
2,088 |
2,478 |
3,900 |
4,531 |
7,417 |
6,990 |
6,403 |
6,989 |
4,511 |
4,656 |
— |
54,424 |
|
Shiga toxin-producing E. coli (STEC) |
211 |
122 |
188 |
307 |
381 |
487 |
886 |
705 |
510 |
621 |
449 |
609 |
— |
5,476 |
|
Shigellosis |
919 |
1,075 |
1,041 |
832 |
1,387 |
1,238 |
1,359 |
1,206 |
1,211 |
1,489 |
1,202 |
1,827 |
— |
14,786 |
|
Spotted fever rickettsiosis, total |
10 |
25 |
25 |
47 |
159 |
251 |
308 |
323 |
213 |
194 |
90 |
340 |
— |
1,985 |
|
confirmed |
3 |
4 |
1 |
4 |
15 |
32 |
25 |
17 |
15 |
16 |
1 |
23 |
— |
156 |
|
probable |
8 |
21 |
25 |
43 |
148 |
220 |
283 |
306 |
197 |
178 |
89 |
317 |
— |
1,835 |
|
Streptococcal toxic-shock syndrome |
6 |
17 |
21 |
14 |
27 |
8 |
11 |
4 |
7 |
8 |
7 |
12 |
— |
142 |
|
Streptococcus pneumoniae, invasive disease, drug resistant |
1,513 |
1,590 |
1,809 |
1,763 |
1,752 |
938 |
803 |
466 |
660 |
1,328 |
1,276 |
2,671 |
— |
16,569 |
|
all ages |
||||||||||||||
|
age <5 yrs |
182 |
256 |
257 |
229 |
239 |
155 |
107 |
68 |
95 |
166 |
152 |
280 |
— |
2,186 |
|
Syphilis, total, all stages§,†† |
3,177 |
3,247 |
3,413 |
3,613 |
4,388 |
3,397 |
4,456 |
3,878 |
3,618 |
4,771 |
3,365 |
4,511 |
— |
45,834 |
|
congenital (age <1 yr)§ |
33 |
38 |
41 |
31 |
22 |
23 |
35 |
38 |
32 |
29 |
28 |
27 |
— |
377 |
|
primary and secondary§ |
910 |
928 |
1,021 |
1,012 |
1,318 |
997 |
1,415 |
1,213 |
1,185 |
1,425 |
981 |
1,369 |
— |
13,774 |
|
Tetanus |
— |
1 |
2 |
— |
4 |
1 |
3 |
3 |
4 |
1 |
2 |
5 |
— |
26 |
|
Toxic-shock syndrome (other than streptococcal) |
11 |
7 |
7 |
3 |
9 |
5 |
5 |
7 |
5 |
10 |
7 |
6 |
— |
82 |
|
Trichinellosis |
— |
1 |
— |
2 |
— |
— |
— |
1 |
1 |
— |
1 |
1 |
— |
7 |
|
Tuberculosis§§ |
536 |
672 |
936 |
945 |
879 |
1,031 |
948 |
936 |
938 |
853 |
834 |
1,674 |
— |
11,182 |
|
Tularemia |
1 |
3 |
— |
1 |
17 |
25 |
26 |
19 |
8 |
11 |
6 |
7 |
— |
124 |
|
Typhoid fever |
34 |
38 |
24 |
25 |
29 |
26 |
53 |
63 |
49 |
51 |
25 |
50 |
— |
467 |
|
Vancomycin-intermediate Staphylococcus aureus (VISA) |
4 |
5 |
9 |
8 |
13 |
4 |
8 |
5 |
3 |
10 |
8 |
14 |
— |
91 |
|
Vancomycin-resistant Staphylococcus aureus (VRSA) |
— |
— |
1 |
— |
— |
— |
— |
1 |
— |
— |
— |
— |
— |
2 |
|
Varicella (Chickenpox) |
||||||||||||||
|
morbidity |
1,096 |
1,350 |
1,544 |
1,630 |
2,253 |
1,070 |
713 |
601 |
990 |
1,540 |
1,096 |
1,544 |
— |
15,427 |
|
mortality¶¶ |
— |
— |
— |
1 |
— |
— |
1 |
1 |
— |
— |
— |
1 |
— |
4 |
|
Vibriosis |
47 |
11 |
11 |
25 |
60 |
71 |
136 |
169 |
118 |
86 |
38 |
74 |
— |
846 |
|
Viral hemorrhagic fevers |
1 |
— |
— |
— |
— |
— |
— |
— |
— |
— |
— |
— |
— |
1 |
|
* No cases of anthrax; diphtheria; eastern equine encephalitis virus disease, non-neuroinvasive; poliomyelitis, paralytic; poliovirus, infection, nonparalytic; Powassan virus disease, non-neuroinvasive; rubella, congenital syndrome; severe acute respiratory syndrome-associated coronavirus disease (SARS-CoV); smallpox; western equine encephalitis virus disease, neuroinvasive and non-neuroinvasive; and yellow fever were reported in 2010. Data on hepatitis B, perinatal infection, chronic hepatitis B, and chronic hepatitis C virus infection are not included because they are undergoing data quality review. Data on human immunodeficiency virus (HIV) infections are not included because HIV infection reporting has been implemented on different dates and using different methods than for AIDS case reporting. † Totals reported to the Division of Vector-Borne Diseases, National Center for Emerging and Zoonotic Infectious Diseases (ArboNET Surveillance), as of May 9, 2011. § Totals reported to the Division of STD Prevention, National Center for HIV/AIDS, Viral Hepatitis, STD, and TB Prevention (NCHHSTP), as of June 8, 2011. ¶ Total number of HIV cases reported to the Division of HIV/AIDS Prevention, NCHHSTP through December 31, 2010. ** Totals reported to the Influenza Division, National Center for Immunization and Respiratory Diseases (NCIRD), as of December 31, 2010. †† Includes the following categories: primary, secondary, latent (including early latent, late latent, and latent syphilis of unknown duration), neurosyphilis, late (including late syphilis with clinical manifestations other than neurosyphilis), and congenital syphilis. §§ Totals reported to the Division of TB Elimination, NCHHSTP, as of July 1, 2011. ¶¶ Totals reported to the Division of Viral Diseases, NCIRD, as of June 30, 2011. |
||||||||||||||
|
TABLE 2. Reported cases of notifiable diseases,* by geographic division and area — United States, 2010 |
|||||||||
|---|---|---|---|---|---|---|---|---|---|
|
Area |
Total resident population (in thousands) |
Arboviral diseases† |
|||||||
|
California serogroup virus |
Eastern equine encephalitis virus |
Powassan virus |
St. Louis encephalitis virus |
West Nile virus |
|||||
|
Neuro- |
Nonneuro-invasive |
Neuro- |
Neuro- |
Neuro- |
Nonneuro- invasive |
Neuro- |
Nonneuro- |
||
|
United States |
307,009 |
68 |
7 |
10 |
8 |
8 |
2 |
629 |
392 |
|
New England |
14,430 |
— |
— |
2 |
— |
— |
— |
14 |
5 |
|
Connecticut |
3,518 |
— |
— |
— |
— |
— |
— |
7 |
4 |
|
Maine |
1,318 |
— |
— |
— |
— |
— |
— |
— |
— |
|
Massachusetts |
6,594 |
— |
— |
1 |
— |
— |
— |
6 |
1 |
|
New Hampshire |
1,325 |
— |
— |
— |
— |
— |
— |
1 |
— |
|
Rhode Island |
1,053 |
— |
— |
1 |
— |
— |
— |
— |
— |
|
Vermont |
622 |
— |
— |
— |
— |
— |
— |
— |
— |
|
Mid. Atlantic |
40,855 |
— |
1 |
1 |
1 |
— |
— |
123 |
63 |
|
New Jersey |
8,708 |
— |
— |
— |
— |
— |
— |
15 |
15 |
|
New York (Upstate) |
11,150 |
— |
1 |
1 |
1 |
— |
— |
56 |
30 |
|
New York City |
8,392 |
— |
— |
— |
— |
— |
— |
33 |
9 |
|
Pennsylvania |
12,605 |
— |
— |
— |
— |
— |
— |
19 |
9 |
|
E.N. Central |
46,501 |
22 |
4 |
3 |
4 |
2 |
— |
80 |
30 |
|
Illinois |
12,910 |
— |
— |
— |
— |
— |
— |
45 |
16 |
|
Indiana |
6,423 |
— |
— |
— |
— |
— |
— |
6 |
7 |
|
Michigan |
9,970 |
2 |
— |
3 |
— |
2 |
— |
25 |
4 |
|
Ohio |
11,543 |
20 |
4 |
— |
— |
— |
— |
4 |
1 |
|
Wisconsin |
5,655 |
— |
— |
— |
4 |
— |
— |
— |
2 |
|
W.N. Central |
20,337 |
1 |
— |
— |
3 |
1 |
— |
32 |
75 |
|
Iowa |
3,008 |
— |
— |
— |
— |
— |
— |
5 |
4 |
|
Kansas |
2,819 |
— |
— |
— |
— |
— |
— |
4 |
15 |
|
Minnesota |
5,266 |
1 |
— |
— |
3 |
— |
— |
4 |
4 |
|
Missouri |
5,988 |
— |
— |
— |
— |
1 |
— |
3 |
— |
|
Nebraska |
1,797 |
— |
— |
— |
— |
— |
— |
10 |
29 |
|
North Dakota |
647 |
— |
— |
— |
— |
— |
— |
2 |
7 |
|
South Dakota |
812 |
— |
— |
— |
— |
— |
— |
4 |
16 |
|
S. Atlantic |
59,196 |
34 |
— |
4 |
— |
— |
2 |
38 |
22 |
|
Delaware |
885 |
— |
— |
— |
— |
— |
— |
— |
— |
|
District of Columbia |
600 |
— |
— |
— |
— |
— |
2 |
3 |
3 |
|
Florida |
18,538 |
— |
— |
4 |
— |
— |
— |
9 |
3 |
|
Georgia |
9,829 |
2 |
— |
— |
— |
— |
— |
4 |
9 |
|
Maryland |
5,699 |
2 |
— |
— |
— |
— |
— |
17 |
6 |
|
North Carolina |
9,381 |
22 |
— |
— |
— |
— |
— |
— |
— |
|
South Carolina |
4,561 |
— |
— |
— |
— |
— |
— |
1 |
— |
|
Virginia |
7,883 |
— |
— |
— |
— |
— |
— |
4 |
1 |
|
West Virginia |
1,820 |
8 |
— |
— |
— |
— |
— |
— |
— |
|
E.S. Central |
18,271 |
10 |
2 |
— |
— |
— |
— |
8 |
10 |
|
Alabama |
4,709 |
— |
— |
— |
— |
— |
— |
1 |
2 |
|
Kentucky |
4,314 |
1 |
— |
— |
— |
— |
— |
2 |
1 |
|
Mississippi |
2,952 |
— |
— |
— |
— |
— |
— |
3 |
5 |
|
Tennessee |
6,296 |
9 |
2 |
— |
— |
— |
— |
2 |
2 |
|
W.S. Central |
35,850 |
1 |
— |
— |
— |
5 |
— |
104 |
20 |
|
Arkansas |
2,889 |
— |
— |
— |
— |
2 |
— |
6 |
1 |
|
Louisiana |
4,492 |
— |
— |
— |
— |
— |
— |
20 |
7 |
|
Oklahoma |
3,687 |
— |
— |
— |
— |
— |
— |
1 |
— |
|
Texas |
24,782 |
1 |
— |
— |
— |
3 |
— |
77 |
12 |
|
Mountain |
22,124 |
— |
— |
— |
— |
— |
— |
157 |
127 |
|
Arizona |
6,596 |
— |
— |
— |
— |
— |
— |
107 |
60 |
|
Colorado |
5,025 |
— |
— |
— |
— |
— |
— |
26 |
55 |
|
Idaho |
1,546 |
— |
— |
— |
— |
— |
— |
— |
1 |
|
Montana |
975 |
— |
— |
— |
— |
— |
— |
— |
— |
|
Nevada |
2,643 |
— |
— |
— |
— |
— |
— |
— |
2 |
|
New Mexico |
2,010 |
— |
— |
— |
— |
— |
— |
21 |
4 |
|
Utah |
2,785 |
— |
— |
— |
— |
— |
— |
1 |
1 |
|
Wyoming |
544 |
— |
— |
— |
— |
— |
— |
2 |
4 |
|
Pacific |
49,445 |
— |
— |
— |
— |
— |
— |
73 |
40 |
|
Alaska |
698 |
— |
— |
— |
— |
— |
— |
— |
— |
|
California |
36,962 |
— |
— |
— |
— |
— |
— |
72 |
39 |
|
Hawaii |
1,295 |
— |
— |
— |
— |
— |
— |
— |
— |
|
Oregon |
3,826 |
— |
— |
— |
— |
— |
— |
— |
— |
|
Washington |
6,664 |
— |
— |
— |
— |
— |
— |
1 |
1 |
|
Territories |
|||||||||
|
American Samoa |
66 |
— |
— |
— |
— |
— |
— |
— |
— |
|
C.N.M.I. |
51 |
— |
— |
— |
— |
— |
— |
— |
— |
|
Guam |
178 |
— |
— |
— |
— |
— |
— |
— |
— |
|
Puerto Rico |
3,967 |
— |
— |
— |
— |
— |
— |
— |
— |
|
U.S. Virgin Islands |
110 |
— |
— |
— |
— |
— |
— |
— |
— |
|
N: Not reportable. U: Unavailable. —: No reported cases. C.N.M.I.: Commonwealth of Northern Mariana Islands. * No cases of anthrax; diphtheria; eastern equine encephalitis virus disease, non-neuroinvasive; poliomyelitis, paralytic; poliovirus infection, nonparalytic; Powassan virus disease, non-neuroinvasive; rubella, congenital syndrome; severe acute respiratory syndrome–associated coronavirus disease (SARS-CoV); smallpox; western equine encephalitis virus disease, neuroinvasive and non-neuroinvasive; or yellow fever were reported in 2010. Data on hepatitis B virus, perinatal infection, chronic hepatitis B, and chronic hepatitis C virus infection are not included because they are undergoing data quality review. † Totals reported to the Division of Vector-Borne Diseases (DVBD), National Center for Emerging and Zoonotic Infectious Diseases (NCEZID) (ArboNET Surveillance), as of May 9, 2011. |
|||||||||
|
TABLE 2. (Continued) Reported cases of notifiable diseases,* by geographic division and area — United States, 2010 |
|||||||
|---|---|---|---|---|---|---|---|
|
Area |
Botulism |
Brucellosis |
Chancroid§ |
Chlamydia trachomatis infection§¶ |
|||
|
Total |
Foodborne |
Infant |
Other† |
||||
|
United States |
112 |
7 |
80 |
25 |
115 |
24 |
1,307,893 |
|
New England |
1 |
— |
1 |
— |
5 |
1 |
43,514 |
|
Connecticut |
— |
— |
— |
— |
— |
— |
12,649 |
|
Maine |
— |
— |
— |
— |
2 |
— |
2,586 |
|
Massachusetts |
1 |
— |
1 |
— |
2 |
1 |
21,080 |
|
New Hampshire |
— |
— |
— |
— |
1 |
— |
2,462 |
|
Rhode Island |
— |
— |
— |
— |
— |
— |
3,480 |
|
Vermont |
— |
— |
— |
— |
— |
— |
1,257 |
|
Mid. Atlantic |
22 |
— |
22 |
— |
7 |
— |
173,580 |
|
New Jersey |
5 |
— |
5 |
— |
3 |
— |
26,142 |
|
New York (Upstate) |
1 |
— |
1 |
— |
— |
— |
36,279 |
|
New York City |
2 |
— |
2 |
— |
4 |
— |
63,641 |
|
Pennsylvania |
14 |
— |
14 |
— |
— |
— |
47,518 |
|
E.N. Central |
3 |
— |
2 |
1 |
9 |
— |
207,361 |
|
Illinois |
— |
— |
— |
— |
1 |
— |
60,672 |
|
Indiana |
— |
— |
— |
— |
— |
— |
22,825 |
|
Michigan |
— |
— |
— |
— |
4 |
— |
49,478 |
|
Ohio |
3 |
— |
2 |
1 |
— |
— |
51,150 |
|
Wisconsin |
— |
— |
— |
— |
4 |
— |
23,236 |
|
W.N. Central |
— |
— |
— |
— |
10 |
— |
72,196 |
|
Iowa |
— |
— |
— |
— |
— |
— |
10,542 |
|
Kansas |
— |
— |
— |
— |
4 |
— |
9,601 |
|
Minnesota |
— |
— |
— |
— |
3 |
— |
15,294 |
|
Missouri |
— |
— |
— |
— |
3 |
— |
26,049 |
|
Nebraska |
— |
— |
— |
— |
— |
— |
5,114 |
|
North Dakota |
— |
— |
— |
— |
— |
— |
2,404 |
|
South Dakota |
— |
— |
— |
N |
— |
— |
3,192 |
|
S. Atlantic |
14 |
— |
13 |
1 |
15 |
3 |
259,382 |
|
Delaware |
3 |
— |
3 |
— |
1 |
— |
4,464 |
|
District of Columbia |
— |
— |
— |
— |
1 |
— |
5,589 |
|
Florida |
1 |
— |
1 |
— |
9 |
1 |
74,744 |
|
Georgia |
1 |
— |
1 |
— |
2 |
— |
45,147 |
|
Maryland |
5 |
— |
4 |
1 |
1 |
— |
26,192 |
|
North Carolina |
— |
— |
— |
— |
1 |
1 |
42,048 |
|
South Carolina |
— |
— |
— |
— |
— |
1 |
26,525 |
|
Virginia |
1 |
— |
1 |
— |
— |
— |
30,797 |
|
West Virginia |
3 |
— |
3 |
— |
— |
— |
3,876 |
|
E.S. Central |
3 |
1 |
1 |
1 |
6 |
2 |
93,161 |
|
Alabama |
1 |
— |
1 |
— |
2 |
1 |
27,041 |
|
Kentucky |
1 |
— |
— |
1 |
1 |
— |
16,376 |
|
Mississippi |
1 |
1 |
— |
— |
2 |
— |
21,417 |
|
Tennessee |
— |
— |
— |
— |
1 |
1 |
28,327 |
|
W.S. Central |
11 |
— |
10 |
1 |
21 |
12 |
178,749 |
|
Arkansas |
1 |
— |
— |
1 |
— |
— |
15,424 |
|
Louisiana |
— |
— |
— |
— |
— |
— |
29,151 |
|
Oklahoma |
2 |
— |
2 |
— |
— |
— |
14,302 |
|
Texas |
8 |
— |
8 |
— |
21 |
12 |
119,872 |
|
Mountain |
8 |
2 |
6 |
— |
12 |
— |
83,773 |
|
Arizona |
— |
— |
— |
— |
9 |
— |
26,861 |
|
Colorado |
4 |
1 |
3 |
— |
1 |
— |
19,447 |
|
Idaho |
1 |
— |
1 |
— |
— |
— |
4,208 |
|
Montana |
1 |
— |
1 |
— |
— |
— |
3,082 |
|
Nevada |
— |
— |
— |
— |
— |
— |
9,666 |
|
New Mexico |
1 |
1 |
— |
— |
2 |
— |
11,706 |
|
Utah |
1 |
— |
1 |
— |
— |
— |
6,690 |
|
Wyoming |
— |
— |
— |
— |
— |
— |
2,113 |
|
Pacific |
50 |
4 |
25 |
21 |
30 |
6 |
196,177 |
|
Alaska |
3 |
3 |
— |
— |
— |
— |
6,019 |
|
California |
41 |
1 |
20 |
20 |
26 |
5 |
150,443 |
|
Hawaii |
1 |
— |
1 |
— |
2 |
— |
6,015 |
|
Oregon |
1 |
— |
1 |
— |
2 |
— |
12,352 |
|
Washington |
4 |
— |
3 |
1 |
— |
1 |
21,348 |
|
Territories |
|||||||
|
American Samoa |
— |
— |
— |
— |
— |
— |
— |
|
C.N.M.I. |
— |
— |
— |
— |
— |
— |
— |
|
Guam |
— |
— |
— |
— |
— |
— |
899 |
|
Puerto Rico |
— |
— |
— |
N |
— |
— |
5,960 |
|
U.S. Virgin Islands |
— |
— |
— |
— |
— |
— |
609 |
|
N: Not reportable. U: Unavailable. —: No reported cases. C.N.M.I.: Commonwealth of Northern Mariana Islands. † Includes cases reported as wound and unspecified botulism. § Totals reported to the Division of STD Prevention, NCHHSTP, as of June 8, 2011. ¶ Name change to coincide with the National Surveillance Case Definition. |
|||||||
|
TABLE 2. (Continued) Reported cases of notifiable diseases,* by geographic division and area — United States, 2010 |
|||||||
|---|---|---|---|---|---|---|---|
|
Area |
Cholera |
Cryptosporidiosis |
Cyclosporiasis |
Dengue Virus Infection† |
|||
|
Total |
Confirmed |
Probable |
Dengue fever |
Dengue hemorrhagic fever |
|||
|
United States |
13 |
8,944 |
8,375 |
569 |
179 |
690 |
10 |
|
New England |
— |
490 |
470 |
20 |
27 |
10 |
— |
|
Connecticut |
— |
77 |
77 |
— |
11 |
— |
— |
|
Maine |
— |
93 |
74 |
19 |
N |
6 |
— |
|
Massachusetts |
— |
173 |
173 |
— |
15 |
— |
— |
|
New Hampshire |
— |
59 |
58 |
1 |
— |
— |
— |
|
Rhode Island |
— |
18 |
18 |
— |
1 |
1 |
— |
|
Vermont |
— |
70 |
70 |
— |
N |
3 |
— |
|
Mid. Atlantic |
1 |
875 |
867 |
8 |
42 |
224 |
5 |
|
New Jersey |
— |
52 |
52 |
— |
11 |
29 |
— |
|
New York (Upstate) |
— |
228 |
224 |
4 |
13 |
32 |
2 |
|
New York City |
1 |
107 |
107 |
— |
18 |
141 |
3 |
|
Pennsylvania |
— |
488 |
484 |
4 |
N |
22 |
— |
|
E.N. Central |
3 |
2,403 |
2,353 |
50 |
10 |
69 |
1 |
|
Illinois |
— |
334 |
303 |
31 |
2 |
23 |
— |
|
Indiana |
— |
285 |
285 |
— |
— |
14 |
— |
|
Michigan |
— |
320 |
319 |
1 |
6 |
9 |
— |
|
Ohio |
3 |
476 |
458 |
18 |
— |
16 |
— |
|
Wisconsin |
— |
988 |
988 |
— |
2 |
7 |
1 |
|
W.N. Central |
— |
1,854 |
1,564 |
290 |
1 |
34 |
1 |
|
Iowa |
— |
396 |
345 |
51 |
— |
2 |
— |
|
Kansas |
— |
107 |
107 |
— |
— |
4 |
— |
|
Minnesota |
— |
397 |
397 |
— |
1 |
14 |
— |
|
Missouri |
— |
548 |
358 |
190 |
— |
6 |
— |
|
Nebraska |
— |
264 |
233 |
31 |
— |
7 |
— |
|
North Dakota |
— |
35 |
35 |
— |
N |
1 |
— |
|
South Dakota |
— |
107 |
89 |
18 |
— |
— |
1 |
|
S. Atlantic |
7 |
1,080 |
1,021 |
59 |
86 |
238 |
2 |
|
Delaware |
— |
9 |
9 |
— |
— |
— |
— |
|
District of Columbia |
— |
8 |
8 |
— |
6 |
— |
— |
|
Florida |
4 |
408 |
386 |
22 |
63 |
189 |
2 |
|
Georgia |
1 |
266 |
266 |
— |
9 |
12 |
— |
|
Maryland |
— |
42 |
37 |
5 |
4 |
— |
— |
|
North Carolina |
1 |
94 |
93 |
1 |
1 |
8 |
— |
|
South Carolina |
— |
123 |
98 |
25 |
2 |
13 |
— |
|
Virginia |
1 |
109 |
104 |
5 |
1 |
14 |
— |
|
West Virginia |
— |
21 |
20 |
1 |
— |
2 |
— |
|
E.S. Central |
— |
348 |
328 |
20 |
1 |
7 |
— |
|
Alabama |
— |
184 |
164 |
20 |
N |
4 |
— |
|
Kentucky |
— |
85 |
85 |
— |
N |
2 |
— |
|
Mississippi |
— |
24 |
24 |
— |
N |
— |
— |
|
Tennessee |
— |
55 |
55 |
— |
1 |
1 |
— |
|
W.S. Central |
2 |
578 |
514 |
64 |
10 |
28 |
1 |
|
Arkansas |
— |
33 |
32 |
1 |
1 |
— |
1 |
|
Louisiana |
— |
66 |
66 |
— |
— |
4 |
— |
|
Oklahoma |
— |
120 |
90 |
30 |
— |
5 |
— |
|
Texas |
2 |
359 |
326 |
33 |
9 |
19 |
— |
|
Mountain |
— |
608 |
588 |
20 |
— |
24 |
— |
|
Arizona |
— |
40 |
38 |
2 |
— |
12 |
— |
|
Colorado |
— |
134 |
133 |
1 |
— |
— |
— |
|
Idaho |
— |
110 |
102 |
8 |
N |
3 |
— |
|
Montana |
— |
49 |
49 |
— |
N |
4 |
— |
|
Nevada |
— |
38 |
34 |
4 |
N |
4 |
— |
|
New Mexico |
— |
137 |
135 |
2 |
— |
1 |
— |
|
Utah |
— |
72 |
72 |
— |
— |
— |
— |
|
Wyoming |
— |
28 |
25 |
3 |
— |
— |
— |
|
Pacific |
— |
708 |
670 |
38 |
2 |
56 |
— |
|
Alaska |
— |
6 |
6 |
— |
— |
1 |
— |
|
California |
— |
381 |
381 |
— |
— |
36 |
— |
|
Hawaii |
— |
1 |
1 |
— |
— |
— |
— |
|
Oregon |
— |
218 |
188 |
30 |
— |
— |
— |
|
Washington |
— |
102 |
94 |
8 |
2 |
19 |
— |
|
Territories |
|||||||
|
American Samoa |
— |
N |
N |
N |
N |
— |
— |
|
C.N.M.I. |
— |
— |
— |
— |
— |
— |
— |
|
Guam |
— |
— |
— |
— |
— |
— |
— |
|
Puerto Rico |
— |
N |
N |
N |
N |
10,674 |
237 |
|
U.S. Virgin Islands |
— |
— |
— |
— |
— |
— |
— |
|
N: Not reportable. U: Unavailable. —: No reported cases. C.N.M.I.: Commonwealth of Northern Mariana Islands. † Total number of reported laboratory-positive dengue cases including all confirmed cases [by anti-dengue virus (DENV) molecular diagnostic methods or seroconversion of anti-DENV IgM] and all probable cases (by a single, positive anti-DENV IgM). Totals reported to the Division of Vector-Borne Diseases (DVBD), National Center for Emerging and Zoonotic Infectious Diseases (NCEZID) (ArboNET Surveillance), as of May 9, 2011. |
|||||||
|
TABLE 2. (Continued) Reported cases of notifiable diseases,* by geographic division and area — United States, 2010 |
||||||
|---|---|---|---|---|---|---|
|
Area |
Ehrlichiosis/Anaplasmosis |
Giardiasis |
Gonorrhea† |
|||
|
Ehrlichia |
Ehrlichia |
Anaplasma phagocytophilum |
Undetermined |
|||
|
United States |
740 |
10 |
1,761 |
104 |
19,811 |
309,341 |
|
New England |
8 |
— |
122 |
2 |
1,663 |
5,714 |
|
Connecticut |
— |
— |
43 |
— |
291 |
2,569 |
|
Maine |
4 |
— |
17 |
— |
223 |
162 |
|
Massachusetts |
— |
— |
— |
— |
725 |
2,483 |
|
New Hampshire |
3 |
— |
20 |
2 |
156 |
151 |
|
Rhode Island |
1 |
— |
40 |
— |
83 |
291 |
|
Vermont |
— |
— |
2 |
— |
185 |
58 |
|
Mid. Atlantic |
92 |
— |
293 |
17 |
3,422 |
37,075 |
|
New Jersey |
52 |
— |
77 |
1 |
484 |
5,872 |
|
New York (Upstate) |
33 |
— |
204 |
13 |
1,230 |
5,916 |
|
New York City |
5 |
— |
11 |
— |
922 |
12,404 |
|
Pennsylvania |
2 |
— |
1 |
3 |
786 |
12,883 |
|
E.N. Central |
44 |
— |
512 |
46 |
3,286 |
57,487 |
|
Illinois |
16 |
— |
9 |
3 |
691 |
15,777 |
|
Indiana |
— |
— |
— |
15 |
398 |
6,496 |
|
Michigan |
2 |
— |
4 |
— |
697 |
13,627 |
|
Ohio |
7 |
— |
2 |
— |
872 |
16,496 |
|
Wisconsin |
19 |
— |
497 |
28 |
628 |
5,091 |
|
W.N. Central |
132 |
8 |
733 |
21 |
2,123 |
15,024 |
|
Iowa |
N |
N |
N |
N |
284 |
1,803 |
|
Kansas |
6 |
— |
1 |
— |
208 |
2,084 |
|
Minnesota |
12 |
— |
720 |
11 |
843 |
2,119 |
|
Missouri |
112 |
8 |
12 |
10 |
426 |
7,159 |
|
Nebraska |
2 |
N |
— |
— |
222 |
1,187 |
|
North Dakota |
N |
N |
N |
N |
37 |
204 |
|
South Dakota |
— |
— |
— |
— |
103 |
468 |
|
S. Atlantic |
254 |
1 |
64 |
6 |
4,004 |
76,604 |
|
Delaware |
17 |
1 |
4 |
— |
35 |
1,010 |
|
District of Columbia |
N |
N |
N |
N |
56 |
2,104 |
|
Florida |
10 |
— |
3 |
— |
2,139 |
20,163 |
|
Georgia |
20 |
— |
1 |
1 |
796 |
15,852 |
|
Maryland |
22 |
— |
15 |
2 |
262 |
7,413 |
|
North Carolina |
99 |
— |
28 |
— |
N |
14,111 |
|
South Carolina |
5 |
— |
1 |
— |
147 |
7,970 |
|
Virginia |
78 |
— |
12 |
3 |
512 |
7,402 |
|
West Virginia |
3 |
— |
— |
— |
57 |
579 |
|
E.S. Central |
88 |
1 |
20 |
9 |
220 |
25,594 |
|
Alabama |
12 |
— |
7 |
N |
220 |
7,933 |
|
Kentucky |
16 |
— |
— |
1 |
N |
4,345 |
|
Mississippi |
3 |
— |
2 |
1 |
N |
6,195 |
|
Tennessee |
57 |
1 |
11 |
7 |
N |
7,121 |
|
W.S. Central |
120 |
— |
17 |
1 |
397 |
49,838 |
|
Arkansas |
19 |
— |
5 |
— |
138 |
4,769 |
|
Louisiana |
1 |
— |
— |
— |
197 |
8,912 |
|
Oklahoma |
97 |
— |
9 |
— |
62 |
4,369 |
|
Texas |
3 |
— |
3 |
1 |
N |
31,788 |
|
Mountain |
— |
— |
— |
— |
1,764 |
9,592 |
|
Arizona |
— |
— |
— |
— |
167 |
3,249 |
|
Colorado |
N |
N |
N |
N |
691 |
2,787 |
|
Idaho |
N |
N |
N |
N |
215 |
147 |
|
Montana |
N |
N |
N |
N |
109 |
102 |
|
Nevada |
N |
— |
N |
N |
107 |
1,728 |
|
New Mexico |
N |
N |
N |
N |
108 |
1,229 |
|
Utah |
— |
— |
— |
— |
313 |
310 |
|
Wyoming |
— |
— |
— |
— |
54 |
40 |
|
Pacific |
2 |
— |
— |
2 |
2,932 |
32,413 |
|
Alaska |
N |
N |
N |
N |
98 |
1,273 |
|
California |
2 |
— |
— |
2 |
1,773 |
26,441 |
|
Hawaii |
N |
N |
N |
N |
59 |
759 |
|
Oregon |
— |
— |
— |
— |
481 |
1,076 |
|
Washington |
— |
— |
— |
— |
521 |
2,864 |
|
Territories |
||||||
|
American Samoa |
N |
N |
N |
N |
— |
— |
|
C.N.M.I. |
— |
— |
— |
— |
— |
— |
|
Guam |
N |
N |
N |
N |
3 |
97 |
|
Puerto Rico |
N |
N |
N |
N |
93 |
312 |
|
U.S. Virgin Islands |
— |
— |
— |
— |
— |
151 |
|
N: Not reportable. U: Unavailable. —: No reported cases. C.N.M.I.: Commonwealth of Northern Mariana Islands. † Totals reported to the Division of STD Prevention, NCHHSTP, as of June 8, 2011. |
||||||
|
TABLE 2. (Continued) Reported cases of notifiable diseases,* by geographic division and area — United States, 2010 |
|||||||
|---|---|---|---|---|---|---|---|
|
Area |
Haemophilus influenzae, invasive disease |
Hansen disease (leprosy) |
Hantavirus pulmonary syndrome |
Hemolytic uremic syndrome, postdiarrheal |
|||
|
All ages, serotypes |
Age <5 yrs |
||||||
|
Serotype b |
Nonserotype b |
Unknown serotype |
|||||
|
United States |
3,151 |
23 |
200 |
223 |
98 |
20 |
266 |
|
New England |
201 |
1 |
13 |
5 |
5 |
— |
9 |
|
Connecticut |
49 |
— |
1 |
— |
— |
N |
3 |
|
Maine |
13 |
— |
— |
— |
N |
— |
1 |
|
Massachusetts |
97 |
— |
7 |
1 |
4 |
— |
2 |
|
New Hampshire |
12 |
1 |
1 |
1 |
— |
— |
3 |
|
Rhode Island |
15 |
— |
1 |
1 |
1 |
— |
— |
|
Vermont |
15 |
— |
3 |
2 |
N |
— |
— |
|
Mid. Atlantic |
603 |
3 |
21 |
43 |
5 |
— |
19 |
|
New Jersey |
111 |
— |
— |
5 |
1 |
— |
2 |
|
New York (Upstate) |
170 |
2 |
18 |
3 |
N |
— |
12 |
|
New York City |
99 |
— |
— |
18 |
3 |
— |
5 |
|
Pennsylvania |
223 |
1 |
3 |
17 |
1 |
— |
N |
|
E.N. Central |
515 |
3 |
36 |
31 |
1 |
— |
31 |
|
Illinois |
173 |
— |
— |
22 |
— |
— |
— |
|
Indiana |
110 |
— |
16 |
— |
1 |
— |
7 |
|
Michigan |
37 |
— |
3 |
3 |
— |
— |
14 |
|
Ohio |
121 |
3 |
10 |
5 |
— |
— |
2 |
|
Wisconsin |
74 |
— |
7 |
1 |
— |
— |
8 |
|
W.N. Central |
233 |
— |
9 |
21 |
— |
1 |
33 |
|
Iowa |
1 |
— |
— |
— |
— |
— |
5 |
|
Kansas |
24 |
— |
— |
6 |
— |
1 |
2 |
|
Minnesota |
81 |
— |
9 |
— |
— |
— |
— |
|
Missouri |
87 |
— |
— |
10 |
— |
— |
18 |
|
Nebraska |
27 |
— |
— |
4 |
— |
— |
6 |
|
North Dakota |
13 |
— |
— |
1 |
N |
— |
— |
|
South Dakota |
— |
— |
— |
— |
— |
— |
2 |
|
S. Atlantic |
779 |
6 |
46 |
45 |
16 |
— |
32 |
|
Delaware |
6 |
— |
— |
— |
— |
— |
— |
|
District of Columbia |
6 |
— |
— |
— |
— |
— |
— |
|
Florida |
191 |
3 |
14 |
15 |
12 |
— |
8 |
|
Georgia |
169 |
— |
15 |
10 |
1 |
— |
6 |
|
Maryland |
71 |
1 |
3 |
2 |
1 |
— |
8 |
|
North Carolina |
128 |
— |
— |
13 |
1 |
— |
7 |
|
South Carolina |
84 |
— |
2 |
3 |
— |
— |
— |
|
Virginia |
85 |
2 |
10 |
1 |
1 |
— |
2 |
|
West Virginia |
39 |
— |
2 |
1 |
N |
— |
1 |
|
E.S. Central |
185 |
— |
18 |
8 |
1 |
— |
22 |
|
Alabama |
35 |
— |
7 |
— |
— |
N |
5 |
|
Kentucky |
39 |
— |
— |
8 |
— |
— |
N |
|
Mississippi |
15 |
— |
1 |
— |
1 |
— |
— |
|
Tennessee |
96 |
— |
10 |
— |
— |
— |
17 |
|
W.S. Central |
167 |
2 |
15 |
9 |
28 |
1 |
36 |
|
Arkansas |
22 |
— |
1 |
3 |
2 |
— |
6 |
|
Louisiana |
30 |
— |
— |
6 |
— |
— |
— |
|
Oklahoma |
103 |
— |
14 |
— |
N |
— |
11 |
|
Texas |
12 |
2 |
— |
— |
26 |
1 |
19 |
|
Mountain |
313 |
8 |
32 |
14 |
2 |
10 |
30 |
|
Arizona |
115 |
2 |
16 |
— |
1 |
— |
2 |
|
Colorado |
82 |
2 |
8 |
2 |
— |
5 |
12 |
|
Idaho |
19 |
— |
2 |
3 |
— |
2 |
3 |
|
Montana |
2 |
— |
— |
1 |
— |
— |
2 |
|
Nevada |
10 |
— |
— |
— |
— |
1 |
1 |
|
New Mexico |
46 |
3 |
3 |
6 |
— |
2 |
3 |
|
Utah |
33 |
1 |
3 |
1 |
1 |
— |
7 |
|
Wyoming |
6 |
— |
— |
1 |
— |
— |
— |
|
Pacific |
155 |
— |
10 |
47 |
40 |
8 |
54 |
|
Alaska |
27 |
— |
— |
12 |
— |
N |
N |
|
California |
28 |
— |
— |
24 |
16 |
3 |
39 |
|
Hawaii |
21 |
— |
— |
5 |
24 |
— |
— |
|
Oregon |
69 |
— |
— |
6 |
N |
3 |
14 |
|
Washington |
10 |
— |
10 |
— |
N |
2 |
1 |
|
Territories |
|||||||
|
American Samoa |
— |
— |
— |
— |
— |
N |
N |
|
C.N.M.I. |
— |
— |
— |
— |
— |
— |
— |
|
Guam |
— |
— |
— |
— |
10 |
N |
— |
|
Puerto Rico |
1 |
— |
— |
— |
— |
— |
N |
|
U.S. Virgin Islands |
— |
— |
— |
— |
— |
— |
— |
|
N: Not reportable. U: Unavailable. —: No reported cases. C.N.M.I.: Commonwealth of Northern Mariana Islands. |
|||||||
|
TABLE 2. (Continued) Reported cases of notifiable diseases,* by geographic division and area — United States, 2010 |
|||||||
|---|---|---|---|---|---|---|---|
|
Area |
Hepatitis, viral, acute |
HIV diagnoses† |
Influenza-associated pediatric mortality§ |
Legionellosis |
Listeriosis |
||
|
A |
B |
C |
|||||
|
United States |
1,670 |
3,374 |
849 |
35,741 |
61 |
3,346 |
821 |
|
New England |
95 |
55 |
54 |
1,023 |
1 |
274 |
54 |
|
Connecticut |
29 |
22 |
37 |
356 |
1 |
56 |
18 |
|
Maine |
7 |
13 |
2 |
55 |
— |
12 |
1 |
|
Massachusetts |
48 |
13 |
13 |
446 |
— |
131 |
26 |
|
New Hampshire |
2 |
5 |
N |
51 |
— |
23 |
2 |
|
Rhode Island |
9 |
U |
U |
108 |
— |
43 |
3 |
|
Vermont |
— |
2 |
2 |
7 |
— |
9 |
4 |
|
Mid. Atlantic |
276 |
288 |
104 |
6,011 |
16 |
939 |
182 |
|
New Jersey |
76 |
77 |
28 |
941 |
— |
151 |
39 |
|
New York (Upstate) |
59 |
60 |
47 |
1,461 |
10 |
300 |
52 |
|
New York City |
88 |
79 |
3 |
2,232 |
4 |
164 |
45 |
|
Pennsylvania |
53 |
72 |
26 |
1,377 |
2 |
324 |
46 |
|
E.N. Central |
203 |
481 |
93 |
3,299 |
5 |
679 |
119 |
|
Illinois |
48 |
135 |
1 |
1,068 |
3 |
149 |
26 |
|
Indiana |
12 |
75 |
27 |
413 |
— |
56 |
15 |
|
Michigan |
73 |
122 |
45 |
650 |
1 |
179 |
31 |
|
Ohio |
47 |
95 |
10 |
913 |
— |
232 |
29 |
|
Wisconsin |
23 |
54 |
10 |
255 |
1 |
63 |
18 |
|
W.N. Central |
102 |
130 |
26 |
1,225 |
— |
128 |
30 |
|
Iowa |
11 |
15 |
— |
108 |
— |
15 |
3 |
|
Kansas |
14 |
11 |
2 |
110 |
— |
12 |
1 |
|
Minnesota |
37 |
23 |
16 |
336 |
— |
40 |
8 |
|
Missouri |
21 |
67 |
6 |
533 |
— |
37 |
12 |
|
Nebraska |
14 |
12 |
2 |
95 |
— |
9 |
2 |
|
North Dakota |
4 |
— |
— |
11 |
— |
6 |
1 |
|
South Dakota |
1 |
2 |
— |
32 |
— |
9 |
3 |
|
S. Atlantic |
351 |
913 |
188 |
11,054 |
8 |
562 |
144 |
|
Delaware |
7 |
24 |
U |
122 |
— |
18 |
4 |
|
District of Columbia |
1 |
3 |
2 |
638 |
— |
19 |
1 |
|
Florida |
139 |
297 |
56 |
4,862 |
2 |
172 |
54 |
|
Georgia |
40 |
165 |
32 |
1,170 |
5 |
65 |
20 |
|
Maryland |
23 |
67 |
24 |
1,195 |
1 |
113 |
11 |
|
North Carolina |
48 |
113 |
39 |
1,324 |
— |
64 |
22 |
|
South Carolina |
26 |
59 |
1 |
750 |
— |
16 |
13 |
|
Virginia |
52 |
97 |
13 |
918 |
— |
79 |
13 |
|
West Virginia |
15 |
88 |
21 |
75 |
— |
16 |
6 |
|
E.S. Central |
48 |
387 |
162 |
2,152 |
3 |
136 |
34 |
|
Alabama |
8 |
68 |
7 |
570 |
— |
22 |
6 |
|
Kentucky |
26 |
136 |
109 |
270 |
— |
30 |
9 |
|
Mississippi |
2 |
33 |
U |
486 |
2 |
12 |
5 |
|
Tennessee |
12 |
150 |
46 |
826 |
1 |
72 |
14 |
|
W.S. Central |
158 |
630 |
81 |
4,845 |
14 |
181 |
84 |
|
Arkansas |
2 |
66 |
1 |
202 |
— |
19 |
4 |
|
Louisiana |
11 |
55 |
4 |
1,164 |
2 |
11 |
18 |
|
Oklahoma |
6 |
115 |
41 |
247 |
1 |
15 |
9 |
|
Texas |
139 |
394 |
35 |
3,232 |
11 |
136 |
53 |
|
Mountain |
144 |
135 |
66 |
1,568 |
7 |
173 |
31 |
|
Arizona |
61 |
26 |
U |
544 |
2 |
65 |
10 |
|
Colorado |
36 |
46 |
20 |
408 |
4 |
31 |
9 |
|
Idaho |
8 |
6 |
11 |
36 |
— |
8 |
— |
|
Montana |
4 |
— |
4 |
12 |
— |
5 |
1 |
|
Nevada |
14 |
41 |
7 |
344 |
— |
20 |
1 |
|
New Mexico |
5 |
5 |
14 |
135 |
1 |
9 |
6 |
|
Utah |
12 |
8 |
10 |
68 |
— |
27 |
3 |
|
Wyoming |
4 |
3 |
— |
21 |
— |
8 |
1 |
|
Pacific |
293 |
355 |
75 |
4,564 |
7 |
274 |
143 |
|
Alaska |
5 |
5 |
U |
35 |
— |
2 |
1 |
|
California |
242 |
252 |
31 |
3,786 |
6 |
224 |
94 |
|
Hawaii |
8 |
6 |
U |
51 |
— |
2 |
8 |
|
Oregon |
17 |
42 |
19 |
198 |
1 |
16 |
16 |
|
Washington |
21 |
50 |
25 |
494 |
— |
30 |
24 |
|
Territories |
|||||||
|
American Samoa |
— |
— |
— |
— |
— |
N |
N |
|
C.N.M.I. |
— |
— |
— |
— |
— |
— |
— |
|
Guam |
4 |
77 |
61 |
— |
— |
1 |
— |
|
Puerto Rico |
20 |
29 |
N |
479 |
— |
2 |
— |
|
U.S. Virgin Islands |
— |
— |
— |
16 |
— |
— |
— |
|
N: Not reportable. U: Unavailable. —: No reported cases. C.N.M.I.: Commonwealth of Northern Mariana Islands. † Data on human immunodeficiency virus (HIV) diagnoses include persons with a diagnosis of HIV infection regardless of stage of disease (i.e., AIDS status) at diagnosis. Total number of HIV diagnoses case counts was reported to the Division of HIV/AIDS Prevention, National Center for HIV/AIDS, Viral Hepatitis, STD, and TB Prevention (NCHHSTP) through December 31, 2010. § Totals reported to the Division of Influenza, National Center for Immunization and Respiratory Diseases (NCIRD), as of December 31, 2010. |
|||||||
|
TABLE 2. (Continued) Reported cases of notifiable diseases,* by geographic division and area — United States, 2010 |
|||||||||
|---|---|---|---|---|---|---|---|---|---|
|
Area |
Lyme disease |
Malaria |
Measles |
||||||
|
Total |
Confirmed |
Probable |
Total |
Indigenous |
Imported† |
||||
|
United States |
30,158 |
22,561 |
7,597 |
1,773 |
63 |
23 |
40 |
||
|
New England |
8,958 |
6,119 |
2,839 |
124 |
4 |
2 |
2 |
||
|
Connecticut |
3,068 |
1,964 |
1,104 |
22 |
1 |
1 |
— |
||
|
Maine |
751 |
559 |
192 |
6 |
— |
— |
— |
||
|
Massachusetts |
3,263 |
2,380 |
883 |
73 |
3 |
1 |
2 |
||
|
New Hampshire |
1,339 |
830 |
509 |
5 |
— |
— |
— |
||
|
Rhode Island |
181 |
115 |
66 |
15 |
— |
— |
— |
||
|
Vermont |
356 |
271 |
85 |
3 |
— |
— |
— |
||
|
Mid. Atlantic |
10,942 |
9,003 |
1,939 |
519 |
10 |
— |
10 |
||
|
New Jersey |
3,712 |
3,320 |
392 |
106 |
— |
— |
— |
||
|
New York (Upstate) |
2,698 |
1,972 |
726 |
81 |
2 |
— |
2 |
||
|
New York City |
727 |
413 |
314 |
271 |
6 |
— |
6 |
||
|
Pennsylvania |
3,805 |
3,298 |
507 |
61 |
2 |
— |
2 |
||
|
E.N. Central |
3,840 |
2,799 |
1,041 |
164 |
2 |
1 |
1 |
||
|
Illinois |
135 |
135 |
— |
60 |
— |
— |
— |
||
|
Indiana |
78 |
62 |
16 |
15 |
— |
— |
— |
||
|
Michigan |
95 |
76 |
19 |
31 |
— |
— |
— |
||
|
Ohio |
44 |
21 |
23 |
43 |
2 |
1 |
1 |
||
|
Wisconsin |
3,488 |
2,505 |
983 |
15 |
— |
— |
— |
||
|
W.N. Central |
2,101 |
1,401 |
700 |
115 |
6 |
5 |
1 |
||
|
Iowa |
85 |
68 |
17 |
14 |
— |
— |
— |
||
|
Kansas |
10 |
7 |
3 |
13 |
— |
— |
— |
||
|
Minnesota |
1,960 |
1,293 |
667 |
48 |
3 |
2 |
1 |
||
|
Missouri |
4 |
4 |
— |
21 |
3 |
3 |
— |
||
|
Nebraska |
8 |
7 |
1 |
15 |
— |
— |
— |
||
|
North Dakota |
33 |
21 |
12 |
1 |
— |
— |
— |
||
|
South Dakota |
1 |
1 |
— |
3 |
— |
— |
— |
||
|
S. Atlantic |
3,910 |
2,998 |
912 |
452 |
5 |
1 |
4 |
||
|
Delaware |
656 |
656 |
— |
2 |
— |
— |
— |
||
|
District of Columbia |
42 |
34 |
8 |
13 |
— |
— |
— |
||
|
Florida |
84 |
56 |
28 |
139 |
1 |
— |
1 |
||
|
Georgia |
10 |
10 |
— |
71 |
1 |
— |
1 |
||
|
Maryland |
1,617 |
1,163 |
454 |
99 |
— |
— |
— |
||
|
North Carolina |
82 |
21 |
61 |
52 |
— |
— |
— |
||
|
South Carolina |
29 |
19 |
10 |
6 |
— |
— |
— |
||
|
Virginia |
1,245 |
911 |
334 |
67 |
3 |
1 |
2 |
||
|
West Virginia |
145 |
128 |
17 |
3 |
— |
— |
— |
||
|
E.S. Central |
43 |
12 |
31 |
31 |
1 |
— |
1 |
||
|
Alabama |
2 |
1 |
1 |
9 |
— |
— |
— |
||
|
Kentucky |
5 |
5 |
— |
8 |
1 |
— |
1 |
||
|
Mississippi |
— |
— |
— |
2 |
— |
— |
— |
||
|
Tennessee |
36 |
6 |
30 |
12 |
— |
— |
— |
||
|
W.S. Central |
145 |
57 |
88 |
113 |
— |
— |
— |
||
|
Arkansas |
— |
— |
— |
4 |
— |
— |
— |
||
|
Louisiana |
3 |
2 |
1 |
5 |
— |
— |
— |
||
|
Oklahoma |
— |
— |
— |
6 |
— |
— |
— |
||
|
Texas |
142 |
55 |
87 |
98 |
— |
— |
— |
||
|
Mountain |
28 |
20 |
8 |
67 |
3 |
1 |
2 |
||
|
Arizona |
2 |
2 |
— |
28 |
1 |
— |
1 |
||
|
Colorado |
3 |
1 |
2 |
21 |
— |
— |
— |
||
|
Idaho |
9 |
6 |
3 |
5 |
— |
— |
— |
||
|
Montana |
4 |
3 |
1 |
3 |
— |
— |
— |
||
|
Nevada |
2 |
2 |
— |
6 |
1 |
— |
1 |
||
|
New Mexico |
5 |
3 |
2 |
1 |
— |
— |
— |
||
|
Utah |
3 |
3 |
— |
3 |
— |
— |
— |
||
|
Wyoming |
— |
— |
— |
— |
1 |
1 |
— |
||
|
Pacific |
191 |
152 |
39 |
188 |
32 |
13 |
19 |
||
|
Alaska |
7 |
7 |
— |
5 |
— |
— |
— |
||
|
California |
129 |
126 |
3 |
126 |
27 |
9 |
18 |
||
|
Hawaii |
N |
N |
N |
4 |
4 |
4 |
— |
||
|
Oregon |
39 |
7 |
32 |
14 |
— |
— |
— |
||
|
Washington |
16 |
12 |
4 |
39 |
1 |
— |
1 |
||
|
Territories |
|||||||||
|
American Samoa |
N |
N |
N |
— |
— |
— |
— |
||
|
C.N.M.I. |
— |
— |
— |
— |
— |
— |
— |
||
|
Guam |
— |
— |
— |
— |
— |
— |
— |
||
|
Puerto Rico |
N |
N |
N |
5 |
— |
— |
— |
||
|
U.S. Virgin Islands |
— |
— |
— |
— |
— |
— |
— |
||
|
N: Not reportable. U: Unavailable. —: No reported cases. C.N.M.I.: Commonwealth of Northern Mariana Islands. † Imported cases include only those directly related to importation from other countries. |
|||||||||
|
TABLE 2. (Continued) Reported cases of notifiable diseases,* by geographic division and area — United States, 2010 |
|||||||
|---|---|---|---|---|---|---|---|
|
Area |
Meningococcal disease |
Mumps |
Novel influenza A virus infections† |
||||
|
All serogroups |
Serogroup A, C, Y, and W-135 |
Serogroup B |
Other serogroup |
Unknown serogroup |
|||
|
United States |
833 |
280 |
135 |
12 |
406 |
2,612 |
4 |
|
New England |
21 |
8 |
9 |
— |
4 |
25 |
— |
|
Connecticut |
3 |
2 |
— |
— |
1 |
11 |
— |
|
Maine |
5 |
1 |
3 |
— |
1 |
2 |
— |
|
Massachusetts |
7 |
3 |
3 |
— |
1 |
9 |
— |
|
New Hampshire |
— |
— |
— |
— |
— |
3 |
— |
|
Rhode Island |
1 |
— |
1 |
— |
— |
— |
— |
|
Vermont |
5 |
2 |
2 |
— |
1 |
— |
— |
|
Mid. Atlantic |
83 |
10 |
8 |
— |
65 |
2,147 |
1 |
|
New Jersey |
23 |
— |
— |
— |
23 |
354 |
— |
|
New York (Upstate) |
14 |
7 |
6 |
— |
1 |
663 |
— |
|
New York City |
20 |
— |
— |
— |
20 |
1,061 |
— |
|
Pennsylvania |
26 |
3 |
2 |
— |
21 |
69 |
1 |
|
E.N. Central |
137 |
56 |
34 |
1 |
46 |
84 |
1 |
|
Illinois |
24 |
— |
— |
— |
24 |
31 |
— |
|
Indiana |
33 |
23 |
8 |
— |
2 |
4 |
— |
|
Michigan |
24 |
8 |
6 |
— |
10 |
20 |
— |
|
Ohio |
35 |
14 |
12 |
— |
9 |
24 |
— |
|
Wisconsin |
21 |
11 |
8 |
1 |
1 |
5 |
1 |
|
W.N. Central |
58 |
20 |
7 |
1 |
30 |
86 |
2 |
|
Iowa |
10 |
7 |
2 |
1 |
— |
38 |
— |
|
Kansas |
8 |
1 |
4 |
— |
3 |
5 |
— |
|
Minnesota |
9 |
8 |
1 |
— |
— |
8 |
2 |
|
Missouri |
23 |
— |
— |
— |
23 |
10 |
— |
|
Nebraska |
6 |
3 |
— |
— |
3 |
23 |
— |
|
North Dakota |
2 |
1 |
— |
— |
1 |
— |
— |
|
South Dakota |
— |
— |
— |
— |
— |
2 |
— |
|
S. Atlantic |
134 |
71 |
27 |
5 |
31 |
59 |
— |
|
Delaware |
2 |
— |
— |
— |
2 |
— |
— |
|
District of Columbia |
1 |
— |
— |
— |
1 |
3 |
— |
|
Florida |
60 |
33 |
9 |
2 |
16 |
10 |
— |
|
Georgia |
12 |
5 |
5 |
— |
2 |
5 |
— |
|
Maryland |
9 |
5 |
3 |
1 |
— |
12 |
— |
|
North Carolina |
14 |
11 |
1 |
1 |
1 |
10 |
— |
|
South Carolina |
12 |
9 |
2 |
1 |
— |
4 |
— |
|
Virginia |
21 |
6 |
6 |
— |
9 |
13 |
— |
|
West Virginia |
3 |
2 |
1 |
— |
— |
2 |
— |
|
E.S. Central |
45 |
14 |
8 |
1 |
22 |
10 |
— |
|
Alabama |
9 |
6 |
3 |
— |
— |
6 |
— |
|
Kentucky |
18 |
— |
— |
— |
18 |
1 |
— |
|
Mississippi |
5 |
1 |
2 |
1 |
1 |
— |
— |
|
Tennessee |
13 |
7 |
3 |
— |
3 |
3 |
— |
|
W.S. Central |
100 |
40 |
24 |
2 |
34 |
135 |
— |
|
Arkansas |
6 |
4 |
2 |
— |
— |
5 |
— |
|
Louisiana |
17 |
— |
— |
— |
17 |
8 |
— |
|
Oklahoma |
18 |
12 |
3 |
2 |
1 |
1 |
— |
|
Texas |
59 |
24 |
19 |
— |
16 |
121 |
— |
|
Mountain |
58 |
40 |
11 |
2 |
5 |
21 |
— |
|
Arizona |
14 |
8 |
5 |
— |
1 |
5 |
— |
|
Colorado |
21 |
18 |
2 |
1 |
— |
8 |
— |
|
Idaho |
5 |
4 |
1 |
— |
— |
1 |
— |
|
Montana |
2 |
2 |
— |
— |
— |
— |
— |
|
Nevada |
8 |
3 |
2 |
1 |
2 |
1 |
— |
|
New Mexico |
4 |
3 |
— |
— |
1 |
2 |
— |
|
Utah |
1 |
1 |
— |
— |
— |
3 |
— |
|
Wyoming |
3 |
1 |
1 |
— |
1 |
1 |
— |
|
Pacific |
197 |
21 |
7 |
— |
169 |
45 |
— |
|
Alaska |
1 |
— |
— |
— |
1 |
1 |
— |
|
California |
131 |
— |
— |
— |
131 |
29 |
— |
|
Hawaii |
1 |
1 |
— |
— |
— |
5 |
— |
|
Oregon |
33 |
— |
— |
— |
33 |
3 |
— |
|
Washington |
31 |
20 |
7 |
— |
4 |
7 |
— |
|
Territories |
|||||||
|
American Samoa |
— |
— |
— |
— |
— |
— |
— |
|
C.N.M.I. |
— |
— |
— |
— |
— |
— |
— |
|
Guam |
— |
— |
— |
— |
— |
502 |
— |
|
Puerto Rico |
2 |
— |
— |
— |
2 |
1 |
— |
|
U.S. Virgin Islands |
— |
— |
— |
— |
— |
— |
— |
|
N: Not reportable. U: Unavailable. —: No reported cases. C.N.M.I.: Commonwealth of Northern Mariana Islands. † Totals reported to the Influenza Division, National Center for Immunization and Respiratory Diseases (NCIRD), as of December 31, 2010. |
|||||||
|
TABLE 2. (Continued) Reported cases of notifiable diseases,* by geographic division and area — United States, 2010 |
||||||||
|---|---|---|---|---|---|---|---|---|
|
Area |
Pertussis |
Plague |
Psittacosis |
Q Fever |
Rabies |
|||
|
Total |
Acute |
Chronic |
Animal |
Human |
||||
|
United States |
27,550 |
2 |
4 |
131 |
106 |
25 |
4,331 |
2 |
|
New England |
529 |
— |
— |
— |
— |
— |
306 |
— |
|
Connecticut |
107 |
— |
N |
— |
— |
— |
145 |
— |
|
Maine |
53 |
— |
— |
— |
— |
— |
62 |
— |
|
Massachusetts |
284 |
— |
— |
— |
— |
— |
— |
— |
|
New Hampshire |
23 |
— |
— |
N |
N |
N |
17 |
— |
|
Rhode Island |
44 |
— |
— |
— |
— |
— |
29 |
— |
|
Vermont |
18 |
— |
— |
N |
N |
N |
53 |
— |
|
Mid. Atlantic |
1,980 |
— |
1 |
21 |
15 |
6 |
1,051 |
— |
|
New Jersey |
169 |
— |
— |
8 |
6 |
2 |
— |
— |
|
New York (Upstate) |
721 |
— |
— |
6 |
5 |
1 |
498 |
— |
|
New York City |
111 |
— |
— |
3 |
1 |
2 |
145 |
— |
|
Pennsylvania |
979 |
— |
1 |
4 |
3 |
1 |
408 |
— |
|
E.N. Central |
5,758 |
— |
1 |
17 |
11 |
6 |
234 |
1 |
|
Illinois |
1,057 |
— |
— |
6 |
4 |
2 |
115 |
— |
|
Indiana |
747 |
— |
— |
— |
— |
— |
— |
— |
|
Michigan |
1,564 |
— |
— |
5 |
3 |
2 |
72 |
— |
|
Ohio |
1,807 |
— |
1 |
1 |
— |
1 |
47 |
— |
|
Wisconsin |
583 |
— |
— |
5 |
4 |
1 |
N |
1 |
|
W.N. Central |
2,924 |
— |
— |
16 |
11 |
5 |
283 |
— |
|
Iowa |
697 |
— |
— |
N |
N |
N |
27 |
— |
|
Kansas |
182 |
— |
— |
4 |
4 |
— |
60 |
— |
|
Minnesota |
1,140 |
— |
— |
1 |
1 |
— |
59 |
— |
|
Missouri |
604 |
— |
— |
3 |
2 |
1 |
63 |
— |
|
Nebraska |
214 |
— |
— |
3 |
— |
3 |
52 |
— |
|
North Dakota |
58 |
— |
— |
1 |
— |
1 |
22 |
— |
|
South Dakota |
29 |
— |
— |
4 |
4 |
— |
— |
— |
|
S. Atlantic |
2,030 |
— |
— |
9 |
8 |
1 |
1,134 |
— |
|
Delaware |
15 |
— |
— |
— |
— |
— |
— |
— |
|
District of Columbia |
16 |
— |
— |
1 |
1 |
— |
— |
— |
|
Florida |
328 |
— |
— |
2 |
2 |
— |
121 |
— |
|
Georgia |
247 |
— |
— |
2 |
2 |
— |
— |
— |
|
Maryland |
139 |
— |
— |
1 |
1 |
— |
362 |
— |
|
North Carolina |
343 |
— |
— |
1 |
1 |
— |
— |
— |
|
South Carolina |
392 |
— |
— |
— |
— |
— |
N |
— |
|
Virginia |
384 |
— |
— |
2 |
1 |
1 |
573 |
— |
|
West Virginia |
166 |
— |
— |
— |
— |
— |
78 |
— |
|
E.S. Central |
848 |
— |
— |
2 |
2 |
— |
170 |
— |
|
Alabama |
206 |
N |
— |
— |
— |
— |
69 |
— |
|
Kentucky |
303 |
— |
— |
— |
— |
— |
21 |
— |
|
Mississippi |
106 |
— |
— |
— |
— |
— |
— |
— |
|
Tennessee |
233 |
— |
— |
2 |
2 |
— |
80 |
— |
|
W.S. Central |
3,341 |
— |
— |
16 |
14 |
2 |
869 |
1 |
|
Arkansas |
245 |
— |
— |
4 |
4 |
— |
34 |
— |
|
Louisiana |
50 |
— |
— |
— |
— |
— |
— |
1 |
|
Oklahoma |
198 |
— |
— |
— |
— |
— |
62 |
— |
|
Texas |
2,848 |
— |
N |
12 |
10 |
2 |
773 |
— |
|
Mountain |
1,940 |
— |
— |
17 |
14 |
3 |
66 |
— |
|
Arizona |
546 |
— |
— |
4 |
3 |
1 |
N |
— |
|
Colorado |
540 |
— |
— |
4 |
4 |
— |
— |
— |
|
Idaho |
187 |
— |
— |
— |
— |
— |
11 |
— |
|
Montana |
121 |
— |
— |
1 |
— |
1 |
N |
— |
|
Nevada |
38 |
— |
— |
3 |
3 |
— |
8 |
— |
|
New Mexico |
144 |
— |
— |
4 |
4 |
— |
13 |
— |
|
Utah |
352 |
— |
— |
— |
— |
— |
10 |
— |
|
Wyoming |
12 |
— |
— |
1 |
— |
1 |
24 |
— |
|
Pacific |
8,200 |
2 |
2 |
33 |
31 |
2 |
218 |
— |
|
Alaska |
45 |
— |
— |
— |
— |
— |
12 |
— |
|
California |
7,195 |
— |
2 |
26 |
26 |
— |
175 |
— |
|
Hawaii |
67 |
— |
— |
— |
— |
— |
— |
— |
|
Oregon |
286 |
2 |
— |
4 |
4 |
— |
17 |
— |
|
Washington |
607 |
— |
— |
3 |
1 |
2 |
14 |
— |
|
Territories |
||||||||
|
American Samoa |
— |
— |
N |
N |
N |
N |
N |
N |
|
C.N.M.I. |
— |
— |
— |
— |
— |
— |
— |
— |
|
Guam |
3 |
— |
— |
— |
— |
N |
— |
— |
|
Puerto Rico |
4 |
— |
N |
— |
— |
— |
41 |
— |
|
U.S. Virgin Islands |
— |
— |
— |
— |
— |
— |
— |
— |
|
N: Not reportable. U: Unavailable. —: No reported cases. C.N.M.I.: Commonwealth of Northern Mariana Islands. |
||||||||
|
TABLE 2. (Continued) Reported cases of notifiable diseases,* by geographic division and area — United States, 2010 |
|||||||
|---|---|---|---|---|---|---|---|
|
Area |
Rubella |
Salmonellosis |
Shiga toxin-producing E. Coli (STEC)† |
Shigellosis |
Spotted Fever Rickettsiosis§ |
||
|
Total |
Confirmed |
Probable |
|||||
|
United States |
5 |
54,424 |
5,476 |
14,786 |
1,985 |
156 |
1,835 |
|
New England |
— |
2,341 |
210 |
319 |
5 |
— |
5 |
|
Connecticut |
— |
491 |
60 |
69 |
— |
— |
— |
|
Maine |
— |
133 |
21 |
8 |
2 |
— |
2 |
|
Massachusetts |
— |
1,284 |
83 |
211 |
— |
— |
— |
|
New Hampshire |
— |
177 |
21 |
14 |
1 |
— |
1 |
|
Rhode Island |
— |
175 |
3 |
16 |
2 |
— |
2 |
|
Vermont |
— |
81 |
22 |
1 |
— |
— |
— |
|
Mid. Atlantic |
— |
5,853 |
579 |
1,684 |
106 |
2 |
104 |
|
New Jersey |
— |
1,203 |
128 |
372 |
61 |
1 |
60 |
|
New York (Upstate) |
— |
1,448 |
211 |
235 |
19 |
1 |
18 |
|
New York City |
— |
1,309 |
79 |
300 |
11 |
— |
11 |
|
Pennsylvania |
— |
1,893 |
161 |
777 |
15 |
— |
15 |
|
E.N. Central |
— |
5,850 |
812 |
1,548 |
88 |
4 |
78 |
|
Illinois |
— |
1,982 |
156 |
841 |
37 |
3 |
34 |
|
Indiana |
— |
770 |
143 |
64 |
27 |
1 |
20 |
|
Michigan |
— |
933 |
155 |
260 |
2 |
— |
2 |
|
Ohio |
— |
1,311 |
137 |
309 |
15 |
— |
15 |
|
Wisconsin |
— |
854 |
221 |
74 |
7 |
— |
7 |
|
W.N. Central |
— |
3,008 |
911 |
2,070 |
291 |
13 |
291 |
|
Iowa |
— |
530 |
170 |
57 |
5 |
— |
5 |
|
Kansas |
— |
435 |
77 |
302 |
— |
— |
13 |
|
Minnesota |
— |
711 |
290 |
66 |
2 |
— |
2 |
|
Missouri |
— |
843 |
236 |
1,582 |
278 |
10 |
268 |
|
Nebraska |
— |
244 |
82 |
56 |
5 |
3 |
2 |
|
North Dakota |
— |
59 |
21 |
— |
1 |
— |
1 |
|
South Dakota |
— |
186 |
35 |
7 |
— |
— |
— |
|
S. Atlantic |
2 |
15,891 |
759 |
2,784 |
594 |
82 |
512 |
|
Delaware |
— |
177 |
6 |
39 |
22 |
1 |
21 |
|
District of Columbia |
— |
94 |
9 |
35 |
1 |
1 |
— |
|
Florida |
— |
6,282 |
239 |
1,212 |
14 |
3 |
11 |
|
Georgia |
— |
2,785 |
102 |
789 |
57 |
57 |
— |
|
Maryland |
— |
1,089 |
107 |
130 |
49 |
— |
49 |
|
North Carolina |
— |
2,345 |
97 |
253 |
286 |
15 |
271 |
|
South Carolina |
— |
1,715 |
24 |
70 |
20 |
1 |
19 |
|
Virginia |
2 |
1,210 |
149 |
145 |
145 |
4 |
141 |
|
West Virginia |
— |
194 |
26 |
111 |
— |
— |
— |
|
E.S. Central |
— |
3,969 |
276 |
790 |
425 |
20 |
404 |
|
Alabama |
— |
1,064 |
56 |
239 |
83 |
5 |
78 |
|
Kentucky |
— |
587 |
70 |
221 |
6 |
6 |
— |
|
Mississippi |
— |
1,218 |
30 |
60 |
26 |
1 |
25 |
|
Tennessee |
— |
1,100 |
120 |
270 |
310 |
8 |
301 |
|
W.S. Central |
— |
7,838 |
524 |
3,412 |
435 |
15 |
420 |
|
Arkansas |
— |
794 |
48 |
82 |
162 |
4 |
158 |
|
Louisiana |
— |
1,361 |
21 |
288 |
3 |
— |
3 |
|
Oklahoma |
— |
754 |
104 |
416 |
236 |
8 |
228 |
|
Texas |
— |
4,929 |
351 |
2,626 |
34 |
3 |
31 |
|
Mountain |
1 |
2,898 |
676 |
858 |
32 |
12 |
20 |
|
Arizona |
1 |
996 |
100 |
465 |
17 |
9 |
8 |
|
Colorado |
— |
579 |
219 |
96 |
2 |
1 |
1 |
|
Idaho |
— |
168 |
112 |
23 |
5 |
— |
5 |
|
Montana |
— |
95 |
42 |
9 |
3 |
2 |
1 |
|
Nevada |
— |
307 |
41 |
49 |
— |
— |
— |
|
New Mexico |
— |
339 |
49 |
166 |
1 |
— |
1 |
|
Utah |
— |
350 |
94 |
50 |
3 |
— |
3 |
|
Wyoming |
— |
64 |
19 |
— |
1 |
— |
1 |
|
Pacific |
2 |
6,776 |
729 |
1,321 |
9 |
8 |
1 |
|
Alaska |
— |
81 |
2 |
2 |
N |
— |
— |
|
California |
1 |
5,073 |
354 |
1,098 |
7 |
7 |
— |
|
Hawaii |
— |
331 |
29 |
50 |
N |
N |
N |
|
Oregon |
— |
511 |
118 |
59 |
1 |
— |
1 |
|
Washington |
1 |
780 |
226 |
112 |
1 |
1 |
— |
|
Territories |
|||||||
|
American Samoa |
— |
2 |
— |
4 |
N |
N |
N |
|
C.N.M.I. |
— |
— |
— |
— |
— |
— |
— |
|
Guam |
— |
11 |
— |
5 |
N |
N |
N |
|
Puerto Rico |
— |
622 |
— |
7 |
N |
N |
N |
|
U.S. Virgin Islands |
— |
— |
— |
— |
— |
— |
— |
|
N: Not reportable. U: Unavailable. —: No reported cases. C.N.M.I.: Commonwealth of Northern Mariana Islands. † Includes E. coli O157:H7; shiga toxin-positive, serogroup non-O157; and shiga toxin positive, not serogrouped. § Total case count includes 7 unknown case status reports. Revision of national surveillance case definition. |
|||||||
|
TABLE 2. (Continued) Reported cases of notifiable diseases,* by geographic division and area — United States, 2010 |
||||||||
|---|---|---|---|---|---|---|---|---|
|
Area |
Streptococcal toxic-shock syndrome |
Streptococcus pneumoniae, invasive disease† |
Syphilis§ |
Tetanus |
Toxic-shock syndrome |
|||
|
All ages |
Age <5 yrs |
All stages |
Congenital (age <1 yr) |
Primary and secondary |
||||
|
United States |
142 |
16,569 |
2,186 |
45,834 |
377 |
13,774 |
26 |
82 |
|
New England |
10 |
942 |
107 |
1,040 |
3 |
482 |
— |
1 |
|
Connecticut |
N |
389 |
30 |
234 |
2 |
98 |
— |
N |
|
Maine |
N |
130 |
10 |
41 |
— |
32 |
— |
N |
|
Massachusetts |
4 |
71 |
47 |
639 |
1 |
285 |
— |
— |
|
New Hampshire |
1 |
145 |
6 |
43 |
— |
22 |
— |
1 |
|
Rhode Island |
1 |
123 |
8 |
79 |
— |
41 |
— |
— |
|
Vermont |
4 |
84 |
6 |
4 |
— |
4 |
— |
— |
|
Mid. Atlantic |
29 |
1,701 |
262 |
6,813 |
22 |
1,711 |
3 |
12 |
|
New Jersey |
8 |
754 |
64 |
947 |
3 |
244 |
1 |
2 |
|
New York (Upstate) |
15 |
155 |
120 |
724 |
16 |
146 |
1 |
5 |
|
New York City |
— |
792 |
78 |
4,135 |
— |
952 |
— |
— |
|
Pennsylvania |
6 |
N |
N |
1,007 |
3 |
369 |
1 |
5 |
|
E.N. Central |
26 |
3,299 |
375 |
4,590 |
40 |
1,895 |
7 |
21 |
|
Illinois |
— |
N |
100 |
2,236 |
27 |
908 |
2 |
3 |
|
Indiana |
11 |
781 |
55 |
412 |
— |
175 |
— |
2 |
|
Michigan |
2 |
744 |
82 |
680 |
2 |
235 |
2 |
11 |
|
Ohio |
12 |
1,227 |
100 |
1,076 |
10 |
528 |
1 |
4 |
|
Wisconsin |
1 |
547 |
38 |
186 |
1 |
49 |
2 |
1 |
|
W.N. Central |
10 |
875 |
157 |
1,091 |
2 |
358 |
3 |
5 |
|
Iowa |
— |
N |
N |
68 |
— |
19 |
1 |
1 |
|
Kansas |
— |
N |
N |
110 |
— |
19 |
— |
— |
|
Minnesota |
6 |
649 |
87 |
350 |
— |
149 |
— |
— |
|
Missouri |
4 |
N |
40 |
512 |
2 |
152 |
2 |
2 |
|
Nebraska |
— |
139 |
16 |
33 |
— |
12 |
— |
2 |
|
North Dakota |
— |
87 |
3 |
6 |
— |
3 |
— |
— |
|
South Dakota |
N |
N |
11 |
12 |
— |
4 |
— |
— |
|
S. Atlantic |
24 |
4,282 |
577 |
10,608 |
73 |
3,286 |
7 |
12 |
|
Delaware |
— |
50 |
2 |
44 |
2 |
9 |
— |
— |
|
District of Columbia |
— |
78 |
9 |
495 |
1 |
134 |
— |
— |
|
Florida |
N |
1,509 |
204 |
4,069 |
19 |
1,184 |
5 |
N |
|
Georgia |
— |
1,461 |
162 |
2,347 |
18 |
795 |
— |
5 |
|
Maryland |
N |
526 |
53 |
1,015 |
22 |
328 |
1 |
N |
|
North Carolina |
10 |
N |
N |
1,233 |
10 |
396 |
1 |
2 |
|
South Carolina |
— |
519 |
56 |
579 |
— |
155 |
— |
3 |
|
Virginia |
10 |
N |
59 |
800 |
1 |
279 |
— |
2 |
|
West Virginia |
4 |
139 |
32 |
26 |
— |
6 |
— |
— |
|
E.S. Central |
14 |
1,289 |
126 |
3,108 |
29 |
904 |
1 |
5 |
|
Alabama |
N |
N |
N |
781 |
9 |
260 |
— |
2 |
|
Kentucky |
14 |
205 |
12 |
311 |
— |
139 |
1 |
— |
|
Mississippi |
N |
N |
19 |
823 |
9 |
228 |
— |
N |
|
Tennessee |
— |
1,084 |
95 |
1,193 |
11 |
277 |
— |
3 |
|
W.S. Central |
1 |
2,263 |
331 |
9,701 |
147 |
2,073 |
2 |
3 |
|
Arkansas |
— |
194 |
22 |
534 |
11 |
205 |
1 |
2 |
|
Louisiana |
1 |
157 |
28 |
2,484 |
33 |
546 |
1 |
1 |
|
Oklahoma |
N |
N |
55 |
272 |
— |
92 |
— |
N |
|
Texas |
N |
1,912 |
226 |
6,411 |
103 |
1,230 |
— |
N |
|
Mountain |
27 |
1,804 |
234 |
1,973 |
22 |
625 |
3 |
9 |
|
Arizona |
— |
823 |
105 |
904 |
15 |
230 |
2 |
3 |
|
Colorado |
1 |
546 |
63 |
342 |
— |
138 |
— |
4 |
|
Idaho |
— |
N |
8 |
20 |
1 |
6 |
— |
— |
|
Montana |
N |
N |
N |
5 |
— |
3 |
1 |
N |
|
Nevada |
2 |
N |
N |
412 |
5 |
130 |
— |
— |
|
New Mexico |
— |
174 |
20 |
151 |
— |
53 |
— |
— |
|
Utah |
24 |
232 |
34 |
133 |
1 |
65 |
— |
2 |
|
Wyoming |
— |
29 |
4 |
6 |
— |
— |
— |
— |
|
Pacific |
1 |
114 |
17 |
6,910 |
39 |
2,440 |
— |
14 |
|
Alaska |
— |
110 |
17 |
15 |
— |
3 |
— |
N |
|
California |
N |
N |
N |
6,114 |
38 |
2,065 |
— |
14 |
|
Hawaii |
1 |
4 |
— |
73 |
— |
35 |
— |
N |
|
Oregon |
N |
N |
N |
173 |
— |
71 |
— |
N |
|
Washington |
N |
N |
N |
535 |
1 |
266 |
— |
N |
|
Territories |
||||||||
|
American Samoa |
— |
N |
— |
— |
— |
— |
— |
N |
|
C.N.M.I. |
— |
— |
— |
— |
— |
— |
— |
— |
|
Guam |
— |
— |
— |
11 |
— |
1 |
— |
— |
|
Puerto Rico |
N |
— |
— |
723 |
2 |
228 |
2 |
N |
|
U.S. Virgin Islands |
— |
— |
— |
4 |
— |
— |
— |
— |
|
N: Not reportable. U: Unavailable. —: No reported cases. C.N.M.I.: Commonwealth of Northern Mariana Islands. † The previous categories of invasive pneumococcal disease among children less than 5 years and invasive, drug-resistant Streptococcus pneumoniae were eliminated. All cases of invasive Streptococcus pneumoniae disease, regardless of age or drug resistance are reported under a single disease code. § Includes the following categories: primary, secondary, latent (including early latent, late latent, and latent syphilis of unknown duration), neurosyphilis, late (including late syphilis with clinical manifestations other than neurosyphilis), and congenital syphilis. Totals reported to the Division of STD Prevention, NCHHSTP, as of June 8, 2011. |
||||||||
|
TABLE 2. (Continued) Reported cases of notifiable diseases,* by geographic division and area — United States, 2010 |
||||||
|---|---|---|---|---|---|---|
|
Area |
Trichinellosis |
Tuberculosis† |
Tularemia |
Typhoid fever |
Vancomycin-intermediate Staphylococcus aureus |
Vancomycin-resistant Staphylococcus aureus |
|
United States |
7 |
11,182 |
124 |
467 |
91 |
2 |
|
New England |
2 |
356 |
4 |
28 |
7 |
— |
|
Connecticut |
— |
85 |
— |
8 |
— |
— |
|
Maine |
1 |
8 |
— |
2 |
— |
— |
|
Massachusetts |
— |
222 |
3 |
14 |
7 |
— |
|
New Hampshire |
— |
10 |
1 |
3 |
N |
— |
|
Rhode Island |
1 |
26 |
— |
1 |
— |
— |
|
Vermont |
— |
5 |
— |
— |
— |
— |
|
Mid. Atlantic |
1 |
1,597 |
2 |
122 |
34 |
— |
|
New Jersey |
1 |
405 |
1 |
40 |
7 |
— |
|
New York (Upstate) |
— |
243 |
— |
14 |
18 |
— |
|
New York City |
— |
711 |
— |
52 |
7 |
— |
|
Pennsylvania |
— |
238 |
1 |
16 |
2 |
— |
|
E.N. Central |
2 |
891 |
4 |
45 |
21 |
— |
|
Illinois |
1 |
372 |
1 |
20 |
7 |
— |
|
Indiana |
— |
90 |
3 |
2 |
N |
— |
|
Michigan |
— |
184 |
— |
6 |
5 |
— |
|
Ohio |
1 |
190 |
— |
10 |
8 |
— |
|
Wisconsin |
— |
55 |
— |
7 |
1 |
— |
|
W.N. Central |
1 |
390 |
51 |
16 |
1 |
— |
|
Iowa |
— |
48 |
— |
3 |
N |
— |
|
Kansas |
— |
46 |
16 |
1 |
N |
N |
|
Minnesota |
— |
135 |
— |
6 |
— |
— |
|
Missouri |
1 |
107 |
18 |
2 |
— |
— |
|
Nebraska |
— |
27 |
5 |
2 |
1 |
— |
|
North Dakota |
— |
12 |
1 |
1 |
— |
— |
|
South Dakota |
— |
15 |
11 |
1 |
— |
— |
|
S. Atlantic |
— |
2,262 |
4 |
75 |
8 |
2 |
|
Delaware |
— |
20 |
— |
1 |
— |
2 |
|
District of Columbia |
— |
44 |
— |
3 |
N |
N |
|
Florida |
— |
835 |
— |
22 |
1 |
— |
|
Georgia |
N |
411 |
— |
18 |
1 |
— |
|
Maryland |
— |
220 |
— |
10 |
1 |
— |
|
North Carolina |
— |
296 |
3 |
9 |
4 |
— |
|
South Carolina |
— |
153 |
— |
1 |
— |
— |
|
Virginia |
— |
268 |
1 |
11 |
1 |
— |
|
West Virginia |
— |
15 |
— |
— |
— |
— |
|
E.S. Central |
— |
545 |
5 |
8 |
2 |
— |
|
Alabama |
— |
146 |
— |
3 |
N |
N |
|
Kentucky |
N |
90 |
2 |
3 |
N |
N |
|
Mississippi |
— |
116 |
— |
1 |
2 |
— |
|
Tennessee |
— |
193 |
3 |
1 |
— |
— |
|
W.S. Central |
— |
1,749 |
28 |
36 |
15 |
— |
|
Arkansas |
N |
78 |
19 |
1 |
— |
— |
|
Louisiana |
— |
200 |
— |
2 |
4 |
— |
|
Oklahoma |
— |
86 |
8 |
1 |
1 |
— |
|
Texas |
— |
1,385 |
1 |
32 |
10 |
— |
|
Mountain |
1 |
567 |
12 |
17 |
3 |
— |
|
Arizona |
— |
283 |
1 |
6 |
2 |
— |
|
Colorado |
— |
71 |
3 |
3 |
N |
— |
|
Idaho |
1 |
15 |
— |
— |
N |
N |
|
Montana |
— |
6 |
1 |
— |
N |
N |
|
Nevada |
— |
114 |
1 |
5 |
1 |
— |
|
New Mexico |
— |
51 |
1 |
— |
N |
N |
|
Utah |
— |
20 |
2 |
3 |
— |
— |
|
Wyoming |
— |
7 |
3 |
— |
— |
— |
|
Pacific |
— |
2,825 |
14 |
120 |
— |
— |
|
Alaska |
— |
57 |
— |
— |
N |
N |
|
California |
— |
2,327 |
8 |
91 |
N |
N |
|
Hawaii |
— |
115 |
— |
1 |
— |
— |
|
Oregon |
— |
87 |
3 |
6 |
N |
N |
|
Washington |
— |
239 |
3 |
22 |
N |
N |
|
Territories |
||||||
|
American Samoa |
N |
3 |
— |
— |
— |
— |
|
C.N.M.I. |
— |
32 |
— |
— |
— |
— |
|
Guam |
— |
100 |
— |
— |
— |
— |
|
Puerto Rico |
N |
80 |
— |
— |
— |
— |
|
U.S. Virgin Islands |
— |
— |
— |
— |
— |
— |
|
N: Not reportable. U: Unavailable. —: No reported cases. C.N.M.I.: Commonwealth of Northern Mariana Islands. † Totals reported to the Division of Tuberculosis Elimination, NCHHSTP, as of July 1, 2011. |
||||||
|
TABLE 2. (Continued) Reported cases of notifiable diseases,* by geographic division and area — United States, 2010 |
||||
|---|---|---|---|---|
|
Area |
Varicella |
Vibriosis |
Viral hemorrhagic fever |
|
|
Morbidity |
Mortality† |
|||
|
United States |
15,427 |
4 |
846 |
1 |
|
New England |
1,163 |
— |
44 |
— |
|
Connecticut |
320 |
— |
32 |
— |
|
Maine |
247 |
— |
5 |
— |
|
Massachusetts |
258 |
N |
— |
— |
|
New Hampshire |
162 |
— |
3 |
N |
|
Rhode Island |
46 |
— |
4 |
— |
|
Vermont |
130 |
N |
— |
— |
|
Mid. Atlantic |
1,717 |
1 |
48 |
1 |
|
New Jersey |
568 |
— |
24 |
— |
|
New York (Upstate) |
N |
N |
N |
— |
|
New York City |
— |
— |
15 |
— |
|
Pennsylvania |
1,149 |
1 |
9 |
1 |
|
E.N. Central |
4,868 |
1 |
46 |
— |
|
Illinois |
1,195 |
1 |
13 |
— |
|
Indiana |
357 |
— |
6 |
N |
|
Michigan |
1,450 |
— |
10 |
— |
|
Ohio |
1,349 |
N |
11 |
— |
|
Wisconsin |
517 |
— |
6 |
N |
|
W.N. Central |
1,022 |
— |
19 |
— |
|
Iowa |
N |
N |
N |
— |
|
Kansas |
394 |
— |
N |
— |
|
Minnesota |
— |
— |
14 |
— |
|
Missouri |
489 |
— |
5 |
— |
|
Nebraska |
25 |
— |
N |
— |
|
North Dakota |
52 |
— |
N |
— |
|
South Dakota |
62 |
— |
N |
— |
|
S. Atlantic |
2,105 |
— |
291 |
— |
|
Delaware |
39 |
— |
5 |
— |
|
District of Columbia |
20 |
— |
5 |
N |
|
Florida |
977 |
— |
130 |
— |
|
Georgia |
N |
N |
22 |
N |
|
Maryland |
N |
— |
45 |
— |
|
North Carolina |
N |
N |
28 |
— |
|
South Carolina |
83 |
— |
16 |
— |
|
Virginia |
548 |
N |
40 |
— |
|
West Virginia |
438 |
— |
N |
— |
|
E.S. Central |
308 |
— |
36 |
— |
|
Alabama |
296 |
— |
13 |
N |
|
Kentucky |
N |
N |
5 |
N |
|
Mississippi |
12 |
N |
8 |
— |
|
Tennessee |
N |
— |
10 |
— |
|
W.S. Central |
3,070 |
2 |
108 |
— |
|
Arkansas |
220 |
— |
N |
— |
|
Louisiana |
90 |
N |
28 |
— |
|
Oklahoma |
N |
N |
1 |
— |
|
Texas |
2,760 |
2 |
79 |
— |
|
Mountain |
1,052 |
— |
30 |
— |
|
Arizona |
— |
— |
18 |
— |
|
Colorado |
404 |
N |
8 |
N |
|
Idaho |
N |
N |
N |
N |
|
Montana |
198 |
— |
N |
N |
|
Nevada |
N |
N |
1 |
— |
|
New Mexico |
95 |
— |
2 |
N |
|
Utah |
334 |
— |
1 |
— |
|
Wyoming |
21 |
N |
— |
— |
|
Pacific |
122 |
— |
224 |
— |
|
Alaska |
48 |
N |
— |
— |
|
California |
36 |
— |
115 |
— |
|
Hawaii |
38 |
— |
24 |
— |
|
Oregon |
N |
N |
26 |
— |
|
Washington |
N |
N |
59 |
— |
|
Territories |
||||
|
American Samoa |
N |
N |
N |
N |
|
C.N.M.I. |
— |
— |
— |
— |
|
Guam |
28 |
N |
— |
— |
|
Puerto Rico |
636 |
— |
N |
— |
|
U.S. Virgin Islands |
— |
— |
— |
— |
|
N: Not reportable. U: Unavailable. —: No reported cases. C.N.M.I.: Commonwealth of Northern Mariana Islands. † Totals reported to the Division of Viral Diseases, National Center for Immunization and Respiratory Diseases (NCIRD), as of June 30, 2011. |
||||
|
TABLE 3. Reported cases and incidence* of notifiable diseases,† by age group — United States, 2010 |
||||||||||||||||
|---|---|---|---|---|---|---|---|---|---|---|---|---|---|---|---|---|
|
Disease |
<1 yr |
1–4 yrs |
5–14 yrs |
15–24 yrs |
25–39 yrs |
40–64 yrs |
>65 yrs |
Age not stated |
Total |
|||||||
|
No. |
Rate |
No. |
Rate |
No. |
Rate |
No. |
Rate |
No. |
Rate |
No. |
Rate |
No. |
Rate |
|||
|
Arboviral diseases§ |
||||||||||||||||
|
California serogroup virus |
||||||||||||||||
|
neuroinvasive |
1 |
(0.02) |
15 |
(0.04) |
43 |
(0.11) |
4 |
(0.01) |
— |
(0.00) |
3 |
(0.00) |
2 |
(0.01) |
— |
68 |
|
nonneuroinvasive |
— |
(0.00) |
1 |
(0.01) |
5 |
(0.01) |
1 |
(0.00) |
— |
(0.00) |
— |
(0.00) |
— |
(0.00) |
— |
7 |
|
Eastern equine virus |
— |
(0.00) |
1 |
(0.01) |
— |
(0.00) |
1 |
(0.00) |
— |
(0.00) |
7 |
(0.01) |
1 |
(0.00) |
— |
10 |
|
Powassan virus |
— |
(0.00) |
— |
(0.00) |
2 |
(0.00) |
2 |
(0.00) |
1 |
(0.00) |
1 |
(0.00) |
2 |
(0.01) |
— |
8 |
|
St. Louis encephalitis virus |
||||||||||||||||
|
neuroinvasive |
— |
(0.00) |
— |
(0.00) |
— |
(0.00) |
1 |
(0.00) |
— |
(0.00) |
4 |
(0.00) |
3 |
(0.01) |
— |
8 |
|
nonneuroinvasive |
— |
(0.00) |
— |
(0.00) |
— |
(0.00) |
— |
(0.00) |
1 |
(0.00) |
1 |
(0.00) |
— |
(0.00) |
— |
2 |
|
West Nile virus |
||||||||||||||||
|
neuroinvasive |
— |
(0.00) |
1 |
(0.01) |
14 |
(0.03) |
29 |
(0.07) |
71 |
(0.11) |
263 |
(0.26) |
251 |
(0.63) |
— |
629 |
|
nonneuroinvasive |
— |
(0.00) |
2 |
(0.01) |
7 |
(0.02) |
18 |
(0.04) |
56 |
(0.09) |
224 |
(0.22) |
85 |
(0.21) |
— |
392 |
|
Botulism, total |
79 |
(1.85) |
— |
(0.00) |
— |
(0.00) |
— |
(0.00) |
8 |
(0.01) |
19 |
(0.02) |
4 |
(0.01) |
2 |
112 |
|
foodborne |
— |
(0.00) |
— |
(0.00) |
— |
(0.00) |
— |
(0.00) |
— |
(0.00) |
4 |
(0.00) |
3 |
(0.01) |
— |
7 |
|
infant |
79 |
(1.85) |
— |
(0.00) |
— |
(0.00) |
— |
(0.00) |
— |
(0.00) |
— |
(0.00) |
— |
(0.00) |
1 |
80 |
|
other (wound and unspecified) |
— |
(0.00) |
— |
(0.00) |
— |
(0.00) |
— |
(0.00) |
8 |
(0.01) |
15 |
(0.01) |
1 |
(0.00) |
1 |
25 |
|
Brucellosis |
— |
(0.00) |
5 |
(0.03) |
9 |
(0.02) |
11 |
(0.03) |
20 |
(0.03) |
44 |
(0.04) |
26 |
(0.07) |
— |
115 |
|
Chancroid¶ |
— |
(0.00) |
— |
(0.00) |
— |
(0.00) |
16 |
(0.04) |
6 |
(0.01) |
2 |
(0.00) |
— |
(0.00) |
— |
24 |
|
Chlamydia trachomatis infection¶ |
792 |
(18.59) |
171 |
(1.00) |
14,719 |
(36.27) |
930,338 |
(2159.69) |
319,317 |
(514.16) |
39,243 |
(39.10) |
954 |
(2.41) |
2,359 |
1,307,893 |
|
Cholera |
— |
(0.00) |
2 |
(0.01) |
2 |
(0.00) |
1 |
(0.00) |
1 |
(0.00) |
6 |
(0.01) |
1 |
(0.00) |
— |
13 |
|
Cryptosporidiosis, total |
123 |
(2.89) |
1,248 |
(7.32) |
1,391 |
(3.43) |
1,150 |
(2.67) |
1,824 |
(2.94) |
1,999 |
(1.99) |
1,110 |
(2.81) |
99 |
8,944 |
|
confirmed |
111 |
(2.60) |
1,105 |
(6.49) |
1,246 |
(3.07) |
1,107 |
(2.57) |
1,684 |
(2.71) |
1,943 |
(1.94) |
1,098 |
(2.77) |
81 |
8,375 |
|
probable |
12 |
(0.28) |
143 |
(0.84) |
145 |
(0.36) |
43 |
(0.10) |
140 |
(0.23) |
56 |
(0.06) |
12 |
(0.03) |
18 |
569 |
|
Cyclosporiasis |
— |
(0.00) |
2 |
(0.01) |
— |
(0.00) |
12 |
(0.03) |
42 |
(0.08) |
92 |
(0.10) |
24 |
(0.07) |
7 |
179 |
|
Denque fever |
1 |
(0.02) |
3 |
(0.02) |
44 |
(0.11) |
96 |
(0.22) |
151 |
(0.24) |
329 |
(0.33) |
66 |
(0.17) |
— |
690 |
|
Denque hemorrhagic fever |
— |
(0.00) |
— |
(0.00) |
— |
(0.00) |
— |
(0.00) |
5 |
(0.00) |
4 |
(0.00) |
1 |
(0.00) |
— |
10 |
|
Ehrlichiosis/Anaplasmosis |
||||||||||||||||
|
Ehrlichia chaffeensis |
— |
(0.00) |
14 |
(0.09) |
27 |
(0.07) |
61 |
(0.15) |
81 |
(0.14) |
335 |
(0.35) |
220 |
(0.59) |
2 |
740 |
|
Ehrlichia ewingii |
— |
(0.00) |
— |
(0.00) |
— |
(0.00) |
— |
(0.00) |
3 |
(0.01) |
5 |
(0.01) |
2 |
(0.01) |
— |
10 |
|
Anaplasma phagocytophilum |
1 |
(0.03) |
15 |
(0.09) |
77 |
(0.20) |
86 |
(0.21) |
200 |
(0.34) |
805 |
(0.85) |
571 |
(1.53) |
6 |
1,761 |
|
Undetermined |
— |
(0.00) |
1 |
(0.01) |
4 |
(0.01) |
6 |
(0.02) |
13 |
(0.02) |
50 |
(0.05) |
30 |
(0.08) |
— |
104 |
|
Giardiasis |
268 |
(7.59) |
3,409 |
(24.19) |
3,394 |
(10.04) |
2,031 |
(5.60) |
3,392 |
(6.51) |
5,351 |
(6.26) |
1,498 |
(4.40) |
468 |
19,811 |
|
Gonorrhea¶ |
137 |
(3.21) |
110 |
(0.65) |
3,080 |
(7.59) |
193,869 |
(450.05) |
90,060 |
(145.01) |
21,011 |
(20.93) |
520 |
(1.31) |
554 |
309,341 |
|
Haemophilus influenzae, invasive disease, all ages, serotypes |
262 |
(6.15) |
184 |
(1.08) |
122 |
(0.30) |
99 |
(0.23) |
164 |
(0.26) |
777 |
(0.77) |
1,483 |
(3.75) |
60 |
3,151 |
|
age<5 years |
||||||||||||||||
|
serotype b |
11 |
(0.26) |
12 |
(0.07) |
— |
(0.00) |
— |
(0.00) |
— |
(0.00) |
— |
(0.00) |
— |
(0.00) |
— |
23 |
|
nonserotype b |
123 |
(2.89) |
77 |
(0.45) |
— |
(0.00) |
— |
(0.00) |
— |
(0.00) |
— |
(0.00) |
— |
(0.00) |
— |
200 |
|
unknown serotype |
128 |
(3.00) |
95 |
(0.56) |
— |
(0.00) |
— |
(0.00) |
— |
(0.00) |
— |
(0.00) |
— |
(0.00) |
— |
223 |
|
Hansen disease (leprosy) |
— |
(0.00) |
— |
(0.00) |
— |
(0.00) |
5 |
(0.01) |
16 |
(0.03) |
37 |
(0.04) |
16 |
(0.05) |
24 |
98 |
|
Hantavirus pulmonary syndrome |
— |
(0.00) |
— |
(0.00) |
1 |
(0.00) |
2 |
(0.00) |
7 |
(0.01) |
10 |
(0.01) |
— |
(0.00) |
— |
20 |
|
Hemolytic uremic syndrome, post-diarrheal |
11 |
(0.27) |
128 |
(0.79) |
77 |
(0.20) |
19 |
(0.05) |
7 |
(0.01) |
12 |
(0.01) |
11 |
(0.03) |
1 |
266 |
|
Hepatitis viral, acute |
||||||||||||||||
|
A |
11 |
(0.26) |
40 |
(0.23) |
155 |
(0.38) |
320 |
(0.74) |
388 |
(0.62) |
472 |
(0.47) |
260 |
(0.66) |
24 |
1,670 |
|
B |
1 |
(0.02) |
8 |
(0.05) |
11 |
(0.03) |
142 |
(0.33) |
1,299 |
(2.10) |
1,644 |
(1.64) |
245 |
(0.62) |
24 |
3,374 |
|
C |
5 |
(0.12) |
— |
(0.00) |
— |
(0.00) |
169 |
(0.41) |
400 |
(0.68) |
250 |
(0.26) |
13 |
(0.03) |
12 |
849 |
|
Human immunodeficiency virus (HIV) infection diagnosis†† |
43 |
(1.01) |
35 |
(0.21) |
102 |
(0.25) |
7,217 |
(16.75) |
13,838 |
(22.28) |
13,865 |
(13.81) |
641 |
(1.62) |
— |
35,741 |
|
Influenza-associated pediatric mortality** |
10 |
(0.23) |
12 |
(0.07) |
27 |
(0.07) |
12 |
(0.09) |
— |
(0.00) |
— |
(0.00) |
— |
(0.00) |
— |
61 |
|
Legionellosis |
6 |
(0.14) |
4 |
(0.02) |
7 |
(0.02) |
38 |
(0.09) |
240 |
(0.39) |
1,699 |
(1.69) |
1,296 |
(3.28) |
56 |
3,346 |
|
Listeriosis |
58 |
(1.36) |
9 |
(0.05) |
10 |
(0.02) |
31 |
(0.07) |
72 |
(0.12) |
193 |
(0.19) |
434 |
(1.10) |
14 |
821 |
|
Lyme disease, total |
16 |
(0.38) |
1,043 |
(6.15) |
4,629 |
(11.45) |
2,897 |
(6.75) |
3,561 |
(5.76) |
10,488 |
(10.49) |
4,130 |
(10.49) |
3,394 |
30,158 |
|
confirmed |
14 |
(0.33) |
899 |
(5.30) |
3,656 |
(9.04) |
2,058 |
(4.80) |
2,555 |
(4.13) |
7,910 |
(7.91) |
2,954 |
(7.50) |
2,515 |
22,561 |
|
probable |
2 |
(0.05) |
144 |
(0.85) |
973 |
(2.41) |
839 |
(1.96) |
1,006 |
(1.63) |
2,578 |
(2.58) |
1,176 |
(2.99) |
879 |
7,597 |
|
Malaria |
5 |
(0.12) |
49 |
(0.29) |
164 |
(0.40) |
327 |
(0.76) |
483 |
(0.78) |
637 |
(0.63) |
98 |
(0.25) |
10 |
1,773 |
|
Measles, total |
8 |
(0.19) |
16 |
(0.09) |
5 |
(0.01) |
7 |
(0.02) |
19 |
(0.03) |
7 |
(0.01) |
— |
(0.00) |
1 |
63 |
|
Measles, indigenous |
4 |
(0.09) |
6 |
(0.04) |
3 |
(0.01) |
— |
(0.00) |
8 |
(0.01) |
2 |
(0.00) |
— |
(0.00) |
— |
23 |
|
Measles, imported |
4 |
(0.09) |
10 |
(0.06) |
2 |
(0.00) |
7 |
(0.02) |
11 |
(0.02) |
5 |
(0.00) |
— |
(0.00) |
1 |
40 |
|
Meningococcal disease, invasive, all serogroups |
112 |
(2.63) |
91 |
(0.53) |
46 |
(0.11) |
158 |
(0.37) |
103 |
(0.17) |
169 |
(0.17) |
151 |
(0.38) |
3 |
833 |
|
serogroup A,C,Y,and W-135 |
25 |
(0.59) |
18 |
(0.11) |
15 |
(0.04) |
57 |
(0.13) |
35 |
(0.06) |
66 |
(0.07) |
64 |
(0.16) |
— |
280 |
|
serogroup B |
43 |
(1.01) |
23 |
(0.13) |
7 |
(0.02) |
24 |
(0.06) |
12 |
(0.02) |
15 |
(0.01) |
9 |
(0.02) |
2 |
135 |
|
other serogroup |
3 |
(0.07) |
1 |
(0.01) |
1 |
(0.00) |
1 |
(0.00) |
4 |
(0.01) |
1 |
(0.00) |
1 |
(0.00) |
— |
12 |
|
serogroup unknown |
41 |
(0.96) |
49 |
(0.29) |
23 |
(0.06) |
76 |
(0.18) |
52 |
(0.08) |
87 |
(0.09) |
77 |
(0.19) |
1 |
406 |
|
Mumps |
29 |
(0.68) |
268 |
(1.57) |
884 |
(2.18) |
767 |
(1.78) |
442 |
(0.71) |
191 |
(0.19) |
24 |
(0.06) |
7 |
2,612 |
|
Pertussis |
4,120 |
(96.68) |
4,489 |
(26.35) |
10,056 |
(24.78) |
2,572 |
(5.97) |
2,348 |
(3.78) |
3,110 |
(3.10) |
696 |
(1.76) |
159 |
27,550 |
|
Plague |
— |
(0.00) |
— |
(0.00) |
— |
(0.00) |
1 |
(0.00) |
— |
(0.00) |
1 |
(0.00) |
— |
(0.00) |
— |
2 |
|
TABLE 3. (Continued) Reported cases and incidence* of notifiable diseases,† by age group — United States, 2010 |
||||||||||||||||
|---|---|---|---|---|---|---|---|---|---|---|---|---|---|---|---|---|
|
Disease |
<1 yr |
1–4 yrs |
5–14 yrs |
15–24 yrs |
25–39 yrs |
40–64 yrs |
>65 yrs |
Age not stated |
Total |
|||||||
|
No. |
Rate |
No. |
Rate |
No. |
Rate |
No. |
Rate |
No. |
Rate |
No. |
Rate |
No. |
Rate |
|||
|
Psittacosis |
— |
(0.00) |
— |
(0.00) |
— |
(0.00) |
— |
(0.00) |
— |
(0.00) |
1 |
(0.00) |
3 |
(0.01) |
— |
4 |
|
Q fever, total |
— |
(0.00) |
— |
(0.00) |
— |
(0.00) |
13 |
(0.03) |
16 |
(0.03) |
70 |
(0.07) |
32 |
(0.08) |
— |
131 |
|
Acute |
— |
(0.00) |
— |
(0.00) |
— |
(0.00) |
12 |
(0.03) |
12 |
(0.02) |
58 |
(0.06) |
24 |
(0.06) |
— |
106 |
|
Chronic |
— |
(0.00) |
— |
(0.00) |
— |
(0.00) |
1 |
(0.00) |
4 |
(0.01) |
12 |
(0.01) |
8 |
(0.02) |
— |
25 |
|
Rabies, human |
— |
(0.00) |
— |
(0.00) |
— |
(0.00) |
1 |
(0.00) |
— |
(0.00) |
— |
(0.00) |
1 |
(0.00) |
— |
2 |
|
Rubella |
— |
(0.00) |
— |
(0.00) |
1 |
(0.00) |
2 |
(0.00) |
— |
(0.00) |
2 |
(0.00) |
— |
(0.00) |
— |
5 |
|
Salmonellosis |
5,828 |
(136.76) |
9,494 |
(55.72) |
6,940 |
(17.10) |
5,120 |
(11.89) |
7,103 |
(11.44) |
12,254 |
(12.21) |
6,881 |
(17.39) |
804 |
54,424 |
|
Shiga toxin-producing E.coli (STEC) |
192 |
(4.51) |
1,479 |
(8.68) |
1,068 |
(2.63) |
849 |
(1.97) |
651 |
(1.05) |
730 |
(0.73) |
451 |
(1.14) |
56 |
5,476 |
|
Shigellosis |
266 |
(6.24) |
4,309 |
(25.29) |
4,489 |
(11.06) |
1,150 |
(2.67) |
2,156 |
(3.47) |
1,841 |
(1.83) |
445 |
(1.12) |
130 |
14,786 |
|
Spotted fever rickettsiosis, total |
3 |
(0.07) |
41 |
(0.24) |
132 |
(0.33) |
177 |
(0.41) |
344 |
(0.56) |
913 |
(0.92) |
373 |
(0.95) |
2 |
1,985 |
|
confirmed |
2 |
(0.05) |
8 |
(0.05) |
7 |
(0.02) |
16 |
(0.04) |
14 |
(0.02) |
69 |
(0.07) |
40 |
(0.10) |
— |
156 |
|
probable |
1 |
(0.02) |
33 |
(0.19) |
126 |
(0.31) |
163 |
(0.38) |
332 |
(0.54) |
847 |
(0.85) |
331 |
(0.84) |
2 |
1,835 |
|
Streptococcal toxic-shock syndrome |
— |
(0.00) |
5 |
(0.05) |
3 |
(0.01) |
11 |
(0.04) |
17 |
(0.04) |
63 |
(0.10) |
43 |
(0.17) |
— |
142 |
|
Streptococcus pneumoniae, invasive disaease |
||||||||||||||||
|
all ages |
596 |
(23.05) |
1,298 |
(12.54) |
494 |
(1.99) |
395 |
(1.51) |
1,349 |
(3.58) |
6,457 |
(10.48) |
5,865 |
(23.94) |
115 |
16,569 |
|
age <5 years |
682 |
(22.07) |
1,504 |
(12.17) |
— |
(0.00) |
— |
(0.00) |
— |
(0.00) |
— |
(0.00) |
— |
(0.00) |
— |
2,186 |
|
Syphilis, total, all stages¶,§§ |
384 |
(9.01) |
3 |
(0.02) |
52 |
(0.13) |
10,629 |
(24.67) |
17,889 |
(28.80) |
15,654 |
(15.60) |
1,203 |
(3.04) |
20 |
45,834 |
|
congenital (age <1 yr)¶ |
377 |
(8.85) |
— |
(0.00) |
— |
(0.00) |
— |
(0.00) |
— |
(0.00) |
— |
(0.00) |
— |
(0.00) |
— |
377 |
|
primary and secondary¶ |
1 |
(0.02) |
— |
(0.00) |
18 |
(0.04) |
3,839 |
(8.91) |
5,703 |
(9.18) |
4,102 |
(4.09) |
107 |
(0.27) |
4 |
13,774 |
|
Tetanus |
— |
(0.00) |
— |
(0.00) |
2 |
(0.00) |
3 |
(0.01) |
3 |
(0.00) |
10 |
(0.01) |
5 |
(0.01) |
3 |
26 |
|
Toxic-shock syndrome (other than streptococcal) |
— |
(0.00) |
2 |
(0.02) |
21 |
(0.07) |
30 |
(0.09) |
16 |
(0.03) |
10 |
(0.01) |
3 |
(0.01) |
— |
82 |
|
Trichinellosis |
— |
(0.00) |
— |
(0.00) |
— |
(0.00) |
1 |
(0.00) |
1 |
(0.00) |
4 |
(0.00) |
1 |
(0.00) |
— |
7 |
|
Tuberculosis¶¶ |
77 |
(1.81) |
288 |
(1.69) |
272 |
(0.67) |
1,200 |
(2.79) |
2,770 |
(4.46) |
4,341 |
(4.32) |
2,230 |
(5.64) |
4 |
11,182 |
|
Tularemia |
— |
(0.00) |
13 |
(0.08) |
22 |
(0.05) |
8 |
(0.02) |
12 |
(0.02) |
39 |
(0.04) |
26 |
(0.07) |
4 |
124 |
|
Typhoid fever |
5 |
(0.12) |
53 |
(0.31) |
115 |
(0.28) |
75 |
(0.17) |
125 |
(0.20) |
70 |
(0.07) |
12 |
(0.03) |
12 |
467 |
|
Vancomycin-intermediate Staphylococcus aureus (VISA) infection |
— |
(0.00) |
— |
(0.00) |
— |
(0.00) |
2 |
(0.01) |
4 |
(0.01) |
33 |
(0.04) |
44 |
(0.15) |
8 |
91 |
|
Vancomycin-resistant Staphylococcus aureus (VRSA) infection |
— |
(0.00) |
— |
(0.00) |
— |
(0.00) |
— |
(0.00) |
— |
(0.00) |
1 |
(0.00) |
1 |
(0.00) |
— |
2 |
|
Vibriosis |
4 |
(0.10) |
20 |
(0.13) |
81 |
(0.22) |
49 |
(0.13) |
145 |
(0.25) |
352 |
(0.39) |
190 |
(0.53) |
5 |
846 |
|
Viral hemorrhagic fevers |
— |
(0.00) |
— |
(0.00) |
— |
(0.00) |
— |
(0.00) |
— |
(0.00) |
— |
(0.00) |
— |
(0.00) |
1 |
1 |
|
* Per 100,000 population. † No cases of anthrax; diphtheria; eastern equine encephalitis virus disease; nonneuroinvasive; poliomyelitis, paralytic; poliovirus infection; nonparalytic; Powassan virus disease, non-neuroinvasive; rubella; congenital syndrome; severe acute respiratory syndrome-associated coronavirus disease (SARS-CoV); smallpox, western equine encephalitis virus disease, neuroinvasive and nonneuroinvasive, and yellow fever were reported in 2010. Data on hepatitis B virus, perinatal infection, chronic hepatitis B, and chronic hepatitis C virus infection are not included because they are undergoing data quality review. § Totals reported to the Division of Vector-Borne Diseases, National Center for Emerging and Zoonotic Infectious Diseases (ArboNET Surveillance), as of May 9, 2011. ¶ Cases among persons aged <15 years are not shown because some might not be caused by sexual transmission; these cases are included in the totals. Totals reported to the Division of STD Prevention, NCHHSTP, as of June 8, 2011. †† Total number of HIV cases reported to the Division of HIV/AIDS Prevention, NCHHSTP through December 31, 2010. ** Totals reported to the Influenza Division, National Center for Immunization and Respiratory Diseases, as of December 31, 2010. §§ Includes the following categories: primary, secondary, latent (including early latent, late latent, and latent syphilis of unknown duration), neurosyphilis, late (including late syphilis with clinical manifestations other than neurosyphilis), and congenital syphilis. ¶¶ Totals reported to the Division of TB Elimination, NCHHSTP, as of July 1, 2011. |
||||||||||||||||
|
TABLE 4. Reported cases and incidence* of notifiable diseases,† by sex — United States, 2010 |
||||||
|---|---|---|---|---|---|---|
|
Disease |
Male |
Female |
Sex not stated |
Total |
||
|
No. |
Rate |
No. |
Rate |
|||
|
Arboviral diseases§ |
||||||
|
California serogroup virus |
||||||
|
neuroinvasive |
37 |
(0.02) |
31 |
(0.02) |
— |
68 |
|
nonneuroinvasive |
5 |
(0.00) |
2 |
(0.00) |
— |
7 |
|
Eastern equine encephalitis virus |
7 |
(0.00) |
3 |
(0.00) |
— |
10 |
|
Powassan virus |
7 |
(0.00) |
1 |
(0.00) |
— |
8 |
|
St. Louis encephalitis virus |
||||||
|
neuroinvasive |
4 |
(0.00) |
4 |
(0.00) |
— |
8 |
|
nonneuroinvasive |
1 |
(0.00) |
1 |
(0.00) |
— |
2 |
|
West Nile virus |
||||||
|
neuroinvasive |
366 |
(0.24) |
263 |
(0.17) |
— |
629 |
|
nonneuroinvasive |
208 |
(0.14) |
184 |
(0.12) |
— |
392 |
|
Botulism, total |
61 |
(0.04) |
51 |
(0.03) |
— |
112 |
|
foodborne |
4 |
(0.00) |
3 |
(0.00) |
— |
7 |
|
infant |
36 |
(1.65) |
44 |
(2.11) |
— |
80 |
|
other (wound and unspecified) |
21 |
(0.01) |
4 |
(0.00) |
— |
25 |
|
Brucellosis |
64 |
(0.04) |
50 |
(0.03) |
1 |
115 |
|
Chancroid¶ |
10 |
(0.01) |
13 |
(0.01) |
1 |
24 |
|
Chlamydia trachomatis infection¶ |
353,923 |
(233.69) |
949,802 |
(610.58) |
4,168 |
1,307,893 |
|
Cholera |
6 |
(0.00) |
7 |
(0.00) |
— |
13 |
|
Cryptosporidiosis, total |
4,291 |
(2.83) |
4,602 |
(2.96) |
51 |
8,944 |
|
confirmed |
4,023 |
(2.66) |
4,311 |
(2.77) |
41 |
8,375 |
|
probable |
268 |
(0.18) |
291 |
(0.19) |
10 |
569 |
|
Cyclosporiasis |
91 |
(0.07) |
88 |
(0.06) |
— |
179 |
|
Denque fever |
351 |
(0.23) |
339 |
(0.22) |
— |
690 |
|
Denque hemorrhagic fever |
5 |
(0.00) |
5 |
(0.00) |
— |
10 |
|
Ehrlichiosis, Anaplasmosis |
||||||
|
Ehrlichia chaffeensis |
426 |
(0.30) |
300 |
(0.20) |
14 |
740 |
|
Ehrlichia ewingii |
4 |
(0.00) |
6 |
(0.00) |
— |
10 |
|
Anaplasma phagocytophilum |
1,016 |
(0.71) |
740 |
(0.51) |
5 |
1,761 |
|
Undetermined |
51 |
(0.04) |
53 |
(0.04) |
— |
104 |
|
Giardiasis |
11,126 |
(8.70) |
8,493 |
(6.46) |
192 |
19,811 |
|
Gonorrhea¶ |
142,470 |
( 94.07) |
165,693 |
(106.52) |
1,178 |
309,341 |
|
Haemophilus influenzae, invasive disease, all ages, all serotypes |
1,425 |
(0.94) |
1,698 |
(1.09) |
28 |
3,151 |
|
age <5 yrs |
||||||
|
serotype b |
13 |
(0.12) |
10 |
(0.10) |
— |
23 |
|
nonserotype b |
109 |
(1.00) |
90 |
(0.86) |
1 |
200 |
|
unknown serotype |
117 |
(1.07) |
105 |
(1.01) |
1 |
223 |
|
Hansen disease (leprosy) |
52 |
(0.04) |
22 |
(0.02) |
24 |
98 |
|
Hantavirus pulmonary syndrome |
13 |
(0.01) |
6 |
(0.00) |
1 |
20 |
|
Hemolytic uremic syndrome post-diarrheal |
120 |
(0.08) |
143 |
(0.10) |
3 |
266 |
|
Hepatitis, viral, acute |
||||||
|
A |
867 |
(0.57) |
795 |
(0.51) |
8 |
1,670 |
|
B |
2,062 |
(1.37) |
1,290 |
(0.83) |
22 |
3,374 |
|
C |
454 |
(0.32) |
391 |
(0.26) |
4 |
849 |
|
Human immunodeficiency virus (HIV) diagnosis†† |
27,827 |
( 18.37) |
7,914 |
(5.09) |
— |
35,741 |
|
Influenza-associated pediatric mortality** |
28 |
(0.07) |
33 |
(0.09) |
— |
61 |
|
Legionellosis |
2,148 |
(1.42) |
1,192 |
(0.77) |
6 |
3,346 |
|
Listeriosis |
395 |
(0.26) |
423 |
(0.27) |
3 |
821 |
|
Lyme disease, total |
16,452 |
( 10.91) |
13,009 |
(8.40) |
697 |
30,158 |
|
confirmed |
12,388 |
(8.22) |
9,536 |
(6.16) |
637 |
22,561 |
|
probable |
4,064 |
(2.70) |
3,473 |
(2.24) |
60 |
7,597 |
|
Malaria |
1,110 |
(0.73) |
649 |
(0.42) |
14 |
1,773 |
|
Measles, total |
39 |
(0.03) |
23 |
(0.01) |
1 |
63 |
|
indigenous |
17 |
(0.01) |
6 |
(0.00) |
— |
23 |
|
imported |
22 |
(0.01) |
17 |
(0.01) |
1 |
40 |
|
Meningococcal disease., invasive, all serogroup |
424 |
(0.28) |
409 |
(0.26) |
— |
833 |
|
serogroup A,C,Y,and W-135 |
132 |
(0.09) |
148 |
(0.10) |
— |
280 |
|
serogroup B |
77 |
(0.05) |
58 |
(0.04) |
— |
135 |
|
serogroup other |
5 |
(0.00) |
7 |
(0.00) |
— |
12 |
|
serogroup unknown |
210 |
(0.14) |
196 |
(0.13) |
— |
406 |
|
Mumps |
1,728 |
(1.14) |
883 |
(0.57) |
1 |
2,612 |
|
Pertussis |
12,266 |
(8.10) |
15,144 |
(9.74) |
140 |
27,550 |
|
TABLE 4. (Continued) Reported cases and incidence* of notifiable diseases,† by sex — United States, 2010 |
||||||
|---|---|---|---|---|---|---|
|
Disease |
Male |
Female |
Sex not stated |
Total |
||
|
No. |
Rate |
No. |
Rate |
|||
|
Plague |
— |
(0.00) |
2 |
(0.00) |
— |
2 |
|
Psittacosis |
3 |
(0.00) |
1 |
(0.00) |
— |
4 |
|
Q fever, total |
92 |
(0.06) |
37 |
(0.02) |
2 |
131 |
|
acute |
75 |
(0.05) |
30 |
(0.02) |
1 |
106 |
|
chronic |
17 |
(0.01) |
7 |
(0.00) |
1 |
25 |
|
Rabies, human |
2 |
(0.00) |
— |
(0.00) |
— |
2 |
|
Rubella |
3 |
(0.00) |
2 |
(0.00) |
— |
5 |
|
Salmonellosis |
25,800 |
(17.04) |
28,287 |
( 18.18) |
337 |
54,424 |
|
Shiga toxin-producing E.coli (STEC) |
2,533 |
(1.67) |
2,912 |
(1.87) |
31 |
5,476 |
|
Shigellosis |
7,051 |
(4.66) |
7,641 |
(4.91) |
94 |
14,786 |
|
Spotted fever rickettsiosis, total |
1,268 |
(0.84) |
683 |
(0.44) |
34 |
1,985 |
|
confirmed |
94 |
(0.06) |
61 |
(0.04) |
1 |
156 |
|
probable |
1,180 |
(0.78) |
622 |
(0.40) |
33 |
1,835 |
|
Streptococcal toxic-shock syndrome |
71 |
(0.08) |
71 |
(0.07) |
— |
142 |
|
Streptococcus pneumoniae, invasive disease |
||||||
|
all ages |
8,384 |
(9.07) |
8,091 |
(8.49) |
94 |
16,569 |
|
age <5 yrs |
1,102 |
(13.96) |
785 |
(10.39) |
299 |
2,186 |
|
Syphilis, total, all stages¶,§§ |
34,832 |
(23.00) |
10,815 |
(6.95) |
187 |
45,834 |
|
congenital (age <1 yr)¶ |
194 |
(8.91) |
167 |
(8.02) |
16 |
377 |
|
primary and secondary¶ |
11,981 |
(7.91) |
1,780 |
(1.14) |
13 |
13,774 |
|
Tetanus |
18 |
(0.01) |
8 |
(0.01) |
— |
26 |
|
Toxic-shock syndrome (other than streptococcal) |
16 |
(0.01) |
66 |
(0.06) |
— |
82 |
|
Trichinellosis |
5 |
(0.00) |
2 |
(0.00) |
— |
7 |
|
Tuberculosis¶¶ |
6,835 |
(4.51) |
4,296 |
(2.76) |
51 |
11,182 |
|
Tularemia |
78 |
(0.05) |
45 |
(0.03) |
1 |
124 |
|
Typhoid fever |
234 |
(0.15) |
229 |
(0.15) |
4 |
467 |
|
Vancomycin - intermediate Staphlococcus aureus (VISA) infection |
50 |
(0.04) |
39 |
(0.03) |
2 |
91 |
|
Vancomycin - resistant Staphylococcus aureus (VRSA) infection |
— |
(0.00) |
1 |
(0.00) |
1 |
2 |
|
Vibriosis |
567 |
(0.41) |
269 |
(0.19) |
10 |
846 |
|
Viral hemorrhagic fevers |
1 |
(0.00) |
— |
(0.00) |
— |
1 |
|
* Per 100,000 population. † No cases of anthrax; diphtheria; eastern equine encephalitis virus disease, non-neuroinvasive; poliomyelitis, paralytic; poliovirus, infection, nonparalytic; Powassan virus disease, non-neuroinvasive; rubella, congenital syndrome; severe acute respiratory syndrome-associated coronavirus disease (SARS-CoV); smallpox; western equine encephalitis virus disease, neuroinvasive and non-neuroinvasive, and yellow fever were reported in 2010. Data on hepatitis B virus, perinatal infection, chronic hepatitis B, and chronic hepatitis C virus infection are not included because they are undergoing data quality review. § Totals reported to the Division of Vector-Borne Diseases, National Center for Emerging and Zoonotic Infectious Diseases (ArboNET Surveillance), as of May 9, 2011. ¶ Cases among persons aged <15 years are not shown because some might not be caused by sexual transmission; these cases are included in the totals. Totals reported to the Division of STD Prevention, National Center for HIV/AIDS, Viral Hepatitis, STD, and TB Prevention (NCHHSTP), as of June 8, 2011. ** Totals reported to the Influenza Division, National Center for Immunization and Respiratory Diseases, as of December 31, 2010. †† Total number of HIV cases reported to the Division of HIV/AIDS Prevention, NCHHSTP through December 31, 2010. §§ Includes the following categories: primary, secondary, latent (including early latent, late latent, and latent syphilis of unknown duration), neurosyphilis, late (including late syphilis with clinical manifestations other than neurosyphilis), and congenital syphilis. ¶¶ Totals reported to the Division of TB Elimination, NCHHSTP, as of July 1, 2011. |
||||||
|
TABLE 5. Reported cases and incidence* of notifiable diseases,† by race — United States, 2010 |
|||||||||||
|---|---|---|---|---|---|---|---|---|---|---|---|
|
Disease |
American Indian or Alaska Native |
Asian or Pacific Islander |
Black |
White |
Other |
Race not stated |
Total |
||||
|
No. |
Rate |
No. |
Rate |
No. |
Rate |
No. |
Rate |
||||
|
Arboviral diseases§ |
|||||||||||
|
California serogroup virus, neuroinvasive |
2 |
(0.06) |
1 |
(0.01) |
2 |
(0.00) |
59 |
(0.02) |
1 |
3 |
68 |
|
West Nile virus |
|||||||||||
|
neuroinvasive |
14 |
(0.40) |
4 |
(0.03) |
31 |
(0.08) |
436 |
(0.18) |
15 |
129 |
629 |
|
nonneuroinvasive |
6 |
(0.17) |
2 |
(0.01) |
11 |
(0.03) |
248 |
(0.10) |
4 |
121 |
392 |
|
Botulism, total |
2 |
(0.06) |
3 |
(0.02) |
5 |
(0.01) |
57 |
(0.02) |
3 |
42 |
112 |
|
infant |
— |
(—) |
2 |
(0.86) |
4 |
(0.56) |
49 |
(1.51) |
2 |
23 |
80 |
|
other (wound and unspecified) |
0 |
(0.00) |
1 |
(0.01) |
0 |
(0.00) |
7 |
(0.00) |
0 |
17 |
25 |
|
Brucellosis |
2 |
(0.06) |
3 |
(0.02) |
7 |
(0.02) |
59 |
(0.02) |
5 |
39 |
115 |
|
Chlamydia trachomatis infection¶ |
16,041 |
(458.25) |
17,685 |
(113.89) |
457,952 |
(1,117.0) |
385,395 |
(156.04) |
38,988 |
391,832 |
1,307,893 |
|
Cryptosporidiosis, total |
56 |
(1.60) |
67 |
(0.43) |
617 |
(1.50) |
5,974 |
(2.42) |
216 |
2,014 |
8,944 |
|
confirmed |
51 |
(1.46) |
66 |
(0.43) |
585 |
(1.43) |
5,620 |
(2.28) |
165 |
1,888 |
8,375 |
|
probable |
5 |
(0.14) |
1 |
(0.01) |
32 |
(0.08) |
354 |
(0.14) |
51 |
126 |
569 |
|
Cyclosporiasis |
0 |
(0.00) |
1 |
(0.01) |
5 |
(0.01) |
129 |
(0.06) |
3 |
41 |
179 |
|
Denque fever |
1 |
(0.03) |
60 |
(0.39) |
32 |
(0.08) |
346 |
(0.14) |
45 |
206 |
690 |
|
Ehrlichiosis/Anaplasmosis |
|||||||||||
|
Ehrlichia chaffeensis |
26 |
(0.89) |
5 |
(0.04) |
24 |
(0.06) |
487 |
(0.21) |
12 |
186 |
740 |
|
Anaplasma phagocytophilum |
13 |
(0.45) |
11 |
(0.08) |
9 |
(0.02) |
1,117 |
(0.48) |
10 |
601 |
1,761 |
|
undetermined |
1 |
(0.03) |
0 |
(0.00) |
4 |
(0.01) |
72 |
(0.03) |
1 |
26 |
104 |
|
Giardiasis |
82 |
(2.63) |
1,203 |
(8.49) |
1,620 |
(4.86) |
7,520 |
(3.60) |
739 |
8,647 |
19,811 |
|
Gonorrhea |
2,865 |
(81.85) |
2,390 |
(15.39) |
169,216 |
(412.72) |
61,848 |
(25.04) |
6,116 |
66,906 |
309,341 |
|
Haemophilus influenzae, invasive disease, all ages, all serotypes |
54 |
(1.54) |
35 |
(0.23) |
392 |
(0.96) |
2,010 |
(0.81) |
56 |
604 |
3,151 |
|
age <5 yrs |
|||||||||||
|
nonserotype b |
7 |
(2.05) |
3 |
(0.25) |
35 |
(1.00) |
116 |
(0.71) |
5 |
34 |
200 |
|
unknown serotype |
18 |
(5.28) |
6 |
(0.51) |
43 |
(1.23) |
88 |
(0.54) |
7 |
61 |
223 |
|
Hansen disease (leprosy) |
0 |
(0.00) |
15 |
(0.10) |
5 |
(0.01) |
38 |
(0.02) |
1 |
39 |
98 |
|
Hemolytic uremic syndrome post-diarrheal |
3 |
(0.09) |
8 |
(0.05) |
8 |
(0.02) |
197 |
(0.09) |
11 |
39 |
266 |
|
Hepatitis, viral, acute |
|||||||||||
|
A |
7 |
(0.20) |
157 |
(1.01) |
101 |
(0.25) |
882 |
(0.36) |
67 |
456 |
1,670 |
|
B |
29 |
(0.83) |
94 |
(0.61) |
680 |
(1.66) |
1,798 |
(0.73) |
64 |
709 |
3,374 |
|
C |
23 |
(0.76) |
12 |
(0.08) |
42 |
(0.11) |
632 |
(0.27) |
7 |
133 |
849 |
|
Human immunodeficiency virus (HIV) diagnosis†† |
189 |
(5.40) |
586 |
(3.77) |
17,253 |
(42.08) |
10,501 |
(4.25) |
7,212 |
— |
35,741 |
|
Influenza-associated pediatric mortality** |
1 |
(0.17) |
2 |
(0.10) |
14 |
(0.17) |
40 |
(0.11) |
— |
4 |
61 |
|
Legionellosis |
8 |
(0.23) |
42 |
(0.27) |
568 |
(1.39) |
2,130 |
(0.86) |
48 |
550 |
3,346 |
|
Listeriosis |
1 |
(0.03) |
43 |
(0.28) |
66 |
(0.16) |
528 |
(0.21) |
22 |
161 |
821 |
|
Lyme disease, total |
97 |
(2.78) |
263 |
(1.79) |
352 |
(0.86) |
16,648 |
(6.75) |
167 |
12,631 |
30,158 |
|
Lyme disease, confirmed |
68 |
(1.95) |
201 |
(1.37) |
257 |
(0.63) |
12,193 |
(4.95) |
114 |
9,728 |
22,561 |
|
Lyme disease, probable |
29 |
(0.83) |
62 |
(0.42) |
95 |
(0.23) |
4,455 |
(1.81) |
53 |
2,903 |
7,597 |
|
Malaria |
4 |
(0.11) |
186 |
(1.20) |
867 |
(2.11) |
274 |
(0.11) |
58 |
384 |
1,773 |
|
Measles, total |
3 |
(0.09) |
6 |
(0.04) |
4 |
(0.01) |
40 |
(0.02) |
2 |
8 |
63 |
|
Measles, imported |
0 |
(0.00) |
4 |
(0.03) |
4 |
(0.01) |
23 |
(0.01) |
2 |
7 |
40 |
|
Meningococcal disease, invasive, all serogroups |
8 |
(0.23) |
25 |
(0.16) |
113 |
(0.28) |
526 |
(0.21) |
17 |
144 |
833 |
|
Meningococcal disease, serogroup. A,C,Y, and W-135 |
3 |
(0.09) |
8 |
(0.05) |
37 |
(0.09) |
193 |
(0.08) |
5 |
34 |
280 |
|
Meningococcal disease, serogroup B |
1 |
(0.03) |
2 |
(0.01) |
12 |
(0.03) |
97 |
(0.04) |
5 |
18 |
135 |
|
Meningococcal disease., serogroup. unknown |
3 |
(0.09) |
15 |
(0.10) |
62 |
(0.15) |
227 |
(0.09) |
7 |
92 |
406 |
|
Mumps |
1 |
(0.03) |
44 |
(0.28) |
39 |
(0.10) |
2,365 |
(0.96) |
16 |
147 |
2,612 |
|
Pertussis |
217 |
(6.20) |
532 |
(3.43) |
1,192 |
(2.91) |
17,451 |
(7.07) |
512 |
7,646 |
27,550 |
|
Q fever, total |
2 |
(0.06) |
1 |
(0.01) |
2 |
(0.00) |
88 |
(0.04) |
4 |
34 |
131 |
|
acute |
2 |
(0.06) |
1 |
(0.01) |
2 |
(0.00) |
73 |
(0.03) |
4 |
24 |
106 |
|
chronic |
0 |
(0.00) |
0 |
(0.00) |
0 |
(0.00) |
15 |
(0.01) |
0 |
10 |
25 |
|
TABLE 5. (Continued) Reported cases and incidence* of notifiable diseases,† by race — United States, 2010 |
|||||||||||
|---|---|---|---|---|---|---|---|---|---|---|---|
|
Disease |
American Indian or Alaska Native |
Asian or Pacific Islander |
Black |
White |
Other |
Race not stated |
Total |
||||
|
No. |
Rate |
No. |
Rate |
No. |
Rate |
No. |
Rate |
||||
|
Salmonellosis |
356 |
(10.17) |
1,502 |
(9.67) |
4,824 |
(11.77) |
31,386 |
(12.71) |
1,361 |
14,995 |
54,424 |
|
Shiga toxin-producing E.coli (STEC) |
31 |
(0.89) |
107 |
(0.69) |
234 |
(0.57) |
3,588 |
(1.45) |
149 |
1,367 |
5,476 |
|
Shigellosis |
194 |
(5.54) |
217 |
(1.40) |
3,383 |
(8.25) |
6,593 |
(2.67) |
620 |
3,779 |
14,786 |
|
Spotted fever rickettsiosis, total |
80 |
(2.37) |
18 |
(0.12) |
84 |
(0.21) |
1,269 |
(0.52) |
49 |
485 |
1,985 |
|
confirmed |
12 |
(0.34) |
1 |
(0.01) |
8 |
(0.02) |
113 |
(0.05) |
1 |
21 |
156 |
|
probable |
68 |
(1.95) |
18 |
(0.12) |
76 |
(0.19) |
1,163 |
(0.47) |
48 |
462 |
1,835 |
|
Streptococcal toxic-shock syndrome |
2 |
(0.11) |
6 |
(0.08) |
7 |
(0.03) |
108 |
(0.07) |
3 |
16 |
142 |
|
Streptococcus pneumoniae, invasive disease |
|||||||||||
|
all ages |
189 |
(10.16) |
149 |
(1.98) |
2,795 |
(10.38) |
9,803 |
(6.48) |
170 |
3,463 |
16,569 |
|
age <5 yr |
31 |
(12.89) |
50 |
(7.03) |
430 |
(15.36) |
938 |
(8.02) |
40 |
697 |
2,186 |
|
Syphilis, all stages¶,§§ |
214 |
(6.11) |
920 |
(5.92) |
21,619 |
(52.73) |
17,949 |
(7.27) |
1,340 |
3,792 |
45,834 |
|
congenital (age <1 yr)¶ |
1 |
(1.41) |
9 |
(3.84) |
209 |
(29.43) |
136 |
(4.19) |
14 |
8 |
377 |
|
primary and secondary¶ |
71 |
(2.03) |
217 |
(1.40) |
6,589 |
(16.07) |
5,842 |
(2.37) |
372 |
683 |
13,774 |
|
Tetanus |
0 |
(0.00) |
0 |
(0.00) |
2 |
(0.00) |
20 |
(0.01) |
1 |
3 |
26 |
|
Toxic-shock syndrome (other than streptococcal) |
0 |
(0.00) |
2 |
(0.02) |
5 |
(0.02) |
58 |
(0.03) |
2 |
15 |
82 |
|
Tuberculosis¶¶ |
187 |
(5.34) |
3,187 |
(20.52) |
2,726 |
(6.65) |
4,803 |
(1.94) |
130 |
149 |
11,182 |
|
Tularemia |
12 |
(0.34) |
1 |
(0.01) |
0 |
(0.00) |
82 |
(0.03) |
2 |
27 |
124 |
|
Typhoid fever |
0 |
(0.00) |
201 |
(1.29) |
34 |
(0.08) |
53 |
(0.02) |
51 |
128 |
467 |
|
Vancomycin-intermediate Staphylococcus aureus (VISA) |
0 |
(0.00) |
0 |
(0.00) |
18 |
(0.05) |
34 |
(0.02) |
1 |
38 |
91 |
|
Vibriosis |
1 |
(0.03) |
23 |
(0.15) |
57 |
(0.15) |
558 |
(0.25) |
196 |
846 |
|
|
* Per 100,000 population. Diseases for which <25 cases were reported are not included in this table. † No cases of anthrax; diphtheria; eastern equine encephalitis virus disease, nonneuroinvasive; poliomyelitis, paralytic; poliovirus, infection, nonparalytic; Powassan virus disease, non-neuroinvasive; rubella, congenital syndrome; severe acute respiratory syndrome-associated coronavirus disease (SARS-CoV); smallpox, western equine encephalitis virus disease, neuroinvasive and nonneuroinvasive; and yellow fever were reported in 2010. Data on hepatitis B virus, perinatal infection, chronic hepatitis B, and chronic hepatitis C virus infection are not included because they are undergoing data quality review. § Totals reported to the Division of Vector-Borne Diseases, National Center for Emerging and Zoonotic Infectious Diseases (ArboNET Surveillance), as of May 9, 2011. ¶ Cases among persons aged <15 years are not shown because some might not be caused by sexual transmission; these cases are included in the totals. Totals reported to the Division of STD Prevention, National Center for HIV/AIDS, Viral Hepatitis, STD, and TB Prevention (NCHHSTP), as of June 8, 2011. ** Totals reported to the Influenza Division, National Center for Immunization and Respiratory Diseases, as of December 31, 2010. †† Total number of HIV cases reported to the Division of HIV/AIDS Prevention, NCHHSTP through December 31, 2010. §§ Includes the following categories: primary, secondary, latent (including early latent, late latent, and latent syphilis of unknown duration), neurosyphilis, late (including late syphilis with clinical manifestations other than neurosyphilis), and congenital syphilis. ¶¶ Totals reported to the Division of TB Elimination, NCHHSTP, as of July 1, 2011. |
|||||||||||
|
TABLE 6. Reported cases and incidence* of notifiable diseases,† by ethnicity — United States, 2010 |
||||||
|---|---|---|---|---|---|---|
|
Disease |
Hispanic |
Non-Hispanic |
Ethnicity not stated |
Total |
||
|
No. |
Rate |
No. |
Rate |
|||
|
Arboviral diseases§ |
||||||
|
California serogroup virus, neuroinvasive |
1 |
(0.00) |
53 |
(0.02) |
14 |
68 |
|
West Nile virus |
89 |
(0.18) |
360 |
(0.14) |
180 |
629 |
|
nonneuroinvasive |
25 |
(0.05) |
230 |
(0.09) |
137 |
392 |
|
Botulism, total |
32 |
(0.07) |
57 |
(0.02) |
23 |
112 |
|
infant |
20 |
(1.81) |
46 |
(1.46) |
14 |
80 |
|
other (wound and unspecified) |
11 |
(0.02) |
9 |
(0.00) |
5 |
25 |
|
Brucellosis |
57 |
(0.12) |
36 |
(0.01) |
22 |
115 |
|
Chlamydia trachomatis infection¶ |
178,979 |
(369.64) |
622,999 |
(240.92) |
505,915 |
1,307,893 |
|
Cryptosporidiosis, total |
571 |
(1.18) |
5,408 |
(2.09) |
2,965 |
8,944 |
|
confirmed |
526 |
(1.09) |
5,065 |
(1.96) |
2,784 |
8,375 |
|
probable |
45 |
(0.09) |
343 |
(0.13) |
181 |
569 |
|
Cyclosporiasis |
18 |
(0.04) |
123 |
(0.05) |
38 |
179 |
|
Denque fever |
236 |
(0.49) |
291 |
(0.11) |
163 |
690 |
|
Ehrlichiosis, Anaplasmosis |
||||||
|
Ehrlichia chaffeensis |
11 |
(0.02) |
418 |
(0.17) |
311 |
740 |
|
Anaplasma phagocytophilum |
12 |
(0.03) |
951 |
(0.39) |
798 |
1,761 |
|
Undetermined |
0 |
(0.00) |
60 |
(0.03) |
44 |
104 |
|
Giardiasis |
1,374 |
(3.61) |
8,605 |
(3.89) |
9,832 |
19,811 |
|
Gonorrhea¶ |
24,168 |
(49.91) |
179,264 |
(69.32) |
105,909 |
309,341 |
|
Haemophilus influenzae, invasive disease, all ages, serotypes |
203 |
(0.42) |
1,868 |
(0.72) |
1,080 |
3,151 |
|
age <5 yrs nonserotype |
31 |
(0.57) |
106 |
(0.67) |
63 |
200 |
|
age <5 yrs unknown serotype |
37 |
(0.67) |
117 |
(0.74) |
69 |
223 |
|
Hansen disease (leprosy) |
22 |
(0.05) |
39 |
(0.02) |
37 |
98 |
|
Hemolytic uremic syndrome post-diarrheal |
33 |
(0.07) |
172 |
(0.07) |
61 |
266 |
|
Hepatitis, viral, acute |
||||||
|
A |
351 |
(0.72) |
894 |
(0.35) |
425 |
1,670 |
|
B |
310 |
(0.64) |
2,100 |
(0.82) |
964 |
3,374 |
|
C |
65 |
(0.14) |
532 |
(0.22) |
252 |
849 |
|
Human immunodeficiency virus (HIV) diagnosis†† |
6,741 |
(13.92) |
29,000 |
(11.21) |
— |
35,741 |
|
Influenza-associated pediatric mortality** |
10 |
(0.06) |
41 |
(0.07) |
10 |
61 |
|
Legionellosis |
181 |
(0.37) |
2,186 |
(0.85) |
979 |
3,346 |
|
Listeriosis |
121 |
(0.25) |
494 |
(0.19) |
206 |
821 |
|
Lyme disease, total |
510 |
(1.06) |
12,510 |
(4.86) |
17,138 |
30,158 |
|
confirmed |
340 |
(0.70) |
9,408 |
(3.65) |
12,813 |
22,561 |
|
probable |
170 |
(0.35) |
3,102 |
(1.21) |
4,325 |
7,597 |
|
Malaria |
49 |
(0.10) |
1,257 |
(0.49) |
467 |
1,773 |
|
Measles, total |
7 |
(0.01) |
45 |
(0.02) |
11 |
63 |
|
imported |
3 |
(0.01) |
27 |
(0.01) |
10 |
40 |
|
Meningococcal disease, invasive, all serogroups |
123 |
(0.25) |
507 |
(0.20) |
203 |
833 |
|
serogroup A,C,Y, and W-135 |
44 |
(0.09) |
172 |
(0.07) |
64 |
280 |
|
serogroup B |
15 |
(0.03) |
86 |
(0.03) |
34 |
135 |
|
serogroup unknown |
64 |
(0.13) |
238 |
(0.09) |
104 |
406 |
|
Mumps |
160 |
(0.33) |
2,294 |
(0.89) |
158 |
2,612 |
|
Pertussis |
5,272 |
(10.89) |
16,317 |
(6.31) |
5,961 |
27,550 |
|
Q fever, total |
18 |
(0.04) |
82 |
(0.03) |
31 |
131 |
|
acute |
17 |
(0.04) |
71 |
(0.03) |
18 |
106 |
|
chronic |
1 |
(0.00) |
11 |
(0.00) |
13 |
25 |
|
Salmonellosis |
6,959 |
(14.37) |
30,040 |
(11.62) |
17,425 |
54,424 |
|
Shiga toxin-producing E.coli (STEC) |
587 |
(1.21) |
3,364 |
(1.30) |
1,525 |
5,476 |
|
Shigellosis |
3,331 |
(6.88) |
7,520 |
(2.91) |
3,935 |
14,786 |
|
Spotted fever rickettsiosis, total |
57 |
(0.12) |
1,207 |
(0.47) |
721 |
1,985 |
|
confirmed |
5 |
(0.01) |
113 |
(0.04) |
38 |
156 |
|
probable |
52 |
(0.11) |
1,101 |
(0.43) |
682 |
1,835 |
|
Streptococcal toxic-shock syndrome |
10 |
(0.05) |
77 |
(0.04) |
55 |
142 |
|
Streptococcus pneumoniae, invasive disease, all ages |
1,263 |
(4.56) |
8,516 |
(5.32) |
6,790 |
16,569 |
|
age <5 yrs |
285 |
(8.15) |
922 |
(7.72) |
979 |
2,186 |
|
Syphilis, total, all stages¶, §§ |
9,762 |
(20.16) |
32,414 |
(12.54) |
3,658 |
45,834 |
|
congenital (age <1 yr)¶ |
89 |
(8.06) |
278 |
(8.81) |
10 |
377 |
|
primary and secondary¶ |
2,238 |
(4.62) |
10,803 |
(4.18) |
733 |
13,774 |
|
Tetanus |
1 |
(0.00) |
14 |
(0.01) |
11 |
26 |
|
TABLE 6. (Continued) Reported cases and incidence* of notifiable diseases,† by ethnicity — United States, 2010 |
||||||
|---|---|---|---|---|---|---|
|
Disease |
Hispanic |
Non-Hispanic |
Ethnicity not stated |
Total |
||
|
No. |
Rate |
No. |
Rate |
|||
|
Toxic-shock syndrome (other than streptococcal) |
5 |
(0.02) |
47 |
(0.02) |
30 |
82 |
|
Tuberculosis¶¶ |
3,236 |
(6.68) |
7,907 |
(3.06) |
39 |
11,182 |
|
Tularemia |
5 |
(0.01) |
86 |
(0.03) |
33 |
124 |
|
Typhoid fever |
39 |
(0.08) |
330 |
(0.13) |
98 |
467 |
|
Vancomycin-intermediate Staphylococcus aureus (VISA) |
6 |
(0.02) |
24 |
(0.01) |
61 |
91 |
|
Vibriosis |
70 |
(0.15) |
522 |
(0.22) |
254 |
846 |
|
* Per 100,000 population. Diseases for which <25 cases were reported are not included in this table. † No cases of anthrax; diphtheria; eastern equine encephalitis virus disease, nonneuroinvasive; poliomyelitis, paralytic; poliovirus, infection, nonparalytic; Powassan virus disease; non-neuroinvasive; rubella, congenital syndrome; severe acute respiratory syndrome-associated coronavirus disease (SARS-CoV), smallpox, western equine encephalitis virus disease, neuroinvasive and nonneuroinvasive; and yellow fever were reported in 2010. Data on hepatitis B virus, perinatal infection are not included. Data on chronic hepatitis B and chronic hepatitis C virus infection are not included because they are undergoing data quality review. § Totals reported to the Division of Vector-Borne Diseases, National Center for Emerging and Zoonotic Infectious Diseases (ArboNET Surveillance), as of May 9, 2011. ¶ Cases among persons aged <15 years are not shown because some might not be caused by sexual transmission; these cases are included in the totals. Totals reported to the Division of STD Prevention, National Center for HIV/AIDS, Viral Hepatitis, STD, and TB Prevention (NCHHSTP), as of June 8, 2011. ** Totals reported to the Influenza Division, National Center for Immunization and Respiratory Diseases, as of December 31, 2010. †† Total number of HIV cases reported to the Division of HIV/AIDS Prevention, NCHHSTP through December 31, 2010. §§ Includes the following categories: primary, secondary, latent (including early latent, late latent, and latent syphilis of unknown duration), neurosyphilis, late (including late syphilis with clinical manifestations other than neurosyphilis), and congenital syphilis. ¶¶ Totals reported to the Division of TB Elimination, NCHHSTP, as of July 1, 2011. |
||||||
PART 2
Graphs and Maps for Selected Notifiable Diseases in the United States, 2010
Abbreviations and Symbols Used in Graphs and Maps
U Data not available.
N Not reportable (i.e., report of disease not required in that jurisdiction).
DC District of Columbia
NYC New York City
AS American Samoa
CNMI Commonwealth of Northern Mariana Islands
GU Guam
PR Puerto Rico
VI U.S. Virgin Islands
Anthrax. Number of reported cases, by year — United States, 1955–2010
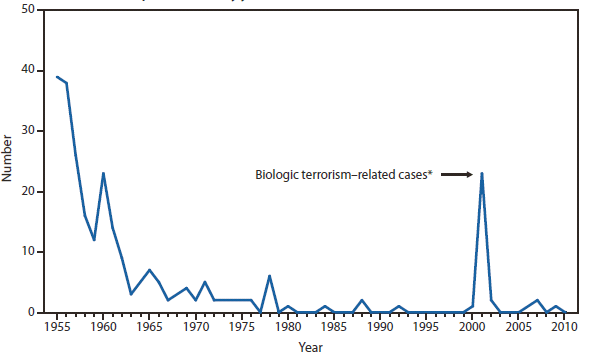
* One epizootic-associated cutaneous case was reported in 2001 from Texas.
No cases of anthrax were reported to CDC in 2010. Two or fewer naturally occurring cases have been reported in the United States and U.S. territories per year for the past 30 years.
Alternate Text: ANTHRAX - This figure is a line graph that presents the number of anthrax cases by year in the United States from 1955 to 2010.
ARBOVIRAL DISEASES. Number* of reported cases of neuroinvasive disease, by year — United States, 2001–2010
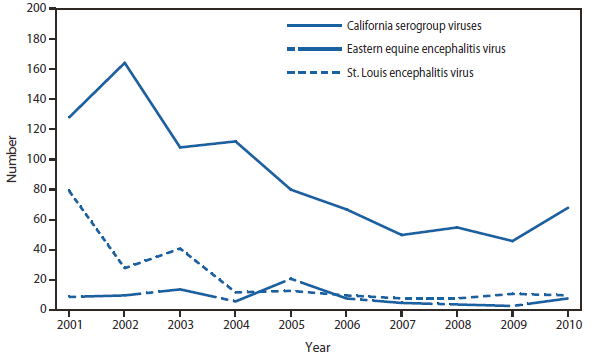
* Data from the Division of Vector-Borne Diseases, National Center for Emerging and Zoonotic Infectious Diseases (ArboNET Surveillance). Only reported cases of neuroinvasive disease are shown.
The most common arthropod-borne viruses (arboviruses) that cause neuroinvasive disease in humans in the United States are West Nile virus (WNV), La Crosse virus (LACV), St. Louis encephalitis virus (SLEV), and eastern equine encephalitis virus (EEEV). LACV is the most common California (CAL) serogroup virus in the United States. LACV causes neuroinvasive disease primarily among children. In 2010, 68 cases of CAL serogroup virus neuroinvasive disease, including 67 cases caused by LACV, were reported from 10 states (Georgia, Kentucky, Maryland, Michigan, Minnesota, North Carolina, Ohio, Tennessee, Texas, and West Virginia); 60 (88%) of the cases occurred among children aged <18 years. During 2001–2010, a median of 71 (range: 46–167) cases per year were reported in the United States. EEEV disease in humans is associated with high mortality rates (>20%) and severe neurologic sequelae. In 2010, 10 cases of EEEV neuroinvasive disease cases were reported from five states (Florida, Massachusetts, Michigan, New York, and Rhode Island). Five (50%) of the 10 reported cases were fatal. During 2001–2010, a median of nine (range: 3–21) cases per year were reported in the United States. Before the introduction of WNV, SLEV was the leading cause of arboviral encephalitis in the United States, with periodic large outbreaks with hundreds to thousands of cases. In 2010, eight cases of SLEV neuroinvasive disease were reported from four states (Arkansas, Michigan, Missouri, and Texas). During 2001–2010, a median of 7 (range: 7–79) cases per year were reported in the United States. Whether the recent decline in the number of reported SLEV disease cases is related to normal periodicity in viral activity, surveillance artifact, or possible competitive displacement of SLEV by WNV is unknown.
Alternate Text: ARBOVIRAL - This figure is a line graph that presents the number of cases of neuroinvasive disease, broken down by California serogroup viruses, Eastern equine encephalitis virus, and St. Louis encephalitis virus, from 2001 to 2010.
ARBOVIRAL DISEASES, WEST NILE VIRUS. Incidence* of reported cases of neuroinvasive disease, by state — United States, 2010
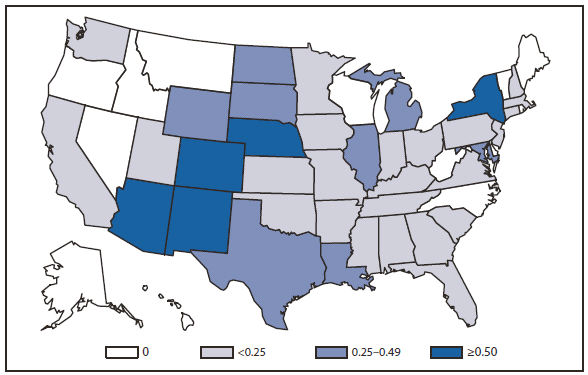
* Per 100,000 population. Data from the Division of Vector-Borne Diseases, National Center for Emerging and Zoonotic Infectious Diseases (ArboNET Surveillance).
In 2010, the states with the highest reported incidence of West Nile virus (WNV) neuroinvasive disease were Arizona (1.60 per 100,000), New Mexico (1.03), Nebraska (0.55), and Colorado (0.51). The four states with the highest number of reported cases were Arizona (107), New York (89), Texas (77), and California (72). Arizona reported 17% of all WNV neuroinvasive disease cases in 2010.
Alternate Text: WEST NILE - This figure is a map of the United States that presents incidence range per 100,000 population of West Nile virus cases in each state in 2010.
ARBOVIRAL DISEASES, WEST NILE VIRUS. Incidence* of reported cases of neuroinvasive disease, by year — United States, 2001–2010
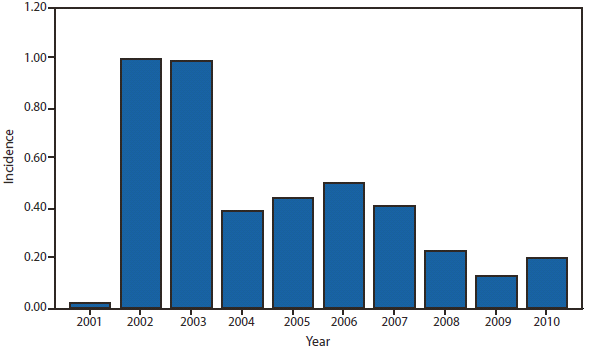
* Per 100,000 population. Data from the Division of Vector-Borne Diseases, National Center for Emerging and Zoonotic Infectious Diseases (ArboNET Surveillance).
West Nile virus (WNV) was first detected in the United States in 1999. Despite substantial geographic spread of the virus from 1999 through 2001, WNV neuroinvasive disease incidence remained low until 2002, when there were large outbreaks in the Midwest and Great Plains. The national incidence of WNV neuroinvasive disease peaked in 2002 and 2003 and was relatively stable from 2004 through 2007. WNV had appeared to reach a stable incidence but incidence decreased in 2008 and continued to decline in 2009. However, in 2010, the number of reported WNV neuroinvasive disease cases increased 62% from that reported in 2009. The reported incidence of WNV neuroinvasive disease in the United States in 2010 was 0.20 per 100,000 population.
Alternate Text: WEST NILE - This figure is a bar chart that presents the incidence per 100,000 population of West Nile virus cases in the United States each year from 2001 to 2010.
ARBOVIRAL DISEASES, WEST NILE VIRUS. Incidence* of reported cases of neuroinvasive disease, by age group — United States, 2010
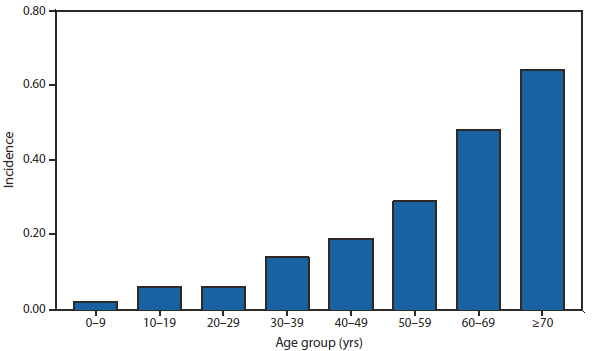
* Per 100,000 population. Data from the Division of Vector-Borne Diseases, National Center for Emerging and Zoonotic Infectious Diseases (ArboNET Surveillance).
In 2010, the median age of patients with West Nile virus neuroinvasive disease was 59 years (range: 1– 98 years), with increasing incidence among older age groups.
Alternate Text: WEST NILE - This figure is a bar chart that presents the incidence per 100,000 population of West Nile virus cases in the United States by age group during 2010.
BOTULISM, FOODBORNE Number of reported cases, by year — United States, 1990–2010
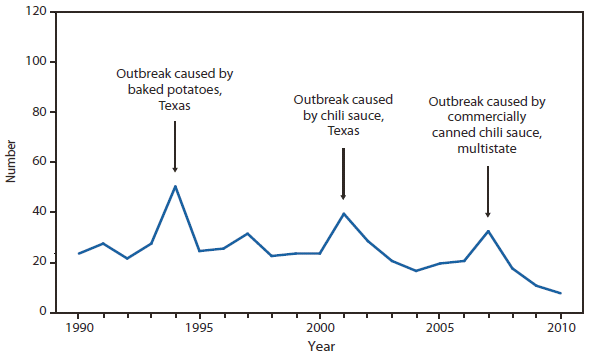
Numbers of foodborne botulism cases have remained stable during the past 2 decades. In 2010, cases were caused by consumption of home-canned foods, Alaska Native aquatic game foods, and baked potato.
Alternate Text: BOTULISM (foodborne) - The figures is a line graph that presents the number of foodborne-related botulism cases in the United States from 1990 to 2010.
BOTULISM, INFANT. Number of reported cases, by year — United States, 1990–2010
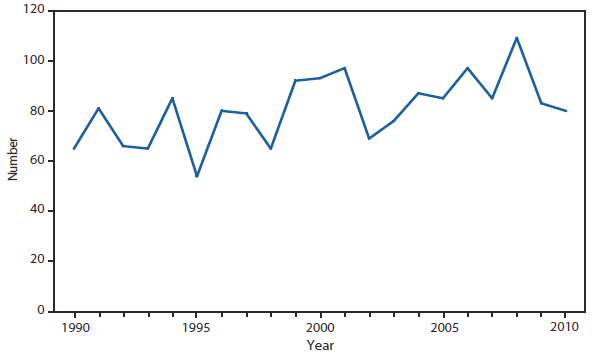
Infant botulism remains the most common cause of botulism in the United States and accounted for 76% of U.S. botulism cases in 2010.
Alternate Text: BOTULISM (Infants) - This figure is a line graph that presents the number of botulism cases in U.S. infants from 1990 to 2010.
BOTULISM, OTHER (Includes wound and unspecified). Number of reported cases, by year — United States, 2000–2010
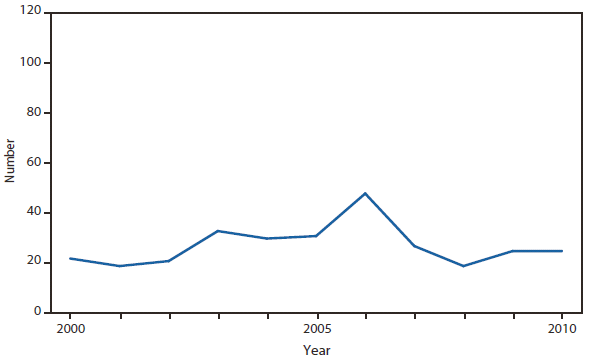
Annual numbers of wound and unspecified forms of botulism have remained stable during the past decade. In 2010, the majority (94%) of cases occurred among injection-drug users in California.
Alternate Text: BOTULISM (other) - This figure is a line graph that presents the number of wound-related and unspecified botulism cases in the United States from 2000 to 2010.
Brucellosis. Number of reported cases, by year — United States, 1980–2010
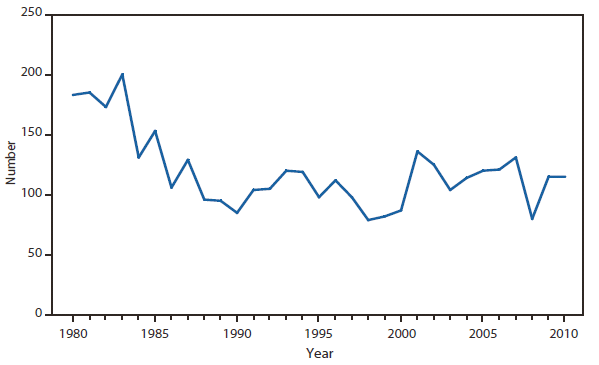
In the last decade, the highest number of brucellosis cases was reported in 2001. Reported cases for 2009 and 2010 were the same.
Alternate Text: BRUCELLOSIS - This figure is a line graph that presents the number of brucellosis cases in the United States from 1980 to 2010.
Brucellosis. Number of reported cases — United States and U.S. territories, 2010
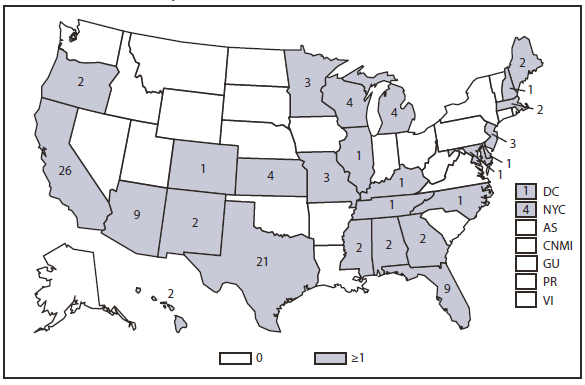
The highest number (56.5%) of brucellosis cases was reported by California, Texas, Arizona, and Florida.
Alternate Text: BRUCELLOSIS - This figure is a map of the United States and U.S. territories that presents the number of brucellosis cases in each state and territory in 2010.
Chlamydia. Incidence* among women — United States and U.S. territories, 2010
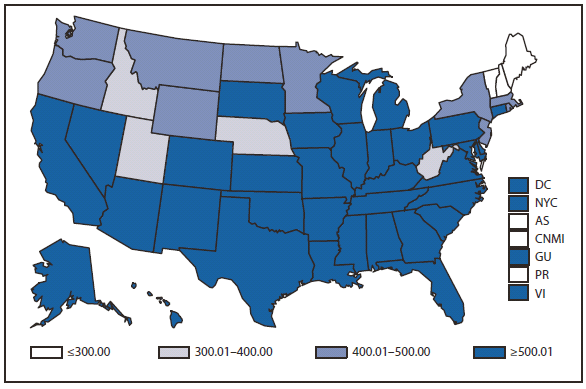
* Per 100,000 population.
In 2010, the chlamydia rate among women in the United States and U. S. territories (Guam, Puerto Rico, and Virgin Islands) was 605.8 cases per 100,000 population.
Alternate Text: CHLAMYDIA - This figure is a map of the United States and U.S. territories that presents the incidence per 100,000 population of chlamydia among women in 2010.
Cholera. Number of reported cases — United States and U.S. territories, 2010
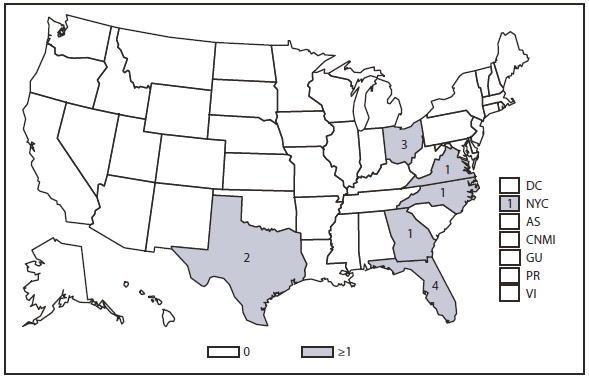
In 2010, all cholera infections in the United States were acquired during travel; six patients reported travel to Haiti, where a cholera epidemic started in October, and seven had travelled to other cholera-affected countries.
Alternate Text: CHOLERA - This figure is a map of the United States and U.S. territories that presents the number of cholera cases in each state and territory in 2010.
Cryptosporidiosis. Incidence,* by year — United States, 1999–2010
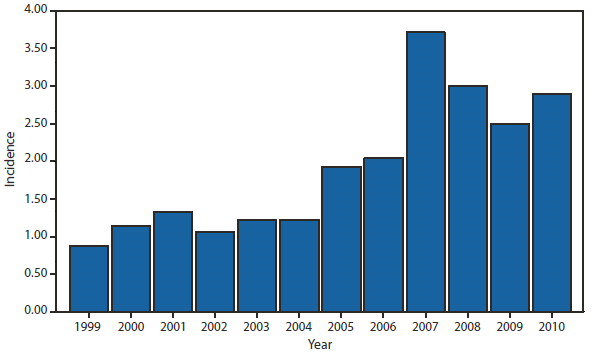
* Per 100,000 population.
Cryptosporidiosis incidence remained relatively stable during 2008–2010 following a >3-fold increase during 2004–2007. Whether the changes in cryptosporidiosis reporting reflect a real change in cryptosporidiosis incidence, revision to the case definition as of 2009 (i.e., adding clinical criteria to the case definition), or changing diagnosis, testing, or reporting patterns is unclear.
Alternate Text: CRYPTOSPORIDIOSIS - This figure is a bar chart that presents the incidence per 100,000 population of cryptosporidiosis cases in the United States from 1999 to 2010.
Cryptosporidiosis. Incidence* — United States and U.S. territories, 2010
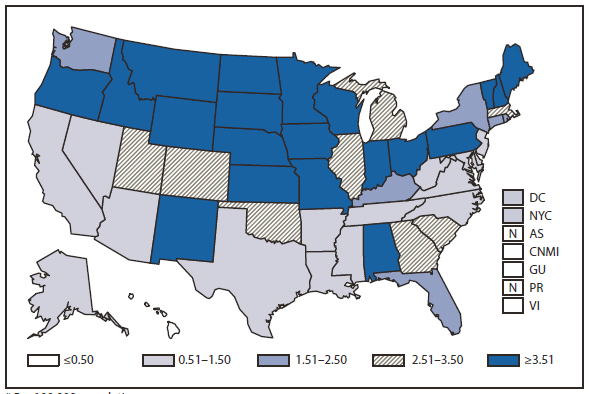
* Per 100,000 population.
Cryptosporidiosis is widespread geographically in the United States. Although incidence appears to be higher in northern states, differences in reported incidence among states might reflect differences in risk factors, number of cases associated with outbreaks, or in the capacity to detect and report cases. Cryptosporidiosis incidence increases during summer, coinciding with increased use of recreational water.
Alternate Text: CRYPTOSPORIDIOSIS - This figure is a map of the United States and U.S. territories that presents the incidence range per 100,000 population of cryptosporidiosis cases in each state and territory in 2010.
DENGUE VIRUS INFECTION. Number of reported cases, by age group — United States, 2010
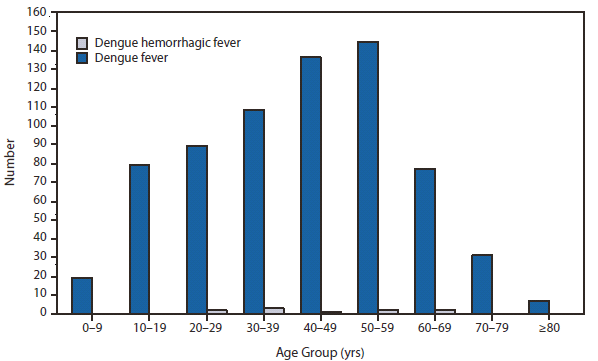
Data from the Division of Vector-Borne Diseases, National Center for Emerging and Zoonotic Infectious Diseases (ArboNET Surveillance).
In 2010, dengue fever and dengue hemorrhagic fever were made nationally notifiable diseases in the United States. This bar graph represents the number of travel and locally acquired cases of dengue fever and dengue hemorrhagic fever with illness onset in 2010 stratified by age group. The median age of persons with dengue fever was 44 years (range: 1–89 years); most cases occurred in persons aged 50–59 years. The median age for persons with dengue hemorrhagic fever was 40.5 years (range: 28–65).
Alternate Text: DENGUE - The figure is a bar chart of the number of reported cases of dengue virus infection by age group in the United States in 2010
DENGUE fever and dengue hemorrhagic fever. Number of reported cases, by location of residence* — United States and U.S. territories, 2010
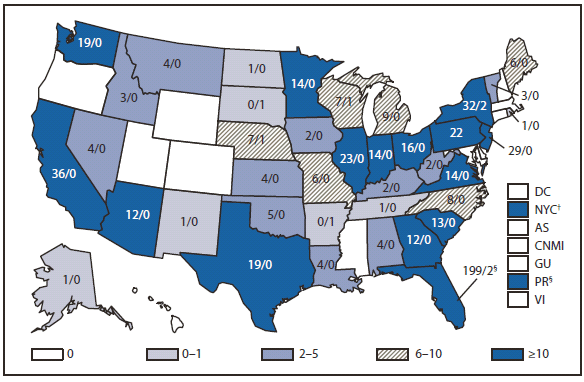
* Number of dengue fever cases/number of dengue hemorrhagic fever cases.
† New York City reported cases 141/3.
§ States and territories with locally acquired cases: Florida 55/2 and Puerto Rico 10,674/237.
Data from the Division of Vector-Borne Diseases, National Center for Emerging and Zoonotic Infectious Diseases (ArboNET Surveillance).
In 2010, dengue fever and dengue hemorrhagic fever were made nationally notifiable diseases in the United States. The numbers on this map represent the number of dengue fever and dengue hemorrhagic fever cases with illness onset in 2010 by residence. Both travel-associated and locally acquired cases are presented. Florida, New York City, California, Illinois, and New York had the highest number of travel- associated cases. Florida and the U.S. territory of Puerto Rico were the only jurisdictions reporting locally acquired dengue cases.
Alternate Text: DENGUE - The figure is a map of the United States that presents the number of cases of dengue fever and dengue hemorrhagic fever in the United States and its territories in 2010
EHRLICHIOSIS, ANAPLASMA PHAGOCYTOPHILUM. Number of reported cases, by county — United States, 2010
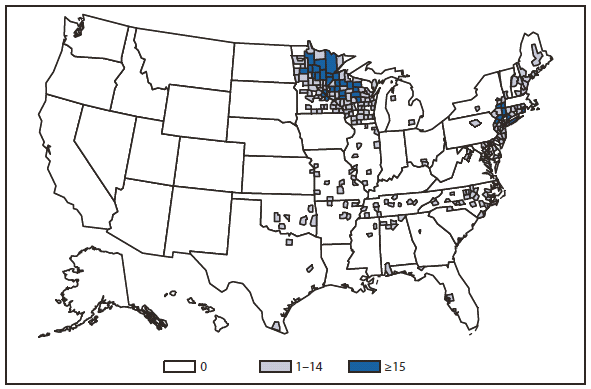
Anaplasmosis is caused by infection with Anaplasma phagocytophilum. Cases are reported primarily from the upper Midwest and coastal New England, reflecting both the range of the primary tick vector species (Ixodes scapularis) and the range of preferred animal hosts for tick feeding.
Alternate Text: EHRLICHIOSIS - This figure is a map of the United States that presents the number of ehrlichiosis (anaplasma phagocytophilum) cases by county in 2010.
EHRLICHIOSIS, EHRLICHIA CHAFFEENSIS. Number of reported cases, by county — United States, 2010
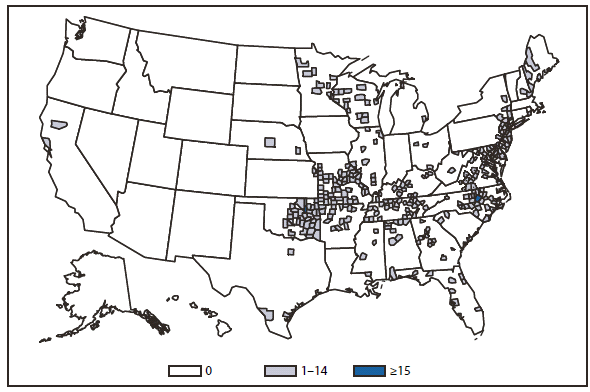
The most common type of ehrlichiosis results from infection with Ehrlichia chaffeensis. Cases are reported primarily in the lower Midwest, Southeast, and East Coast, reflecting the range of the primary tick vector species (Amblyomma americanum).
Alternate Text: EHRLICHIOSIS - This figure is a map of the United States that presents the number of Ehrlichiosis (Ehrlichia chaffeensis) cases by county in 2010.
EHRLICHIOSIS, EhRLICHIA EWINGII. Number of reported cases, by county — United States, 2010
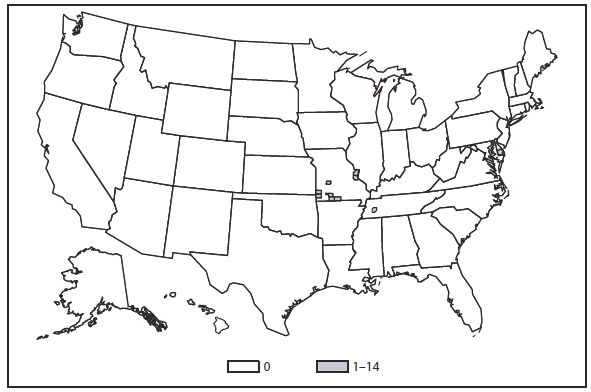
Cases of ehrlichiosis caused by Ehrlichia ewingii remain rare and are reported primarily from the central United States.
Alternate Text: EHRLICHIOSIS - This figure is a map of the United States that presents the number of Ehrlichiosis (Ehrlichia ewingii) cases in by county in 2010
EHRLICHIOSIS, undetermined. Number of reported cases, by county — United States, 2010
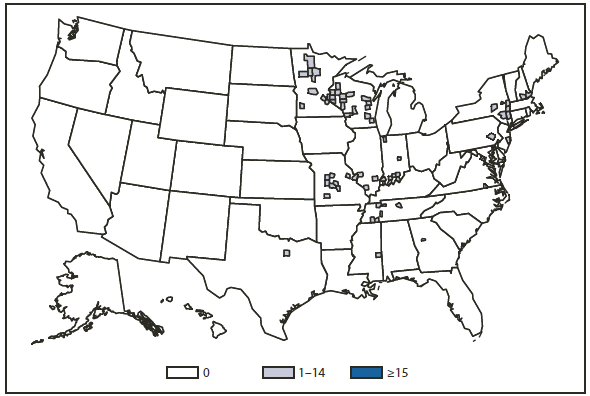
Cases of ehrlichiosis and anaplasmosis caused by undetermined species, or more commonly, cases for which the geographically expected species is not clearly differentiated by serologic testing, are reflected in this reporting category. Because Ehrlichia and Anaplasma infections might elicit cross-reactive antibody responses, some states also might use this category to report cases for which single, inappropriate diagnostic tests were run (e.g., physicians ordering only ehrlichiosis tests in a region where anaplasmosis is expected to predominate).
Alternate Text: EHRLICHIOSIS - This figure is a map of the United States that presents the number of Ehrlichiosis (undetermined) cases by county in 2010.
GIARDIASIS. Incidence* — United States and U.S. territories, 2010
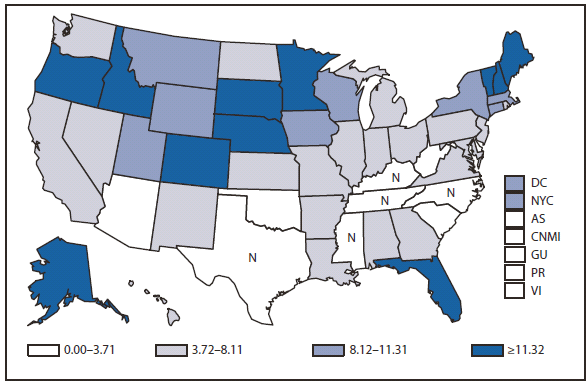
* Per 100,000 population.
Giardiasis is widespread geographically in the United States, with increased reporting in certain states and regions. State incidence ranges from 1.7 to 29.7. Whether this difference is of true biologic significance or reflects differences in giardiasis case detection and reporting among states is unclear.
Alternate Text: GIARDIASIS - This figure is a map of the United States and U.S. territories that presents the incidence range per 100,000 population of giardiasis cases in each state and territory in 2010.
Gonorrhea. Incidence* — United States and U.S. territories, 2010
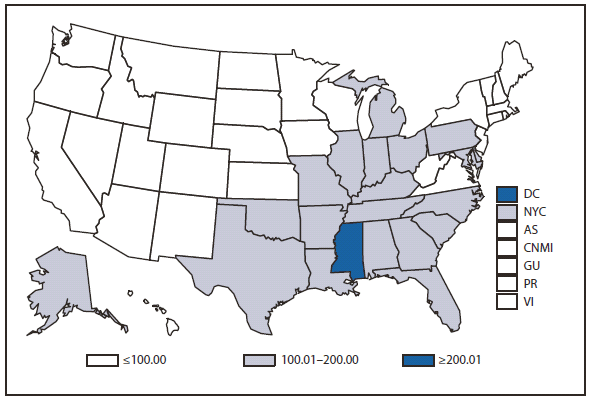
* Per 100,000 population.
In 2010, the gonorrhea rate in the United States and U.S. territories (Guam, Puerto Rico, and Virgin Islands) was 99.6 cases per 100,000 population, an increase from the rate in 2009.
Alternate Text: GONORRHEA - This figure is a map of the United States and U.S. territories that presents the incidence range per 100,000 population of gonorrhea cases in each state and territory in 2010.
Gonorrhea. Incidence,* by sex — United States, 1995–2010
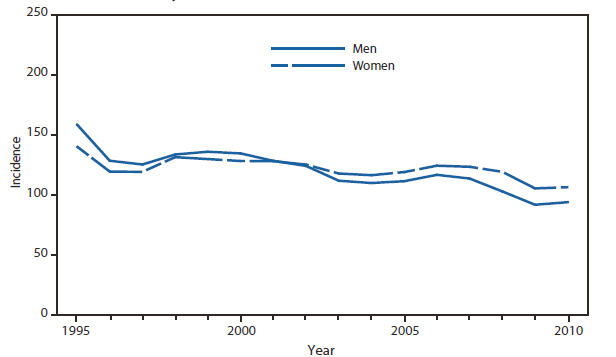
* Per 100,000 population.
For the ninth year in a row, the gonorrhea rate among women was slightly higher than the rate among men.
Alternate Text: GONORRHEA - This figure is a line graph that presents the incidence per 100,000 population of gonorrhea cases in the United States, with separate lines for men and women, from 1995 to 2010.
Gonorrhea. Incidence,* by race/ethnicity — United States, 1995–2010
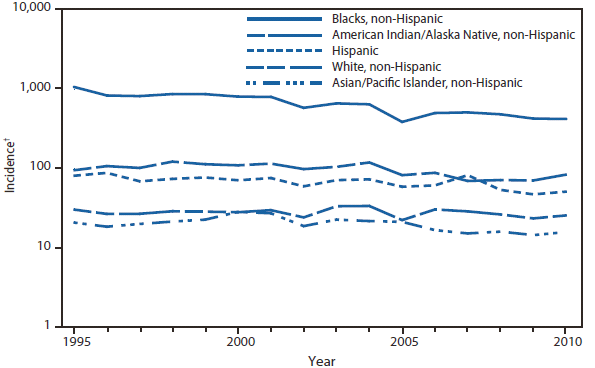
* Per 100,000 population.
† Y-axis is log scale.
Gonorrhea incidence among blacks decreased considerably during the 1990s but continues to be the highest among all races/ethnicities. In 2010, incidence among non-Hispanic blacks was approximately 20 times greater than that for non-Hispanic whites.
Alternate Text: GONORRHEA - This figure is a line graph that presents the incidence per 100,000 population of gonorrhea cases in the United States by race/ethnicity, with separate lines for black non-Hispanic, white non-Hispanic, American Indian/Alaska Native non-Hispanic, Asian/Pacific Islander non-Hispanic, and Hispanic, from 1995 to 2010.
Haemophilus influenzae, Invasive Disease. Incidence,* by age group — United States, 1997–2010
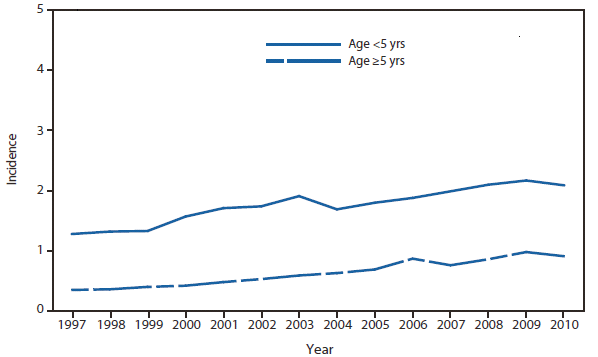
* Per 100,000 population.
Substantial reductions in the incidence of Haemophilus influenzae serotype b (Hib) disease have been achieved through universal Hib vaccination. Before the introduction of conjugate vaccines in 1987, the incidence of invasive Hib disease among children aged <5 years was estimated to be 100 cases per 100,000 population. To ensure appropriate chemoprophylaxis measures for contacts of Hib invasive disease and to detect the emergence of invasive non-Hib, serotyping of all Haemophilus influenzae isolates in children aged <5 years and thorough and timely investigation of all cases of Hib disease are essential.
Alternate Text: HAEMOPHILUS INFLUENZAE - This figure is a line graph that presents the incidence per 100,000 population of invasive Haemophilus influenzae in the United States, with separate lines for persons aged <5 years and aged >5 years, from 1995 to 2010.
Hansen Disease (Leprosy). Number of reported cases, by year — United States, 1990–2010
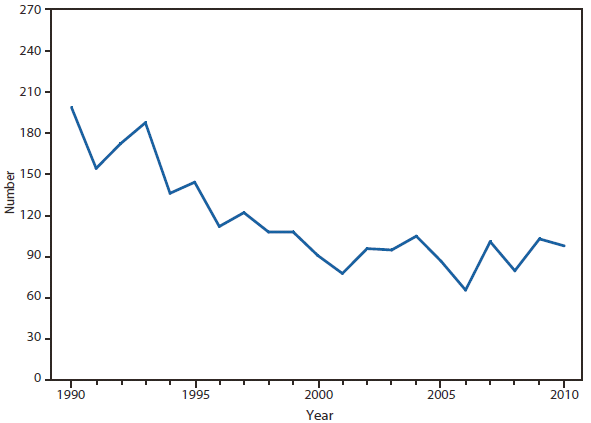
During the last two decades, the highest number of Hansen disease (HD) cases was reported in 1990. During 2010, reported HD cases decreased by 4.8% compared with 2009.
Alternate Text: HANSEN DISEASE - This figure is a line graph that presents the number of Hansen disease cases, also known as leprosy, in the United States from 1990 to 2010.
Hemolytic Uremic Syndrome, Postdiarrheal. Number of reported cases — United States and U.S. territories, 2010
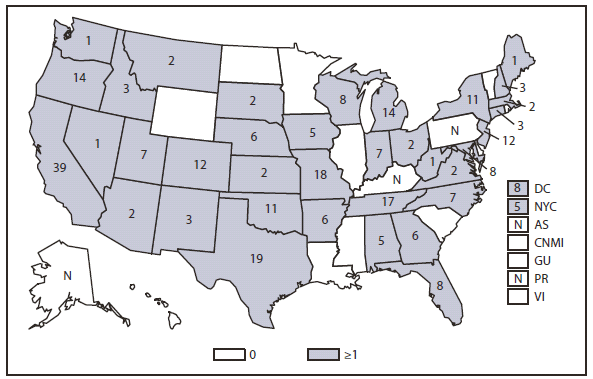
During 2010, most cases occurred among children aged 1–4 years followed by children aged 5–9 years. Hemolytic uremic syndrome has been a nationally notifiable disease since 1995. In 2010, cases continued to be reported from all regions in the country. Reporting is likely not complete.
Alternate text: HEMOLYTIC UREMIC SYNDROME - This figure is a map of the United States and U.S. territories that presents the number of hemolytic uremic, postdiarrheal cases in each state and territory in 2010.
Hepatitis, Viral. Incidence,* by year — United States, 1980–2010
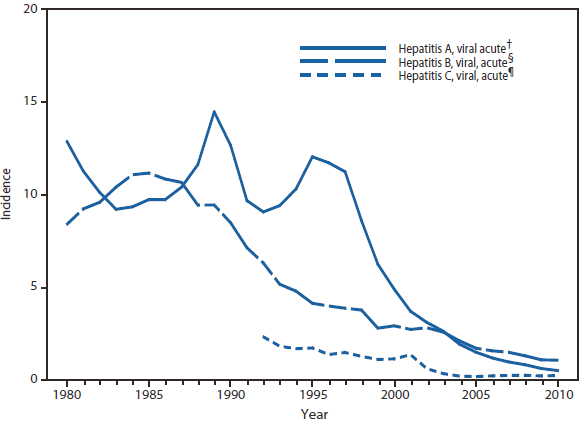
* Per 100,000 population.
† Hepatitis A vaccine was first licensed in 1995.
§ Hepatitis B vaccine was first licensed in June 1982.
¶ An anti-hepatitis C virus (HCV) antibody test first became available in May 1990.
Hepatitis A incidence continues to decline and in 2010 was the lowest ever recorded. The last peak in acute, symptomatic hepatitis A cases was observed around 1995, when hepatitis A vaccine became available. Since then, the decline in disease incidence has been constant. Acute hepatitis B incidence has declined since the mid-1980s, coinciding with the stepwise implementation of the national vaccination strategy to eliminate hepatitis B infection. Since 2007, hepatitis B incidence has remained stable. The incidence of acute hepatitis C has declined during 1992– 2005. The incidence of acute hepatitis C has remained stable from 2006 to 2010.
Alternate Text: HEPATITIS - This figure is a line graph that presents the incidence per 100,000 population of viral hepatitis, with separate lines for hepatitis A, B, and C, in the United States from 1980 to 2010.
Hepatitis A. Incidence,* by county — United States, 2010
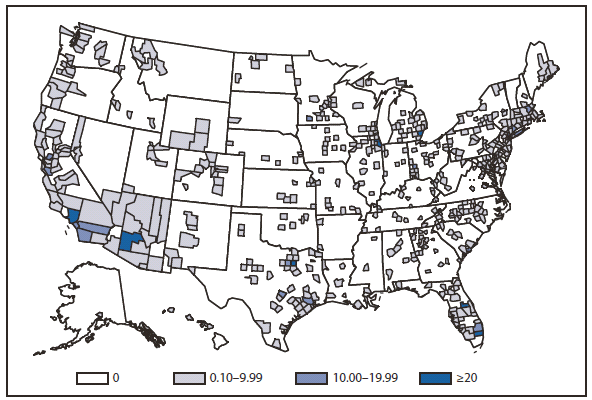
* Per 100,000 population.
In 1999, routine hepatitis A vaccination was recommended for children living in 11 states with consistently elevated rates of disease. Since then, rates of infection with hepatitis A virus (HAV) have declined in all regions, with the greatest decline occurring in western states. HAV infection rates are now the lowest ever reported and similar in all regions. Since 2006, hepatitis A vaccine has been recommended for children in all states.
Alternate Text: HEPATITIS A - This figure is a map of the United States that presents the incidence range per 100,000 population of hepatitis A by county in 2010.
HUMAN IMMUNODEFICIENCY VIRUS DIAGNOSES. Diagnoses rates* — United States and U.S. territories, 2010
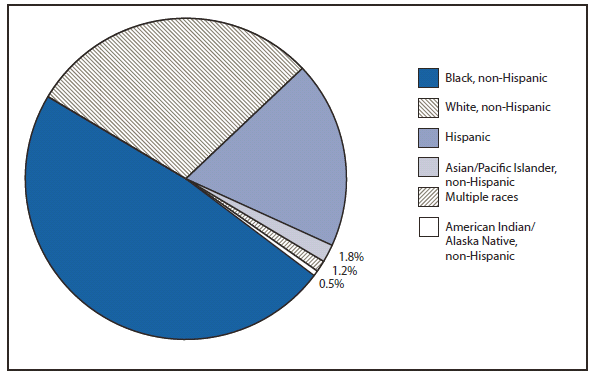
* Per 100,000 population.
The highest rates (i.e. ≥15 diagnoses per 100,000 population) of diagnoses of HIV infection were observed in certain states in the Southeast and Northeast. A rate ≥15 diagnoses per 100,000 population also was observed in the District of Columbia.
Alternate Text: HIV - This figure is a pie chart that presents the percentage of diagnosed cases of HIV by race ethnicity in the United States in 2010. The race/ethnicities included are black non-Hispanic, white, non-Hispanic, Asian/Pacific Islanders non-Hispanics, American Indian/Alaska Native non-Hispanic, and Hispanic.
HUMAN IMMUNODEFICIENCY VIRUS DIAGNOSES. Percentage of diagnosed cases, by race/ethnicity — United States, 2010
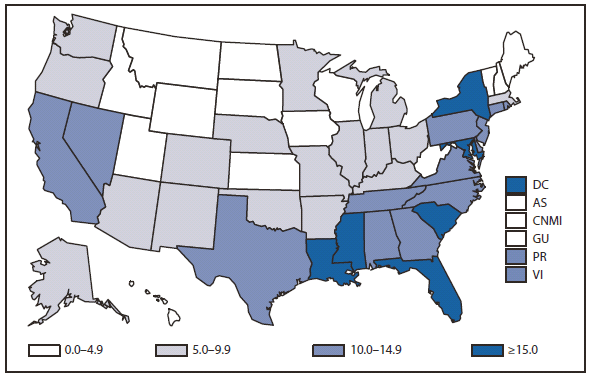
Of persons diagnosed with HIV infection in 2010, the greatest percentage was among non-Hispanic blacks, followed by non-Hispanic whites, Hispanics, Asians/Pacific Islanders, persons of multiple races, and American Indians/Alaska Natives.
Alternate Text: HIV - This figure is a map of the United States and U.S. territories that presents the rates per 100,000 population of diagnosed HIV cases in each state and territory in 2010.
INFLUENZA–ASSOCIATED PEDIATRIC MORTALITY. Incidence* — United States and U.S. territories, 2010
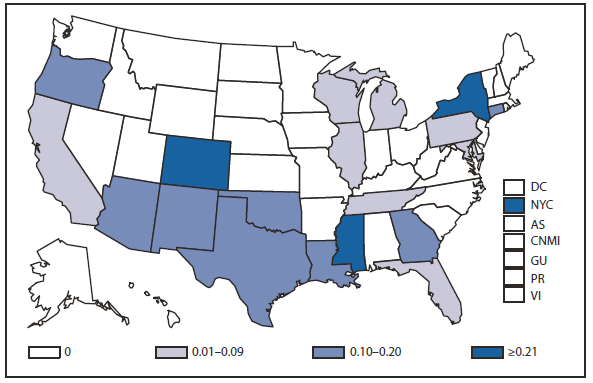
* Per 100,000 population.
During 2010, 19 states and New York City reported a total of 61 influenza-associated pediatric deaths to CDC for an overall incidence in the United States of 0.08 deaths per 100,000 children aged <18 years. This represents a substantial decrease in the rate compared with 2009 (0.48 deaths per 100,000 children aged <18 years) when three peaks in influenza-associated deaths were seen: one from seasonal influenza activity, a small peak during the summer months related to the initial pandemic 2009 A(H1N1) activity, followed by a much larger peak associated with pandemic activity in the fall of 2009. In contrast, neither the peak of the 2009–10 or 2010–11 seasons occurred during 2010. The state-to-state variation in rates were likely related to the small numbers of deaths in each state rather than true differences in disease burden.
Alternate Text: INFLUENZA - This figure is a map of the United States and U.S. territories that presents the incidence range per 100,000 population of influenza-associated pediatric deaths in each state and territory in 2010.
LEGIONELLOSIS. Incidence,* by year — United States, 1995–2010
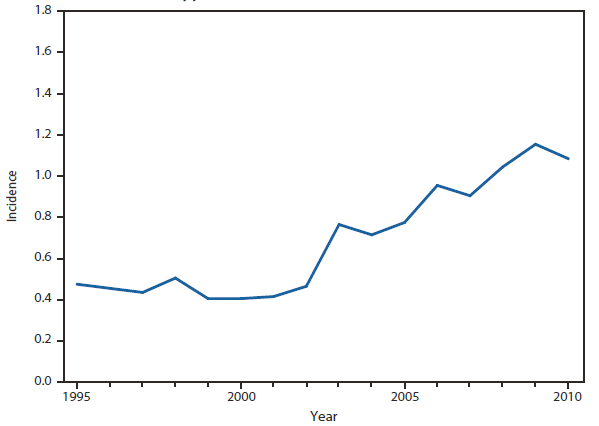
* Per 100,000 population.
The incidence of legionellosis stabilized in 2010, but reflects an increasing trend that began in 2003. Factors contributing to this increase might include a true increase in disease transmission, greater use of diagnostic testing, and increased reporting.
Alternate Text: LEGIONELLOSIS - This figure is a line graph that presents the incidence per 100,000 population of legionellosis cases in the United States from 1995 to 2010
LISTERIOSIS. Incidence* — United States and U.S. territories, 2010
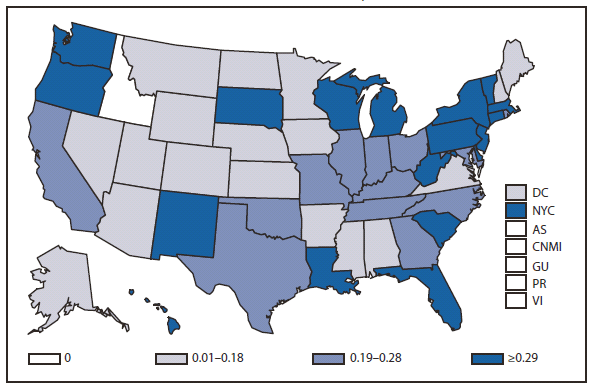
* Per 100,000 population.
Listeriosis is primarily foodborne and occurs most frequently among older adults or persons who are pregnant or immunocompromised. Although the infection is relatively uncommon, listeriosis is a leading cause of death attributable to foodborne illness in the United States. During 2010, outbreaks were linked to the consumption of pre-cut celery, hogs head cheese, and Mexican-style cheese made from pasteurized milk.
Alternate Text: 34. LISTERIOSIS - This figure is a map of the United States and U.S. territories that presents the incidence range per 100,000 population of listeriosis cases in each state and territory in 2010.
LYME DISEASE. Incidence* of reported confirmed cases, by county — United States, 2010
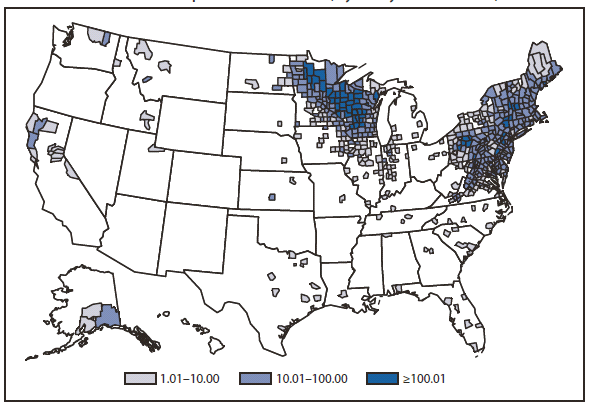
* Per 100,000 population.
Approximately 95% of confirmed Lyme disease cases are reported from states in the Northeast, mid-Atlantic and upper Midwest. A rash that can be confused with early Lyme disease sometimes occurs following bites of the lone star tick (Amblyomma americanum). These ticks, which do not transmit the Lyme disease bacterium, are common human-biting ticks in the southern and southeastern United States.
Alternate Text: LYME DISEASE - This figure is a map of the United States that presents the incidence per 100,000 population of lyme disease cases in each county in 2010.
MALARIA. Incidence,* by year — United States, 1996–2010
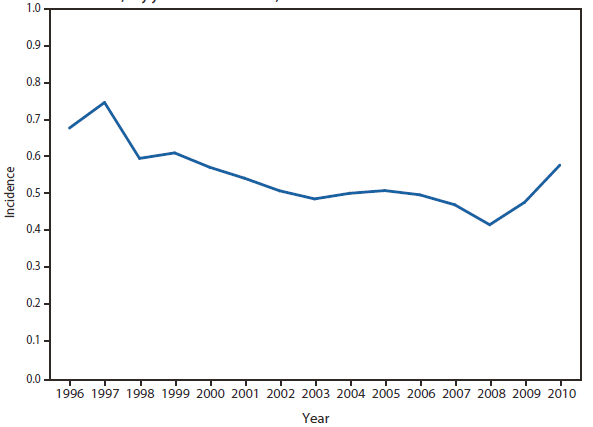
* Per 100,000 population.
Malaria in the United States is primarily a disease of travelers, for whom protective prophylaxis is recommended. Since 2008, the number of cases of malaria has steadily increased.
Alternate Text: MALARIA - This figure is a line graph that presents the incidence per 100,000 population of malaria cases in the United States from 1996 to 2010.
MEASLES. Incidence,* by year — United States, 1975–2010
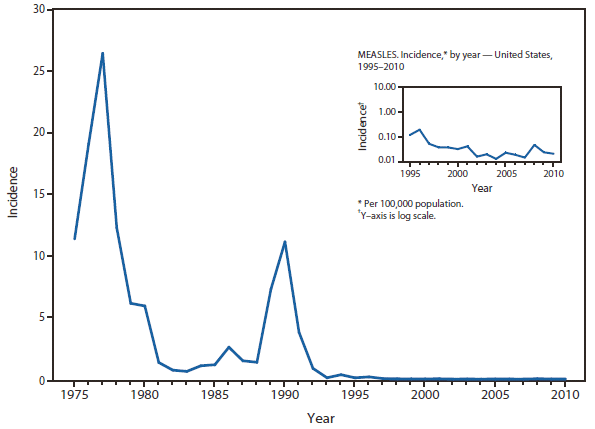
* Per 100,000 population.
Measles vaccine was licensed in 1963. Evidence suggests that measles is no longer endemic in the United States.
Alternate Text: MEASLES - This figure is a line graph that presents the incidence per 100,000 population of measles cases in the United States from 1976 to 2010.
MENINGOCOCCAL DISEASE. Incidence,* by year — United States, 1980–2010
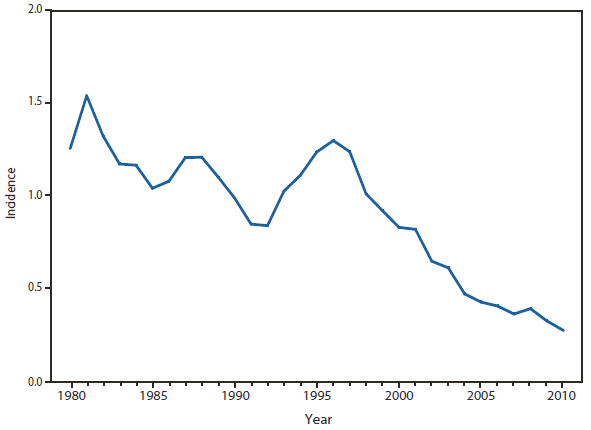
* Per 100,000 population.
Meningococcal disease incidence remained low in 2010, but it continues to cause substantial morbidity and mortality in the United States. The highest incidence of meningococcal disease occurs among infants, with a second peak occurring in late adolescence. In 2005, a quadrivalent (A, C, Y, W-135) meningococcal conjugate vaccine was licensed and recommended for adolescents and others at increased risk for disease. In October 2010, a booster dose was added to recommendations for adolescents at age 16 years. In 2010, coverage with one dose of meningococcal conjugate vaccine was 62.7% among adolescents aged 13–17 years in the United States
Alternate Text: MENINGOCOCCAL DISEASE - This figure is a line graph that presents the incidence per 100,000 population of meningococcal disease cases in the United States from 1980 to 2010.
MUMPS. Incidence,* by year — United States, 1985–2010
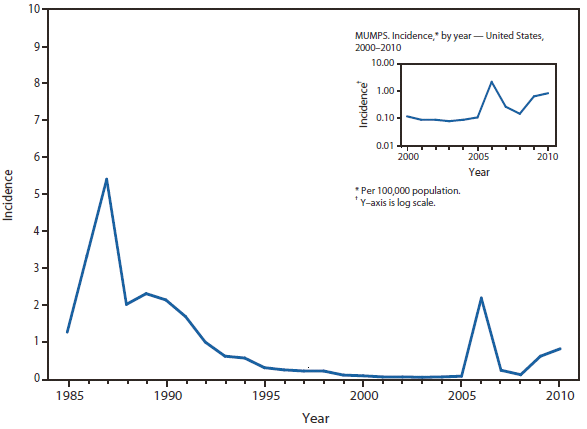
* Per 100,000 population.
The widespread use of a second dose of mumps vaccine, beginning in 1989, was followed by historically low morbidity until 2006, when the United States experienced the largest mumps outbreak in two decades. The 2006 outbreak of more than 6,000 cases primarily affected college students aged 18–24 years in the Midwest. A second large outbreak occurring during 2009–2010 affected Orthodox Jewish communities in the Northeast.
Alternate Text: MUMPS - This figure is a line graph that presents the incidence per 100,000 population of mumps cases in the United States from 1985 to 2010.
PERTUSSIS. Incidence,* by year — United States, 1980–2010
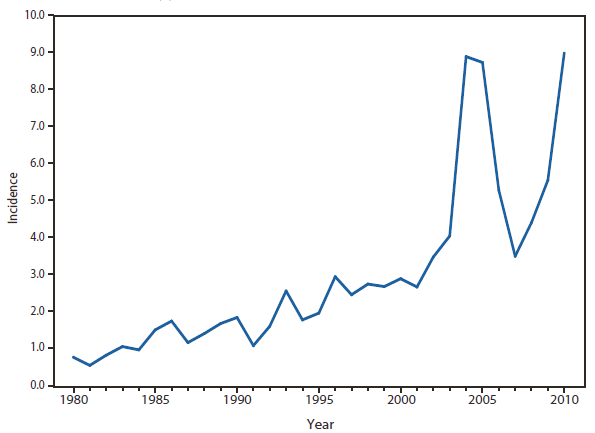
* Per 100,000 population.
Pertussis continues to have cyclic peaks every 3 to 5 years. Incidence in 2010 surpassed the previous peaks in 2004 and 2005.
Alternate Text: PERTUSSIS - This figure is a line graph that presents the incidence per 100,000 population of pertussis cases in the United States from 1980 to 2010.
PERTUSSIS. Number of reported cases,* by age group — United States, 2010
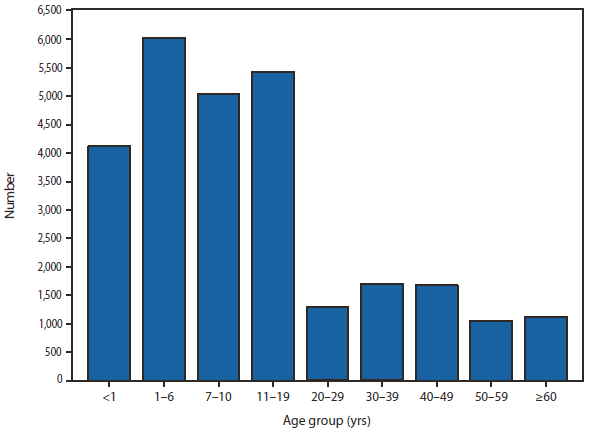
* Of 27,550 cases, age was reported unknown for 159 persons.
Infants, especially those who are too young to be fully vaccinated, are at greatest risk for severe disease and death from pertussis. Similar to recent years, a large proportion of reported cases continues to be observed among school-aged children and adolescents.
Alternate Text: PERTUSSIS - This figure is a bar chart that presents the number of pertussis cases, broken down by age group from <1 year to >60 years, in the United States in 2010.
Q FEVER, ACUTE AND CHRONIC. Number of reported cases* — United States and U.S. territories, 2010
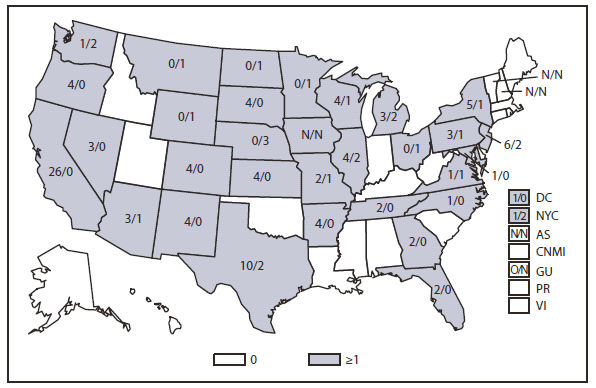
* Number of Q fever acute cases/number of Q fever chronic cases.
Q fever, caused by Coxiella burnetii, is reported throughout the United States. Human cases occur as a result of human interaction with livestock, especially sheep, goats, and cattle. Although relatively few human cases are reported annually, the disease is believed to be substantially underreported because of its nonspecific presentation and the subsequent failure to suspect infection and request appropriate diagnostic tests.
Alternate Text: Q FEVER - This figure is a map of the United States and U.S. territories that presents the number of acute and chronic Q fever cases in each state and territory in 2010.
RABIES, ANIMAL. Number of reported cases, by county — United States, 2010
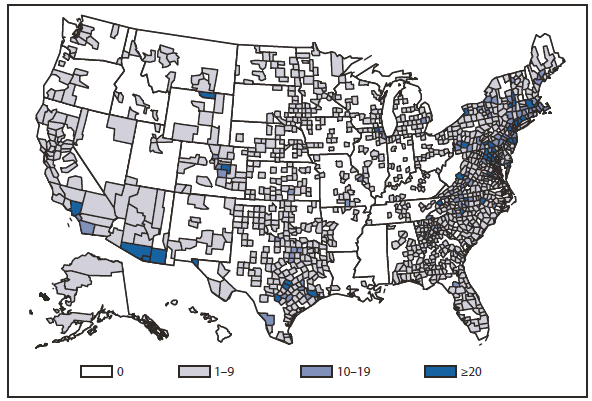
Data from the Division of Vector-Borne Diseases, National Center for Emerging and Zoonotic Infectious Diseases (ArboNET Surveillance).
The circulation of rabies virus variants associated with raccoons (eastern United States), skunks (central United States and California), and foxes (Texas, Arizona, and Alaska) occur over defined geographic areas. In addition, several distinct rabies virus variants associated with different bat species are broadly distributed across the contiguous United States. Hawaii is the only state that has reported to be rabies free.
Alternate Text: RABIES - This figure is a line graph that presents the number of rabies cases among wild and domestic animals in the United States and Puerto Rico from 1980 to 2010.
RUBELLA. Incidence,* by year — United States, 1980–2010
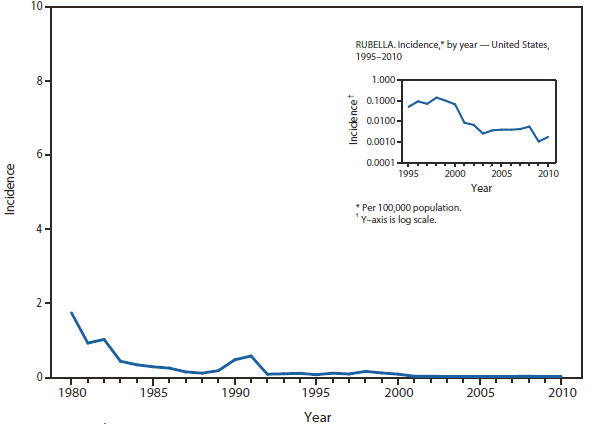
* Per 100,000 population.
Rubella vaccine was licensed in 1969. Evidence suggests that rubella is no longer endemic in the United States.
Alternate Text: RUBELLA - This figure is a line graph that presents the incidence per 100,000 population of rubella cases in the United States from 1980 to 2010.
SALMONELLOSIS AND SHIGELLOSIS. Incidence,* by year — United States, 1980–2010
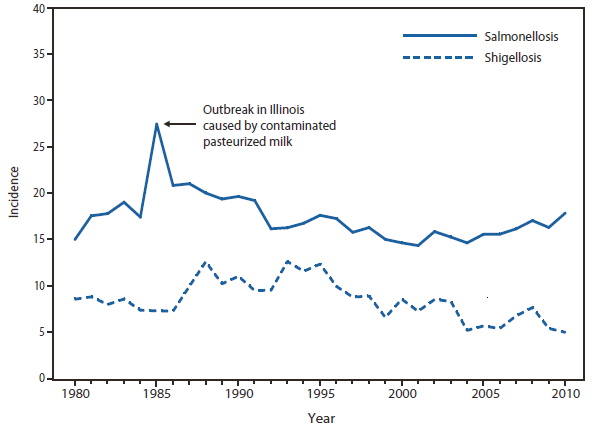
* Per 100,000 population.
The reported number of cases of salmonellosis and shigellosis has remained relatively stable during the past 2 decades. During 2010, multistate outbreaks of Salmonella were linked to frozen rodents used as reptile feed and the consumption of shell eggs, salami products made with contaminated imported black and red pepper, alfalfa sprouts, and a commercially distributed frozen chicken and rice entrée.
Alternate Text: SALMONELLOSIS AND SHIGELLOSIS. This figure is a line graph that presents the number of salmonellosis and shigellosis cases in the United States from 1980 to 2010.
SHIGA TOXIN-PRODUCING ESCHERICHIA COLI (STEC). Number of reported cases — United States and U.S. territories, 2010
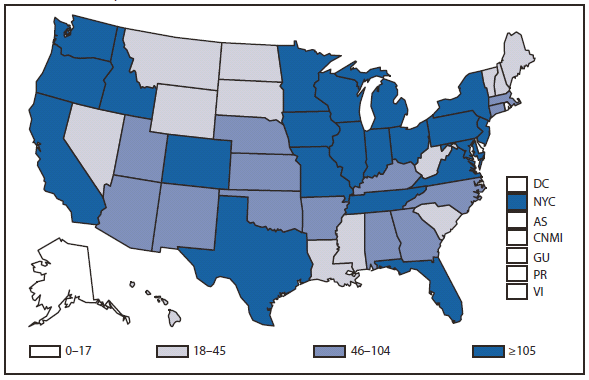
In 2010, the 2010 Healthy People national health objective goals of ≤1 case per 100,000 population for O157 STEC was met for U.S. states participating in the Foodborne Diseases Active Surveillance Network; STEC O157 is the type of STEC most associated with the hemolytic uremic syndrome. However, total counts of STEC might be increasing because of increasing use of Shiga toxin tests in clinical labs that help detect non-O157 STEC.
Alternate Text: E. coli - This figure is a map of the United States and U.S. territories that presents the number of Shiga-toxin producing Escherichia coli cases in each state and territory in 2010.
SPOTTED FEVER RICKETTSIOSIS. Number of reported cases, by county — United States, 2010
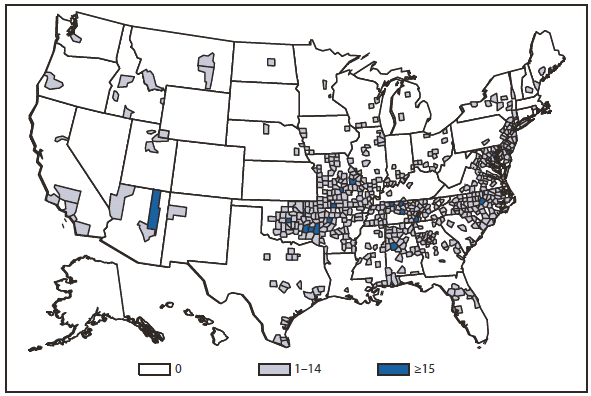
Cases of spotted fever rickettsiosis, the majority of which result from infection with Rickettsia rickettsii, the causative agent for Rocky Mountain spotted fever, are reported throughout much of the United States. This represents the widespread ranges of the primary tick vectors responsible for transmission, primarily Dermacentor variabilis in the East and Dermacentor andersonii in the West, but also Rhipicephalus sanguineus in some newly recognized focal areas. Studies of the role of tick vectors involved in the transmission of other spotted fever rickettsial species responsible for human disease are ongoing.
Alternate Text: SPOTTED FEVER RICKETTSIOSIS - The figure is a map that presents the number of spotted fever rickettsiosis cases by county in the United States in 2010.
SYPHILIS, CONGENITAL. Incidence* among infants, by year of birth — United States, 1980–2010
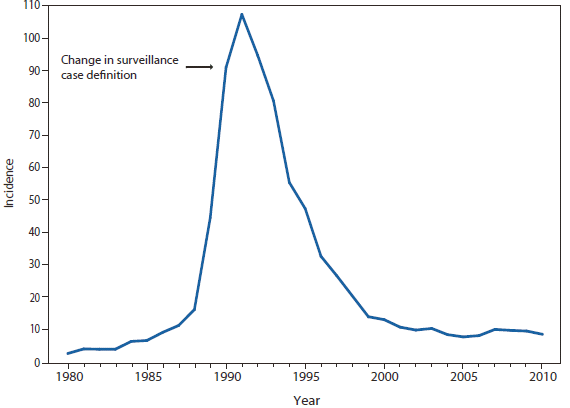
* Per 100,000 live births.
Following a decline in the incidence of congenital syphilis since 1991, overall congenital syphilis rates decreased from 2009 to 2010, from 9.9 to 8.7 cases per 100,000 live births.
Alternate Text: SYPHILIS - This figure is a line graph that presents the incidence per 100,000 population of congenital syphilis cases among infants aged <1 year in the United States in 2010.
SYPHILIS, PRIMARY AND SECONDARY. Incidence* — United States and U.S. Territories, 2010
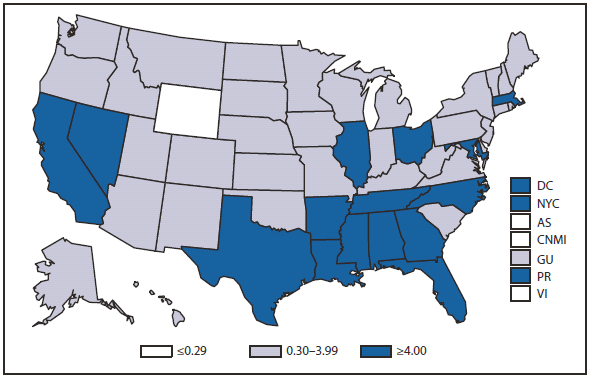
* Per 100,000 population.
In 2010, the primary and secondary syphilis rate in the United States and U. S. territories (Guam, Puerto Rico, and Virgin Islands) was 4.5 cases.
Alternate Text: SYPHILIS - This figure is a map of the United States and U.S. territories that presents the incidence per 100,000 population of primary and secondary syphilis cases in each state and territory in 2010.
SYPHILIS, PRIMARY AND SECONDARY. Incidence*, by sex — United States, 1995–2010
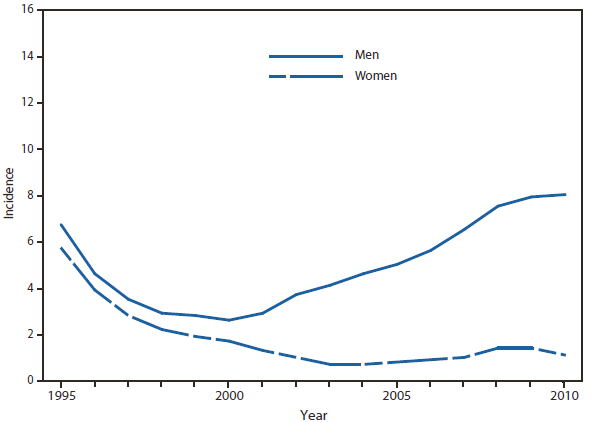
* Per 100,000 population.
During 2009–2010, the incidence of primary and secondary syphilis in the United States decreased from 4.6 to 4.5 cases (women: decreased from 1.4 to 1.1; men: increased from 7.8 to 7.9 per 100,000 population).
Alternate Text: SYPHILIS - This figure is a line graph that presents the incidence per 100,000 population of primary and secondary syphilis cases among men and women in the United States from 1995 to 2010.
Syphilis, Primary and Secondary. Incidence,* by race/ethnicity — United States, 1995–2010
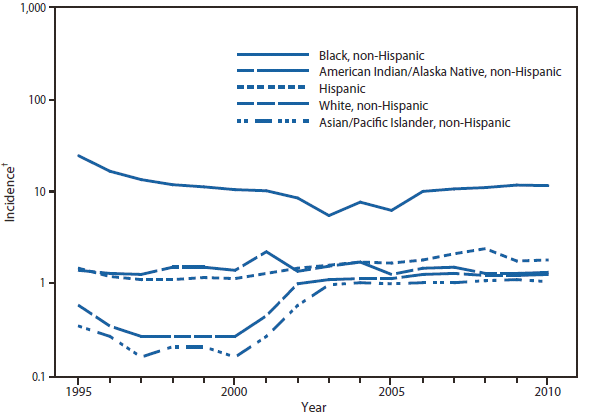
* Per 100,000 population.
† Y-axis is log scale.
During 2009–2010, incidence of primary and secondary syphilis increased among all races/ethnicities except non-Hispanic blacks and Asians/Pacific Islanders. Incidence per 100,000 population increased from 2.3 to 2.4 among non-Hispanic whites; from 5.4 to 5.9 among Hispanics; from 2.7 to 2.9 among American Indians/Alaska Natives; and decreased from 21.8 to 20.0 among non-Hispanic blacks and 1.7 to 1.6 among Asians/Pacific Islanders.
Alternate Text: SYPHILIS - This figure is a line graph that presents the incidence per 100,000 population of primary and secondary syphilis cases by race/ethnicity in the United States from 1995 to 2010. The race/ethnicities include black non-Hispanic, white non-Hispanic, American Indian/Alaska Native non-Hispanic, Asian/Pacific Islander non-Hispanic, and Hispanic.
Trichinellosis. Number of reported cases, by year — United States, 1980–2010
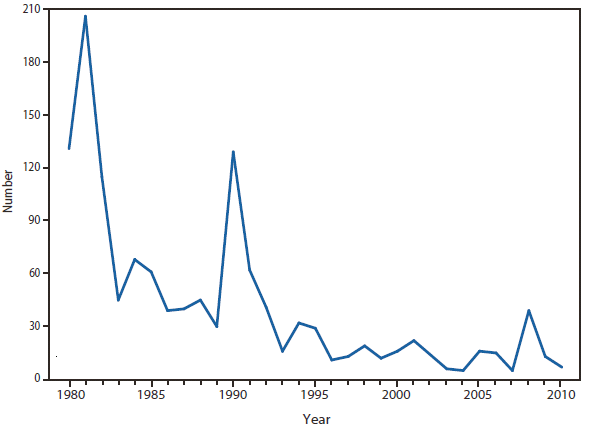
Seven isolated cases were reported from seven different states in 2010, which marks the first year since 2004 that no outbreaks were reported.
Alternate Text: TRICHINELLOSIS - This figure is a line graph that presents the number of trichinellosis cases in the United States from 1980 to 2010.
Tuberculosis. Incidence* — United States and U.S. territories, 2010
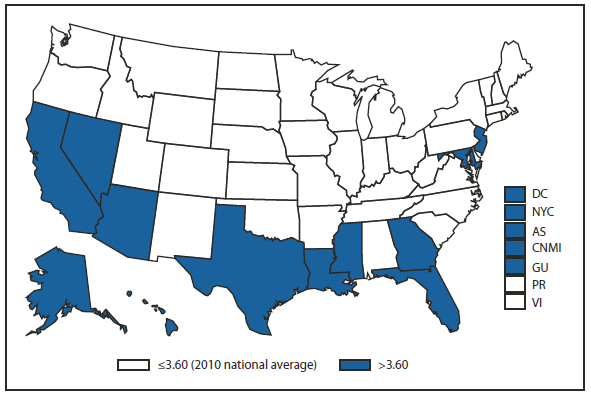
* Per 100,000 population. Data from the Division of Tuberculosis Elimination, National Center for HIV/AIDS, Viral Hepatitis, STD, and TB Prevention.
Thirteen states and the District of Columbia had an incidence rate above the national average at 3.6 cases.
Alternate Text: TUBERCULOSIS - This figure is a map of the United States and U.S. territories that presents the incidence range per 100,000 population of tuberculosis cases in each state and territory in 2010.
Tuberculosis. Number of reported cases among U.S.-born and foreign-born persons,* by year — United States, 2000–2010
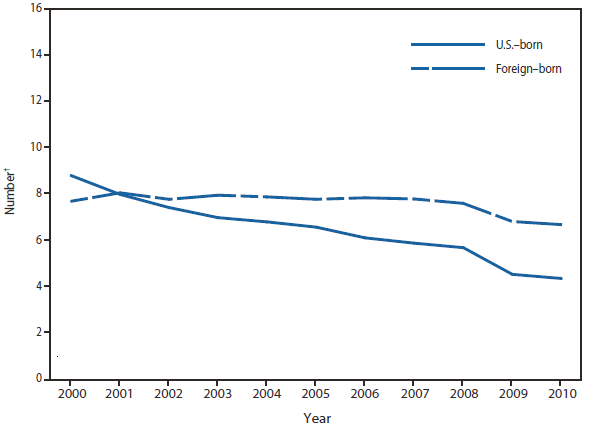
* For 69 cases, origin of patients was unknown.
† In thousands. Data from the Division of Tuberculosis Elimination, National Center for HIV/AIDS, Viral Hepatitis, STD, and TB Prevention.
The number of tuberculosis (TB) cases occurring in the foreign-born remained fairly constant from 2000 through 2008. In 2009 and 2010, the number of TB cases in the foreign-born has dropped substantially. The percentage of U.S. TB cases among the foreign-born has increased from 47% in 2000 to 60% in 2010.
Alternate Text: TUBERCULOSIS - This figure is a line graph that presents the number of cases of tuberculosis cases, separated by U.S.-born and foreign-born persons, in the United States from 2000 to 2010.
Tuberculosis. Incidence,* by race/ethnicity — United States, 2000–2010
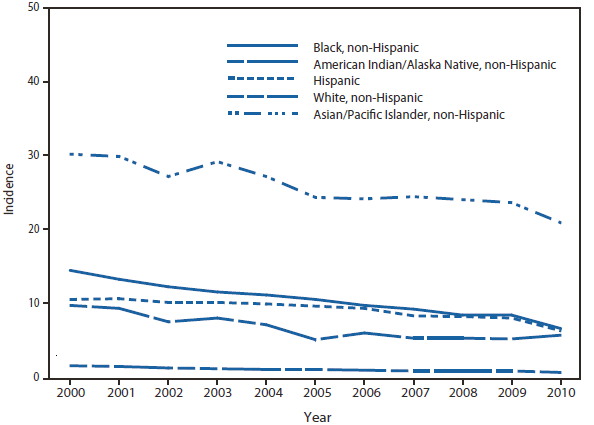
* Per 100,000 population. Data from the Division of Tuberculosis Elimination, National Center for HIV/AIDS, Viral Hepatitis, STD, and TB Prevention.
From 2000 to 2010, case rates in Asian / Pacific Islanders declined by 29%. All other racial and ethnic groups declined by at least 39% during this period. Since 2003, Asian only and Native Hawaiian and other Pacific Islanders have been reported separately but were merged for this graph for continuity in reporting trends.
Alternate Text: TUBERCULOSIS - This figure is a line graph that presents the incidence per 100,000 population of tuberculosis cases by race/ethnicity in the United States from 2000 to 2010. The race/ethnicities include black non-Hispanic, white non-Hispanic, American Indian/Alaska Natives non-Hispanic, Asian/Pacific Islanders non-Hispanic, and non-Hispanic.
Tularemia. Number of reported cases — United States and U.S. territories, 2010
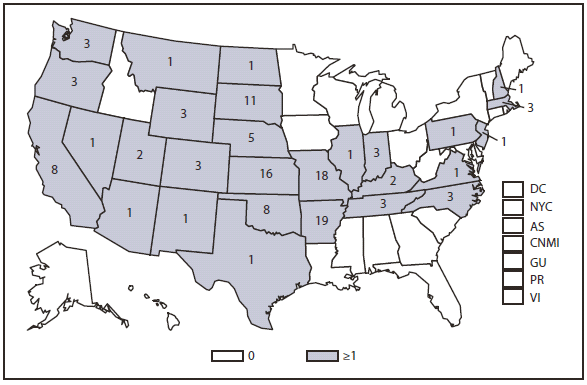
To better define the geographic distribution of Francisella tularensis subspecies, CDC requests that isolates be forwarded to the CDC laboratory in Fort Collins, Colorado.
Alternate Text: TULAREMIA - This figure is a map of the United States and U.S. territories that presents the number of tularemia cases in each state and territory in 2010.
Typhoid fever. Number of reported cases, by year — United States, 1980–2010
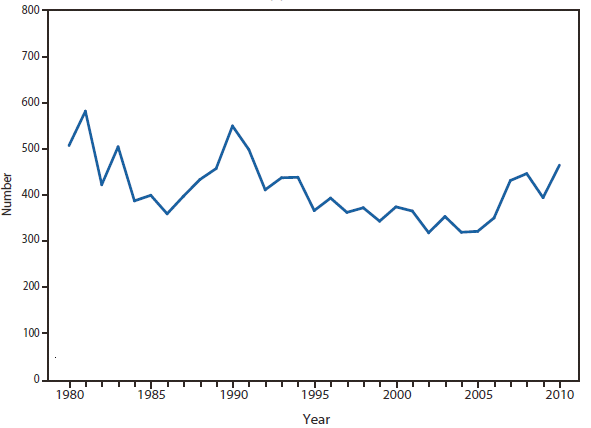
Typhoid fever in the United States remains primarily a disease of travelers, for whom vaccination against typhoid fever is recommended. However, the first domestically acquired outbreak of typhoid fever in a decade occurred in 2010. The outbreak was associated with consumption of imported frozen mamey fruit.
Alternate Text: TYPHOID FEVER - This figure is a line graph that presents the number of cases of typhoid fever in the United States from 1980 to 2010.
Varicella (ChickenPox). Number of reported cases — Illinois, Michigan, Texas, and West Virginia, 1994–2010
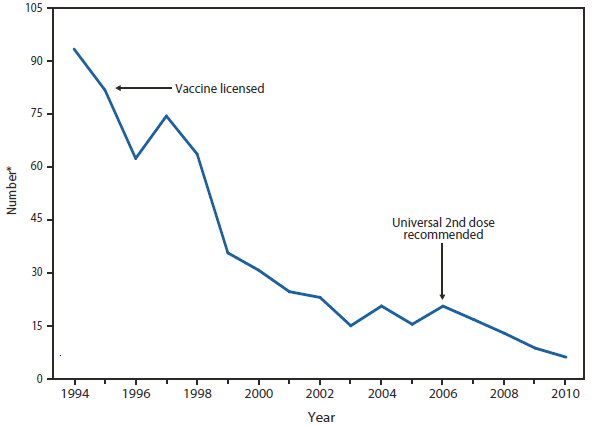
* In thousands.
In four states (Illinois, Michigan, Texas, and West Virginia), the number of cases reported in 2010 was 30% lower than 2009 and 93% less than the number reported during the prevaccine years 1993–1995.
Alternate Text: VARICELLA - This figure is a line graph that presents the number of cases of varicella, also know as chickenpox, in Illinois, Michigan, Texas, and West Virginia from 1994 to 2010.
Vibriosis. Number of reported cases — United States and U.S. territories, 2010
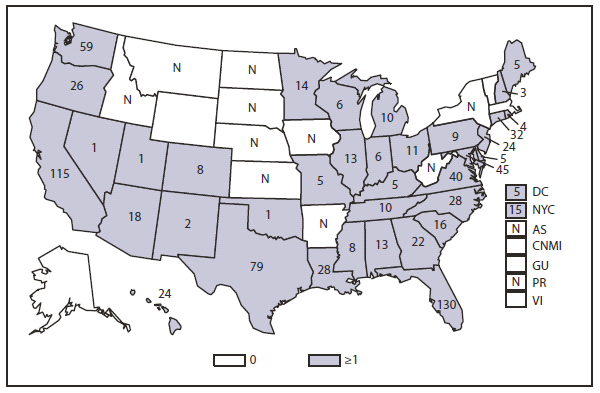
Consumption of raw or undercooked seafood is a risk factor for vibriosis. In 2010, a cluster of 4 cases of toxigenic (produces cholera toxin) Vibrio mimicus infection associated with consumption of cooked crayfish occurred in Spokane, Washington.
Alternate Text: VIBRIOSIS - This figure is a map of the United States and U.S. territories that presents the number of cases of virbriosis in each state and territory in 2010.
PART 3
Historical Summaries of Notifiable Diseases in the United States, 1979–2010
Abbreviations and Symbols Used in Tables
NA Data not available.
— No reported cases.
Notes: Rates <0.01 after rounding are listed as 0.
Data in the MMWR Summary of Notifiable Diseases — United States, 2010 might not match data in other CDC surveillance reports because of differences in the timing of reports, the source of the data, the use of different case definitions and print criteria.
|
TABLE 7. (Continued) Reported incidence* of notifiable diseases — United States, 2000–2010 |
|||||||||||
|---|---|---|---|---|---|---|---|---|---|---|---|
|
Disease |
2000 |
2001 |
2002 |
2003 |
2004 |
2005 |
2006 |
2007 |
2008 |
2009 |
2010 |
|
AIDS |
14.95 |
14.88 |
15.29 |
15.36 |
15.28 |
14.00 |
12.87 |
12.53 |
13.00 |
† |
† |
|
Anthrax |
0 |
0.01 |
0 |
— |
— |
— |
0 |
0 |
0 |
0 |
0 |
|
Arboviral diseases |
|||||||||||
|
California serogroup virus disease |
|||||||||||
|
neuroinvasive |
— |
— |
— |
— |
— |
0.02 |
0.02 |
0.02 |
0.02 |
0.02 |
0.02 |
|
nonneuroinvasive |
§ |
§ |
§ |
§ |
§ |
0 |
0 |
0 |
0 |
0 |
0 |
|
Eastern equine encephalitis virus disease |
|||||||||||
|
neuroinvasive |
— |
— |
— |
— |
— |
0 |
0 |
0 |
0 |
0 |
0 |
|
nonneuroinvasive |
§ |
§ |
§ |
§ |
§ |
0 |
0 |
0 |
0 |
0 |
— |
|
Powassan virus disease |
|||||||||||
|
neuroinvasive |
— |
— |
— |
— |
— |
0 |
0 |
0 |
0 |
0 |
0 |
|
nonneuroinvasive |
§ |
§ |
§ |
§ |
§ |
0 |
0 |
0 |
0 |
— |
— |
|
St. Louis encephalitis virus disease |
|||||||||||
|
neuroinvasive |
— |
— |
— |
— |
— |
0 |
0 |
0 |
0 |
0 |
0 |
|
nonneuroinvasive |
§ |
§ |
§ |
§ |
§ |
0 |
0 |
0 |
0 |
0 |
0 |
|
West Nile virus disease |
|||||||||||
|
neuroinvasive |
— |
— |
— |
— |
— |
0.45 |
0.50 |
0.41 |
0.23 |
0.13 |
0.20 |
|
nonneuroinvasive |
§ |
§ |
§ |
§ |
§ |
0.58 |
0.94 |
0.80 |
0.22 |
0.11 |
0.13 |
|
Western equine encephalitis virus disease |
|||||||||||
|
neuroinvasive |
— |
— |
— |
— |
— |
— |
— |
— |
— |
— |
— |
|
nonneuroinvasive |
§ |
§ |
§ |
§ |
§ |
— |
— |
— |
— |
— |
— |
|
Botulism, total (includes wound and unspecified) |
0.05 |
0.06 |
0.03 |
0.01 |
0.02 |
0.01 |
0.02 |
0.05 |
0.05 |
0.04 |
0.04 |
|
foodborne |
0.01 |
0.01 |
0 |
0.01 |
0.01 |
0.01 |
0.01 |
0.01 |
0.01 |
0 |
0 |
|
infant |
2.44 |
2.55 |
1.79 |
1.87 |
2.12 |
2.09 |
2.35 |
2.05 |
2.56 |
1.92 |
1.88 |
|
Brucellosis |
0.03 |
0.05 |
0.04 |
0.04 |
0.04 |
0.04 |
0.04 |
0.04 |
0.03 |
0.04 |
0.04 |
|
Chancroid |
0.03 |
0.01 |
0.02 |
0.02 |
0 |
0.01 |
0.01 |
0.01 |
0.01 |
0.01 |
0.01 |
|
Chlamydia trachomatis infections |
257.76 |
278.32 |
296.55 |
304.71 |
319.61 |
332.51 |
347.80 |
370.20 |
401.34 |
409.19 |
426.01 |
|
Cholera |
0 |
0 |
0 |
0 |
0 |
0 |
0 |
0 |
0 |
0 |
0 |
|
Coccidioidomycosis |
4.69 |
6.71 |
3.03 |
2.57 |
4.14 |
6.24 |
6.79 |
14.39 |
7.76 |
13.24 |
§ |
|
Cryptosporidiosis¶ |
1.17 |
1.34 |
1.07 |
1.22 |
1.23 |
1.93 |
2.05 |
3.73 |
3.02 |
2.52 |
2.91 |
|
confirmed |
§ |
§ |
§ |
§ |
§ |
§ |
§ |
§ |
§ |
2.43 |
2.73 |
|
probable |
§ |
§ |
§ |
§ |
§ |
§ |
§ |
§ |
§ |
0.09 |
0.19 |
|
Cyclosporiasis |
0.03 |
0.07 |
0.06 |
0.03 |
0.14 |
0.24 |
0.06 |
0.04 |
0.05 |
0.05 |
0.07 |
|
Denque virus infection |
|||||||||||
|
Denque fever |
§ |
§ |
§ |
§ |
§ |
§ |
§ |
§ |
§ |
§ |
0.22 |
|
Denque hemorrhagic fever |
§ |
§ |
§ |
§ |
§ |
§ |
§ |
§ |
§ |
§ |
0 |
|
Diphtheria |
0 |
0 |
0 |
0 |
— |
— |
— |
— |
— |
— |
— |
|
Ehrlichiosis |
|||||||||||
|
human granulocytic (HGE) |
0.15 |
0.10 |
0.18 |
0.13 |
0.20 |
0.28 |
0.23 |
0.31 |
** |
** |
** |
|
human monocytic (HME) |
0.09 |
0.05 |
0.08 |
0.11 |
0.12 |
0.18 |
0.20 |
0.30 |
** |
** |
** |
|
human (other and unspecified)†† |
— |
— |
— |
— |
— |
0.04 |
0.08 |
0.12 |
** |
** |
** |
|
Ehrlichiosis/Anaplasmosis |
|||||||||||
|
Ehrlichia chaffeensis |
§ |
§ |
§ |
§ |
§ |
§ |
§ |
§ |
0.35 |
0.34 |
0.26 |
|
Ehrlichia ewingii |
§ |
§ |
§ |
§ |
§ |
§ |
§ |
§ |
0 |
0 |
0 |
|
Anaplasma phagocytophilum |
§ |
§ |
§ |
§ |
§ |
§ |
§ |
§ |
0.43 |
0.42 |
0.61 |
|
Undetermined |
§ |
§ |
§ |
§ |
§ |
§ |
§ |
§ |
0.06 |
0.06 |
0.04 |
|
Encephalitis/meningitis, arboviral§§ |
|||||||||||
|
California serogroup virus |
0.04 |
0.05 |
0.06 |
0.06 |
0 |
§§ |
§§ |
§§ |
§§ |
§§ |
§§ |
|
Eastern equine virus |
0 |
0 |
0 |
0 |
0 |
§§ |
§§ |
§§ |
§§ |
§§ |
§§ |
|
Powassan virus |
§ |
§ |
0 |
0 |
0 |
§§ |
§§ |
§§ |
§§ |
§§ |
§§ |
|
St. Louis virus |
0 |
0.03 |
0.01 |
0.01 |
0 |
§§ |
§§ |
§§ |
§§ |
§§ |
§§ |
|
West Nile virus |
§ |
§ |
1.01 |
1.00 |
0.43 |
§§ |
§§ |
§§ |
§§ |
§§ |
§§ |
|
Western equine virus |
0 |
0 |
0 |
0 |
— |
§§ |
§§ |
§§ |
§§ |
§§ |
§§ |
|
Enterohemorrhagic Escherichia coli |
|||||||||||
|
O157:H7 |
1.74 |
1.22 |
1.36 |
0.93 |
0.87 |
0.89 |
§ |
§ |
§ |
§§ |
§§ |
|
non–O157 |
§ |
0.19 |
0.08 |
0.09 |
0.13 |
0.19 |
§ |
§ |
§ |
§§ |
§§ |
|
not serogrouped |
§ |
0.06 |
0.02 |
0.05 |
0.13 |
0.16 |
§ |
§ |
§ |
§§ |
§§ |
|
Giardiasis |
§ |
§ |
8.06 |
6.84 |
8.35 |
7.82 |
7.28 |
7.66 |
7.41 |
7.37 |
7.64 |
|
Gonorrhea |
131.65 |
128.53 |
125.03 |
116.37 |
113.52 |
115.64 |
120.90 |
118.90 |
111.64 |
99.05 |
100.76 |
|
TABLE 7. (Continued) Reported incidence* of notifiable diseases — United States, 2000–2010 |
|||||||||||
|---|---|---|---|---|---|---|---|---|---|---|---|
|
Disease |
2000 |
2001 |
2002 |
2003 |
2004 |
2005 |
2006 |
2007 |
2008 |
2009 |
2010 |
|
Haemophilus influenzae, invasive disease |
|||||||||||
|
all ages, serotypes |
0.51 |
0.57 |
0.62 |
0.70 |
0.72 |
0.78 |
0.82 |
0.85 |
0.96 |
0.99 |
1.03 |
|
age<5 yrs |
|||||||||||
|
serotype b |
§ |
§ |
0.18 |
0.16 |
0.03 |
0.04 |
0.14 |
0.11 |
0.14 |
0.18 |
0.11 |
|
nonserotype b |
§ |
§ |
0.75 |
0.59 |
0.04 |
0.67 |
0.86 |
0.97 |
1.18 |
1.17 |
0.94 |
|
unknown serotype |
§ |
§ |
0.80 |
1.15 |
0.97 |
1.08 |
0.88 |
0.88 |
0.79 |
0.79 |
1.05 |
|
Hansen disease (leprosy) |
0.04 |
0.03 |
0.04 |
0.03 |
0.04 |
0.03 |
0.03 |
0.04 |
0.03 |
0.04 |
0.04 |
|
Hantavirus pulmonary syndrome |
0.02 |
0 |
0.01 |
0.01 |
0.01 |
0.01 |
0.01 |
0.01 |
0.01 |
0.01 |
0.01 |
|
Hemolytic uremic syndrome, postdiarrheal |
0.10 |
0.08 |
0.08 |
0.06 |
0.07 |
0.08 |
0.11 |
0.10 |
0.12 |
0.09 |
0.09 |
|
Hepatitis, viral, acute |
|||||||||||
|
A |
4.91 |
3.77 |
3.13 |
2.66 |
1.95 |
1.53 |
1.21 |
1.00 |
0.86 |
0.65 |
0.54 |
|
B |
2.95 |
2.79 |
2.84 |
2.61 |
2.14 |
1.78 |
1.62 |
1.51 |
1.34 |
1.12 |
1.10 |
|
C |
1.17 |
1.41 |
0.65 |
0.38 |
0.31 |
0.23 |
0.26 |
0.28 |
0.29 |
0.27 |
0.29 |
|
HIV diagnoses† |
— |
— |
— |
— |
— |
— |
— |
— |
— |
12.13 |
11.64 |
|
Influenza–associated pediatric mortality |
§ |
§ |
§ |
§ |
§ |
0.02 |
0.07 |
0.10 |
0.12 |
0.48 |
0.08 |
|
Legionellosis |
0.42 |
0.42 |
0.47 |
0.78 |
0.71 |
0.78 |
0.96 |
0.91 |
1.05 |
1.16 |
1.09 |
|
Listeriosis |
0.29 |
0.22 |
0.24 |
0.24 |
0.32 |
0.31 |
0.30 |
0.27 |
0.25 |
0.28 |
0.27 |
|
Lyme disease, total¶¶ |
6.53 |
6.05 |
8.44 |
7.39 |
6.84 |
7.94 |
6.75 |
9.21 |
11.67 |
12.71 |
9.86 |
|
confirmed |
¶¶ |
¶¶ |
¶¶ |
¶¶ |
¶¶ |
¶¶ |
¶¶ |
¶¶ |
9.59 |
9.85 |
7.38 |
|
probable |
¶¶ |
¶¶ |
¶¶ |
¶¶ |
¶¶ |
¶¶ |
¶¶ |
¶¶ |
2.08 |
2.80 |
2.49 |
|
Malaria |
0.57 |
0.55 |
0.51 |
0.49 |
0.51 |
0.51 |
0.50 |
0.47 |
0.42 |
0.48 |
0.58 |
|
Measles |
0.03 |
0.04 |
0.02 |
0.02 |
0.01 |
0.02 |
0.02 |
0.01 |
0.05 |
0.02 |
0.02 |
|
Meningococcal disease, invasive |
|||||||||||
|
all serogroups |
0.83 |
0.83 |
0.64 |
0.61 |
0.47 |
0.42 |
0.40 |
0.36 |
0.39 |
0.32 |
0.27 |
|
serogroup A,C,Y, & W—135 |
*** |
*** |
*** |
*** |
*** |
0.10 |
0.11 |
0.11 |
0.11 |
0.10 |
0.09 |
|
serogroup B |
*** |
*** |
*** |
*** |
*** |
0.05 |
0.07 |
0.06 |
0.06 |
0.06 |
0.04 |
|
other serogroup |
*** |
*** |
*** |
*** |
*** |
0.01 |
0.01 |
0.01 |
0.01 |
0.01 |
0 |
|
serogroup unknown |
*** |
*** |
*** |
*** |
*** |
0.26 |
0.22 |
0.18 |
0.20 |
0.16 |
0.13 |
|
Mumps |
0.13 |
0.10 |
0.10 |
0.08 |
0.09 |
0.11 |
2.22 |
0.27 |
0.15 |
0.65 |
0.85 |
|
Novel influenza A virus infections |
§ |
§ |
§ |
§ |
§ |
§ |
§ |
0 |
0 |
14.37 |
0 |
|
Pertussis |
2.88 |
2.69 |
3.47 |
4.04 |
8.88 |
8.72 |
5.27 |
3.49 |
4.40 |
5.54 |
8.97 |
|
Plague |
0 |
0 |
0 |
0 |
0 |
0 |
0.01 |
0 |
0 |
0 |
0 |
|
Poliomyelitis, paralytic |
0 |
0 |
0 |
0 |
0 |
0 |
0 |
— |
— |
0 |
— |
|
Poliovirus infection, nonparalytic |
§ |
§ |
§ |
§ |
§ |
§ |
§ |
— |
— |
— |
— |
|
Psittacosis |
0.01 |
0.01 |
0.01 |
0 |
0 |
0.01 |
0.01 |
0 |
0 |
0 |
0 |
|
Q fever††† |
0.01 |
0.01 |
0.02 |
0.02 |
0.03 |
0.05 |
0.06 |
0.06 |
0.04 |
0.04 |
0.04 |
|
acute |
††† |
††† |
††† |
††† |
††† |
††† |
††† |
††† |
0.04 |
0.03 |
0.04 |
|
chronic |
††† |
††† |
††† |
††† |
††† |
††† |
††† |
††† |
0 |
0.01 |
0.01 |
|
Rabies, human |
0 |
0 |
0 |
0 |
0 |
0 |
0 |
0 |
0 |
0 |
0 |
|
Rubella |
0.06 |
0.01 |
0.01 |
0 |
0 |
0 |
0 |
0 |
0.01 |
0 |
0 |
|
Rubella, congenital syndrome |
0 |
0 |
0 |
0 |
0 |
0 |
0 |
— |
— |
0 |
— |
|
Salmonellosis |
14.51 |
14.39 |
15.73 |
15.16 |
14.47 |
15.43 |
15.45 |
16.03 |
16.92 |
16.18 |
17.73 |
|
SARS–CoV§§§ |
§ |
§ |
§ |
0 |
— |
— |
— |
— |
— |
— |
— |
|
Shiga toxin–producing Escherichia coli (STEC) |
§ |
§ |
§ |
§ |
§ |
§ |
1.71 |
1.62 |
1.76 |
1.53 |
1.78 |
|
Shigellosis |
8.41 |
7.19 |
8.37 |
8.19 |
4.99 |
5.51 |
5.23 |
6.60 |
7.50 |
5.24 |
4.82 |
|
Spotted fever rickettsiosis, total¶¶¶ |
0.18 |
0.25 |
0.39 |
0.38 |
0.60 |
0.66 |
0.80 |
0.77 |
0.85 |
0.60 |
0.65 |
|
confirmed |
¶¶¶ |
¶¶¶ |
¶¶¶ |
¶¶¶ |
¶¶¶ |
¶¶¶ |
¶¶¶ |
¶¶¶ |
0.06 |
0.05 |
0.05 |
|
probable |
¶¶¶ |
¶¶¶ |
¶¶¶ |
¶¶¶ |
¶¶¶ |
¶¶¶ |
¶¶¶ |
¶¶¶ |
0.78 |
0.55 |
0.60 |
|
Smallpox |
§ |
§ |
§ |
§ |
— |
— |
— |
— |
— |
— |
— |
|
Streptococcal disease, invasive, group A |
1.45 |
1.60 |
1.69 |
2.04 |
1.82 |
2.00 |
2.24 |
1.89 |
2.30 |
2.13 |
§ |
|
Streptococcal, toxic shock syndrome |
0.04 |
0.04 |
0.05 |
0.06 |
0.06 |
0.07 |
0.06 |
0.06 |
0.07 |
0.08 |
0.07 |
|
Streptococcus pneumoniae, invasive disease(IPD)**** |
|||||||||||
|
all ages |
**** |
**** |
**** |
**** |
**** |
**** |
**** |
**** |
**** |
**** |
8.83 |
|
age <5 yrs |
**** |
**** |
**** |
**** |
**** |
**** |
**** |
**** |
**** |
**** |
14.15 |
|
Streptococcus pneumoniae, invasive disease |
|||||||||||
|
drug resistant, all ages |
2.77 |
2.11 |
1.14 |
0.99 |
1.49 |
1.42 |
2.19 |
1.49 |
1.60 |
1.75 |
**** |
|
age <5 yrs |
— |
— |
— |
— |
— |
— |
— |
3.73 |
3.51 |
4.54 |
**** |
|
non–drug resistant, age <5 yrs |
§ |
1.03 |
3.62 |
8.86 |
8.22 |
8.21 |
11.93 |
13.59 |
13.36 |
12.93 |
**** |
|
Syphilis, congenital, age <1 yr |
14.29 |
12.52 |
11.44 |
10.56 |
9.12 |
8.24 |
9.07 |
10.46 |
10.12 |
9.90 |
8.85 |
|
TABLE 7. (Continued) Reported incidence* of notifiable diseases — United States, 2000–2010 |
|||||||||||
|---|---|---|---|---|---|---|---|---|---|---|---|
|
Disease |
2000 |
2001 |
2002 |
2003 |
2004 |
2005 |
2006 |
2007 |
2008 |
2009 |
2010 |
|
Syphilis, primary and secondary |
2.19 |
2.17 |
2.44 |
2.49 |
2.71 |
2.97 |
3.29 |
3.83 |
4.48 |
4.60 |
4.49 |
|
Syphilis, total, all stages |
11.58 |
11.45 |
11.68 |
11.90 |
11.94 |
11.33 |
12.46 |
13.67 |
15.34 |
14.74 |
14.93 |
|
Tetanus |
0.01 |
0.01 |
0.01 |
0.01 |
0.01 |
0.01 |
0.01 |
0.01 |
0.01 |
0.01 |
0.01 |
|
Toxic–shock syndrome |
0.06 |
0.05 |
0.05 |
0.05 |
0.04 |
0.04 |
0.05 |
0.04 |
0.03 |
0.03 |
0.04 |
|
Trichinellosis |
0.01 |
0.01 |
0.01 |
0 |
0 |
0.01 |
0.01 |
0 |
0.01 |
0 |
0 |
|
Tuberculosis |
6.01 |
5.68 |
5.36 |
5.17 |
5.09 |
4.80 |
4.65 |
4.44 |
4.28 |
3.80 |
3.64 |
|
Tularemia |
0.06 |
0.05 |
0.03 |
0.04 |
0.05 |
0.05 |
0.03 |
0.05 |
0.04 |
0.03 |
0.04 |
|
Tyhoid fever |
0.14 |
0.13 |
0.11 |
0.12 |
0.11 |
0.11 |
0.12 |
0.14 |
0.15 |
0.13 |
0.15 |
|
Vancomycin–intermediate Staphylococcus aureus |
§ |
§ |
§ |
§ |
— |
0 |
0 |
0.02 |
0.03 |
0.03 |
0.04 |
|
Vancomycin–resistant Staphylococcus aureus |
§ |
§ |
§ |
§ |
0 |
0 |
0 |
0 |
0 |
0 |
0 |
|
Varicella (chickenpox)†††† |
26.18 |
19.51 |
10.27 |
7.27 |
18.41 |
19.64 |
28.65 |
18.68 |
13.56 |
8.71 |
6.46 |
|
Vibriosis |
§ |
§ |
§ |
§ |
§ |
§ |
§ |
0.25 |
0.24 |
0.30 |
0.30 |
|
Viral hemorrhagic fevers |
§ |
§ |
§ |
§ |
§ |
§ |
§ |
§ |
§ |
§ |
0 |
|
Yellow fever |
— |
0 |
0 |
— |
— |
— |
— |
— |
— |
— |
— |
|
* Per 100,000 population. † In 2008 CDC published a revised HIV case definition. This combined separate surveillance case definitions for HIV infection and AIDS into a single case definition for HIV infection that includes AIDS (and incorporates the HIV infection classification system). The revised HIV case definition provides a more complete presentation of the HIV epidemic on a population level. See the CDC revised surveillance case definitions for HIV infection among adults, adolescents, and children aged <18 months and for HIV infection and AIDS among children aged 18 months to <13 years—United States, 2008. MMWR 2008;57(No.RR–10):1–12. These case counts can be found under HIV Diagnoses in this table. The total number of HIV Diagnoses includes all cases reported to the Division of HIV/AIDS Prevention, National Center for HIV/AIDS, Viral Hepatitis, STD, and TB Prevention (NCHHSTP), through December 31, 2010. AIDS: Acquired Immunodeficiency Syndrome. HIV: Human Immunodeficiency Virus. § Not nationally notifiable. ¶ Revision of National Surveillance Case Definition distinguishing between confirmed and probable cases. ** As of January 1, 2008, these categories were replaced with codes for Anaplasma phagocytophilum. Refer to Ehrlichiosis/Anaplasmosis. †† Data for ehrlichiosis attributable to other or unspecified agents were being withheld from publication pending the outcome of discussions concerning the reclassification of certain Ehrlichia species, which will probably affect how data in this category were reported. §§ See also Arboviral Diseases incidence rates. In 2005, the arboviral disease surveillance case definitions and categories were revised. The nationally notifiable arboviral encephalitis and meningitis conditions continued to be nationally notifiable in 2005 and 2006, but under the category of arboviral neuroinvasive disease. In addition, in 2005, nonneuroinvasive domestic arboviral disesases for the six domestic arboviruses listed above were added to the list of nationally notifiable diseases. ¶¶ National surveillance case definition revised in 2008; probable cases not previously reported. *** To help public health specialists monitor the effect of the new meningococcal conjugate vaccine (Menactra(r), licensed in the United States in January 2005), the data display for meningococcal disease was modified to differentiate the fraction of the disease that is vaccine preventable (serogroups A,C,Y, W-135) from the non-preventable fraction of disease (serogroup B and others). ††† In 2008, Q fever acute and chronic reporting categories were recognized as a result of revision to the Q fever case definition. Before that time, case counts were not differentiated relative to acute and chronic Q fever cases. ¶¶¶ Revision of national surveillance case definition distinguishing between confirmed and probable cases; total case count includes two case reports with unknown case status. §§§ Severe acute respiratory syndrome-associated coronavirus disease. **** The previous categories of invasive pneumococcal disease among children less than 5 years and invasive, drug-resistant Streptococcus pneumoniae were eliminated. All cases of invasive Streptococcus pneumoniae disease, regardless of age or drug resistance are reported under a single disease code. †††† Varicella became a nationally notifiable diseases in 2003. |
|||||||||||
|
TABLE 8. Reported cases of notifiable diseases — United States, 2003–2010 |
||||||||
|---|---|---|---|---|---|---|---|---|
|
Disease |
2003 |
2004 |
2005 |
2006 |
2007 |
2008 |
2009 |
2010 |
|
AIDS* |
44,232 |
44,108 |
41,120 |
38,423 |
37,503 |
39,202 |
† |
† |
|
Anthrax |
— |
— |
— |
1 |
1 |
— |
1 |
— |
|
Arboviral diseases§ |
||||||||
|
California serogroup virus disease |
||||||||
|
neuroinvasive |
— |
— |
73 |
64 |
50 |
55 |
46 |
68 |
|
nonneuroinvasive |
¶ |
¶ |
7 |
5 |
5 |
7 |
9 |
7 |
|
Eastern equine encephalitis virus disease |
||||||||
|
neuroinvasive |
— |
— |
21 |
8 |
3 |
4 |
3 |
10 |
|
nonneuroinvasive |
¶ |
¶ |
— |
— |
1 |
— |
1 |
— |
|
Powassan virus disease |
||||||||
|
neuroinvasive |
— |
— |
1 |
1 |
7 |
2 |
6 |
8 |
|
nonneuroinvasive |
¶ |
¶ |
— |
— |
— |
— |
— |
— |
|
St. Louis encephalitis virus disease |
||||||||
|
neuroinvasive |
— |
— |
7 |
7 |
8 |
8 |
11 |
8 |
|
nonneuroinvasive |
¶ |
¶ |
6 |
3 |
1 |
5 |
1 |
2 |
|
Western equine encephalitis virus disease |
||||||||
|
neuroinvasive |
— |
— |
— |
— |
— |
— |
— |
— |
|
nonneuroinvasive |
¶ |
¶ |
— |
— |
— |
— |
— |
— |
|
West Nile virus disease |
||||||||
|
neuroinvasive |
— |
— |
1,309 |
1,495 |
1,227 |
689 |
386 |
629 |
|
nonneuroinvasive |
¶ |
¶ |
1,691 |
2,744 |
2,403 |
667 |
334 |
392 |
|
Botulism, total (includes wound and unspecified) |
129 |
133 |
135 |
165 |
144 |
145 |
118 |
112 |
|
foodborne |
20 |
16 |
19 |
20 |
32 |
17 |
10 |
7 |
|
infant |
76 |
87 |
85 |
97 |
85 |
109 |
83 |
80 |
|
Brucellosis |
104 |
114 |
120 |
121 |
131 |
80 |
115 |
115 |
|
Chancroid** |
54 |
30 |
17 |
33 |
23 |
25 |
28 |
24 |
|
Chlamydia trachomatis infections** |
877,478 |
929,462 |
976,445 |
1,030,911 |
1,108,374 |
1,210,523 |
1,244,180 |
1,307,893 |
|
Cholera |
2 |
5 |
8 |
9 |
7 |
5 |
10 |
13 |
|
Coccidioidomycosis |
4,870 |
6,449 |
6,542 |
8,917 |
8,121 |
7,523 |
12,926 |
¶ |
|
Cryptosporidiosis, total†† |
3,506 |
3,577 |
5,659 |
6,071 |
11,170 |
9,113 |
7,654 |
8,944 |
|
confirmed |
†† |
†† |
†† |
†† |
†† |
†† |
7,393 |
8,375 |
|
probable |
†† |
†† |
†† |
†† |
†† |
†† |
261 |
569 |
|
Cyclosporiasis |
75 |
171 |
543 |
137 |
93 |
139 |
141 |
179 |
|
Denque virus infection |
||||||||
|
Denque fever |
¶ |
¶ |
¶ |
¶ |
¶ |
¶ |
¶ |
690 |
|
Denque hemorrhagic fever |
¶ |
¶ |
¶ |
¶ |
¶ |
¶ |
¶ |
10 |
|
Diphtheria |
1 |
— |
— |
— |
— |
— |
— |
— |
|
Ehrlichiosis |
||||||||
|
human granulocytic (HGE) |
362 |
537 |
786 |
646 |
834 |
§§ |
§§ |
§§ |
|
human monocytic (HME) |
321 |
338 |
506 |
578 |
828 |
§§ |
§§ |
§§ |
|
human (other and unspecified) |
¶¶ |
¶¶ |
112 |
231 |
337 |
§§ |
§§ |
§§ |
|
Ehrlichiosis/Anaplasmosis |
||||||||
|
Ehrlichia chaffeensis |
¶ |
¶ |
¶ |
¶ |
¶ |
957 |
944 |
740 |
|
Ehrlichia ewingii |
¶ |
¶ |
¶ |
¶ |
¶ |
9 |
7 |
10 |
|
Anaplasma phagocytophilum |
¶ |
¶ |
¶ |
¶ |
¶ |
1,009 |
1,161 |
1,761 |
|
Undetermined |
¶ |
¶ |
¶ |
¶ |
¶ |
132 |
155 |
104 |
|
Encephalitis/Meningitis, arboviral |
||||||||
|
California serogroup virus |
108 |
112 |
*** |
*** |
*** |
*** |
*** |
*** |
|
Eastern equine virus |
14 |
6 |
*** |
*** |
*** |
*** |
*** |
*** |
|
Powassan virus |
— |
1 |
*** |
*** |
*** |
*** |
*** |
*** |
|
St. Louis virus |
41 |
12 |
*** |
*** |
*** |
*** |
*** |
*** |
|
West Nile virus |
2,866 |
1,142 |
*** |
*** |
*** |
*** |
*** |
*** |
|
Western equine virus |
— |
— |
*** |
*** |
*** |
*** |
*** |
*** |
|
Enterohemorrhagic Escherichia coli infection |
||||||||
|
Shiga toxin-positive |
||||||||
|
O157:H7 |
2,671 |
2,544 |
2,621 |
¶ |
¶ |
¶ |
¶ |
¶ |
|
non-O157 |
252 |
316 |
501 |
¶ |
¶ |
¶ |
¶ |
¶ |
|
not serogrouped |
156 |
308 |
407 |
¶ |
¶ |
¶ |
¶ |
¶ |
|
Giardiasis |
19,709 |
20,636 |
19,733 |
18,953 |
19,417 |
18,908 |
19,399 |
19,811 |
|
Gonorrhea** |
335,104 |
330,132 |
339,593 |
358,366 |
355,991 |
336,742 |
301,174 |
309,341 |
|
TABLE 8. (Continued) Reported cases of notifiable diseases — United States, 2003–2010 |
||||||||
|---|---|---|---|---|---|---|---|---|
|
Disease |
2003 |
2004 |
2005 |
2006 |
2007 |
2008 |
2009 |
2010 |
|
Haemophilus influenzae, invasive disease |
||||||||
|
all ages, serotypes |
2,013 |
2,085 |
2,304 |
2,496 |
2,541 |
2,886 |
3,022 |
3,151 |
|
age <5 yrs |
||||||||
|
serotype b |
32 |
19 |
9 |
29 |
22 |
30 |
38 |
23 |
|
nonserotype b |
117 |
135 |
135 |
175 |
199 |
244 |
245 |
200 |
|
unknown serotype |
227 |
177 |
217 |
179 |
180 |
163 |
166 |
223 |
|
Hansen disease (leprosy) |
95 |
105 |
87 |
66 |
101 |
80 |
103 |
98 |
|
Hantavirus pulmonary syndrome |
26 |
24 |
26 |
40 |
32 |
18 |
20 |
20 |
|
Hemolytic uremic syndrome, postdiarrheal |
178 |
200 |
221 |
288 |
292 |
330 |
242 |
266 |
|
Hepatitis, viral, acute††† |
||||||||
|
A |
7,653 |
5,683 |
4,488 |
3,579 |
2,979 |
2,585 |
1,987 |
1,670 |
|
B |
7,526 |
6,212 |
5,119 |
4,713 |
4,519 |
4,033 |
3,405 |
3,374 |
|
C |
1,102 |
720 |
652 |
766 |
845 |
877 |
782 |
849 |
|
HIV diagnoses† |
— |
— |
— |
— |
— |
— |
36,870 |
35,741 |
|
Influenza-associated pediatric mortality§§§ |
¶ |
¶ |
45 |
43 |
77 |
90 |
358 |
61 |
|
Legionellosis |
2,232 |
2,093 |
2,301 |
2,834 |
2,716 |
3,181 |
3,522 |
3,346 |
|
Listeriosis |
696 |
753 |
896 |
884 |
808 |
759 |
851 |
821 |
|
Lyme disease, total¶¶¶ |
21,273 |
19,804 |
23,305 |
19,931 |
27,444 |
35,198 |
38,468 |
30,158 |
|
confirmed |
¶¶¶ |
¶¶¶ |
¶¶¶ |
¶¶¶ |
¶¶¶ |
28,921 |
29,959 |
22,561 |
|
probable |
¶¶¶ |
¶¶¶ |
¶¶¶ |
¶¶¶ |
¶¶¶ |
6,277 |
8,509 |
7,597 |
|
Malaria |
1,402 |
1,458 |
1,494 |
1,474 |
1,408 |
1,255 |
1,451 |
1,773 |
|
Measles |
56 |
37 |
66 |
55 |
43 |
140 |
71 |
63 |
|
Meningococcal disease, invasive**** |
||||||||
|
all serogroups |
1,756 |
1,361 |
1,245 |
1,194 |
1,077 |
1,172 |
980 |
833 |
|
serogroup A, C, Y, & W-135 |
— |
— |
297 |
318 |
325 |
330 |
301 |
280 |
|
serogroup B |
— |
— |
156 |
193 |
167 |
188 |
174 |
135 |
|
other serogroup |
— |
— |
27 |
32 |
35 |
38 |
23 |
12 |
|
serogroup unknown |
— |
— |
765 |
651 |
550 |
616 |
482 |
406 |
|
Mumps |
231 |
258 |
314 |
6,584 |
800 |
454 |
1,991 |
2,612 |
|
Novel influenza A virus infections |
¶ |
¶ |
¶ |
¶ |
4 |
2 |
43,696 |
4 |
|
Pertussis |
11,647 |
25,827 |
25,616 |
15,632 |
10,454 |
13,278 |
16,858 |
27,550 |
|
Plague |
1 |
3 |
8 |
17 |
7 |
3 |
8 |
2 |
|
Poliomyelitis, paralytic†††† |
— |
— |
1 |
— |
— |
— |
1 |
— |
|
Poliovirus infection, nonparalytic |
— |
— |
— |
— |
— |
— |
— |
— |
|
Psittacosis |
12 |
12 |
16 |
21 |
12 |
8 |
9 |
4 |
|
Q fever§§§§ |
71 |
70 |
136 |
169 |
171 |
120 |
113 |
131 |
|
acute |
§§§§ |
§§§§ |
§§§§ |
§§§§ |
§§§§ |
106 |
93 |
106 |
|
chronic |
§§§§ |
§§§§ |
§§§§ |
§§§§ |
§§§§ |
14 |
20 |
25 |
|
Rabies |
||||||||
|
animal |
6,846 |
6,345 |
5,915 |
5,534 |
5,862 |
4,196 |
5,343 |
4,331 |
|
human |
2 |
7 |
2 |
3 |
1 |
2 |
4 |
2 |
|
Rubella |
7 |
10 |
11 |
11 |
12 |
16 |
3 |
5 |
|
Rubella, congenital syndrome |
1 |
— |
1 |
1 |
— |
— |
2 |
— |
|
Salmonellosis |
43,657 |
42,197 |
45,322 |
45,808 |
47,995 |
51,040 |
49,192 |
54,424 |
|
SARS-CoV¶¶¶¶ |
8 |
— |
— |
— |
— |
— |
— |
— |
|
Shiga toxin–producing Escherichia coli (STEC) |
¶ |
¶ |
¶ |
4,432 |
4,847 |
5,309 |
4,643 |
5,476 |
|
Shigellosis |
23,581 |
14,627 |
16,168 |
15,503 |
19,758 |
22,625 |
15,931 |
14,786 |
|
Spotted fever rickettsiosis, total***** |
1,091 |
1,713 |
1,936 |
2,288 |
2,221 |
2,563 |
1,815 |
1,985 |
|
confirmed |
***** |
***** |
***** |
***** |
***** |
190 |
151 |
156 |
|
probable |
***** |
***** |
***** |
***** |
***** |
2,367 |
1,662 |
1,835 |
|
Streptococcal disease, invasive, group A |
5,872 |
4,395 |
4,715 |
5,407 |
5,294 |
5,674 |
5,279 |
¶ |
|
Streptococcal toxic-shock syndrome |
161 |
132 |
129 |
125 |
132 |
157 |
161 |
142 |
|
Streptococcus pneumoniae invasive disease (IPD) |
||||||||
|
all ages |
††††† |
††††† |
††††† |
††††† |
††††† |
††††† |
††††† |
16,569 |
|
age <5 yrs |
††††† |
††††† |
††††† |
††††† |
††††† |
††††† |
††††† |
2,186 |
|
Streptococcus pneumoniae invasive disease, drug resistant, all ages |
2,356 |
2,590 |
2,996 |
3,308 |
3,329 |
3,448 |
3,370 |
††††† |
|
age <5 yrs |
— |
— |
— |
— |
563 |
532 |
583 |
††††† |
|
non-drug resistant age <5 yrs |
845 |
1,162 |
1,495 |
1,861 |
2,032 |
1,998 |
1988 |
††††† |
|
Syphilis, all stages** |
34,270 |
33,401 |
33,278 |
36,935 |
40,920 |
46,277 |
44,828 |
45,834 |
|
congenital (age <1 yr) |
432 |
375 |
339 |
382 |
430 |
431 |
427 |
377 |
|
primary and secondary |
7,177 |
7,980 |
8,724 |
9,756 |
11,466 |
13,500 |
13,997 |
13,774 |
|
Tetanus |
20 |
34 |
27 |
41 |
28 |
19 |
18 |
26 |
|
TABLE 8. (Continued) Reported cases of notifiable diseases — United States, 2003–2010 |
||||||||
|---|---|---|---|---|---|---|---|---|
|
Disease |
2003 |
2004 |
2005 |
2006 |
2007 |
2008 |
2009 |
2010 |
|
Toxic-shock syndrome |
133 |
95 |
90 |
101 |
92 |
71 |
74 |
82 |
|
Trichinellosis |
6 |
5 |
16 |
15 |
5 |
39 |
13 |
7 |
|
Tuberculosis§§§§§ |
14,874 |
14,517 |
14,097 |
13,779 |
13,299 |
12,904 |
11,545 |
11,182 |
|
Tularemia |
129 |
134 |
154 |
95 |
137 |
123 |
93 |
124 |
|
Typhoid fever |
356 |
322 |
324 |
353 |
434 |
449 |
397 |
467 |
|
Vancomycin-intermediate Staphylococcus aureus |
¶ |
— |
3 |
6 |
37 |
63 |
78 |
91 |
|
Vancomycin-resistant Staphylococcus aureus |
¶ |
1 |
2 |
1 |
2 |
— |
1 |
2 |
|
Varicella (chickenpox)¶¶¶¶¶ |
20,948 |
32,931 |
32,242 |
48,445 |
40,146 |
30,386 |
20,480 |
15,427 |
|
Varicella (deaths)****** |
2 |
9 |
3 |
— |
6 |
2 |
2 |
4 |
|
Vibriosis (noncholera Vibrio species infections) |
¶ |
¶ |
¶ |
¶ |
549 |
588 |
789 |
846 |
|
Viral hemorrhagic fever |
¶ |
¶ |
¶ |
¶ |
¶ |
¶ |
¶ |
1 |
|
Yellow fever†††††† |
— |
— |
— |
— |
— |
— |
— |
— |
|
* Acquired Immunodeficiency syndrome (AIDS). The total number of AIDS cases includes all cases reported to the Division of HIV/AIDS Prevention, National Center for HIV/AIDS, Viral Hepatitis, STD, and TB Prevention (NCHHSTP). † In 2008, CDC published a revised HIV case definition. This combined separate surveillance case definitions for HIV infection and AIDS into a single case definition for HIV infection that includes AIDS (and incorporates the HIV infection classification system). The revised HIV case definition provides a more complete presentation of the HIV epidemic on a population level. See the CDC revised surveillance case definitions for HIV infection among adults, adolescents, and children aged <18 months and for HIV infection and AIDS among children aged 18 months to <13 years—United States, 2008. MMWR 2008;57(No.RR–10):1–12. These case counts can be found under HIV Diagnoses in this table. The total number of HIV Diagnoses includes all cases reported to the Division of HIV/AIDS Prevention, NCHHSTP, through December 31, 2010. AIDS: Acquired Immune Deficiency Syndrome. HIV: Human Immunodeficiency Virus. § Totals reported to the Division of Vector-Borne Infectious Diseases, National Center for Emerging and Zoonotic Infectious Diseases (NCZVED) (ArboNET Surveillance), as of May 9, 2011. ¶ Not nationally notifiable. ** Totals reported to the Division of STD Prevention, NCHHSTP, as of June 8, 2011. †† Revision of national nurveillance case definition distinguishing between confirmed and probable cases. §§ As of January 1, 2008, these categories were replaced with codes for Anaplasma phagocytophilum. Refer to Ehrlichiosis/Anaplasmosis. ¶¶ Data for ehrlichiosis attributable to other or unspecified agents were being withheld from publication pending the outcome of discussions concerning the reclassification of certain Ehrlichia species, which will probably affect how data in this category were reported. *** See also Arboviral Diseases incidence rates. In 2005, the arboviral disease surveillance case definitions and categories were revised. The nationally notifiable arboviral encephalitis and meningitis conditions continued to be nationally notifiable in 2005 and 2006, but under the category of arboviral neuroinvasive disease. In addition, in 2005, nonneuroinvasive domestic arboviral disesases for the six domestic arboviruses listed above were added to the list of nationally notifiable diseases. ††† The anti–hepatitis C virus antibody test became available May 1990. Data on hepatitis B, perinatal infection, chronic hepatitis B, and chronic hepatitis C virus infection are not included because they are undergoing data quality review. §§§ Totals reported to the Division of Influenza, National Center for Immunization and Respiratory Diseases (NCIRD), as of December 31, 2010. ¶¶¶ National surveillance case definition revised in 2008; probable cases not previously reported. **** To help public health specialists monitor the effect of the new meningococcal conjugate vaccine (Menactra(r), licensed in the United States in January 2005), the data display for meningococcal disease was modified to differentiate the fraction of the disease that is potentially vaccine preventable (serogroups A, C, Y, W-135) from the non-vaccine preventable fraction of disease (serogroup B and others). †††† Cases of vaccine-associated paralytic poliomyelitis caused by polio vaccine virus. Numbers might not reflect changes based on retrospective case evaluations or late reports (CDC. Poliomyelitis—United States, 1975–1984. MMWR 1986;35:180–2). §§§§ In 2008, Q fever acute and chronic reporting categories were recognized as a result of revision to the Q fever case definition. Before that time, case counts were not differentiated relative to acute and chronic Q fever cases. ¶¶¶¶ Severe acute respiratory syndrome (SARS)–associated coronavirus disease. The total number of SARS–CoV cases includes all cases reported to the Division of Viral Diseases, Coordinating Center for Infectious Diseases. ***** Revision of national surveillance case definition distinguishing between confirmed and probable cases; total case count includes two case reports with unknown case status. ††††† The previous categories of invasive pneumococcal disease among children less than 5 years and invasive, drug-resistant Streptococcus pneumoniae were eliminated. All cases of invasive Streptococcus pneumoniae disease, regardless of age or drug resistance are reported under a single disease code. §§§§§ Totals reported to the Division of Tuberculosis Elimination, NCHHSTP, as of July 1, 2011. ¶¶¶¶¶ Varicella was removed from the nationally notifiable disease list in 1981. Varicella became nationally notifiable again in 2003. ****** Totals reported to the Division of Viral Diseases, NCIRD, as of June 30, 2011. †††††† The last indigenous case of yellow fever was reported in 1911; all other cases reported since 1911 have been imported. |
||||||||
|
TABLE 9. Reported cases of notifiable diseases — United States, 1995–2002 |
||||||||
|---|---|---|---|---|---|---|---|---|
|
Disease |
1995 |
1996 |
1997 |
1998 |
1999 |
2000 |
2001 |
2002 |
|
AIDS* |
71,547 |
66,885 |
58,492 |
46,521 |
45,104 |
40,758 |
41,868 |
42,745 |
|
Anthrax |
— |
— |
— |
— |
— |
1 |
23 |
2 |
|
Botulism, total (including wound and unspecified) |
97 |
119 |
132 |
116 |
154 |
138 |
155 |
118 |
|
foodborne |
24 |
25 |
31 |
22 |
23 |
23 |
39 |
28 |
|
infant |
54 |
80 |
79 |
65 |
92 |
93 |
97 |
69 |
|
Brucellosis |
98 |
112 |
98 |
79 |
82 |
87 |
136 |
125 |
|
Chancroid† |
606 |
386 |
243 |
189 |
143 |
78 |
38 |
67 |
|
Chlamydia trachomatis infections† |
477,638 |
498,884 |
526,671 |
604,420 |
656,721 |
702,093 |
783,242 |
834,555 |
|
Cholera |
23 |
4 |
6 |
17 |
6 |
5 |
3 |
2 |
|
Coccidioidomycosis |
1,212 |
1,697 |
1,749 |
2,274 |
2,826 |
2,867 |
3,922 |
4,968 |
|
Cryptosporidiosis |
2,970 |
2,827 |
2,566 |
3,793 |
2,361 |
3,128 |
3,785 |
3,016 |
|
Cyclosporiasis |
§ |
§ |
§ |
§ |
56 |
60 |
147 |
156 |
|
Diphtheria |
— |
2 |
4 |
1 |
1 |
1 |
2 |
1 |
|
Ehrlichiosis |
||||||||
|
human granulocytic |
§ |
§ |
§ |
§ |
203 |
351 |
261 |
511 |
|
human monocytic |
§ |
§ |
§ |
§ |
99 |
200 |
142 |
216 |
|
human (other and unspecified) |
§ |
§ |
§ |
§ |
¶ |
¶ |
¶ |
¶ |
|
Encephalitis/Meningitis |
||||||||
|
California serogroup virus |
11 |
123 |
129 |
97 |
70 |
114 |
128 |
164 |
|
Eastern equine virus |
1 |
5 |
14 |
4 |
5 |
3 |
9 |
10 |
|
Powassan virus |
§ |
§ |
§ |
§ |
§ |
§ |
§ |
1 |
|
St. Louis virus |
§ |
2 |
13 |
24 |
4 |
2 |
79 |
28 |
|
West Nile virus |
§ |
§ |
§ |
§ |
§ |
§ |
§ |
2,840 |
|
Western equine virus |
— |
2 |
— |
— |
1 |
— |
— |
— |
|
Enterohemorrhagic Escherichia coli infection |
||||||||
|
Shiga toxin-positive |
||||||||
|
O157:H7 |
2,139 |
2,741 |
2,555 |
3,161 |
4,513 |
4,528 |
3,284 |
3,840 |
|
Non-O157 |
§ |
§ |
§ |
§ |
§ |
§ |
171 |
194 |
|
not serogrouped |
§ |
§ |
§ |
§ |
§ |
§ |
20 |
60 |
|
Giardiasis |
§ |
§ |
§ |
§ |
§ |
§ |
§ |
21,206 |
|
Gonorrhea§ |
392,848 |
325,883 |
324,907 |
355,642 |
360,076 |
358,995 |
361,705 |
351,852 |
|
Haemophilus influenzae, invasive disease |
||||||||
|
all ages, serotypes |
1,180 |
1,170 |
1,162 |
1,194 |
1,309 |
1,398 |
1,597 |
1,743 |
|
age <5 yrs |
||||||||
|
serotype b |
§ |
§ |
§ |
§ |
§ |
§ |
§ |
34 |
|
nonserotype b |
§ |
§ |
§ |
§ |
§ |
§ |
§ |
144 |
|
unknown serotype |
§ |
§ |
§ |
§ |
§ |
§ |
§ |
153 |
|
Hansen disease (leprosy) |
144 |
112 |
122 |
108 |
108 |
91 |
79 |
96 |
|
Hantavirus pulmonary syndrome |
— |
NA |
NA |
NA |
33 |
41 |
8 |
19 |
|
Hemolytic uremic syndrome, postdiarrheal |
72 |
97 |
91 |
119 |
181 |
249 |
202 |
216 |
|
Hepatitis, viral, acute |
||||||||
|
A |
31,582 |
31,032 |
30,021 |
23,229 |
17,047 |
13,397 |
10,609 |
8,795 |
|
B |
10,805 |
10,637 |
10,416 |
10,258 |
7,694 |
8,036 |
7,843 |
7,996 |
|
C/non-A, non-B** |
4,576 |
3,716 |
3,816 |
3,518 |
3,111 |
3,197 |
3,976 |
1,835 |
|
Legionellosis |
1,241 |
1,198 |
1,163 |
1,355 |
1,108 |
1,127 |
1,168 |
1,321 |
|
Listeriosis |
§ |
§ |
§ |
§ |
§ |
755 |
613 |
665 |
|
Lyme disease |
11,700 |
16,455 |
12,801 |
16,801 |
16,273 |
17,730 |
17,029 |
23,763 |
|
Malaria |
1,419 |
1,800 |
2,001 |
1,611 |
1,666 |
1,560 |
1,544 |
1,430 |
|
Measles |
309 |
508 |
138 |
100 |
100 |
86 |
116 |
44 |
|
Meningococcal disease, invasive |
3,243 |
3,437 |
3,308 |
2,725 |
2,501 |
2,256 |
2,333 |
1,814 |
|
Mumps |
906 |
751 |
683 |
666 |
387 |
338 |
266 |
270 |
|
Pertussis |
5,137 |
7,796 |
6,564 |
7,405 |
7,288 |
7,867 |
7,580 |
9,771 |
|
Plague |
9 |
5 |
4 |
9 |
9 |
6 |
2 |
2 |
|
Poliomyelitis, paralytic |
7 |
7 |
6 |
3 |
2 |
— |
— |
— |
|
Psittacosis |
64 |
42 |
33 |
47 |
16 |
17 |
25 |
18 |
|
Q fever |
§ |
§ |
§ |
§ |
§ |
21 |
26 |
61 |
|
Rabies |
||||||||
|
animal |
7,811 |
6,982 |
8,105 |
7,259 |
6,730 |
6,934 |
7,150 |
7,609 |
|
human |
5 |
3 |
2 |
1 |
— |
4 |
1 |
3 |
|
Rocky Mountain spotted fever |
590 |
831 |
409 |
365 |
579 |
495 |
695 |
1,104 |
|
Rubella |
128 |
238 |
181 |
364 |
267 |
176 |
23 |
18 |
|
Rubella, congenital syndrome |
6 |
4 |
5 |
7 |
9 |
9 |
3 |
1 |
|
Salmonellosis, excluding typhoid fever |
45,970 |
45,471 |
41,901 |
43,694 |
40,596 |
39,574 |
40,495 |
44,264 |
|
TABLE 9. (Continued) Reported cases of notifiable diseases — United States, 1995–2002 |
||||||||
|---|---|---|---|---|---|---|---|---|
|
Disease |
1995 |
1996 |
1997 |
1998 |
1999 |
2000 |
2001 |
2002 |
|
Shigellosis |
32,080 |
25,978 |
23,117 |
23,626 |
17,521 |
22,922 |
20,221 |
23,541 |
|
Streptococcal disease, invasive, Group A |
613 |
1,445 |
1,973 |
2,260 |
2,667 |
3,144 |
3,750 |
4,720 |
|
Streptococcal toxic-shock syndrome |
10 |
19 |
33 |
58 |
65 |
83 |
77 |
118 |
|
Streptococcus pneumoniae, invasive disease, |
||||||||
|
drug-resistant, all ages |
309 |
1,514 |
1,799 |
2,823 |
4,625 |
4,533 |
2,896 |
2,546 |
|
non-drug resistant, age <5 yrs |
§ |
§ |
§ |
§ |
§ |
§ |
498 |
513 |
|
Syphilis total, all stages§ |
68,953 |
52,976 |
46,540 |
37,977 |
35,628 |
31,575 |
32,221 |
32,871 |
|
congenital (age <1 yr) |
1,863 |
1,282 |
1,081 |
843 |
579 |
580 |
504 |
460 |
|
primary and secondary |
16,500 |
11,387 |
8,550 |
6,993 |
6,657 |
5,979 |
6,103 |
6,862 |
|
Tetanus |
41 |
36 |
50 |
41 |
40 |
35 |
37 |
25 |
|
Toxic-shock syndrome |
191 |
145 |
157 |
138 |
113 |
135 |
127 |
109 |
|
Trichinellosis |
29 |
11 |
13 |
19 |
12 |
16 |
22 |
14 |
|
Tuberculosis†† |
22,860 |
21,337 |
19,851 |
18,361 |
17,531 |
16,377 |
15,989 |
15,075 |
|
Tularemia |
§ |
§ |
§ |
§ |
§ |
142 |
129 |
90 |
|
Typhoid fever |
369 |
396 |
365 |
375 |
346 |
377 |
368 |
321 |
|
Varicella (chickenpox)§§ |
120,624 |
83,511 |
98,727 |
82,455 |
46,016 |
27,382 |
22,536 |
22,841 |
|
Varicella (deaths)¶¶ |
§ |
§ |
§ |
§ |
§ |
§ |
§ |
9 |
|
Yellow fever*** |
— |
1 |
— |
— |
— |
— |
— |
1 |
|
* Acquired immunodeficiency syndrome. † Cases were reported to the Division of STD Prevention, National Center for HIV/AIDS, Viral Hepatitis, STD, and TB Prevention (NCHHSTP). § Not nationally notifiable. ¶ Data for ehrlichiosis attributable to other or unspecified agents were being withheld from publication pending the outcome of discussions concerning the reclassification of certain Ehrlichia species, which will probably affect how data in this category were reported. ** The anti-hepatitis C virus antibody test became available in May 1990. †† Cases were updated through the Division of TB Elimination, NCHHSTP. §§ Varicella was removed from the nationally notifiable disease list in 1981. Certain states continued to report these cases to CDC. ¶¶ Totals reported to the Division of Viral Diseases, National Center for Immunization and Respiratory Diseases. *** The last indigenous case of yellow fever was reported in 1911; all other cases reported since 1911 have been imported. |
||||||||
|
TABLE 10. Reported cases of notifiable diseases* — United States, 1987–1994 |
||||||||
|---|---|---|---|---|---|---|---|---|
|
Disease |
1987 |
1988 |
1989 |
1990 |
1991 |
1992 |
1993 |
1994 |
|
AIDS† |
21,070 |
31,001 |
33,722 |
41,595 |
43,672 |
45,472 |
103,691 |
78,279 |
|
Amebiasis |
3,123 |
2,860 |
3,217 |
3,328 |
2,989 |
2,942 |
2,970 |
2,983 |
|
Anthrax |
1 |
2 |
— |
— |
— |
1 |
— |
— |
|
Aseptic meningitis |
11,487 |
7,234 |
10,274 |
11,852 |
14,526 |
12,223 |
12,848 |
8,932 |
|
Botulism, total (including wound and unspecified) |
82 |
84 |
89 |
92 |
114 |
91 |
97 |
143 |
|
foodborne |
17 |
28 |
23 |
23 |
27 |
21 |
27 |
50 |
|
infant |
59 |
50 |
60 |
65 |
81 |
66 |
65 |
85 |
|
Brucellosis |
129 |
96 |
95 |
82 |
104 |
105 |
120 |
119 |
|
Chancroid |
4,998 |
5,001 |
4,692 |
4,212 |
3,476 |
1,886 |
1,399 |
773 |
|
Cholera |
6 |
8 |
— |
6 |
26 |
103 |
18 |
39 |
|
Diphtheria§ |
3 |
2 |
3 |
4 |
5 |
4 |
— |
2 |
|
Encephalitis, primary |
1,418 |
882 |
981 |
1,341 |
1,021 |
774 |
919 |
717 |
|
Postinfectious¶ |
121 |
121 |
88 |
105 |
82 |
129 |
170 |
143 |
|
Enterohemorrhagic Escherichia coli infection Shiga toxin-positive |
||||||||
|
O157:H7 |
** |
** |
** |
** |
** |
** |
** |
1,420 |
|
Non-O157 |
** |
** |
** |
** |
** |
** |
** |
** |
|
not serogrouped |
** |
** |
** |
** |
** |
** |
** |
** |
|
Gonorrhea |
780,905 |
719,536 |
733,151 |
690,169 |
620,478 |
501,409 |
439,673 |
418,068 |
|
Granuloma inguinale |
22 |
11 |
7 |
97 |
29 |
6 |
19 |
3 |
|
Haemophilus influenzae, invasive disease all ages, serotypes |
** |
** |
** |
** |
** |
1,412 |
1,419 |
1,174 |
|
Hansen disease (leprosy) |
238 |
184 |
163 |
198 |
154 |
172 |
187 |
136 |
|
Hepatitis, viral, acute |
||||||||
|
A |
25,280 |
28,507 |
35,821 |
31,441 |
24,378 |
23,112 |
24,238 |
26,796 |
|
B |
25,916 |
23,177 |
23,419 |
21,102 |
18,003 |
16,126 |
13,361 |
12,517 |
|
C/ non-A, non-B†† |
2,999 |
2,619 |
2,529 |
2,553 |
3,582 |
6,010 |
4,786 |
4,470 |
|
unspecified |
3,102 |
2,470 |
2,306 |
1,671 |
1,260 |
884 |
627 |
444 |
|
Legionellosis |
1,038 |
1,085 |
1,190 |
1,370 |
1,317 |
1,339 |
1,280 |
1,615 |
|
Leptospirosis |
43 |
54 |
93 |
77 |
58 |
54 |
51 |
38 |
|
Lyme disease |
** |
** |
** |
** |
** |
9,895 |
8,257 |
13,043 |
|
Lymphogranuloma venereum |
303 |
185 |
189 |
277 |
471 |
302 |
285 |
235 |
|
Malaria |
944 |
1,099 |
1,277 |
1,292 |
1,278 |
1,087 |
1,411 |
1,229 |
|
Measles |
3,655 |
3,396 |
18,193 |
27,786 |
9,643 |
2,237 |
312 |
963 |
|
Meningococcal disease, invasive |
2,930 |
2,964 |
2,727 |
2,451 |
2,130 |
2,134 |
2,637 |
2,886 |
|
Mumps |
12,848 |
4,866 |
5,712 |
5,292 |
4,264 |
2,572 |
1,692 |
1,537 |
|
Murine typhus fever |
49 |
54 |
41 |
50 |
43 |
28 |
25 |
** |
|
Pertussis |
2,823 |
3,450 |
4,157 |
4,570 |
2,719 |
4,083 |
6,586 |
4,617 |
|
Plague |
12 |
15 |
4 |
2 |
11 |
13 |
10 |
17 |
|
Poliomyelitis, paralytic |
9 |
9 |
11 |
6 |
10 |
6 |
4 |
8 |
|
Psittacosis |
98 |
114 |
116 |
113 |
94 |
92 |
60 |
38 |
|
Rabies |
||||||||
|
animal |
4,658 |
4,651 |
4,724 |
4,826 |
6,910 |
8,589 |
9,337 |
8,147 |
|
human |
1 |
— |
1 |
1 |
3 |
1 |
3 |
6 |
|
Rheumatic fever, acute |
141 |
158 |
144 |
108 |
127 |
75 |
112 |
112 |
|
Rocky Mountain spotted fever |
604 |
609 |
623 |
651 |
628 |
502 |
456 |
465 |
|
Rubella |
306 |
225 |
396 |
1,125 |
1,401 |
160 |
192 |
227 |
|
Rubella, congenital syndrome |
5 |
6 |
3 |
11 |
47 |
11 |
5 |
7 |
|
Salmonellosis |
50,916 |
48,948 |
47,812 |
48,603 |
48,154 |
40,912 |
41,641 |
43,323 |
|
Shigellosis |
23,860 |
30,617 |
25,010 |
27,077 |
23,548 |
23,931 |
32,198 |
29,769 |
|
TABLE 10. (Continued) Reported cases of notifiable diseases* — United States, 1987–1994 |
||||||||
|---|---|---|---|---|---|---|---|---|
|
Disease |
1987 |
1988 |
1989 |
1990 |
1991 |
1992 |
1993 |
1994 |
|
Syphilis, |
||||||||
|
total, all stages |
86,545 |
103,437 |
110,797 |
134,255 |
128,569 |
112,581 |
101,259 |
81,696 |
|
congenital (age <1 yr) |
480 |
741 |
1,837 |
3,865 |
4,424 |
4,067 |
3,420 |
2,452 |
|
primary and secondary |
35,147 |
40,117 |
44,540 |
50,223 |
42,935 |
33,973 |
26,498 |
20,627 |
|
Tetanus |
48 |
53 |
53 |
64 |
57 |
45 |
48 |
51 |
|
Toxic-shock syndrome |
372 |
390 |
400 |
322 |
280 |
244 |
212 |
192 |
|
Trichinosis |
40 |
45 |
30 |
129 |
62 |
41 |
16 |
32 |
|
Tuberculosis |
22,517 |
22,436 |
23,495 |
25,701 |
26,283 |
26,673 |
25,313 |
24,361 |
|
Tularemia |
214 |
201 |
152 |
152 |
193 |
159 |
132 |
96 |
|
Typhoid fever |
400 |
436 |
460 |
552 |
501 |
414 |
440 |
441 |
|
Varicella |
213,196 |
192,857 |
185,441 |
173,099 |
147,076 |
158,364 |
134,722 |
151,219 |
|
* No cases of yellow fever were reported during 1987–1994. † Acquired immunodeficiency syndrome. § Cutaneous diphtheria ceased being notifiable nationally after 1979. ¶ Beginning in 1984, data were recorded by date of report to state health departments. Before 1984, data were recorded by onset date. ** Not nationally notifiable. †† The anti-hepatitis C virus antibody test became available in May 1990. |
||||||||
|
TABLE 11. Reported cases of notifiable diseases* — United States, 1979–1986 |
||||||||
|---|---|---|---|---|---|---|---|---|
|
Disease |
1979 |
1980 |
1981 |
1982 |
1983 |
1984 |
1985 |
1986 |
|
AIDS† |
§ |
§ |
§ |
§ |
4,445 |
8,249 |
12,932 |
|
|
Amebiasis |
4,107 |
5,271 |
6,632 |
7,304 |
6,658 |
5,252 |
4,433 |
3,532 |
|
Anthrax |
— |
1 |
— |
— |
— |
1 |
— |
— |
|
Aseptic meningitis |
8,754 |
8,028 |
9,547 |
9,680 |
12,696 |
8,326 |
10,619 |
11,374 |
|
Botulism, total (including wound and unspecified) |
45 |
89 |
103 |
97 |
133 |
123 |
122 |
109 |
|
foodborne |
§ |
§ |
§ |
§ |
§ |
§ |
49 |
23 |
|
infant |
§ |
§ |
§ |
§ |
§ |
§ |
70 |
79 |
|
Brucellosis |
215 |
183 |
185 |
173 |
200 |
131 |
153 |
106 |
|
Chancroid |
840 |
788 |
850 |
1,392 |
847 |
666 |
2,067 |
3,756 |
|
Cholera |
1 |
9 |
19 |
— |
1 |
1 |
4 |
23 |
|
Diphtheria |
59 |
3 |
5 |
2 |
5 |
1 |
3 |
— |
|
Encephalitis |
||||||||
|
primary |
1,504 |
1,362 |
1,492 |
1,464 |
1,761 |
1,257 |
1,376 |
1,302 |
|
postinfectious |
84 |
40 |
43 |
36 |
34 |
108 |
161 |
124 |
|
Gonorrhea |
1,004,058 |
1,004,029 |
990,864 |
960,633 |
900,435 |
878,556 |
911,419 |
900,868 |
|
Granuloma inguinale |
76 |
51 |
66 |
17 |
24 |
30 |
44 |
61 |
|
Hansen disease (leprosy) |
185 |
223 |
256 |
250 |
259 |
290 |
361 |
270 |
|
Hepatitis |
||||||||
|
A (infectious) |
30,407 |
29,087 |
25,802 |
23,403 |
21,532 |
22,040 |
23,210 |
23,430 |
|
B (serum) |
15,452 |
19,015 |
21,152 |
22,177 |
24,318 |
26,115 |
26,611 |
26,107 |
|
C/ non-A, non-B¶ |
§ |
§ |
§ |
§ |
§ |
3,871 |
4,184 |
3,634 |
|
unspecified |
10,534 |
11,894 |
10,975 |
8,564 |
7,149 |
5,531 |
5,517 |
3,940 |
|
Legionellosis |
593 |
475 |
408 |
654 |
852 |
750 |
830 |
980 |
|
Leptospirosis |
94 |
85 |
82 |
100 |
61 |
40 |
57 |
41 |
|
Lymphogranuloma venereum |
250 |
199 |
263 |
235 |
335 |
170 |
226 |
396 |
|
Malaria |
894 |
2,062 |
1,388 |
1,056 |
813 |
1,007 |
1,049 |
1,123 |
|
Measles |
13,597 |
13,506 |
3,124 |
1,714 |
1,497 |
2,587 |
2,822 |
6,282 |
|
Meningococcal disease, invasive |
2,724 |
2,840 |
3,525 |
3,056 |
2,736 |
2,746 |
2,479 |
2,594 |
|
Mumps |
14,225 |
8,576 |
4,941 |
5,270 |
3,355 |
3,021 |
2,982 |
7,790 |
|
Murine typhus fever |
69 |
81 |
61 |
58 |
62 |
53 |
37 |
67 |
|
Pertussis |
1,623 |
1,730 |
1,248 |
1,895 |
2,463 |
2,276 |
3,589 |
4,195 |
|
Plague |
13 |
18 |
13 |
19 |
40 |
31 |
17 |
10 |
|
Poliomyelitis, total |
22 |
9 |
10 |
12 |
13 |
9 |
8 |
10 |
|
paralytic |
22 |
9 |
10 |
12 |
13 |
9 |
8 |
10 |
|
Psittacosis |
137 |
124 |
136 |
152 |
142 |
172 |
119 |
224 |
|
Rabies |
||||||||
|
animal |
5,119 |
6,421 |
7,118 |
6,212 |
5,878 |
5,567 |
5,565 |
5,504 |
|
human |
4 |
— |
2 |
— |
2 |
3 |
1 |
— |
|
Rheumatic fever, acute |
629 |
432 |
264 |
137 |
88 |
117 |
90 |
147 |
|
Rocky Mountain spotted fever |
1,070 |
1,163 |
1,192 |
976 |
1,126 |
838 |
714 |
760 |
|
Rubella |
11,795 |
3,904 |
2,077 |
2,325 |
970 |
752 |
630 |
551 |
|
Rubella, congenital syndrome |
62 |
50 |
19 |
7 |
22 |
5 |
— |
14 |
|
Salmonellosis |
33,138 |
33,715 |
39,990 |
40,936 |
44,250 |
40,861 |
65,347 |
49,984 |
|
Shigellosis |
20,135 |
19,041 |
9,859 |
18,129 |
19,719 |
17,371 |
17,057 |
17,138 |
|
Syphilis |
||||||||
|
congenital (age <1 yr) |
332 |
277 |
287 |
259 |
239 |
305 |
329 |
410 |
|
primary and secondary |
24,874 |
27,204 |
31,266 |
33,613 |
32,698 |
28,607 |
27,131 |
27,883 |
|
total, all stages |
67,049 |
68,832 |
72,799 |
75,579 |
74,637 |
69,888 |
67,563 |
68,215 |
|
Tetanus |
81 |
95 |
72 |
88 |
91 |
74 |
83 |
64 |
|
Toxic-shock syndrome |
§ |
§ |
§ |
§ |
§ |
482 |
384 |
412 |
|
Trichinosis |
157 |
131 |
206 |
115 |
45 |
68 |
61 |
39 |
|
Tuberculosis |
27,669 |
27,749 |
27,373 |
25,520 |
23,846 |
22,255 |
22,201 |
22,768 |
|
Tularemia |
196 |
234 |
288 |
275 |
310 |
291 |
177 |
170 |
|
Typhoid fever |
528 |
510 |
584 |
425 |
507 |
390 |
402 |
362 |
|
Varicella |
199,081 |
190,894 |
200,766 |
167,423 |
177,462 |
221,983 |
178,162 |
183,243 |
|
* No cases of yellow fever were reported during 1979–1986. † Acquired immunodeficiency syndrome. § Not nationally notifiable. ¶ The anti-hepatitis C virus antibody test became available in May 1990. |
||||||||
|
TABLE 12. Number of deaths from selected nationally notifiable infectious diseases — United States, 2002–2008 |
||||||||
|---|---|---|---|---|---|---|---|---|
|
ICD-10* Cause of death code |
No. of deaths |
|||||||
|
2002 |
2003 |
2004 |
2005 |
2006 |
2007 |
2008 |
||
|
AIDS† |
B20-B24 |
14,095 |
13,658 |
13,063 |
12,543 |
12,133 |
11,295 |
10,285 |
|
Anthrax |
A22 |
0 |
0 |
0 |
0 |
0 |
0 |
0 |
|
Encephalitis, arboviral |
||||||||
|
California serogroup virus |
A83.5 |
0 |
0 |
0 |
1 |
1 |
1 |
0 |
|
Eastern equine encephalitis virus |
A83.2 |
1 |
1 |
2 |
2 |
2 |
0 |
0 |
|
Powassan virus |
A84.8 |
0 |
0 |
0 |
0 |
0 |
0 |
0 |
|
St. Louis encephalitis virus |
A83.3 |
3 |
2 |
2 |
1 |
2 |
1 |
2 |
|
Western equine encephalitis virus |
A83.1 |
0 |
0 |
0 |
0 |
0 |
0 |
0 |
|
Botulism, foodborne |
A05.1 |
2 |
6 |
0 |
5 |
3 |
6 |
4 |
|
Brucellosis |
A23 |
1 |
0 |
0 |
2 |
2 |
1 |
0 |
|
Chancroid |
A57 |
0 |
0 |
0 |
0 |
0 |
0 |
0 |
|
Chlamydia trachomatis infections |
A56 |
0 |
0 |
0 |
0 |
0 |
0 |
0 |
|
Cholera |
A00 |
0 |
0 |
0 |
0 |
0 |
1 |
0 |
|
Coccidioidomycosis |
B38 |
84 |
73 |
100 |
76 |
110 |
99 |
72 |
|
Cryptosporidiosis |
A07.2 |
1 |
0 |
1 |
2 |
2 |
2 |
3 |
|
Cyclosporiasis |
A07.8 |
0 |
0 |
0 |
0 |
0 |
0 |
0 |
|
Diphtheria |
A36 |
0 |
1 |
0 |
0 |
0 |
0 |
0 |
|
Ehrlichiosis |
A79.8 |
0 |
1 |
0 |
0 |
0 |
0 |
0 |
|
Giardiasis |
A07.1 |
1 |
0 |
1 |
0 |
1 |
0 |
1 |
|
Gonoccocal infections |
A54 |
7 |
6 |
2 |
3 |
3 |
6 |
2 |
|
Haemophilus influenzae |
A49.2 |
7 |
5 |
11 |
4 |
4 |
10 |
3 |
|
Hansen disease (leprosy) |
A30 |
2 |
2 |
5 |
1 |
1 |
2 |
2 |
|
Hantavirus pulmonary syndrome |
A98.5 |
0 |
0 |
0 |
0 |
8 |
6 |
2 |
|
Hemolytic uremic syndrome, postdiarrheal |
D59.3 |
35 |
29 |
27 |
30 |
29 |
20 |
32 |
|
Hepatitis A, viral, acute |
B15 |
76 |
54 |
58 |
43 |
34 |
34 |
37 |
|
Influenza-associated pediatric mortality |
J10, J11 |
25 |
146 |
51 |
61 |
62 |
71 |
78 |
|
Legionellosis |
A48.1 |
62 |
98 |
72 |
78 |
91 |
67 |
92 |
|
Listeriosis |
A32 |
32 |
33 |
37 |
31 |
30 |
34 |
28 |
|
Lyme disease |
A69.2, L90.4 |
6 |
4 |
6 |
7 |
5 |
8 |
10 |
|
Malaria |
B50-B54 |
12 |
4 |
8 |
6 |
9 |
5 |
5 |
|
Measles |
B05 |
0 |
1 |
0 |
1 |
0 |
0 |
0 |
|
Meningococcal disease |
A39 |
161 |
161 |
138 |
123 |
105 |
87 |
102 |
|
Mumps |
B26 |
1 |
0 |
0 |
0 |
1 |
0 |
2 |
|
Pertussis |
A37 |
18 |
11 |
16 |
31 |
9 |
9 |
20 |
|
Plague |
A20 |
0 |
0 |
1 |
1 |
3 |
2 |
0 |
|
Poliomyelitis |
A80 |
0 |
0 |
0 |
0 |
0 |
0 |
0 |
|
Psittacosis |
A70 |
0 |
0 |
0 |
0 |
0 |
0 |
0 |
|
Q fever |
A78 |
0 |
1 |
1 |
2 |
2 |
4 |
0 |
|
Rabies, human |
A82 |
3 |
2 |
3 |
1 |
2 |
1 |
2 |
|
Rocky Mountain spotted fever |
A77.0 |
8 |
9 |
5 |
6 |
4 |
4 |
4 |
|
Rubella |
B06 |
0 |
0 |
1 |
0 |
0 |
1 |
0 |
|
Rubella, congenital syndrome |
P35.0 |
6 |
4 |
5 |
8 |
2 |
4 |
5 |
|
Salmonellosis |
A02 |
21 |
43 |
30 |
30 |
34 |
30 |
42 |
|
Shiga toxin-producing Escherichia coli (STEC) |
A04.0-A04.4 |
4 |
2 |
4 |
5 |
3 |
3 |
1 |
|
Shigellosis |
A03 |
4 |
2 |
0 |
9 |
3 |
4 |
3 |
|
Smallpox |
B03 |
0 |
0 |
0 |
0 |
0 |
0 |
0 |
|
Streptococcal disease, invasive, group A |
A40.0, A49.1 |
109 |
115 |
121 |
118 |
117 |
144 |
143 |
|
Streptococcus pneumoniae, invasive disease (restricted to age <5 years) |
A40.3, B95.3, J13 |
13 |
15 |
13 |
12 |
22 |
12 |
20 |
|
Syphilis, total, all stages |
A50-A53 |
41 |
34 |
43 |
47 |
38 |
42 |
34 |
|
Tetanus |
A35 |
5 |
4 |
4 |
1 |
4 |
5 |
3 |
|
Toxic-shock syndrome (other than streptococcal) |
A48.3 |
78 |
71 |
71 |
55 |
57 |
18 |
20 |
|
Trichinellosis |
B75 |
0 |
0 |
0 |
0 |
1 |
0 |
1 |
|
Tuberculosis |
A16-A19 |
784 |
711 |
657 |
648 |
652 |
554 |
585 |
|
Tularemia |
A21 |
2 |
2 |
1 |
0 |
0 |
2 |
1 |
|
Typhoid fever |
A01.0 |
0 |
0 |
0 |
0 |
0 |
0 |
2 |
|
Varicella |
B01 |
32 |
16 |
19 |
13 |
18 |
14 |
18 |
|
Yellow fever§ |
A95 |
1 |
0 |
0 |
0 |
0 |
0 |
0 |
|
Source: CDC. National Center for Health Statistics. National Vital Statistics System, 1999–2007. Underlying causes of death are classified according to ICD 10. Data for 2009–2011 are not available. Data are limited by the accuracy of the information regarding the underlying cause of death indicated on death certificates and reported to the National Vital Statistics System. * World Health Organization. International Statistical Classification of Diseases and Related Health Problems. Tenth Revision, 1992. † Acquired immunodeficiency syndrome. § For one fatality, the cause of death was erroneously reported as yellow fever in the National Center for Health Statistics dataset for 2003. Subsequent investigation has determined that this death did not result from infection with wild-type yellow fever virus, and it is therefore not included in this table. |
||||||||
Selected Reading for 2010
General
CDC. Racial disparities in nationally notifiable diseases—United States, 2002. MMWR 2005;54:9–11.
CDC. Case definitions for infectious conditions under public health surveillance. MMWR 1997;46(No. RR-10). Additional information available at http://www.cdc.gov/epo/dphsi/casedef/index.htm.
CDC. Framework for program evaluation in public health. MMWR 1999;48(No. RR-11).
CDC. Manual of procedures for the reporting of nationally notifiable diseases to CDC. Atlanta, GA: US Department of Health and Human Services, Public Health Service, CDC; 1995.
CDC. Manual for the surveillance of vaccine-preventable diseases. 3rd ed. Atlanta, GA: US Department of Health and Human Services, Public Health Service, CDC; 2002. Available at http://www.cdc.gov/nip/ publications/surv-manual.
CDC. National Electronic Disease Surveillance System (NEDSS): a standards-based approach to connect public health and clinical medicine. J Public Health Manag Practice 2001;7:43–50.
CDC. Public Health Information Network (PHIN): overview. Atlanta, GA: US Department of Health and Human Services, CDC; 2006. Available at http://www.cdc.gov/phin/overview.html.
CDC. Sexually transmitted disease surveillance, 2010. Atlanta, GA: US Department of Health and Human Services, CDC; 2011. Available at http://www.cdc.gov/std/stats.
CDC. Sexually transmitted diseases treatment guidelines, 2010. MMWR 2010;59(No. RR-12).
CDC. Ten leading nationally notifiable infectious diseases—United States, 1995. MMWR 1996;45:883–4.
Adekoya N. Nationally notifable disease surveillance (NNDSS) and the Healthy People 2010 objectives. The eJournal of the South Carolina Medical Association 2005;101:e68–72. Available at http://www.scmanet.org/Downloads/e-Journal/SCMA_eJournal_March05.pdf.
Armstrong KE, McNabb S, Ferland LD, et al. Capacity of public health surveillance to comply with revised international health regulations, USA. Emerg Infect Dis 2010;5:804–8.
Baker MG, Fidler DP. Global public health surveillance under new international health regulations. Emerg Infect Dis 2006;12:1058–65.
Bayer R, Fairchild AL. Public health: surveillance and privacy. Science 2000;290:1898–9.
Chang M-H, Glynn MK, Groseclose SL. Endemic, notifiable bioterrorism-related diseases, United States, 1992–1999. Emerg Infect Dis 2003;9:556–64.
Chin JE, ed. Control of communicable diseases manual. 17th ed. Washington, DC: American Public Health Association; 2000.
Doyle TJ, Glynn MK, Groseclose SL. Completeness of notifiable infectious disease reporting in the United States: an analytical literature review. Am J Epidemiol 2002;155:866–74.
Effler P, Ching-Lee M, Bogard A, Ieong M-C, Nekomoto T, Jernigan D. Statewide system of electronic notifiable disease reporting from clinical laboratories: comparing automated reporting with conventional methods. JAMA 1999;282:1845–50.
Freimuth V, Linnan HW, Potter P. Communicating the threat of emerging infections to the public. Emerg Infect Dis 2000;6:337–47.
German R. Sensitivity and predictive value positive measurements for public health surveillance systems. Epidemiology 2000;11:720–7.
Government Accountability Office. Emerging infectious diseases: review of state and federal disease surveillance efforts. Washington, DC:
Government Accountability Office; 2004. GAO-04-877. Available at http://www.gao.gov/new.items/d04877.pdf.
Hopkins RS. Design and operation of state and local infectious disease surveillance systems. J Public Health Manag Practice 2005;11:184–90.
Jajosky RA, Groseclose SL. Evaluation of reporting timeliness of public health surveillance systems for infectious diseases. BMC Public Health 2004;4:29.
Jajosky R, Rey A, Park M, Aranas A, Macdonald S, Ferland L. Findings from the Council of State and Territorial Epidemiologists' 2008 assessment of state reportable and nationally notifiable conditions in the United States and considerations for the future. J Public Health Manag Practice, 2011;17:255–64.
Koo D, Caldwell B. The role of providers and health plans in infectious disease surveillance. Eff Clin Pract 1999;2:247–52. Available at http:// www.acponline.org/journals/ecp/sepoct99/koo.htm.
Koo D, Wetterhall S. History and current status of the National Notifiable Diseases Surveillance System. J Public Health Manag Pract 1996;2:4–10.
Krause G, Brodhun B, Altmann D, Claus H, Benzler J. Reliability of case definitions for public health surveillance assessed by round-robin test methodology. BMC Public Health 2006;6:129.
Lazarus R, Klompas M, Campion F, et al. Electronic support for public health: validated case finding and reporting for notifiable diseases using electronic medical data. J Am Med Inform Assoc 2009;16(1):18–24.
Lin SS, Kelsey JL. Use of race and ethnicity in epidemiologic research: concepts, methodological issues, and suggestions for research. Epidemiol Rev 2000;22:187–202.
Martin SM, Bean NH. Data management issues for emerging diseases and new tools for managing surveillance and laboratory data. Emerg Infect Dis 1995;1:124–8.
McNabb S, Chungong S, Ryan M, et al. Conceptual framework of public health surveillance and action and its application in health sector reform. BMC Public Health 2002;2:2.
McNabb S, Surdo A, Redmond A, et al. Applying a new conceptual framework to evaluate tuberculosis surveillance and action performance and measure the costs, Hillsborough County, Florida, 2002. Ann Epidemiol 2004;14:640–5.
Niskar AS, Koo D. Differences in notifiable infectious disease morbidity among adult women—United States, 1992–1994. J Womens Health 1998;7:451–8.
Overhage JM, Grannis S, McDonald CJ. A comparison of the completeness and timeliness of automated electronic laboratory reporting and spontaneous reporting of notifiable conditions. Am JPublic Health. 2008;98:344–50.
Panackal AA, M'ikanatha NM, Tsui FC, et al. Automatic electronic laboratory- based reporting of notifiable infectious diseases at a large health system. Emerg Infect Dis 2002;8:685–91.
Pinner RW, Koo D, Berkelman RL. Surveillance of infectious diseases. In: Lederberg J, Alexander M, Bloom RB, eds. Encyclopedia of microbiology. 2nd ed. San Diego, CA: Academic Press; 2000.
Pinner RW, Jernigan DB, Sutliff SM. Electronic laboratory-based reporting for public health. Mil Med 2000;165(Suppl 2):20–4.
Roush S, Birkhead G, Koo D, Cobb A, Fleming D. Mandatory reporting of diseases and conditions by health care professionals and laboratories. JAMA 1999;282:164–70.
Roush S, Murphy T. Historical comparisons of morbidity and mortality for vaccine-preventable diseases in the United States. JAMA 2007;298:2155–63.
Silk, BJ, Berkelman RL. A review of strategies for enhancing the completeness of notifiable disease reporting. J Public Health Manag Practice 2005;11:191–200.
Teutsch SM, Churchill RE, eds. Principles and practice of public health surveillance. 2nd ed. New York, NY: Oxford University Press; 2000.
Thacker SB, Choi K, Brachman PS. The surveillance of infectious diseases. JAMA 1983;249:1181–5.
Anthrax
Blackburn JK, McNyset KM, Curtis A, Hugh-Jones ME. Modeling the geographic distribution of Bacillus anthracis, the causative agent of anthrax disease, for the contiguous United States using predictive ecological niche modeling. Am J Trop Med Hyg 2007;77:1103–10.
Stern EJ, Uhde KB, Shadomy SV, Messonnier N. Conference report on public health and clinical guidelines for anthrax. Emerg Infect Dis 2008;14. Available at http://www.cdc.gov/eid/content/14/4/e1.htm.
Domestic Arboviral, Neuroinvasive and Nonneuroinvasive
CDC. West Nile virus and other arboviral disease—United States, 2010. MMWR 2011;60(30):1009–13.
CDC. Human Jamestown Canyon virus infection—Montana, 2009. MMWR 2011;60(20):652–5.
CDC. La Crosse virus neuroinvasive disease—Missouri, 2009. MMWR 2010;59(28):869–71.
Gibney KB, Robinson S, Mutebi JP, et al. Eastern equine encephalitis: an emerging arboviral disease threat—Maine, 2009. Vector Borne Zoonotic Dis 2011:11(6);637–9.
Hoang Johnson DK, Staples JE, Sotir MJ, Warshauer D, Davis J. Tickborne Powassan virus infections among Wisconsin residents. Wisc Med J 2010;109(2):91–7.
Janusz KB, Lehman JA, Panella AJ, Fischer M, Staples JE. Laboratory testing practices for West Nile virus in the United States. Vector Borne Zoonotic Dis 2011;11(5):597–9.
Lindsey NP, Hayes EB, Staples JE, Fischer M. West Nile virus in children. Pediatrics 2009;123:e1084-e1089.
Reimann CA, Hayes EB, DiGuiseppi C, et al.Epidemiology of neuroinvasive arboviral disease in the United States, 1999–2007. Am J Trop Med Hyg 2008;79(6):974–9.
Sejvar JJ, Lindsey NP, Campbell GL. Primary causes of death in reported cases of fatal West Nile fever, United States, 2002–2006. Vector Borne Zoonotic Dis 2011;11(2):161–4.
Botulism
Barzilay, EJ. Botulism and intestinal botulism. In: DL Heymann, ed. Control of communicable diseases manual, Washington, DC: American Public Health Association Press; 2008.
Arnon SS, Barzilay EJ.Clostridial infections: botulism and infant botulism. In: Pickering LK, Baker CJ, Kimberlin DW, Long SS, eds. The Red Book: 2009 report of the Committee on Infectious Diseases. Elk Grove Village: American Academy of Pediatrics; 2009:259–62.
CDC. Infant botulism—New York City, 2001–2002. MMWR 2003;52:21–4.
Sobel J. Botulism. Clin Infect Dis 2005;41:1167–73.
Sobel J, Tucker N, McLaughlin J, Maslanka, S.Foodborne botulism in the United States, 1990–2000. Emerg Infect Dis 2004;10:1606–12.
Shapiro RL, Hatheway C, Swerdlow DL. Botulism in the United States: a clinical and epidemiologic review. Ann Intern Med 1998;129:221–8.
Shapiro RL, Hatheway C, Becher J, Swerdlow DL.Botulism surveillance and emergency response: a public health strategy for a global challenge. JAMA 1997;278:433–5.
Brucellosis
Ashford DA, di Pietra J, Lingappa J, et al. Adverse events in humans associated with accidental exposure to the livestock brucellosis vaccine RB51. Vaccine 2004;22:3435–9.
CDC. Brucellosis (Brucella melitensis, abortus, suis, and canis). Atlanta, GA: US Department of Health and Human Services, CDC; 2010. Available at http://www.cdc.gov/nczved/divisions/dfbmd/diseases/brucellosis/.
CDC. Brucellosis case definition. Atlanta, GA: US Department of Health and Human Services, CDC; 2010. Available at http://www.cdc.gov/osels/ph_surveillance/nndss/casedef/brucellosis_current.htm.
CDC. Laboratory-acquired brucellosis—Indiana and Minnesota, 2006. MMWR 2008; 57:39–42.
Chomel BB, DeBess EE, Mangiamele DM, et al. Changing trends in the epidemiology of human brucellosis in California from 1973 to 1992: a shift toward foodborne transmission. J Infect Dis 1994;170:1216–23.
Glynn MK, Lynn TV. Brucellosis. J Am Vet Med Assoc 2008;233:900–08.
Yagupsky P, Baron EJ. Laboratory exposures to Brucellae and implications for bioterrorism. Emerg Infect Dis 2005;11:1180–5.
Chlamydia trachomatis
CDC. Sexually transmitted disease surveillance, 2010. Atlanta, GA: US Department of Health and Human Services; 2011.
Datta SD, Torrone E, Kruszon-Moran D, et al.Chlamydia trachomatis trends in the United States among persons 14 to 39 years of age, 1999–2008.Sex Transm Dis 2012;39:92–6.
Satterwhite CL, Grier L, Patzer R, Weinstock H, Howards P, Kleinbaum D. Chlamydia positivity trends among women attending family planning clinics: United States, 2004–2008. Sex Transm Dis 2011;38 (11): 989–94.
Satterwhite CL, Joesoef MR, Datta SD, Weinstock H. Estimates of Chlamydia trachomatis infections among men: United States. Sex Transm Dis 2007;35:S3–7.
Satterwhite CL, Tian LH, Braxton J, Weinstock H. Chlamydia prevalence among women and men entering the National Job Training Program: United States, 2003-2007. Sex Transm Dis 2010; 37(2): 63–7.
Cholera
World Health Organization. Cholera, 2010. Wkly Epidemiol Rec 2011;86:325–40.
Newton AE, Heiman KE, Schmitz A, et al. Cholera in United States associated with epidemic in Hispaniola. Emerg Infect Dis 2011;17:2166–8.
Tappero J, Tauxe RV. Lessons learned during public health response to cholera epidemic in Haiti and the Dominican Republic. Emerg Infect Dis 2011;17:2087–93.
Siddique AK, Nair GB, Alam M, et al. El Tor cholera with severe disease: a new threat to Asia and beyond. Epidemiol Infect 2010;138:347–52.
Steinberg EB, Greene KD, Bopp CA, Cameron DN. Wells JG, Mintz ED. Cholera in the United States, 1995–2000: trends at the end of the twentieth century. J Infect Dis 2001;184:799–802.
Besser RE, Feikin DR, Eberhart-Phillips JE, Mascola L, Griffin PM, Diagnosis and treatment of cholera in the United States. Are we prepared? JAMA. 1994 Oct 19;272):1203–5.
Cryptosporidiosis
Yoder JS, Beach MJ. Cryptosporidium surveillance and risk factors in the United States. Exp Parasitol 2010;124:31–9.
Roy SL, DeLong SM, Stenzel S, et al. Risk factors for sporadic cryptosporidiosis among immunocompetent persons in the United States from 1999 to 2001. J Clin Microbiol 2004;42:2944–51.
CDC. Diagnostic procedures for stool specimens. Atlanta, GA: US Department of Health and Human Services, CDC; 2009. Available at http://www.dpd.cdc.gov/dpdx/HTML/DiagnosticProcedures.htm.
Cyclosporiasis
Ortega YR, Sanchez R. Update on Cyclospora cayetanensis, a food-borne and waterborne parasite. Clin Microbiol Rev 2010;23:218–34.
Herwaldt BL. The ongoing saga of U.S. outbreaks of cyclosporiasis associated with imported fresh produce: what Cyclospora cayetanensis has taught us and what we have yet to learn. In: Institute of Medicine. Addressing foodborne threats to health: policies, practices, and global coordination. Washington, DC: The National Academies Press; 2006:85 – 115, 133 – 40.
Herwaldt BL. Cyclospora cayetanensis: a review, focusing on the outbreaks of cyclosporiasis in the 1990s. Clin Infect Dis 2000;31:1040 – 57.
Ehrlichiosis and Anaplasmosis
Dahlgren F. Scott, Mandel EJ, Krebs JW, et al..Increasing incidence of Ehrlichia chaffeensis and Anaplasma phagocytophilum in the United States, 2000—2007. Am J Trop Med Hyg 2011;85:124–31.
CDC. Anaplasmosis and Ehrlichiosis—Maine, 2008. MMWR 2009: 58:1033–6..
Walker D. Rickettsiae and rickettsial infections: the current state of knowledge. Clin Infect Dis 2007:45 (Suppl 1):539–44.
Dumler JS, Madigan JE, Pusterla N, Bakken JS. Ehrlichioses in humans: epidemiology, clinical presentation, diagnosis, and treatment. Clin Infect Dis 2007:45 (Suppl 1) 545–1.
Demma LJ, Holman RC, McQuiston JH, Krebs JW, Swerdlow DL. Epidemiology of human ehrlichiosis and anaplasmosis in the United States, 2001—2002. Am J Trop Med Hyg 2005;73:400–9.
Giardiasis
Cantey PT, Roy S, Lee B, et al. Study of nonoutbreak giardiasis: novel findings and implications for research. Am J Med. 2011(epub ahead of print)
Clinical and Laboratory Standards Institute. Procedures for the recovery and identification of parasites from the intestinal tract; approved guideline. CLSI document M28-A2 Second Edition ed. Wayne, PA: Clinical and Laboratory Standards Institute; 2005.
Gonorrhea
CDC. Sexually transmitted disease surveillance, 2010. Atlanta, GA: US Department of Health and Human Services; 2011.
CDC. Sexually transmitted disease treatment guidelines, 2010. MMWR 2010; 59 (No. RR-12).
Datta SD, Sternberg M, Johnson RE, et al. Gonorrhea and chlamydia in the United States among persons 14 to 39 years of age, 1999 to 2002. Ann Int Med 2007;147:89–96.
Kirkcaldy RD, Ballard RC, Dowell D. Gonococcal resistance: are cephalosporins next? Curr Infect Dis Rep. 2011;13:196–204.
Hansen Disease
Britton WJ, Lockwood NJ. Leprosy. Lancet 2004;363:1209–19.
Bruce S, Schroeder TL, Ellner K, Rubin H, Williams T, Wolf JE Jr. Armadillo exposure and Hansen's disease: an epidemiologic survey in southern Texas. J Am Acad Dermatol 2000;43(2 Pt1):223–8.
Hartzell JD, Zapor M, Peng S, Straight T. Leprosy: a case series and review. South Med J 2004;97:1252–6.
Hastings R, ed. Leprosy. 2nd ed. New York, NY: Churchill Livingstone; 1994.
Joyce MP, Scollard DM. Leprosy (Hansen's disease). In: Rakel RE, Bope ET, eds. Conn's current therapy 2004: latest approved methods of treatment for the practicing physician. 56th ed. Philadelphia, PA: Saunders; 2004:100–5.
Ooi WW, Moschella SL. Update on leprosy in immigrants in the United States: status in the year 2000. Clin Infect Dis 2001;32:930–7.
Scollard DM, Adams LB, Gillis TP, Krahenbuhl JL, Truman RW, Williams DL. The continuing challenges of leprosy. Clinical Microbiology Reviews, 2006;19(2):338–81.
Hantavirus Pulmonary Syndrome
Khan AS, Khabbaz RF, Armstrong LR, et al. Hantavirus pulmonary syndrome—the first 100 US cases. J Infect Dis 1996; 173:1297–1303.
MacNeil A, Ksiazek TG, Rollin PE. Hantavirus pulmonary syndrome, United States, 1993–2009. Emerg Infect Dis 2011; 1195–1201.
MacNeil A, Nichol ST, Spiropoulou CF. Hantavirus pulmonary syndrome. Virus Res 2011;162:138–47.
Hernolytic Uremic Syndrome
Banatvala N, Griffin PM, Greene KD, et al. The United States prospective hemolytic uremic syndrome study: microbiologic, serologic, clinical, and epidemiologic findings. J Infect Dis 2001;183:1063–70.
Gould L, Demma L, Jones TF, et al. Hemolytic uremic syndrome and death in persons with Escherichia coli O157:H7 infection, Foodborne Diseases Active Surveillance Network Sites, 2000–2006. Clin Infect Dis 2009;49:1480–5.
Tarr PI, Gordon CA Chandler WL. Shiga toxin-producing Escherichia coli and haemolytic uraemic syndrome. Lancet 2005;365:1073–86.
Influenza-Associated Pediatric Mortality
Bhat N, Wright JG, Broder KR, et al. Influenza-associated deaths among children in the United States, 2003–2004. N Engl J Med 2005;352:2559–67.
CDC. Update: Influenza-associated deaths reported among children aged <18 years—United States, 2003–04 influenza season. MMWR 2004;52:1254–5.
Council of State and Territorial Epidemiologists. Influenza-associated pediatric mortality, 2004. Atlanta, GA: Council of State and Territorial Epidemiologists; 2004. Available at http://www.cste.org/PositionStatementsResolutions2.htm.
Council of State and Territorial Epidemiologists. Position statement 04-ID-04: influenza-associated pediatric mortality 2004. Atlanta, GA: Council of State and Territorial Epidemiologists; 2004. Available at http://www.cste.org/ps/2004pdf/04-ID-04-final.pdf.
Guarner J, Paddock CD, Shieh WJ, et al. Histopathologic and immunohistochemical features of fatal influenza virus infection in children during the 2003–2004 season. Clin Infect Dis 2006;43:132–4.
Finelli L, Fiore A, Dhara R, et al. Influenza-associated pediatric mortality in the United States: Increase of Staphylococcus aureus coinfection Pediatrics: 2008;122:805–11
Peebles PJ, Dhara R, Brammer L, Fry AM, Finelli L Influenza-associated mortality among children—United States: 2007–2008.Influenza and Other Respiratory Viruses 2011;5:25–31.
Cox CM, Blanton L, Dhara R, Brammer L, Finelli L 2009 Pandemic influenza A (H1N1) deaths among children— United States, 2009–2010.Infect Dis 2011; 52 (Suppl 1): S69–74.
Legionellosis
CDC. Legionellosis—United States, 2000–2009. MMWR 2011;60:1083–6.
European Working Group on Legionella Infections. European guidelines for control and prevention of travel associated Legionnaires' disease. London, UK: United Kingdom Health Protection Agency; 2005.
Fields BS, Benson RF, Besser RE. Legionella and Legionnaires' disease: 25 years of investigation. Clin Microbiol Rev 2002;15:506–26.
Joseph CA, Ricketts KD. Legionnaires' disease in Europe 2007–2008.Eurosurveillance 2010;15(8);pii=19493.
Marston BJ, Lipman HB, Breiman RF. Surveillance for Legionnaires' disease: risk factors for morbidity and mortality. Arch Intern Med 1994;154:2417–22.
Neil K, Berkelman R. Increasing incidence of legionellosis in the United States: changing epidemiological trends. Clin Infect Dis 2008;47:591–9.
Lyme disease
CDC. Caution regarding testing for Lyme disease. MMWR 2005;54:125.
Connally NP, Durante AJ, Yousey-Hindes KM, et al. Peridomestic Lyme disease prevention: results of a population-based case-control study. Am J. Prev Med 2009;37:201–6.
Hayes EG, Piesman J. How can we prevent Lyme disease? N Engl J Med 2003;348:2424–30.
Stafford, KC III. Tick management handbook: an integrated guide for homeowners, pest control operators, and public health officials for the prevention of tick-associated disease. New Haven, CT: Connecticut Agricultural Experiment Station; 2004. Available at: http://www.ct.gov/caes/lib/caes/documents/special_features/tickhandbook.pdf.
Wormser GP, Dattwyler RJ, Shapiro ED, et al. The clinical assessment, treatment, and prevention of Lyme disease, human granulocytic, anaplasmosis, and babesiosis: clinical practice guidelines by the Infectious Disease Society of America. Clin Infect Dis 2006;43:1089–1134.
Measles
Papania M, Hinman A, Katz S, Orenstein W, McCauley M, eds. Progress toward measles elimination—absence of measles as an endemic disease in the United States. J Infect Dis 2004;189(Suppl 1):S1–257.
Rota PA, Liffick SL, Rota JS, et al. Molecular epidemiology of measles viruses in the United States, 1997–2001. Emerg Infect Dis 2002;8:902–8.
Parker Fiebelkorn A, Redd SB, Gallagher K, et al. Measles in the United States during the postelimination era. J Infect Dis 2010; Nov 15;202(10):1520–8.
Mumps
CDC. Update: mumps outbreak—New York and New Jersey, June 2009–January 2010. MMWR 2010;59:125–30.
Kutty PK, Kyaw MH, Dayan GH, et al. Guidance for isolation precautions for mumps in the United States: a review of the scientific basis for policy change. Clin Infect Dis 2010;50:1619–28.
Kutty PK, Kruszon-Moran DM, Dayan GH, et al. Seroprevalence of antibody to mumps virus in the U.S. population, 1999–2004. J Infect Dis 2010;202:667–74.
Barskey AE, Glasser JW, LeBaron CW. Mumps resurgence in the United States: a historical perspective on unexpected elements. Vaccine 2009; 27:6186–95.
Dayan G, Quinlisk P, et al. Recent resurgence of mumps in the United States. New Engl J Med 2008; 358:1580–9.
Novel influenza A virus
Olsen CW. The emergence of novel swine influenza viruses in North America. Virus Res 2002;85:199–210.
Shinde V, Bridges CB, Uyeki TM, et al. Triple-reassortant swine influenza A (H1) in humans in the United States, 2005-2009. N Engl J Med 2009; 360:2616–25
Myers KP, Olsen CW, Gray GC. Cases of swine influenza in humans: a review of the literature. Clin Infect Dis 2007;44:1084–8.
Vincent AL, Swenson SL, Lager KM, et al. Characterization of an influenza A virus isolated from pigs during an outbreak of respiratory disease in swine and people during a county fair in the United States. Vet Microbiol 2009;137:51–9.
Vincent AL, Ma W, Lager KM, Janke BH, Richt JA.. Swine influenza viruses: a North American perspective. In: Maramorosch K, Slatkin AJ, Murphy FA, eds. Advances in virus research, Vol 72. Burlington: Academic Press; 2008:127–54.
Duchatez MF, Hause B, Stigger-Rosser E, et al. Multiple reassortment between pandemic (H1N1) 2009 and endemic influenza viruses in pigs, United States. Emerg Infect Dis 2011;17:1624–9.
Plague
CDC. Human plague—four states, 2006. MMWR 2006; 55:940–3.
CDC. Notes from the field: two cases of human plague—Oregon, 2010. MMWR 2011;60:214.
Gould LH, Pape J, Ettestadt P et al. Dog-associated risk factors for human plague. Zoonoses Public Hlth 2008;55:448–54.
Inglesby TV, Dennis DT, Henderson DA, et al. Plague as a biological weapon: medical and public health management. Working Group on Civilian Defense. JAMA 2000;283:2281–90.
Dennis DT, Gage KL, Gratz N. Poland JD, Tikhomirov E. Plague manual: epidemiology, distribution, surveillance, and control. Geneva, Switzerland. World Health Organization; 1999.
Psittacosis
Mitchell SL, Wolff BJ, Thacker WL, et al. Genotyping of Chlamydophila psittaci by real time PCR and high resolution melt analysis. J. Clin Microbiol 2009; 47:175–81
Stewardson AJ, Grayson L. Psittacosis. Infect Dis Clin North Am 2010; 24:7–25
Q Fever
Angelakis E, Raoult D. Q Fever. Vet Micro 2010;140:297–309.
Kersh GJ, Wolfe TM, Fitzpatrick KA, et al. Presence of Coxiella burnetii DNA in the environment of the United States, 2006 to 2008. Appl Environ Microbiol 2010;76(13):4469–75.
Anderson AD, Kruszon-Moran D, Loftis AD, et al. Seroprevalence of Q fever in the United States, 2003–2004. Am J Trop Med Hyg 2009;81:691–4.
Tissot-Dupont D, Raoult D. Q Fever. Infect Dis Clin North Am 2008;22:505–14.
Parker N, Barralet J, Bell A. Q fever. The Lancet 2006;367[9511]:679–88.
McQuiston JH, Holman RC, McCall CL, Childs JE, Swerdlow DL, Thompson HA. National surveillance and the epidemiology of Q fever in the United States, 1978–2004. Am J Trop Med Hyg 2006;75:36–40.
Raoult D, Tissot-Dupont H, Foucault C, et al. Q fever 1985–1998. Clinical and epidemiologic features of 1,383 infections [Review]. Medicine 2000;79:109–25.
Rabies
Salmonellosis
Olsen SJ, Bishop R, Brenner FW, et al. The changing epidemiology of Salmonella: trends in serotypes isolated from humans in the United States, 1987–1997. J Infect Dis 2001;183:756–61.
Jones TF, Ingram LA, Cieslak PR, et al. Salmonellosis outcomes differ substantially by serotype. J Infect Dis 2008;198:109–14.
Guo C, Hoekstra RM, Schroeder CM, et al. Application of Bayesian techniques to model the burden of human salmonellosis attributable to U.S. food commodities at the point of processing: adaptation of a Danish model. Foodborne Pathog Dis 2011;(4):509–16. Epub 2011 Jan 16.
Braden CR. Salmonella enterica serotype Enteritidis and eggs: a national epidemic in the United States. Clin Infect Dis 2006;43:512–7.
Majowicz SE, Musto J, Scallan E, et al. The global burden of nontyphoidal Salmonella gastroenteritis. Clin Infect Dis 2010;50:882–9.
Shigellosis
Shane A, Crump J, Tucker N, Painter J, Mintz E. Sharing Shigella: risk factors and costs of a multi-community outbreak of shigellosis. Arch Pediatr Adolesc Med 2003;157:601–3.
Gupta A, Polyak CS, Bishop RD, Sobel J, Mintz ED. Laboratory-confirmed shigellosis in the United States, 1989–2002: epidemiologic trends and patterns. Clin Infect Dis 2004;38:1372–7.
Sivapalasingam S, Nelson JM, Joyce K, Hoekstra M, Angulo FJ, Mintz ED. A high prevalence of antimicrobial resistance among Shigella isolates in the United States, 1999–2002. Antimicrob Agents Chemother 2006;50:49–54.
Arvelo W, Hinkle CJ, Nguyen TA, et al. Transmission risk factors and treatment of pediatric shigellosis during a large daycare center-associated outbreak of multidrug resistant Shigella sonnei: implications for the management of shigellosis outbreaks among children. Pediatr Infect Dis J 2009;976–80.
Howie RL, Folster JP, Bowen A, et al. Reduced azithromycin susceptibility in Shigella sonnei, United States. Microb Drug Resist 2010;16:245–8. Epub 2010 Jul 12.
Haley CC, Ong KL, Hedberg K, et al. Risk factors for sporadic shigellosis, FoodNet 2005. Foodborne Pathog Dis 2010;7:741–7.
Spotted Fever Rickettsiosis
Openshaw JJ, Swerdlow DL, Krebs JW, et al. Rocky Mountain spotted fever in the United States, 2000–2007: interpreting contemporary increases in incidence. Am J Trop Med Hyg 2010;83:174–82.
Adjemian JZ, Krebs J, Mandel E, McQuiston, J. Spatial clustering by disease severity among reported Rocky Mountain spotted fever cases in the United States, 2001–2005. Am J Trop Med Hyg 2009;80:72–7.
Walker D. Rickettsiae and rickettsial infections: the current state of knowledge. Clin Infect Dis 2007;45 (Suppl 1):539–44.
Chapman AS, Murphy SM, Demma LJ, et al. Rocky Mountain spotted fever in the United States, 1997–2002. Vector-borne Zoonotic Dis 2006;6:170–8.
Demma LJ, Traeger MS, Nicholson WL, et al. Rocky Mountain spotted fever from an unexpected tick reservoir in Arizona. N Engl J Med 2005;353:587–94.
Shiga toxin–producing Escherichia coli
Hadler JL, Clogher P, Hurd S, et al. Ten-year trends and risk factors for non-O157 Shiga toxin–producing Escherichia coli found through Shiga toxin testing, Connecticut, 2000–2009. Clin Infect Dis; 53:269–76.
Lathrop S, Edge K, Bareta J.Shiga toxin–producing Escherichia coli, New Mexico, USA, 2004–2007. Emerg Infect Dis; 15: 1289–91.
Brooks JT, Sowers EG, Wells JB, et al. Non-O157 Shiga toxin-producing Escherichia coli infections in the United States, 1983–2002. J Infect Dis 2005;192:1422–9.
Hedican EB, Medus C, Besser JM, et al. Characteristics of O157 versus non-O157 Shiga toxin-producing Escherichia coli infections in Minnesota, 2000–2006. Clin Infect Dis 2009;49:358–64.
Tarr PI, Gordon CA Chandler WL. Shiga toxin-producing Escherichia coli and haemolytic uraemic syndrome. Lancet 2005;365:1073–86.
Syphilis, Congenital
CDC. Congenital syphilis—United States, 2003–2008. MMWR 2010;59:413–7.
CDC. Sexually transmitted disease surveillance, 2010. Atlanta, GA: US Department of Health and Human Services; 2011.
Syphilis, Primary and Secondary
Heffelfinger JD, Swint EB, Berman SB, Weinstock H. Trends in primary and secondary syphilis among men who have sex with men and who have sex with men in the United States. Am J Public Health 2007;97:1076–83.
Su JR, Beltrami JF, Zaidi AA, Weinstock HS. Primary and secondary syphilis among black and Hispanic men who have sex with men: case report data from 27 states. Ann Intern Med 2011;155:145–51.
CDC. Sexually transmitted disease surveillance, 2010. Atlanta, GA: US Department of Health and Human Services; 2011.
Streptococcal Toxic-Shock Syndrome
CDC. Active Bacterial Core Surveillance report. 2011. Emerging Infections Program Network. Group A Streptococcus, Provisional 2010. Available at http://www.cdc.gov/abcs/reports-findings/survreports/gas10.pdf.
Martin JM, Green M. Group A Streptococcus. Semin Pediatr Infect Dis 2006; 17:140–8.
CDC. Investigating clusters of group A streptococcal disease. Atlanta, GA: US Department of Health and Human Services, CDC; 2009. Available at http://www2.cdc.gov/ncidod/dbmd/abcs/calc/calc_new/index.htm.
The Prevention of Invasive Group A Streptococcal Infections Workshop Participants. Prevention of invasive group A streptococcal disease among household contacts of case patients and among postpartum and postsurgical patients: recommendations from the Centers for Disease Control and Prevention. Clin Infect Dis 2002;35:95–9.
O'Loughlin RE, Roberson A, Cieslak PR, et al.. The epidemiology of invasive Group A streptococcal infections and potential vaccine implications, United States, 2000–2004. Clin Infect Dis 2007; 45:853–62.
Trichinellosis
Gamble HR, Bessonov AS, Cuperlovic K, et al. International Commission on Trichinellosis: recommendations on methods for the control of Trichinella in domestic and wild animals intended for human consumption. Vet Parasitol 2000;93:393–408.
Gottstein B, Pozio E, Nockler K. Epidemiology, diagnosis, treatment, and control of trichinellosis. Clin Microbiol Rev. Jan 2009;22:127–45.
Tularemia
CDC. Tularemia—United States, 1990–2000. MMWR 2002;51:182–4.
CDC. Tularemia—Missouri, 2000–2007. MMWR 2009;58:744–8.
Dennis DT, Inglesby TV, Henderson, DA, et al. Tularemia as a biological weapon: medical and public health management. JAMA 2001;285:2763–73.
Kugeler KJ, Mead PS, Janusz AM, et al. Molecular epidemiology of Francisella tularensis in the United States. Clin Infect Dis 2009;48: 863–70.
Tarnvik A. WHO Guidelines on Tularaemia. Vol. WHO/CDS/EPR/2007.7. Geneva, Switzerland: World Health Organization; 2007
Typhoid Fever
Lynch MF, Blanton EM, Bulens S, et al. Typhoid fever in the United States, 1999–2006. JAMA 2009;302:898–9
Steinberg EB, Bishop RB, Dempsey AF, et al. Typhoid fever in travelers: who should be targeted for prevention? Clin Infect Dis 2004;39:186–91.
Olsen SJ, Bleasdale SC, Magnano AR, et al. Outbreaks of typhoid fever in the United States, 1960–1999. Epidemiol Infect 2003;130:13–21.
Katz D, Cruz MA, Trepka MJ, Suarez JA, Fiorella PD, Hammond RM. An outbreak of typhoid fever in Florida associated with an imported frozen fruit. Clin Infect Dis 2002;186:234–9.
Varicella
CDC. Prevention of varicella: recommendations of the Advisory Committee on Immunization Practices (ACIP). MMWR 2007;56(No.RR-4):1–40. Available at: http://www.cdc.gov/mmwr/PDF/rr/rr5604.pdf.
Kattan JA, Sosa LE, Bohnwagner HD, Hadler JL. Impact of 2-dose vaccination on varicella epidemiology: Connecticut—2005–2008. J Infect Dis 2011;203:509–12.
Marin M, Zhang JX, Seward JF. Near elimination of varicella deaths in the US after implementation of the vaccination program. Pediatrics 2011;128:214–20.
Lopez AS, Zhang J, Brown C, Bialek S. Varicella-related hospitalizations in the United States, 2000–2006: the 1-dose varicella vaccination era. Pediatrics 2011;127:238–45.
Vibriosis
Daniels NA, MacKinnon L, Bishop R, et al. Vibrio parahaemolyticus infections in the United States, 1973–1998. J Infect Dis 2000;181:1661–6.
Dechet A, Yu PA, Koram N, Painter J. Nonfoodborne Vibrio infections: an important cause of morbidity and mortality in the United States, 1997–2006. Clin Infect Dis;46:970–6.
McLaughlin JB, DePaola A, Bopp CA, et al. Outbreak of Vibrio parahaemolyticus gastroenteritis associated with Alaskan oysters. N Engl J Med 2005;353:1463–70.
Shapiro RL, Altekruse S, Hutwagner L, et al. The role of Gulf Coast oysters in warmer months in Vibrio vulnificus infections in the United States, 1998–1996. J Infect Dis 1998;178:752–9
Tobin-D'Angelo M, Smith AR, Bulens SN, et al. Severe diarrhea caused by cholera toxin-producing Vibrio cholerae serogroup O75 infections acquired in the southeastern United States. Clin Infect Dis 2008;47:1035–40.
Viral Hemorrhagic Fever
Rollin PE. Viral hemorrhagic fevers. In: Centers for Disease Control and Prevention. Health Information for International Travel 2012. Brunette GW, Kozarsky PE, Magill AJ, Shlim DR, editors. Atlanta: CDC; 2012. Available from: http://wwwnc.cdc.gov/travel/yellowbook/2012/table-of-contents.htm. Accessed November 15, 2011.
CDC. Interim guidance for managing patients with suspected viral hemorrhagic fever in U.S. hospitals. May 2005. Available from: www.cdc.gov/ncidod/dvrd/spb/pdf/vhf-interim-guidance.pdf.
CDC. Imported case of Marburg hemorrhagic fever—Colorado, 2008. MMWR 2009; 58:1377–81.
Amorosa V, MacNeil A, McConnell R, et al. Imported Lassa fever, Pennsylvania, USA, 2010. Emerg Infect Dis 2010; 16: 1598–1600.
Macher AM, Wolfe MS. Historical Lassa fever reports and 30-year clinical update. Emerg Inf Dis 2006; 12: 835–7.
Ergonul, O. Crimean-Congo hemorrhagic fever. Lancet 2006; 6: 203–14.
Peters CJ. Marburg and ebola virus hemorrhagic fevers. In: Mandell GL, Bennet JE, Dolin R, editors. Principles and Practice of Infectious Diseases, 7th edition. Philadelphia: Churchill Livingstone; 2010.
Peters CJ. Lymphocytic choriomeningitis virus, Lassa virus, and the South American hemorrhagic fevers. In: Mandell GL, Bennet JE, Dolin R, editors. Principles and Practice of Infectious Diseases, 7th edition. Philadelphia: Churchill Livingstone; 2010.
Use of trade names and commercial sources is for identification only and does not imply endorsement by the U.S. Department of
Health and Human Services.
References to non-CDC sites on the Internet are
provided as a service to MMWR readers and do not constitute or imply
endorsement of these organizations or their programs by CDC or the U.S.
Department of Health and Human Services. CDC is not responsible for the content
of pages found at these sites. URL addresses listed in MMWR were current as of
the date of publication.
All MMWR HTML versions of articles are electronic conversions from typeset documents.
This conversion might result in character translation or format errors in the HTML version.
Users are referred to the electronic PDF version (http://www.cdc.gov/mmwr)
and/or the original MMWR paper copy for printable versions of official text, figures, and tables.
An original paper copy of this issue can be obtained from the Superintendent of Documents, U.S.
Government Printing Office (GPO), Washington, DC 20402-9371;
telephone: (202) 512-1800. Contact GPO for current prices.
**Questions or messages regarding errors in formatting should be addressed to
mmwrq@cdc.gov.
