Persons using assistive technology might not be able to fully access information in this file. For assistance, please send e-mail to: mmwrq@cdc.gov. Type 508 Accommodation and the title of the report in the subject line of e-mail.
Vital Signs: Incidence and Trends of Infection with Pathogens Transmitted Commonly Through Food --- Foodborne Diseases Active Surveillance Network, 10 U.S. Sites, 1996--2010
On June 7, this report was posted as an MMWR Early Release on the MMWR website (http://www.cdc.gov/mmwr).
Abstract
Background: In the United States, contaminated food causes approximately 1,000 reported disease outbreaks and an estimated 48 million illnesses, 128,000 hospitalizations, and 3,000 deaths annually. This report summarizes 2010 surveillance data and describes trends since 1996.
Methods: The Foodborne Diseases Active Surveillance Network (FoodNet) conducts surveillance among 15% of the U.S. population for laboratory-confirmed infections with nine pathogens transmitted commonly through food. Overall and pathogen-specific changes in incidence were estimated from 1996--1998 to 2010 and from 2006--2008 to 2010.
Results: A total of 19,089 infections, 4,247 hospitalizations, and 68 deaths were reported from FoodNet sites in 2010. Salmonella infection was the most common infection reported (17.6 illnesses per 100,000 persons) and was associated with the largest number of hospitalizations (2,290) and deaths (29); no significant change in incidence of Salmonella infection has occurred since the start of surveillance during 1996--1998. Shiga toxin--producing Escherichia coli (STEC) O157 infection caused 0.9 illnesses per 100,000. Compared with 1996--1998, overall incidence of infection with six key pathogens in 2010 was 23% lower, and pathogen-specific incidence was lower for Campylobacter, Listeria, STEC O157, Shigella, and Yersinia infection but higher for Vibrio infection. Compared with a more recent period, 2006--2008, incidence in 2010 was lower for STEC O157 and Shigella infection but higher for Vibrio infection.
Conclusions: The incidence of STEC O157 infection has declined to reach the 2010 national health objective target of ≤1 case per 100,000. This success, as well as marked declines since 1996--1998 in overall incidence of six key foodborne infections, demonstrates the feasibility of preventing foodborne illnesses.
Implications for Public Health Practice: Salmonella infection should be targeted because it has not declined significantly in more than a decade, and other data indicate that it is one of the most common foodborne infections, resulting in an estimated $365 million in direct medical costs annually. The prevention measures that reduced STEC O157 infection need to be applied more broadly to reduce Salmonella and other infections. Effective measures from farm to table include preventing contamination of meat during slaughter and of all foods, including produce, during processing and preparation; cooking meat thoroughly; vigorously detecting and investigating outbreaks; and recalling contaminated food.
Introduction
Contaminated food consumed in the United States causes an estimated 48 million illnesses, 128,000 hospitalizations, and 3,000 deaths annually (1,2). The occurrence of approximately 1,000 reported disease outbreaks (local, regional, and national) each year highlights the challenges of preventing these infections (3). However, most foodborne illnesses occur in persons who are not part of recognized outbreaks (2). The U.S. food supply is changing, with increased centralization of production, global sourcing of ingredients, and growth in the number of meals prepared outside the home (4,5). Outbreak investigations continue to identify long-standing problems for which implementation of effective solutions has been slow. For example, a national outbreak of Salmonella infections in 2010 was caused by contamination of eggs, leading to a massive recall of approximately 500 million eggs. This occurred just before implementation of new egg regulations, which could have prevented the outbreak and the associated recall (6). Investigations also identify new problems for which solutions need to be devised.
Most foodborne infections cause diarrheal illness, ranging from mild to severe. Also, persons in susceptible populations and some healthy persons can develop severe complications, such as hemorrhagic colitis, bloodstream infection, meningitis, joint infection, kidney failure, paralysis, miscarriage, and other problems. Beyond their health effects, foodborne illnesses can cause emotional and economic hardship; for example, Salmonella alone causes approximately 1 million foodborne infections (2) and costs $365 million in direct medical expenditures* annually (7), and the societal cost of a single fatal case of Escherichia coli (STEC) O157 infection has been estimated at $7 million (8).
Gathering information from persons who are ill enough to seek medical care and submit a specimen for laboratory testing is essential for measuring progress in food safety. Measuring changes in the annual incidence of common foodborne infections can track progress toward national health objectives, inform regulatory and industry efforts to reduce food contamination, and monitor the effectiveness of prevention measures. Since 1996, the Foodborne Diseases Active Surveillance Network (FoodNet) has conducted active, population-based surveillance for infections with nine pathogens transmitted commonly through food and for post-diarrheal pediatric hemolytic uremic syndrome (HUS) (9). This report describes preliminary results of FoodNet surveillance for 2010 and summarizes trends in incidence of these infections since 1996.
Methods
FoodNet† is a collaborative program among CDC, 10 state health departments,§ the U.S. Department of Agriculture's Food Safety and Inspection Service (USDA-FSIS), and the Food and Drug Administration (FDA). It has conducted active, population-based surveillance for laboratory-confirmed infections caused by Campylobacter, Listeria, Salmonella, STEC O157, Shigella, Vibrio, and Yersinia since 1996; Cryptosporidium and Cyclospora since 1997; and STEC non-O157 since 2000. The surveillance area includes approximately 15% of the United States population (46 million persons). FoodNet personnel regularly contact clinical laboratories to ascertain laboratory-confirmed infections occurring in residents of the surveillance area (9) and record which were associated with outbreaks. Hospitalizations occurring within 7 days of specimen collection date are recorded, as is the patient's vital status at hospital discharge or at 7 days after the specimen collection date, if not hospitalized. Hospitalizations and deaths are attributed to the infection if they occur within 7 days of specimen collection.
Surveillance for HUS, a major complication of STEC infection characterized by renal failure, thrombocytopenia, and microangiopathic hemolytic anemia, is conducted through a network of nephrologists and infection control practitioners as well as hospital discharge data review. This report contains HUS data for children (persons aged <18 years) for 2009.
Incidence for 2010 was calculated by dividing the number of laboratory-confirmed infections by U.S. Census Bureau population estimates for the surveillance area for 2009.¶ Case-fatality ratios (CFRs) were calculated by dividing the number of deaths by the number of laboratory-confirmed infections and multiplying by 100. A main-effects, log-linear Poisson regression model (negative binomial) was used to estimate changes in incidence from 1996--1998 to 2010 and from 2006--2008** to 2010 with 95% confidence intervals (CIs). The model accounts for site-to-site variation and expansion of FoodNet over time (10). As a measure of overall trends in incidence, data were combined for Campylobacter, Listeria, Salmonella, STEC O157, Yersinia, and Vibrio, six key bacterial pathogens for which >50% of illnesses are estimated to be transmitted by food, weighting by incidence of infection for each pathogen (2). Trends were not assessed for STEC non-O157 and Cyclospora because data were sparse. A negative binomial model also was used for HUS to estimate incidence changes from 2006--2008 to 2009 with 95% CIs for all children.
Results
In 2010, a total of 19,089 laboratory-confirmed cases of infection, 4,247 hospitalizations, and 68 deaths were identified by FoodNet sites (Table 1). Salmonella infection was the most common infection reported (8,256 infections; 17.6 illnesses per 100,000 persons) and had the largest number of hospitalizations (2,290) and deaths (29). Incidence was highest in children aged <5 years (69.5 infections per 100,000 children) (Table 2), and 407 (5%) of infections were associated with recognized outbreaks. The incidence of Salmonella infection in 2010 was not significantly different than during 1996--1998 but was significantly higher than during 2006--2008 (10% increase; CI = 4%--17%) (Figures 1 and 2). Among the 7,564 (92%) Salmonella isolates serotyped, the most common serotypes were Enteritidis (22%), Newport (14%), and Typhimurium (13%). In 2010, compared with 1996--1998, incidence was significantly lower for Typhimurium (53% decrease; CI = 46%--58%) and higher for Newport (116% increase; CI = 67%--180%) and Enteritidis (76% increase; CI = 45%--113%). Compared with 2006--2008, incidence was significantly higher for Enteritidis (36% increase; CI = 17%--57%) and Newport (47% increase; CI = 22%--78%); incidence of Typhimurium did not change significantly.
For the other pathogens, the number of infections and incidence were: Campylobacter (6,365; 13.6 per 100,000), Shigella (1,780; 3.8 per 100,000), Cryptosporidium (1,290; 2.8 per 100,000), STEC non-O157 (451; 1.0 per 100,000); STEC O157 (442; 0.9 per 100,000), Vibrio (193; 0.4 per 100,000), Yersinia (159; 0.3 per 100,000), Listeria (125; 0.3 per 100,000), and Cyclospora (28; 0.1 per 100,000) (Table 1). Incidence was highest in children aged <5 years for Campylobacter (24.4 per 100,000), Shigella (16.4 per 100,000), Cryptosporidium (5.1 per 100,000), STEC non-O157 (5.0 per 100,000), STEC O157 (3.3 per 100,000), and Yersinia (1.9 per 100,000) infections; in persons aged 20--59 years for Cyclospora (0.1 per 100,000); and in persons aged ≥60 years for Listeria (1.1 per 100,000) and Vibrio (0.8 per 100,000) infections (Table 2).
Among the 327 STEC non-O157 infections with O serogroup identified, the most common were O26 (37%), O103 (24%), and O111 (17%). In 2010, a total of 77 (17%) STEC O157 infections were associated with recognized outbreaks; complete information for other pathogens for 2010 is not yet available. Among the 186 (96%) Vibrio isolates with species information, the most common were parahaemolyticus (57%) and vulnificus (13%).
The percentage of patients hospitalized ranged from 0% for Cyclospora to 90% for Listeria infection. CFRs ranged from 0% for Cyclospora and Shigella to 13% for Listeria infection. Overall, the percentage of patients hospitalized (40%) and CFRs (1.5%) were highest among persons aged ≥60 years.
The overall incidence for the six key pathogens (Campylobacter, Listeria, Salmonella, STEC O157, Yersinia, and Vibrio) was 23% lower in 2010 than during 1996--1998. For individual pathogens, the incidence was significantly lower for Shigella (57% decrease; CI = 39%--69%), Yersinia (52% decrease; CI = 40%--62%), STEC O157 (44% decrease; CI = 31%--55%), Listeria (38% decrease; CI = 22%--51%), and Campylobacter (27% decrease; CI = 21%--32%) but higher for Vibrio (115% increase; CI = 60%--187%). It did not change significantly for Cryptosporidium (Figure 1).
Compared with 2006--2008, the measure of overall incidence was not significantly different in 2010. The incidence was significantly lower for STEC O157 (29% decrease; CI = 15%--40%) and Shigella (29% decrease; CI = 8%--46%) and significantly higher for Vibrio (39% increase; CI = 12%--72%). The incidence did not change significantly for Campylobacter, Cryptosporidium, Listeria, and Yersinia (Figure 2).
In 2009, FoodNet identified 66 children with HUS (0.59 cases per 100,000), of whom one died and 38 (58%) were aged <5 years (1.2 case per 100,000). Compared with 2006--2008, the incidence was significantly lower for children aged <5 years (36% decrease; CI = 7%--56%) but not significantly different for all children.
Conclusions and Comment
Foodborne infections can be prevented. The incidence of STEC O157 infection has declined to reach the 2010 national health objective target of ≤1 case per 100,000 (11).†† This decline was mirrored by a decrease in HUS. Many factors likely contributed to this success. One is improved detection and investigation of STEC O157 outbreaks, resulting not only in contaminated products being removed before more persons became ill but also in enhanced knowledge about preventing contamination that was used to prevent future outbreaks and illnesses. PulseNet,§§ the national molecular subtyping network for foodborne bacterial pathogens, can detect widely dispersed outbreaks and has greatly improved the detection and investigation of multistate outbreaks. Others include cleaner slaughter methods, microbial testing, and better inspections in ground beef processing plants (12); regulatory agency prohibition of contamination of ground beef with STEC O157 (resulting in 234 beef recalls since STEC O157 was declared an adulterant in ground beef in 1994);¶¶ improvements in the FDA model Food Code (13); and increased awareness in food service establishments and consumers' homes of the risk of consumption of undercooked ground beef (14).
Less progress has been made with most other infections, especially Salmonella, the most common infection and the most common cause of hospitalization and death tracked in FoodNet. Salmonella infections have not declined over the past 15 years and actually increased since 2006--2008. In 2010, the incidence was nearly three times the 2010 national health objective target. Salmonella causes an estimated 1.2 million U.S. illnesses annually, approximately 1 million of which are transmitted by food consumed in the United States (2). Salmonella can contaminate a wide range of foods, and different serotypes tend to have different animal reservoirs and food sources, making control challenging. Most of the decreases in the incidence of Campylobacter, Listeria, Shigella, and Yersinia infection since 1996--1998 occurred before 2004. Vibrio infections, though less common, have increased.
Other important pathogens transmitted commonly through food (e.g., norovirus, Clostridium perfringens, and Toxoplasma) are not tracked in FoodNet because tests to detect them are not generally available for clinical laboratories (2). Many of the control measures that would decrease illness caused by pathogens tracked in FoodNet would also decrease illnesses caused by pathogens not tracked presently.
Most pathogens tracked in FoodNet live in healthy animals; they contaminate meat and poultry when animals are slaughtered and processed, and they contaminate environments in which fruits, nuts, and vegetables are grown and processed. Exceptions are Shigella, which lives in the intestines of ill persons and can contaminate food when persons do not wash their hands after defecating, and Vibrio, which lives in marine waters and healthy shellfish, especially oysters.
Children aged <5 years continue to have the highest incidence of most of these infections. However, infected persons aged ≥60 years are at highest risk for hospitalization and death from most of these infections, making prompt diagnosis and treatment, as well as careful attention to food safety, especially important in this age group.
FoodNet surveillance relies on isolation of bacterial pathogens by culture of clinical specimens. However, most illnesses are not laboratory-confirmed; for example, an estimated 29 Salmonella illnesses occur for every one that is laboratory-confirmed, and many hospitalizations and deaths caused by Salmonella infection are not ascertained (2). In addition, changes in laboratory practices, such as increasing use of culture-independent tests for STEC (15) and Campylobacter, can affect the reported incidence of infection. These tests offer the clinical advantage of more rapid diagnosis; as they are adopted more broadly, they might have an adverse effect on current surveillance strategies (16).
The findings in this report are subject to at least four limitations. First, the proportion transmitted by nonfood routes differs for each pathogen, and the route usually cannot be determined for individual nonoutbreak illnesses. Second, differences in health-care--seeking behaviors between age groups might account for some of the observed differences in incidence (17). Third, despite broad demographic similarities between FoodNet and the U.S. population, findings in FoodNet might not be representative of the entire United States (9). Finally, the measure of overall incidence was calculated from data for six bacterial pathogens and was influenced strongly by early declines in Campylobacter, Listeria, and Yersinia; this is not a measure of all foodborne illnesses.
Reducing Salmonella infection and other foodborne infections will require strong action to prevent food contamination at multiple steps along the farm to the table chain, a prominent lesson from the success in reducing STEC O157 infection. Farmers, the food industry, regulatory agencies, food service, consumers, and public health authorities all have a role. New national health objectives target a 25% reduction in Salmonella infections by 2020 and 25%--50% reductions for five other infections and HUS (18). Achieving the targets could prevent an estimated 4.6 million illnesses, 68,000 hospitalizations, and 1,470 deaths by 2020.*** It also could save $421 million in direct medical costs††† associated with Salmonella infection alone (9).
Using and monitoring proven measures to reduce contamination in processing plants (e.g., through the Hazard Analysis Critical Control Point [HACCP] management system) is a successful approach. USDA-FSIS has been tightening standards aimed at preventing Salmonella infection, and, in July 2011, will reduce the allowable contamination of whole broiler chickens at processing plants from 20.0% to 7.5% of carcasses (19). FDA is implementing the new egg regulations. The Food Safety Modernization Act of 2010 gives FDA much needed authority to regulate food facilities, establish standards for safe produce, recall contaminated foods, and oversee imported foods; the act also calls on CDC and state partners to improve surveillance and response to outbreaks (20). Restaurants with managers trained in food safety are less likely to have outbreaks than those without; consumers can advocate for and state and local officials can require such training (21). Consumers can cook meat thoroughly and can follow the other food safety practices described at http://www.cdc.gov/winnablebattles/foodsafety/index.html, http://www.foodsafetyworkinggroup.gov, http://www.foodsafety.gov, and http://www.fightbac.org.
Reported by
Debra Gilliss, MD, California Dept of Public Health. Alicia Cronquist, MPH, Colorado Dept of Public Health and Environment. Matthew Cartter, MD, Connecticut Dept of Public Health. Melissa Tobin-D'Angelo, MD, Div of Public Health, Georgia Dept of Human Resources. David Blythe, MD, Maryland Dept of Health and Mental Hygiene. Kirk Smith, DVM, Minnesota Dept of Health. Sarah Lathrop, PhD, New Mexico Dept of Health. Guthrie Birkhead, New York State Dept of Health. Paul Cieslak, MD, Oregon Public Health Div. John Dunn, DVM, Tennessee Dept of Health. Kristin G Holt, DVM, Food Safety and Inspection Svc, US Dept of Agriculture. John J. Guzewich, Center for Food Safety and Applied Nutrition, Food and Drug Admin. Olga L. Henao, PhD, Barbara Mahon, MD, Patricia Griffin, MD, Robert V. Tauxe, MD, Stacy M. Crim, MPH, Div of Foodborne, Waterborne, and Environmental Diseases, National Center for Emerging and Zoonotic Infectious Diseases, CDC. Corresponding contributor: Olga L. Henao, PhD, CDC, 404-639-3393, ohenao@cdc.gov.
References
- Scallan E, Griffin PM, Angulo FJ, Tauxe RV, Hoekstra RM. Foodborne illness acquired in the United States---unspecified agents. Emerg Infect Dis 2011;17:16--22.
- Scallan E, Hoekstra RM, Angulo FJ, et al. Foodborne illness acquired in the United States---major pathogens. Emerg Infect Dis 2011;17:7--15.
- CDC. Surveillance for foodborne disease outbreaks---United States, 2007. MMWR 2010;59:973--9.
- Todd JE, Mancino L, Lin B. The impact of food away from home on adult diet quality. Washington, DC: US Department of Agriculture, Economic Research Service; 2010. Available at http://www.ers.usda.gov/publications/err90. Accessed May 5, 2011.
- US Department of Agriculture, Economic Research Service. Food marketing system in the U.S.: food and beverage manufacturing. Washington, DC: US Department of Agriculture, Economic Research Service; 2010. Available at http://www.ers.usda.gov/briefing/foodmarketingsystem/processing.htm. Accessed May 5, 2011.
- Food and Drug Administration, US Department of Agriculture, Food Safety and Inspection Service. Prevention of Salmonella Enteritidis in shell eggs during production, storage, and transportation. Final rule. Fed Regist 2009;74:33029--101.
- US Department of Agriculture, Economic Research Service. Foodborne illness cost calculator: Salmonella. Washington, DC: US Department of Agriculture, Economic Research Service; 2010. Available at http://www.ers.usda.gov/data/foodborneillness/salm_intro.asp. Accessed May 5, 2011.
- Frenzen PD, Drake A, Angulo FJ. Economic cost of illness due to Escherichia coli O157 infections in the United States. J Food Prot 2005;68:2623--30.
- Scallan E. Activities, achievements, and lessons learned during the first 10 years of the Foodborne Diseases Active Surveillance Network: 1996--2005. Clin Infect Dis 2007;44:718--25.
- Henao OL, Scallan E, Mahon B, Hoekstra RM. Methods for monitoring trends in the incidence of foodborne diseases: Foodborne Diseases Active Surveillance Network 1996--2008. Foodborne Pathog Dis 2010;7:1421--6.
- US Department of Health and Human Services. Healthy People 2010 (midcourse review). Washington, DC: US Department of Health and Human Services; 2000.
- US Department of Agriculture, Food Safety and Inspection Service. Microbiological testing program for Escherichia coli O157:H7. Washington, DC: US Department of Agriculture, Food Safety and Inspection Service; 2011. Available at http://www.fsis.usda.gov/science/ground_beef_e.coli_testing_results/index.asp. Accessed May 5, 2011.
- Food and Drug Administration. Food Code 2009. Washington, DC: US Department of Health and Human Services, Food and Drug Administration; 2009. Available at http://www.fda.gov/food/foodsafety/retailfoodprotection/foodcode/foodcode2009. Accessed May 5, 2011.
- Patil SR, Cates S, Morales R. Consumer food safety knowledge, practices, and demographic differences: findings from a meta-analysis. J Food Prot 2005;9:1884--94.
- Hoefer D, Hurd S, Medus C, et al. Laboratory practices for the identification of Shiga toxin-producing Escherichia coli in the United States, FoodNet Sites, 2007. Foodborne Pathog Dis 2011;8:555--60.
- CDC. Recommendations for diagnosis of Shiga toxin--producing Escherichia coli infections by clinical laboratories. MMWR 2009;58(No. RR-12).
- Scallan E, Jones TF, Cronquist A, et al. Factors associated with seeking medical care and submitting a stool sample in estimating the burden of foodborne illness. Foodborne Pathog Dis 2006;3:432--8.
- US Department of Health and Human Services. Food safety. Objective FS-1: reduce infections caused by key pathogens transmitted commonly through food. Washington, DC: US Department of Health and Human Services; 2011. Available at http://www.healthypeople.gov/2020/topicsobjectives2020/objectiveslist.aspx?topicid=14. Accessed May 5, 2011.
- US Department of Agriculture, Food Safety and Inspection Service. New performance standards for Salmonella and Campylobacter in young chicken and turkey slaughter establishments: response to comments and announcement of implementation schedule. Fed Regist 2011;76:15282--90.
- Food and Drug Administration. FDA Food Safety Modernization Act. Washington, DC: US Department of Health and Human Services, Food and Drug Administration; 2011. Available at http://www.fda.gov/food/foodsafety/fsma/default.htm. Accessed May 5, 2011.
- Hedberg CW, Smith SJ, Kirkland E, et al. Systematic environmental evaluations to identify food safety differences between outbreak and nonoutbreak restaurants. J Food Prot 2006;69:2697--702.
* The direct medical cost estimate was prepared using the U.S. Department of Agriculture's Economic Research Service (ERS) foodborne illness cost calculator for Salmonella (7) and 1) the CDC estimate of annual number of cases of Salmonella infection (2); 2) the average cost of a physician office visit, emergency department visit, or outpatient department visit derived from the 2008 Medical Expenditures Panel Survey (available at http://www.meps.ahrq.gov/mepsweb); and 3) the average cost of a hospital admission for Salmonella infection derived from the 2008 Nationwide Inpatient Sample (available at http://www.hcup-us.ahrq.gov/nisoverview.jsp).
† Additional information about FoodNet is available at http://www.cdc.gov/foodnet.
§ Connecticut, Georgia, Maryland, Minnesota, New Mexico, Oregon, Tennessee, and selected counties in California, Colorado, and New York.
¶ Final incidence rates will be reported when population estimates for 2010 are available.
** MMWR reports on FoodNet surveillance data from 2008 and 2009 used the preceding 3 years, a moving period, for comparison; this report initiates use of 2006--2008 as a stable comparison period.
†† This goal was set as a 50% reduction of the 1997 incidence as measured in the initial FoodNet sites.
§§ Additional information about PulseNet is available at http://www.cdc.gov/pulsenet.
¶¶ A list of recalls issued is available at http://www.fsis.usda.gov/fsis_recalls/index.asp.
*** The total number of illnesses, hospitalizations, and deaths prevented by meeting the Healthy People 2020 national objective targets was estimated using the recent foodborne illness estimates as the base for 2010 (2) and linear extrapolation to reach the percentage reduction stated in Healthy People 2020, assuming stable population size.
††† Direct medical costs averted were calculated using the number of cases prevented each year and the average cost per case calculated as described previously, using an annual discounting rate of 3%.
FIGURE 1. Relative rates of laboratory-confirmed infections with Campylobacter, STEC O157, Listeria, Salmonella, and Vibrio, compared with 1996--1998 rates, by year --- Foodborne Diseases Active Surveillance Network, United States, 1996--2010*
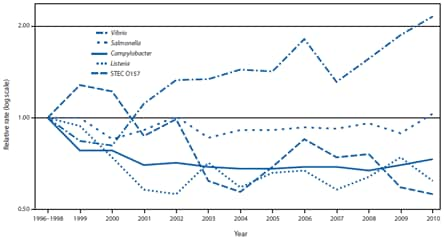
Abbreviation: STEC = Shiga toxin--producing Escherichia coli.
* The position of each line indicates the relative change in the incidence of that pathogen compared with 1996--1998. The actual incidences of these infections cannot be determined from this graph.
Alternate Text: The figure above shows relative rates of laboratory-confirmed infections with Campylobacter, Shiga toxin–producing Escherichia coli O157, Listeria, Salmonella, and Vibrio, compared with 1996–1998 rates, by year, in the United States during 1996–2010, based on data from the Foodborne Diseases Active Surveillance Network (FoodNet).
FIGURE 2. Estimated percentage change in incidence of laboratory-confirmed bacterial and parasitic infections in 2010, compared with average annual incidence during 2006--2008, by pathogen --- Foodborne Diseases Active Surveillance Network, United States
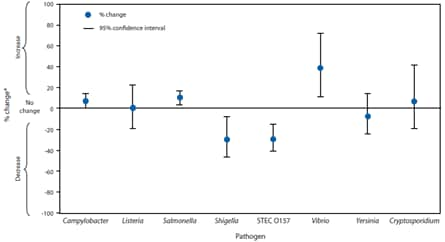
Abbreviation: STEC = Shiga toxin--producing Escherichia coli.
* No significant change = 95% confidence interval is both above and below the no change line; significant increase = entire 95% confidence interval is above the no change line; significant decrease = entire 95% confidence interval is below the no change line.
Alternate Text: The figure above shows estimated percentage change in incidence of laboratory-confirmed bacterial and parasitic infections in 2010, compared with average annual incidence during 2006–2008, by pathogen, in the United States, based on data from the Foodborne Diseases Active Surveillance Network (FoodNet).
|
Key Points |
|
Use of trade names and commercial sources is for identification only and does not imply endorsement by the U.S. Department of Health and Human Services. |
All MMWR HTML versions of articles are electronic conversions from typeset documents. This conversion might result in character translation or format errors in the HTML version. Users are referred to the electronic PDF version (http://www.cdc.gov/mmwr) and/or the original MMWR paper copy for printable versions of official text, figures, and tables. An original paper copy of this issue can be obtained from the Superintendent of Documents, U.S. Government Printing Office (GPO), Washington, DC 20402-9371; telephone: (202) 512-1800. Contact GPO for current prices.
**Questions or messages regarding errors in formatting should be addressed to mmwrq@cdc.gov.
