Co-involvement of Opioids in Drug Overdose Deaths Involving Cocaine and Psychostimulants
NCHS Data Brief No. 406, April 2021
PDF Versionpdf icon (568 KB) | Visual Abstract
- Key findings
- In 2019, the percentage of cocaine-involved overdose deaths that also involved opioids varied by region.
- From 2009 through 2019, the trends in rates of overdose deaths involving psychostimulants varied according to whether opioids were involved.
- In 2019, the percentage of psychostimulant-involved overdose deaths that also involved opioids varied by region.
- Summary
Data from the National Vital Statistics System, Mortality
- From 2009 through 2019, the rate of overdose deaths involving both cocaine and opioids increased at a faster pace than the rate of overdose deaths with cocaine but no opioids.
- In 2019, 76% of overdose deaths involving cocaine also involved an opioid; the percentage varied by region, from 83% in the Northeast to 63% in the West.
- From 2009 through 2016, the rate of overdose deaths involving psychostimulants but no opioids was higher than the rate for deaths involving both drugs; from 2017 through 2019, the pattern reversed with a higher rate for deaths involving both psychostimulants and opioids.
- In 2019, 54% of overdose deaths involving psychostimulants also involved an opioid; the percentage varied by region, from 80% in the Northeast to 44% in the West.
Deaths from drug overdose continue to contribute to the public health burden in the United States (1). The increase in the rate of drug overdose deaths involving cocaine and psychostimulants has been well-documented in recent years (1–4). This NCHS Data Brief provides additional information on drug overdose deaths involving cocaine and other psychostimulants (drugs such as methamphetamine, amphetamine, and methylphenidate) by examining the concurrent involvement of opioids. Trends from 2009 through 2019 and differences by census region in 2019 are presented.
Keywords: methamphetamine, census region, National Vital Statistics System Mortality File
From 2013 through 2019, the rate of drug overdose deaths involving both cocaine and opioids increased at a faster pace than the rate of overdose deaths involving cocaine without opioid involvement.
- After remaining stable from 2009 through 2013, the age-adjusted rate of drug overdose deaths involving cocaine more than tripled from 1.6 per 100,000 in 2013 to 4.9 in 2019 (Figure 1).
- The rate of drug overdose deaths involving both cocaine and opioids increased nearly 5.5 times from 0.7 in 2009 to 3.8 in 2019, while the rate of overdose deaths involving cocaine without opioid involvement increased just over 1.5 times from 0.7 to 1.1.
Figure 1. Age-adjusted rates of overdose deaths involving cocaine, by concurrent involvement of opioids: United States, 2009–2019
image icon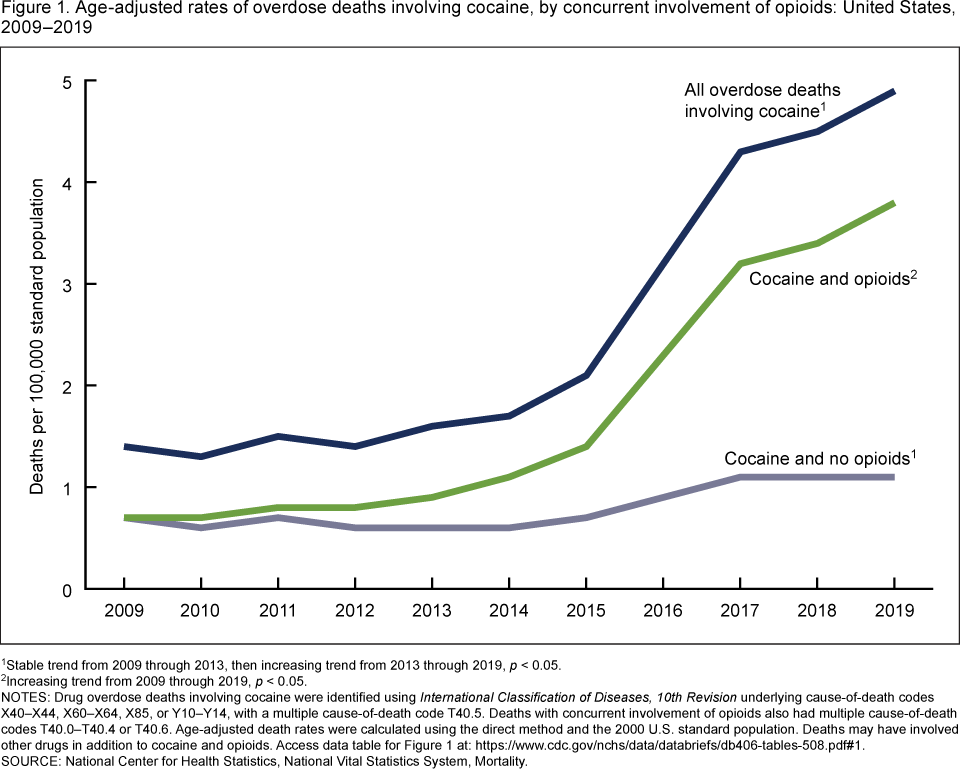
1Stable trend from 2009 through 2013, then increasing trend from 2013 through 2019, p < 0.05.
2Increasing trend from 2009 through 2019, p < 0.05.
NOTES: Drug overdose deaths involving cocaine were identified using International Classification of Diseases, 10th Revision underlying cause-of-death codes X40–X44, X60–X64, X85, or Y10–Y14, with a multiple cause-of-death code T40.5. Deaths with concurrent involvement of opioids also had multiple cause-of-death codes T40.0–T40.4 or T40.6. Age-adjusted death rates were calculated using the direct method and the 2000 U.S. standard population. Deaths may have involved other drugs in addition to cocaine and opioids. Access data table for Figure 1pdf icon.
SOURCE: National Center for Health Statistics, National Vital Statistics System, Mortality.
In 2019, the percentage of cocaine-involved overdose deaths that also involved opioids varied by region.
- In 2019, 15,883 drug overdose deaths involving cocaine occurred in the United States. Of these, 75.5% also involved an opioid (Figure 2).
- The percentage of cocaine-involved overdose deaths that also involved an opioid varied by census region: 83.1% in the Northeast (highest), 78.1% in the Midwest, 70.9% in the South, and 63.0% in the West (lowest).
Figure 2. Percentage of overdose deaths involving cocaine with concurrent involvement of opioids, by census region: United States, 2019
image icon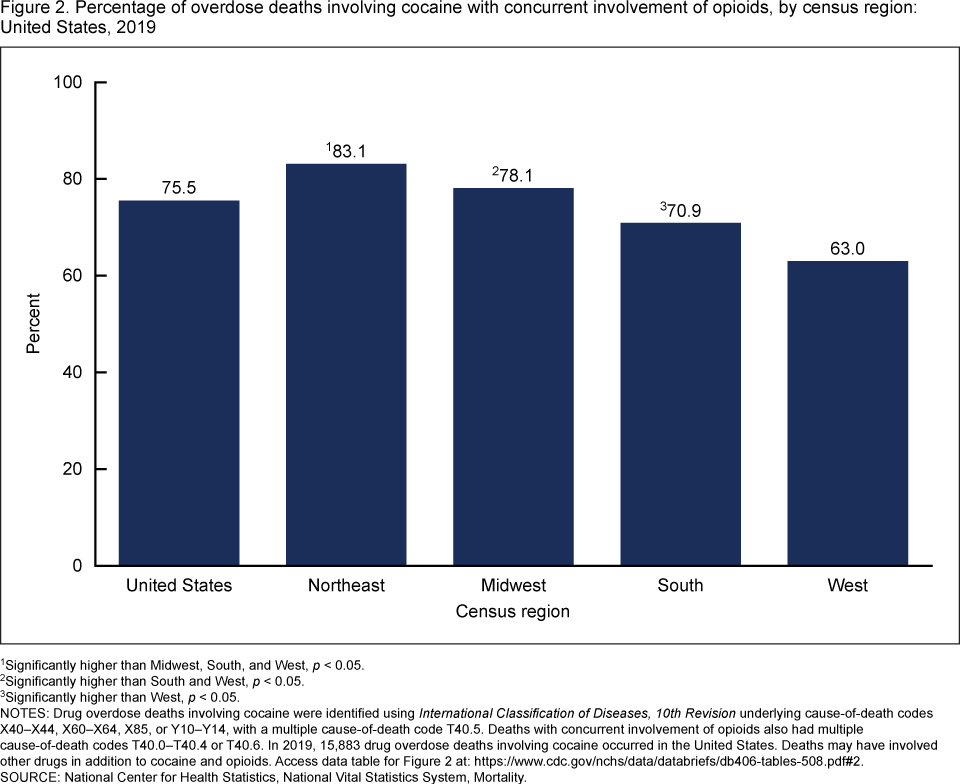
1Significantly higher than Midwest, South, and West, p < 0.05.
2Significantly higher than South and West, p < 0.05.
3Significantly higher than West, p < 0.05.
NOTES: Drug overdose deaths involving cocaine were identified using International Classification of Diseases, 10th Revision underlying cause-of-death codes X40–X44, X60–X64, X85, or Y10–Y14, with a multiple cause-of-death code T40.5. Deaths with concurrent involvement of opioids also had multiple cause-of-death codes T40.0–T40.4 or T40.6. In 2019, 15,883 drug overdose deaths involving cocaine occurred in the United States. Deaths may have involved other drugs in addition to cocaine and opioids. Access data table for Figure 2pdf icon.
SOURCE: National Center for Health Statistics, National Vital Statistics System, Mortality.
From 2009 through 2019, the trends in rates of overdose deaths involving psychostimulants varied according to whether opioids were involved.
- The age-adjusted rate of drug overdose deaths involving psychostimulants increased 10 times from 0.5 per 100,000 in 2009 to 5.0 in 2019 (Figure 3).
- The rate of drug overdose deaths involving both psychostimulants and opioids was stable from 2009 through 2012, then increased from 0.3 in 2012 to 2.8 in 2019.
- The rate of overdose deaths involving psychostimulants without opioid involvement increased from 0.3 in 2009 to 2.3 in 2019.
- From 2009 through 2016, the rate of overdose deaths involving psychostimulants without opioids was higher than the rate involving both psychostimulants and opioids. From 2017 through 2019, this pattern reversed with higher rates for overdose deaths involving both psychostimulants and opioids.
Figure 3. Age-adjusted rates of overdose deaths involving psychostimulants, by concurrent involvement of opioids: United States, 2009–2019
image icon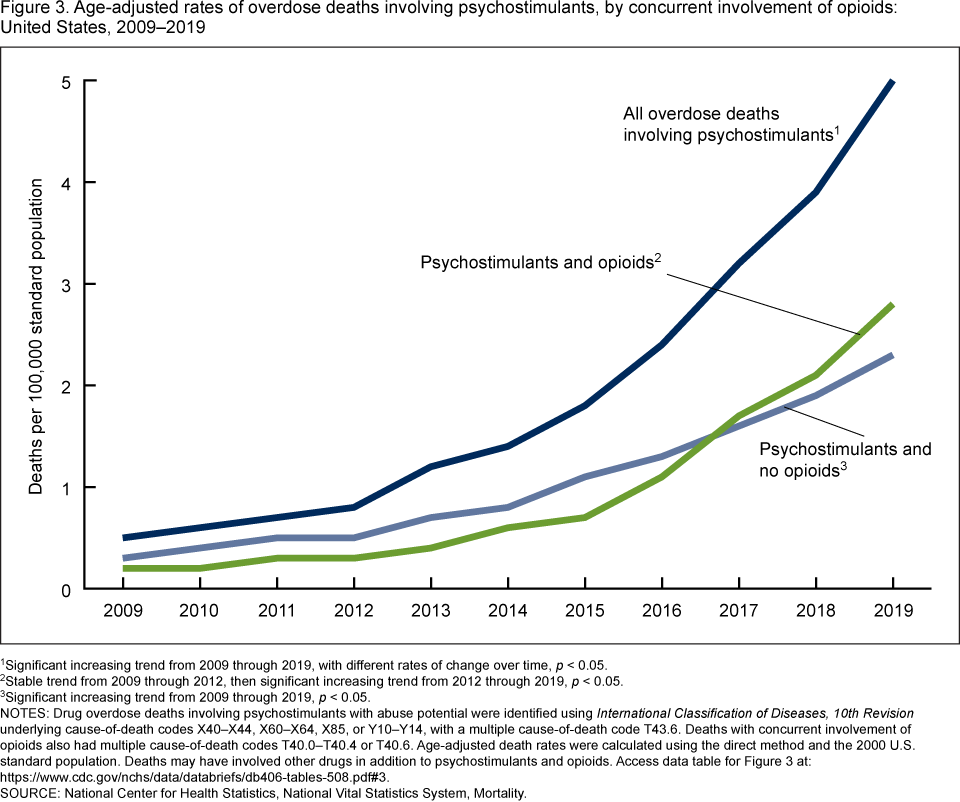
1Significant increasing trend from 2009 through 2019, with different rates of change over time, p < 0.05.
2Stable trend from 2009 through 2012, then significant increasing trend from 2012 through 2019, p < 0.05.
3Significant increasing trend from 2009 through 2019, p < 0.05.
NOTES: Drug overdose deaths involving psychostimulants with abuse potential were identified using International Classification of Diseases, 10th Revision underlying cause-of-death codes X40–X44, X60–X64, X85, or Y10–Y14, with a multiple cause-of-death code T43.6. Deaths with concurrent involvement of opioids also had multiple cause-of-death codes T40.0–T40.4 or T40.6. Age-adjusted death rates were calculated using the direct method and the 2000 U.S. standard population. Deaths may have involved other drugs in addition to psychostimulants and opioids. Access data table for Figure 3pdf icon.
SOURCE: National Center for Health Statistics, National Vital Statistics System, Mortality.
In 2019, the percentage of psychostimulant-involved overdose deaths that also involved opioids varied by region.
- In 2019, 16,167 drug overdose deaths involving psychostimulants occurred in the United States. Of these, 53.5% also involved an opioid (Figure 4).
- The percentage of psychostimulant-involved overdose deaths that also involved an opioid varied by census region: 79.6% in the Northeast (highest), 60.4% in the Midwest, 54.3% in the South, and 43.6% in the West (lowest).
Figure 4. Percentage of overdose deaths involving psychostimulants with concurrent involvement of opioids, by census region: United States, 2019
image icon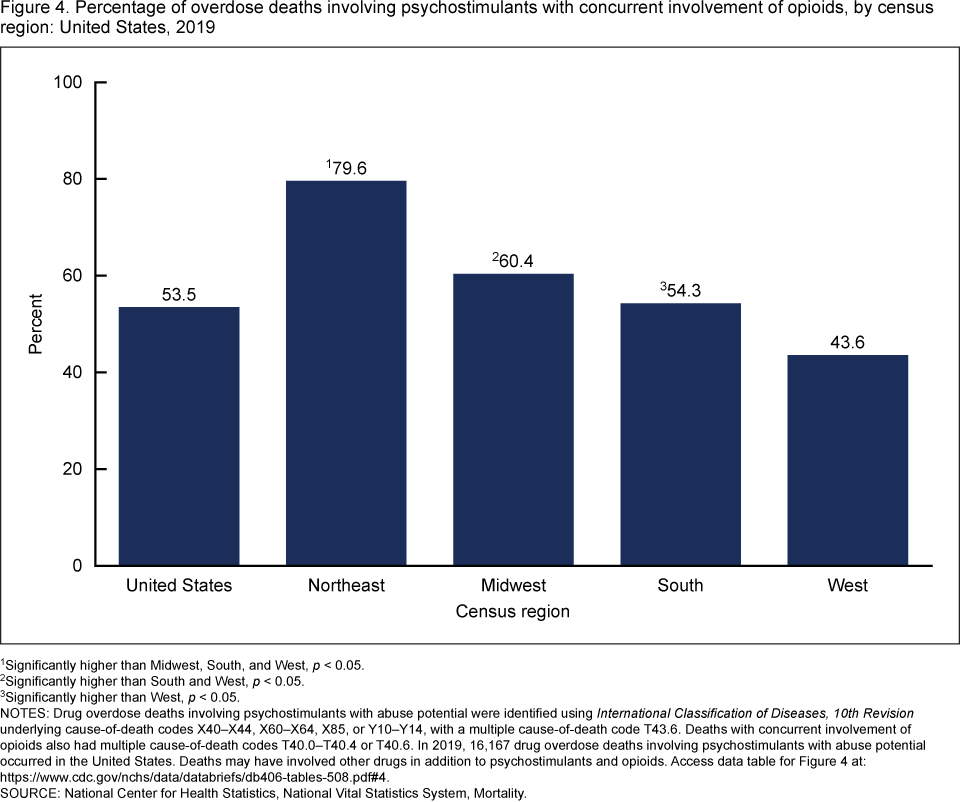
1Significantly higher than Midwest, South, and West, p < 0.05.
2Significantly higher than South and West, p < 0.05.
3Significantly higher than West, p < 0.05.
NOTES: Drug overdose deaths involving psychostimulants with abuse potential were identified using International Classification of Diseases, 10th Revision underlying cause-of-death codes X40–X44, X60–X64, X85, or Y10–Y14, with a multiple cause-of-death code T43.6. Deaths with concurrent involvement of opioids also had multiple cause-of-death codes T40.0–T40.4 or T40.6. In 2019, 16,167 drug overdose deaths involving psychostimulants with abuse potential occurred in the United States. Deaths may have involved other drugs in addition to psychostimulants and opioids. Access data table for Figure 4pdf icon.
SOURCE: National Center for Health Statistics, National Vital Statistics System, Mortality.
Summary
The findings highlight increases in the co-involvement of opioids in drug overdose deaths involving cocaine and psychostimulants in recent years. In 2019, three-quarters of the 15,883 drug overdose deaths involving cocaine also involved one or more opioids. This percentage varied by region, with the highest percentage in the Northeast (83.1%) and the lowest percentage in the West (63.0%). From 2013 through 2019, the rate of overdose deaths involving both cocaine and opioids increased at a faster pace than overdose deaths that involved cocaine but no opioids.
Compared with the findings for cocaine, only 53.5% of the 16,167 drug overdose deaths involving psychostimulants in 2019 also involved one or more opioids. As with overdose deaths involving cocaine, the percentage varied by region, with the highest percentage in the Northeast (79.6%) and the lowest percentage in the West (43.6%). From 2009 through 2016, the rate of overdose deaths involving psychostimulants but no opioids was higher than the rate of deaths with opioids, while from 2017 through 2019, the rate was higher for overdose deaths involving both psychostimulants and opioids.
Definitions
Drug poisoning (overdose) deaths: Includes deaths resulting from unintentional or intentional overdose of a drug, being given the wrong drug, taking a drug in error, or taking a drug inadvertently.
Psychostimulants with abuse potential: Includes drugs such as methamphetamine, amphetamine, and methylphenidate.
Any opioids: Includes natural and semisynthetic opioids (e.g., opium, morphine, codeine, hydrocodone, oxycodone), heroin, synthetic opioids (e.g., methadone, fentanyl, fentanyl analogs, tramadol), and mentions of opiates or opioids without naming a specific drug.
Data source and methods
Estimates are based on the National Vital Statistics System multiple cause-of-death mortality files (5). Drug poisoning (overdose) deaths involving cocaine were defined as deaths with International Classification of Diseases, 10th Revision (ICD–10) underlying cause-of-death codes X40–X44 (unintentional drug poisoning), X60–X64 (suicide by drug poisoning), X85 (homicide by drug poisoning), or Y10–Y14 (drug poisoning of undetermined intent), with a multiple cause-of-death code of T40.5. Drug poisoning deaths involving psychostimulants with abuse potential were defined as deaths with ICD–10 underlying cause-of-death codes X40–X44, X60–X64, X85, or Y10–Y14, with a multiple cause-of-death code of T43.6. Deaths with concurrent involvement of opioids had multiple cause-of-death codes T40.0–T40.4 or T40.6, in addition to T40.5 or T43.6. The decedent’s state of residence was grouped into one of four census regions: Northeast, Midwest, South, and West (6).
Age-adjusted death rates were calculated using the direct method, adjusting to the 2000 U.S. standard population (7). Trends in age-adjusted death rates were evaluated using the Joinpoint Regression Program (Version 4.8.0.1) (8). Joinpoint software fitted weighted least-squares regression models to the rates on the logarithmic transformation scale. Analyses were set to allow a maximum of three joinpoints across the period, a minimum of three observed time points from any given joinpoint to either end of the data, and a minimum of four observed time points between any two joinpoints. The permutation tests for model (number of joinpoints) significance were set at an overall alpha level of 0.05 (9). Pairwise comparisons of rates were conducted using a z test with an alpha level of 0.05 (7).
Several factors related to death investigation and reporting may affect measurement of death rates involving specific drugs. At autopsy, the substances tested for and the circumstances under which the toxicology tests are performed vary by jurisdiction. This variability is more likely to affect substance-specific death rates than the overall drug overdose death rate. The percentage of drug overdose deaths that identified the specific drugs involved varied by year, ranging from 75% to 79% from 2009 through 2013 and increasing from 81% to 94% from 2014 through 2019. In 2019, at least one specific drug or drug category was mentioned in 94% of drug overdose deaths in the Northeast, Midwest, and West, and 93% in the South.
Some drug overdose deaths may have involved other drugs in addition to cocaine, psychostimulants, and opioids. While this report emphasizes drug overdose deaths involving cocaine or psychostimulants with or without the involvement of opioids, all drugs mentioned as involved in the death were considered to have contributed to the death.
About the authors
Holly Hedegaard is with the National Center for Health Statistics (NCHS), Division of Analysis and Epidemiology. Arialdi Miniño and Margaret Warner are with the NCHS Division of Vital Statistics.
References
- Hedegaard H, Miniño AM, Warner M. Drug overdose deaths in the United States, 1999–2019pdf icon. NCHS Data Brief, no 394. Hyattsville, MD: National Center for Health Statistics. 2020.
- Hedegaard H, Spencer MR, Garnett MF. Increase in drug overdose deaths involving cocaine: United States, 2009–2018pdf icon. NCHS Data Brief, no 384. Hyattsville, MD: National Center for Health Statistics. 2020.
- Ahmad FB, Rossen LM, Sutton P. Provisional drug overdose death counts. National Center for Health Statistics. 2021.
- Kariisa M, Scholl L, Wilson N, Seth P, Hoots B. Drug overdose deaths involving cocaine and psychostimulants with abuse potential—United States, 2003–2017. MMWR Morb Mortal Wkly Rep 68(17):388–95. 2019.
- National Center for Health Statistics. Public-use data files: Mortality multiple cause files. 2019.
- United States Census Bureau. Regional officesexternal icon. 2020.
- Murphy SL, Xu JQ, Kochanek KD, Arias E, Tejada-Vera B. Deaths: Final data for 2018pdf icon. National Vital Statistics Reports; vol 69 no 13. Hyattsville, MD: National Center for Health Statistics. 2021.
- National Cancer Institute. Joinpoint regression program (Version 4.8.0.1) [computer software]. 2019.
- Ingram DD, Malec DJ, Makuc DM, Kruszon-Moran D, Gindi RM, Albert M, et al. National Center for Health Statistics guidelines for analysis of trendspdf icon. National Center for Health Statistics. Vital Health Stat 2(179). 2018.
Suggested citation
Hedegaard H, Miniño AM, Warner M. Co-involvement of opioids in drug overdose deaths involving cocaine and psychostimulants. NCHS Data Brief, no 406. Hyattsville, MD: National Center for Health Statistics. 2021. DOI: https://doi.org/10.15620/cdc:103966external icon.
National Center for Health Statistics
Brian C. Moyer, Ph.D., Director
Amy M. Branum, Ph.D., Acting Associate Director for Science
Division of Analysis and Epidemiology
Irma E. Arispe, Ph.D., Director
Kevin C. Heslin, Ph.D., Associate Director for Science
Division of Vital Statistics
Steven Schwartz, Ph.D., Director
Isabelle Horon, Dr.P.H., Acting Associate Director for Science