Youth Health in Focus

Findings From the National Youth Risk Behavior Survey 2015–2025
For Everyone

At a glance

Youth Health in Focus: Findings From the National Youth Risk Behavior Survey 2015–2025 provides a snapshot of the health and well-being of high school students in the United States in 2025 and changes over the past 2 and 10 years.
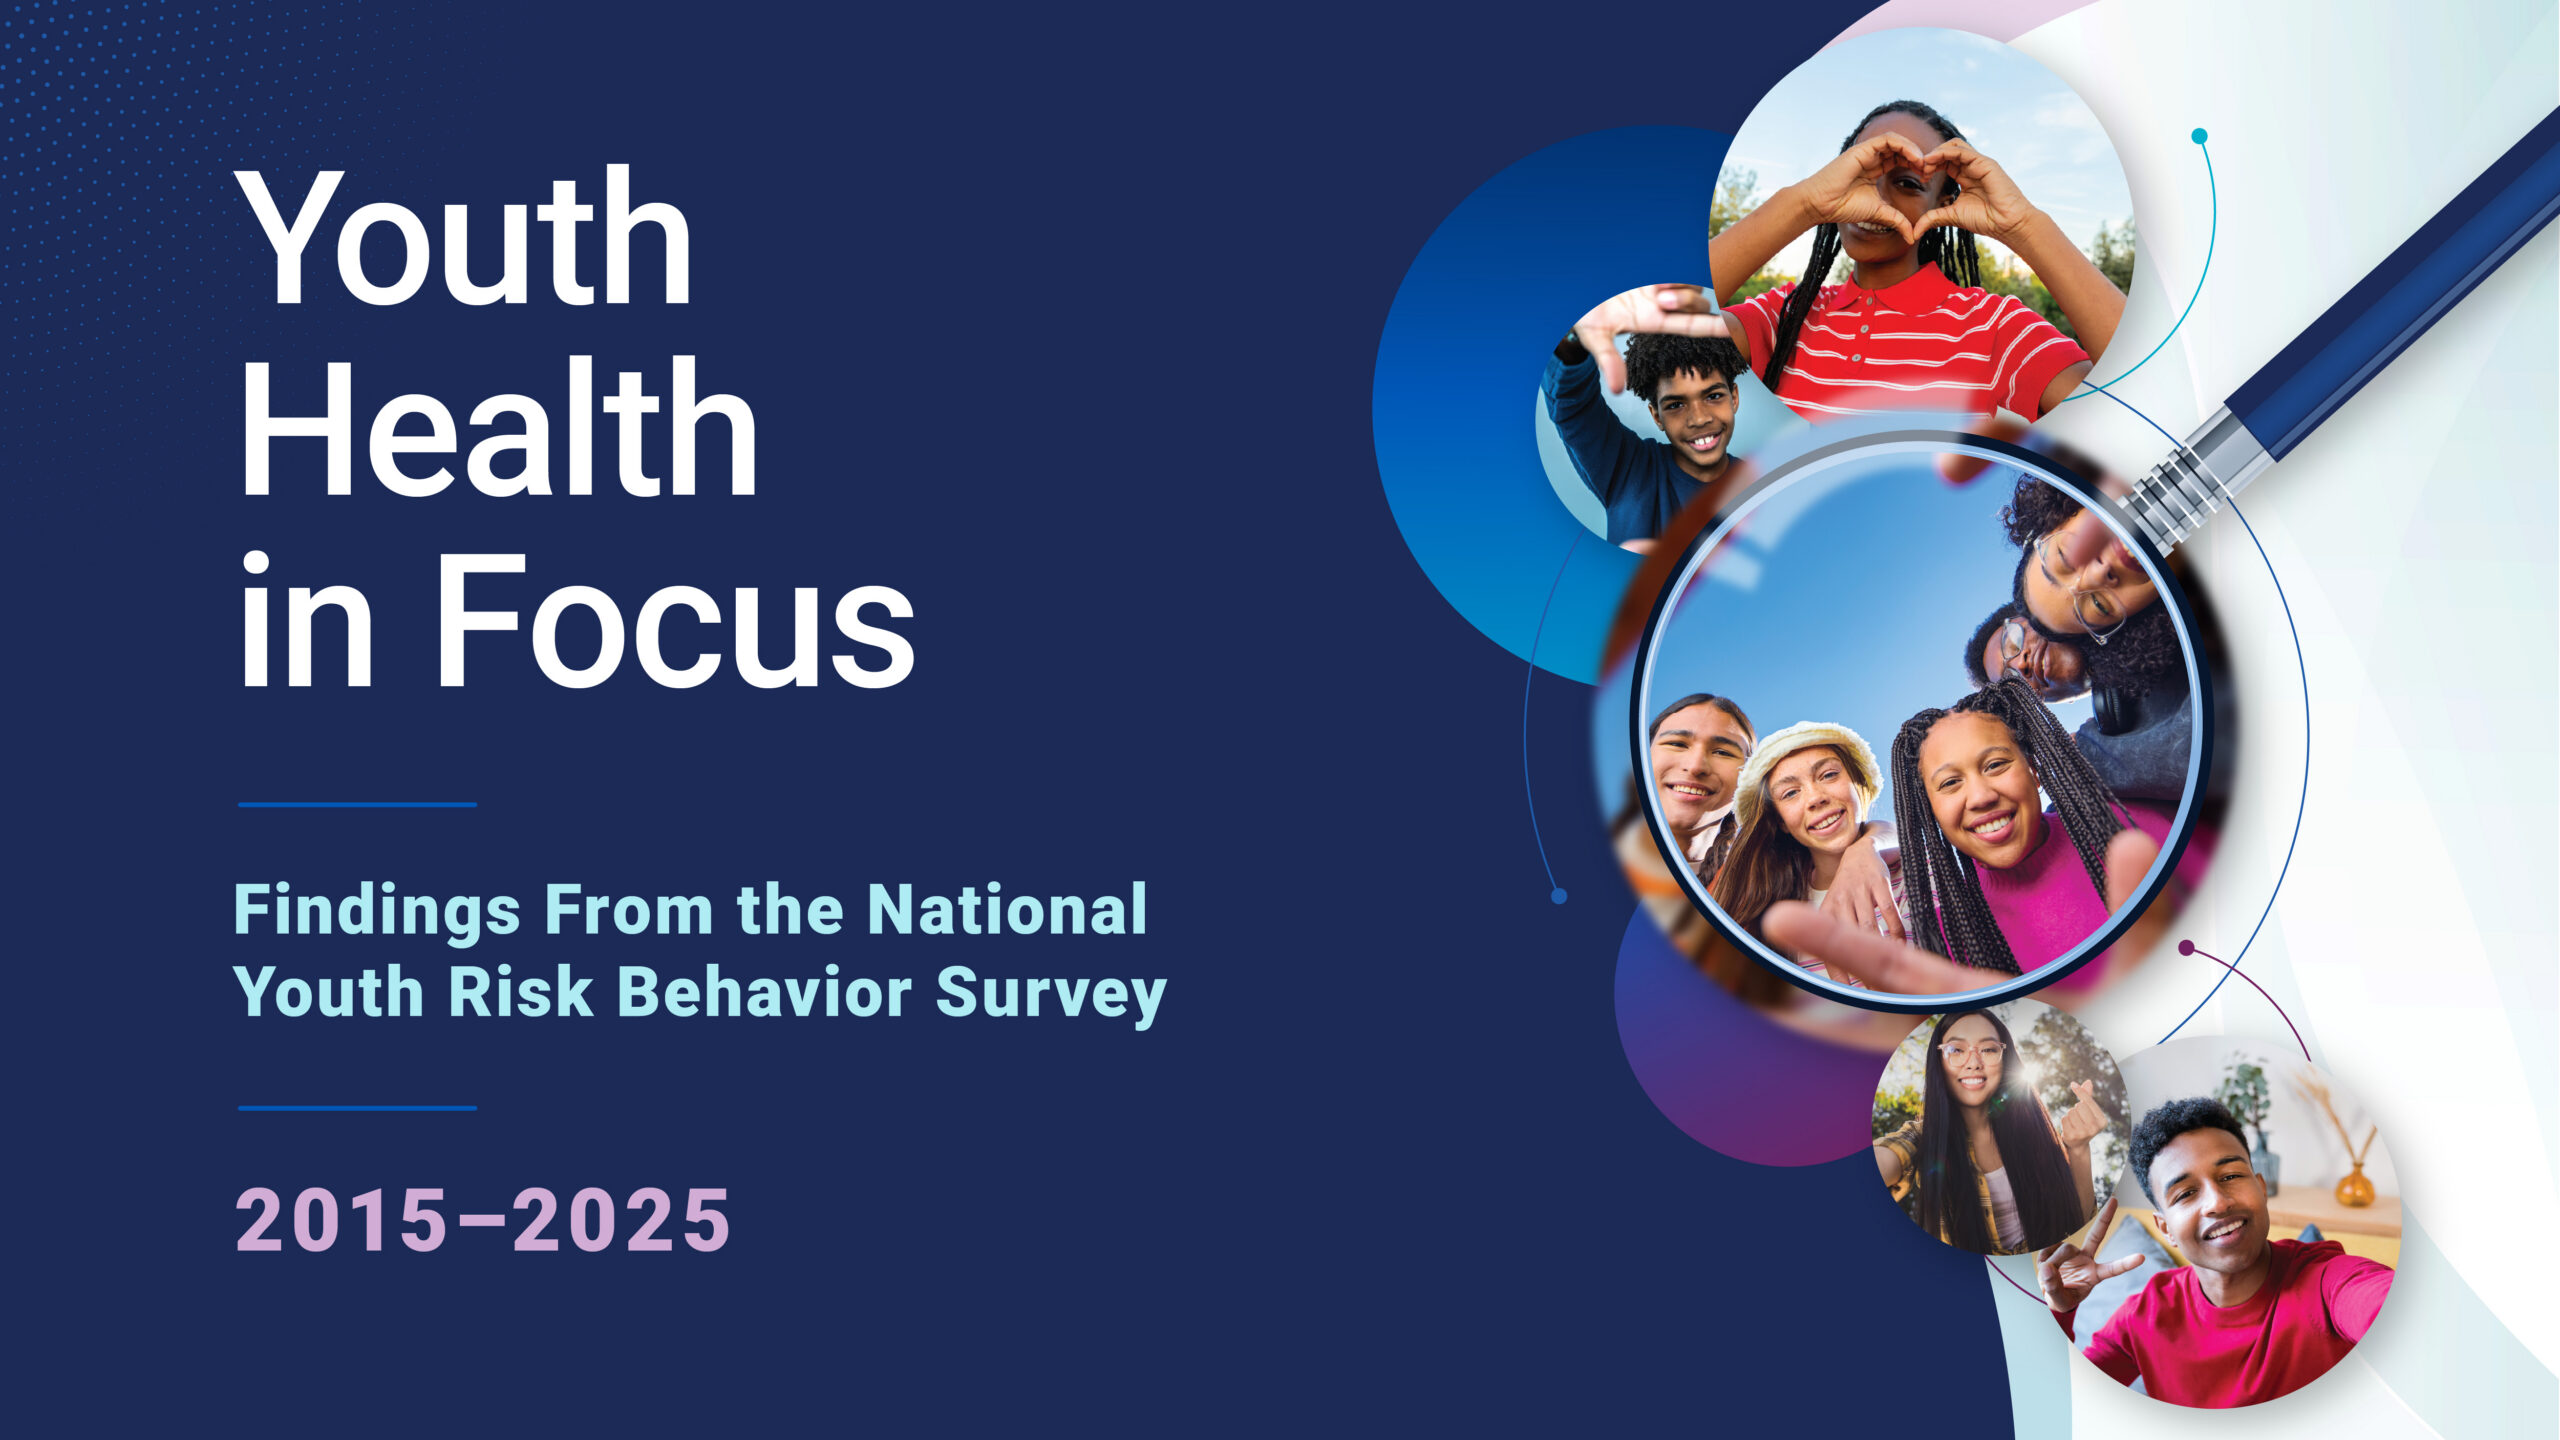
Youth Health in Focus Cover Image

Background

About the YRBS: Youth Health in Focus features data from the Centers for Disease Control and Prevention's (CDC) national Youth Risk Behavior Survey (YRBS). The YRBS is conducted every 2 years among a nationally representative sample of U.S. high school students.

35 Years of YRBS: For more than 35 years, CDC has collected YRBS data to help schools, families, communities, and public health leaders understand the challenges adolescents face and identify opportunities to support their health and well-being. The full set of YRBS findings is available on CDC's YRBS website.

This Report

Youth Health in Focus is geared toward federal, state, and local decision-makers and health and education practitioners. It provides information and stories from CDC-funded school districts about five focus areas that affect adolescent health today and into adulthood.

The five focus areas include:

This report presents all findings for 2-year changes and 10-year trends. For demographic differences, only select statistically significant differences are reported. More details about the results in this report are available in the Technical Notes and Data Tables.

Highlights

Inside this Youth Health in Focus report, you’ll see how student behaviors and experiences are changing over time. Here are some highlights:

Key 2-Year Changes, 2023–2025

  • More high school students ate fruits and vegetables daily.
  • More students drank plain water at least 3 times a day.
  • More students played on a sports team.
  • Fewer students had persistent feelings of sadness or hopelessness.
  • Fewer students reported poor mental health.
  • Fewer students seriously considered attempting suicide, made a suicide plan, or attempted suicide.

Key 10-Year Trends, 2015–2025

  • More students drank plain water at least 3 times a day.
  • Fewer students drank soda daily.
  • Fewer students drank sports drinks daily.
  • Fewer students reported being injured in a suicide attempt.

Key 2-Year Changes, 2023–2025

  • Fewer students attended physical education daily during an average school week.

Key 10-Year Trends, 2015–2025

  • Fewer students ate breakfast daily.
  • Fewer students were physically active for at least 60 minutes daily.
  • Fewer students strengthened muscles at least 3 days a week.
  • Fewer students met both the aerobic and muscle-strengthening guidelines.
  • Fewer students attended physical education daily.
  • Fewer students got at least 8 hours of sleep on an average school night.
  • More students had persistent feelings of sadness or hopelessness.

These findings make it clear that progress is possible. However, sustained, evidence-based strategies are needed to build on these gains, address areas of concern, and ensure that more adolescents have the support they need to be healthy, safe, and ready to learn.
Key Findings

Key findings for dietary behaviors.

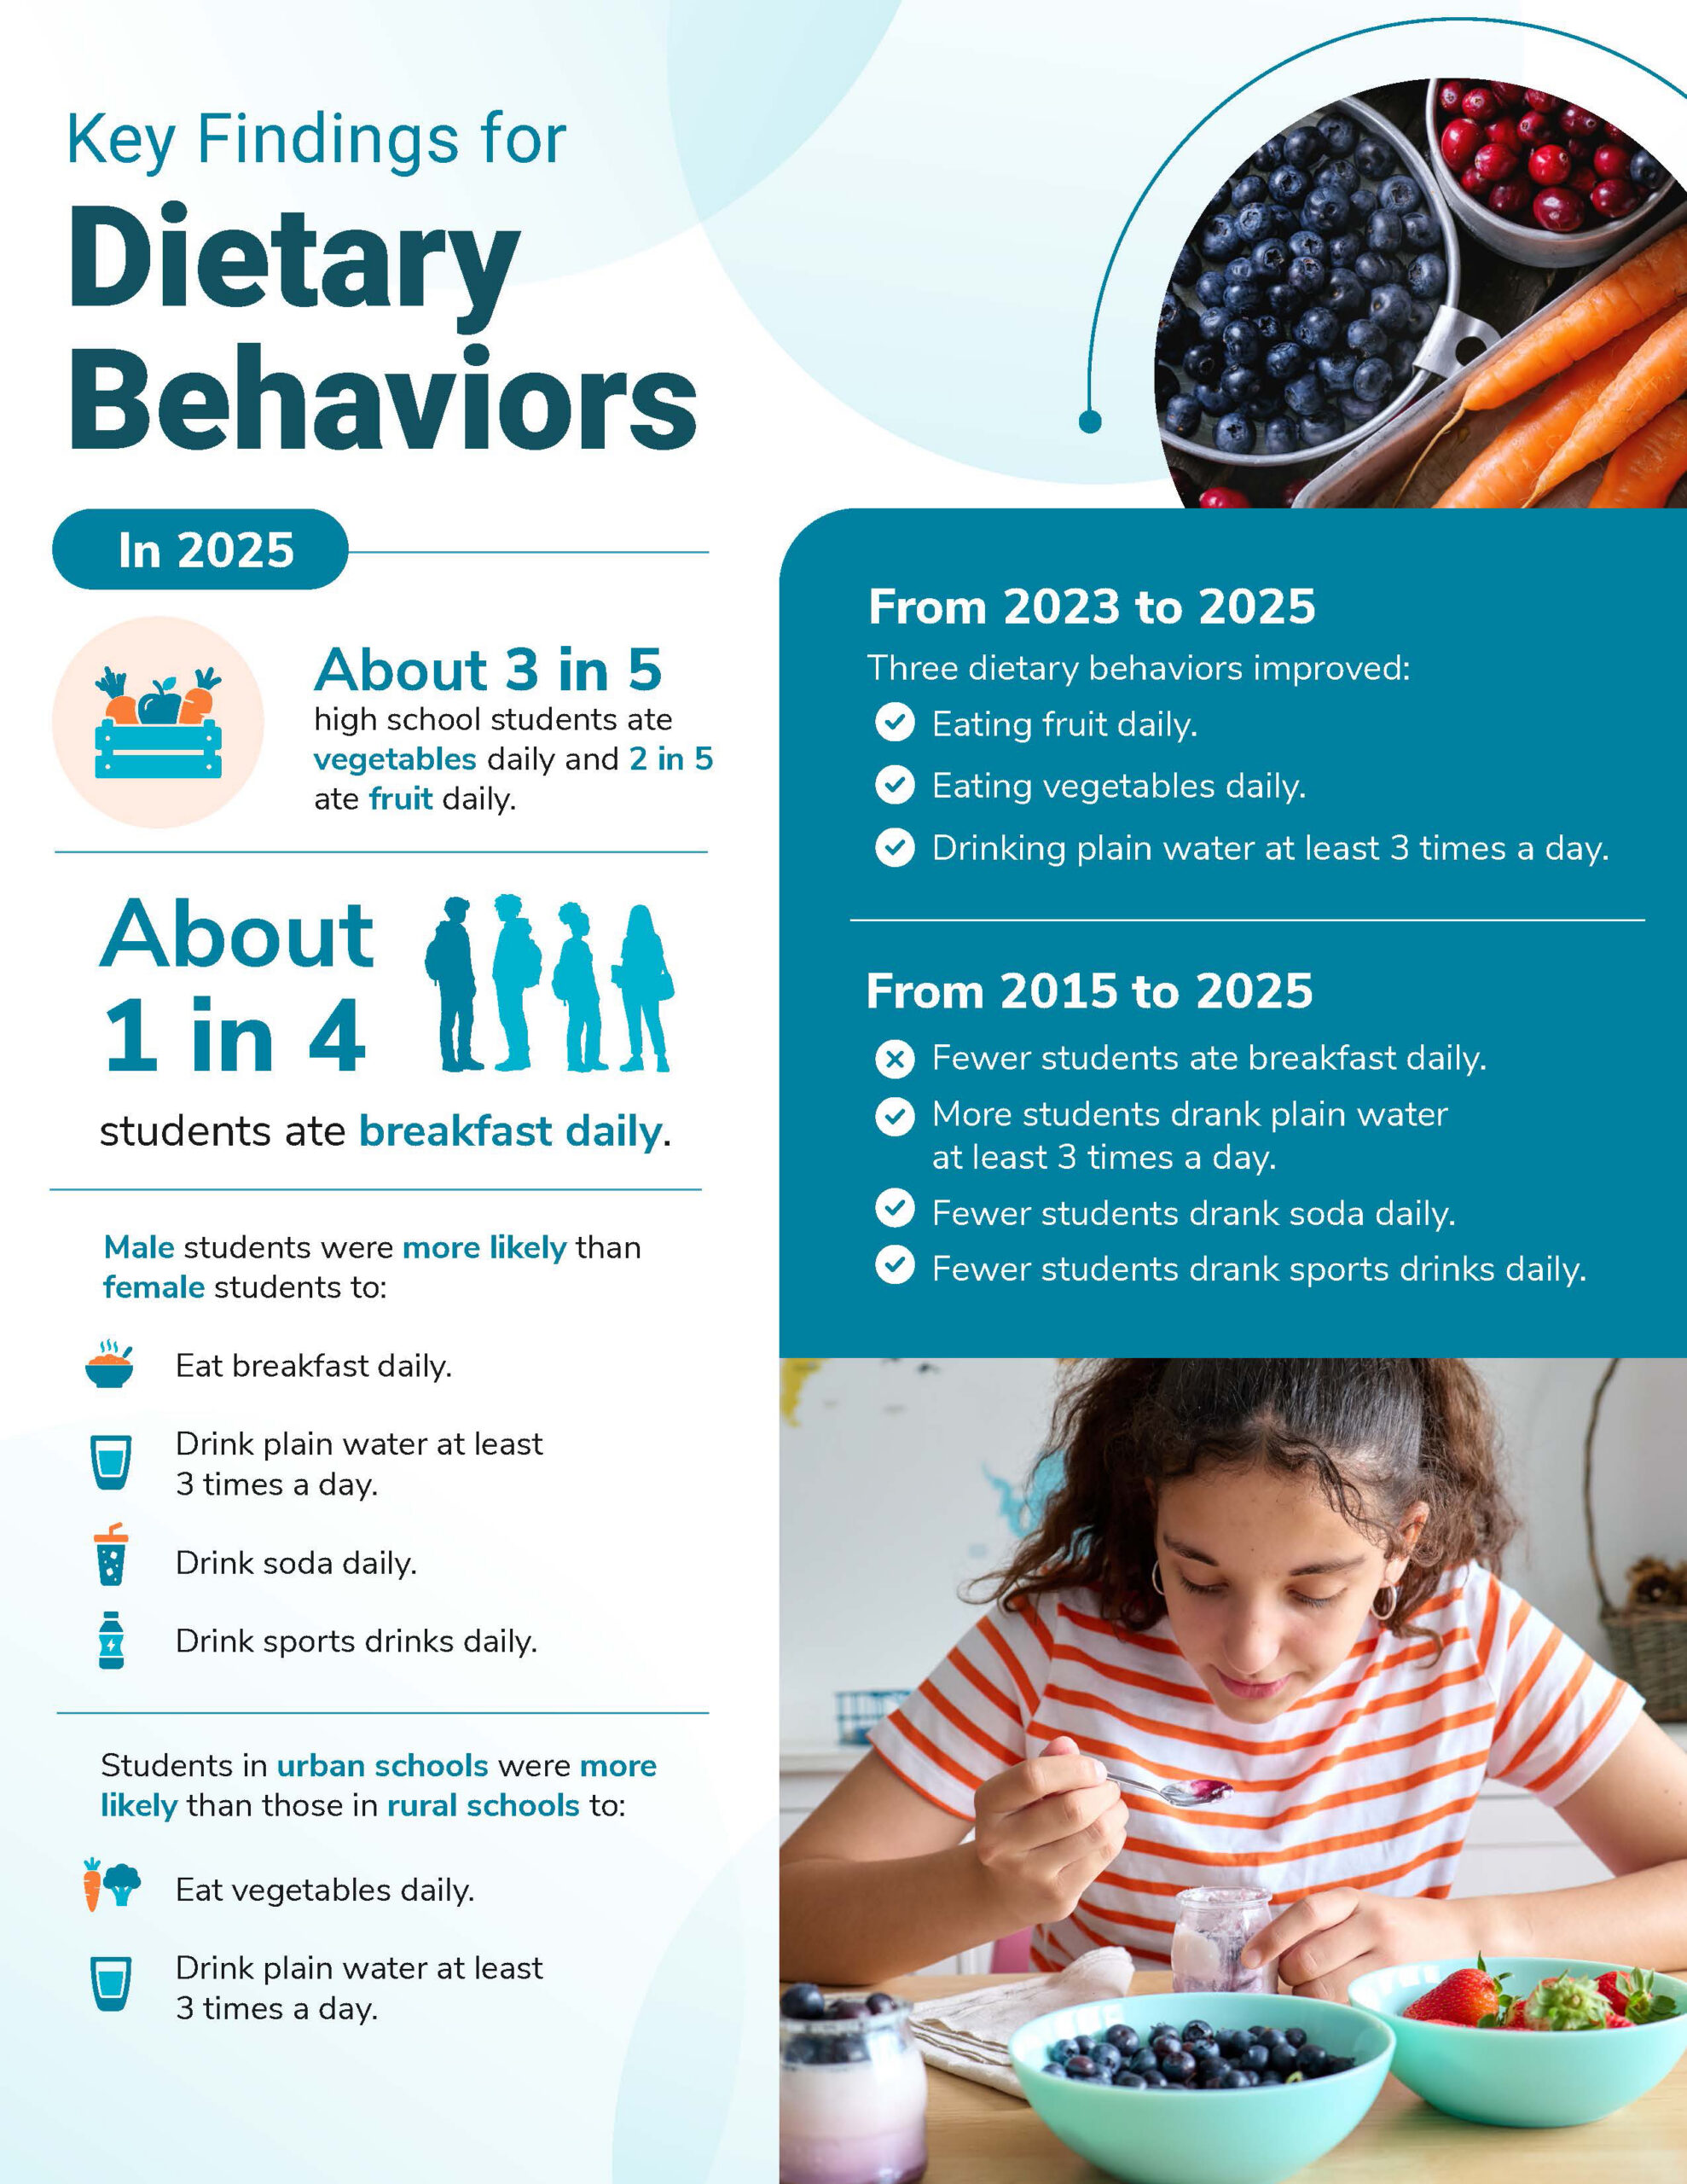
Infographic titled 'Key Findings for Dietary Behaviors.' In 2025, about 3 in 5 high school students ate vegetables daily and 2 in 5 ate fruit daily. About 1 in 4 students ate breakfast daily. Male students were more likely than female students to eat breakfast daily, drink plain water at least 3 times a day, drink soda daily, and drink sports drinks daily. Students in urban schools were more likely than those in rural schools to eat vegetables daily and drink plain water at least 3 times a day. From 2023 to 2025, three behaviors improved: eating fruit daily, eating vegetables daily, and drinking plain water at least 3 times a day. From 2015 to 2025: fewer students ate breakfast daily; more students drank plain water at least 3 times a day; fewer students drank soda daily; fewer students drank sports drinks daily. Includes photos of berries, carrots, and a girl eating a bowl of fruit and yogurt.

Key findings for physical activity behaviors.

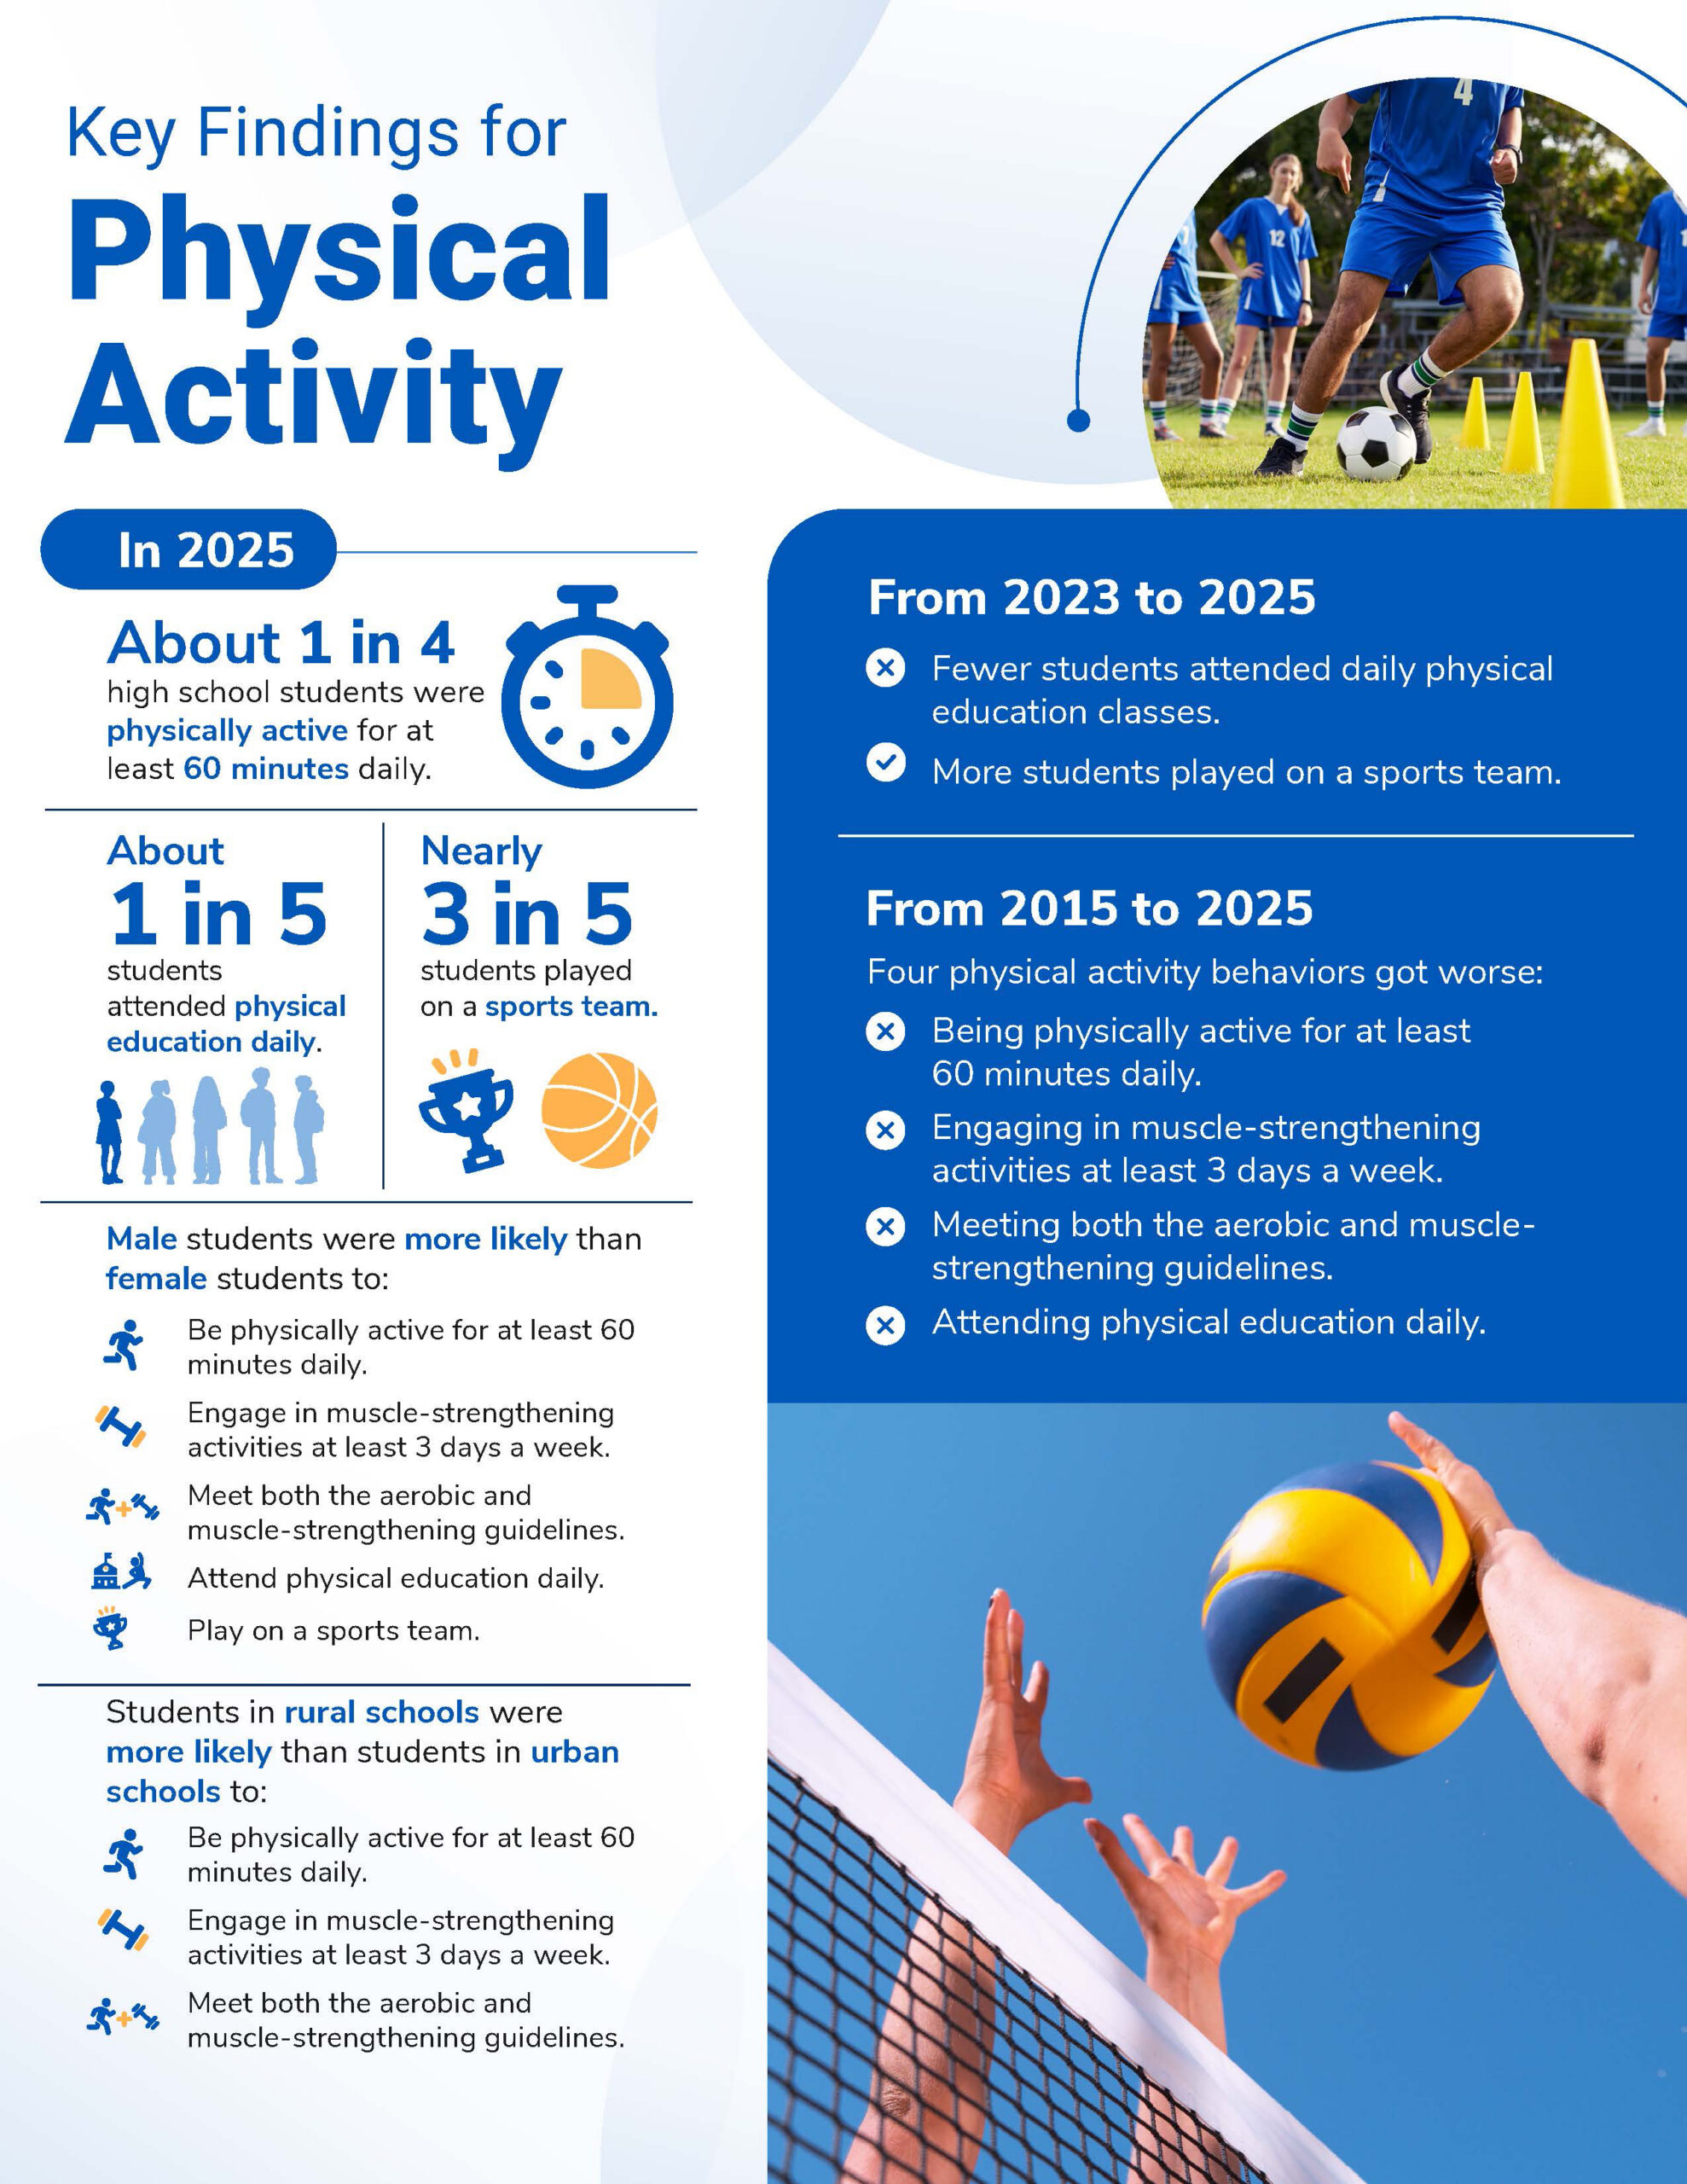
Infographic titled 'Key Findings for Physical Activity.' In 2025, about 1 in 4 high school students were physically active for at least 60 minutes daily. About 1 in 5 students attended physical education daily. Nearly 3 in 5 students played on a sports team. Male students were more likely than female students to be physically active for at least 60 minutes daily, engage in muscle-strengthening activities at least 3 days a week, meet both the aerobic and muscle-strengthening guidelines, attend physical education daily, and play on a sports team. Students in rural schools were more likely than students in urban schools to be physically active for at least 60 minutes daily, engage in muscle-strengthening activities, and meet both guidelines. From 2023 to 2025, fewer students attended daily physical education classes while more students played on a sports team. From 2015 to 2025, four behaviors got worse: being physically active for at least 60 minutes daily, engaging in muscle-strengthening activities, meeting both guidelines, and attending physical education daily. Includes photos of a youth soccer player and hands reaching for a volleyball at a net.

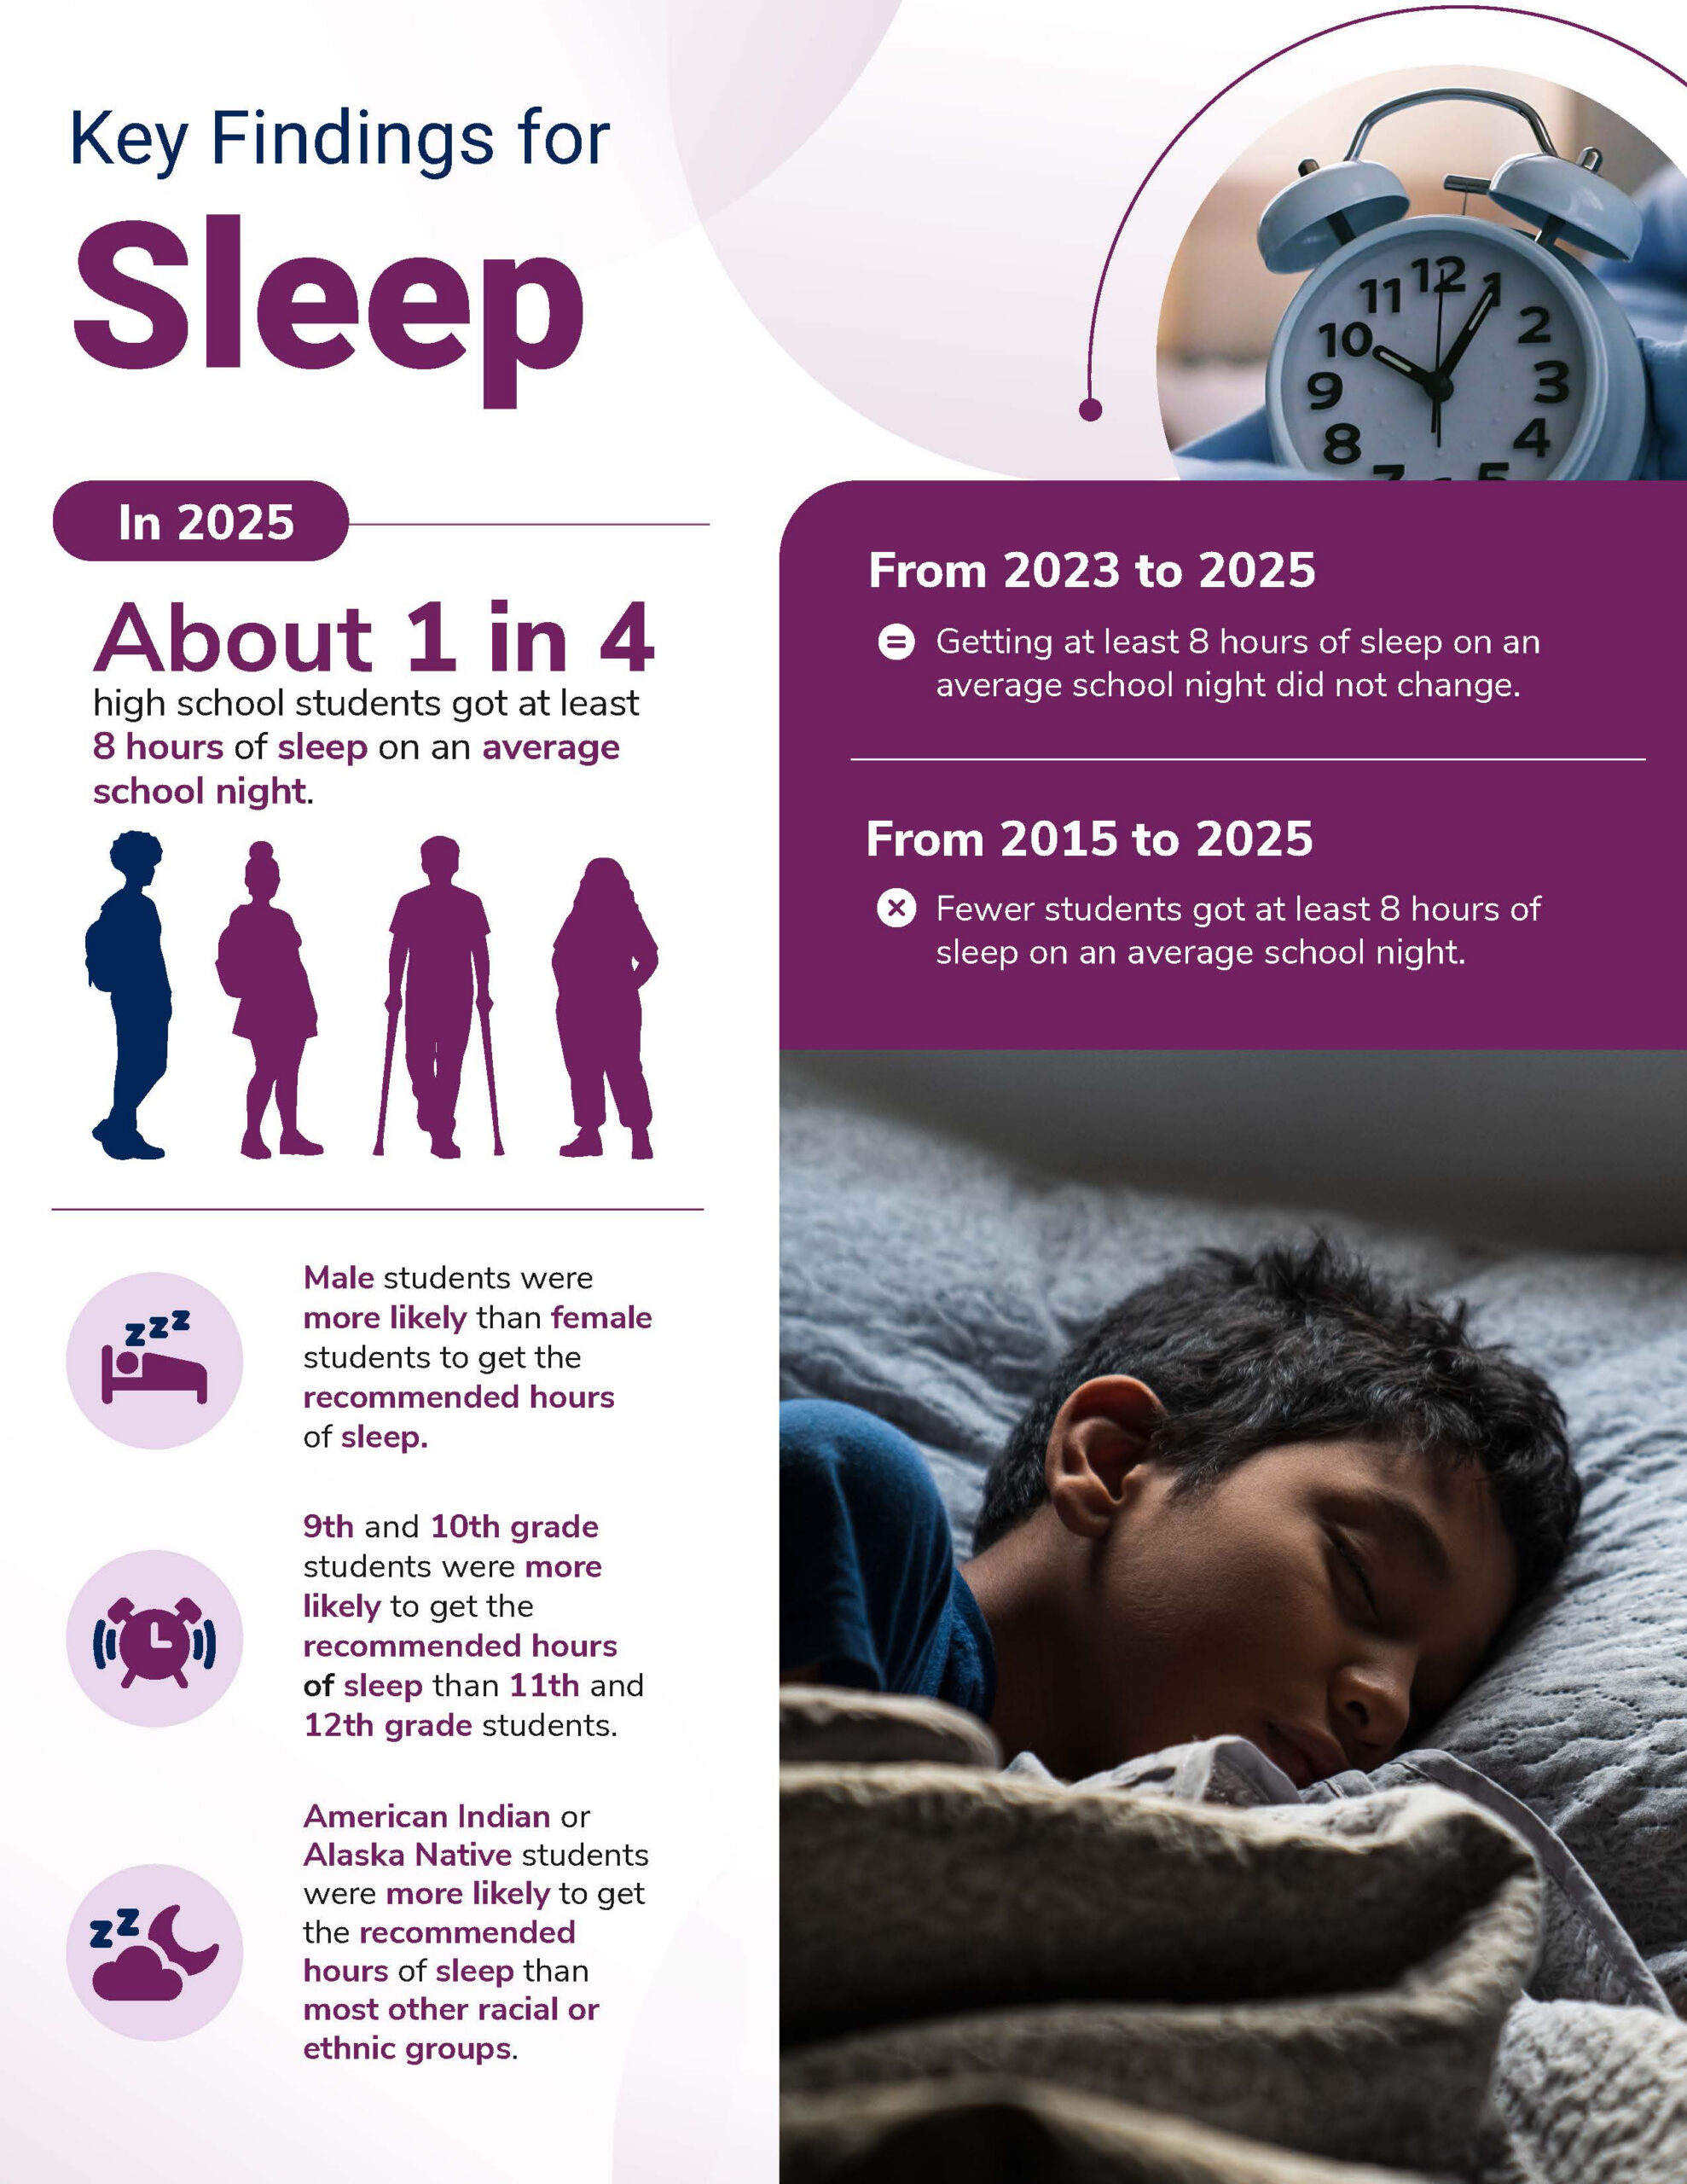
Key findings for high school students on getting sleep.

Infographic titled 'Key Findings for Sleep.' In 2025, about 1 in 4 high school students got at least 8 hours of sleep on an average school night. Male students were more likely than female students to get the recommended hours of sleep. 9th and 10th grade students were more likely than 11th and 12th grade students to get the recommended hours of sleep. American Indian or Alaska Native students were more likely to get the recommended hours of sleep than most other racial or ethnic groups. From 2023 to 2025, getting at least 8 hours of sleep on an average school night did not change. From 2015 to 2025, fewer students got at least 8 hours of sleep on an average school night. Includes a photo of an alarm clock and a photo of a boy sleeping in bed.

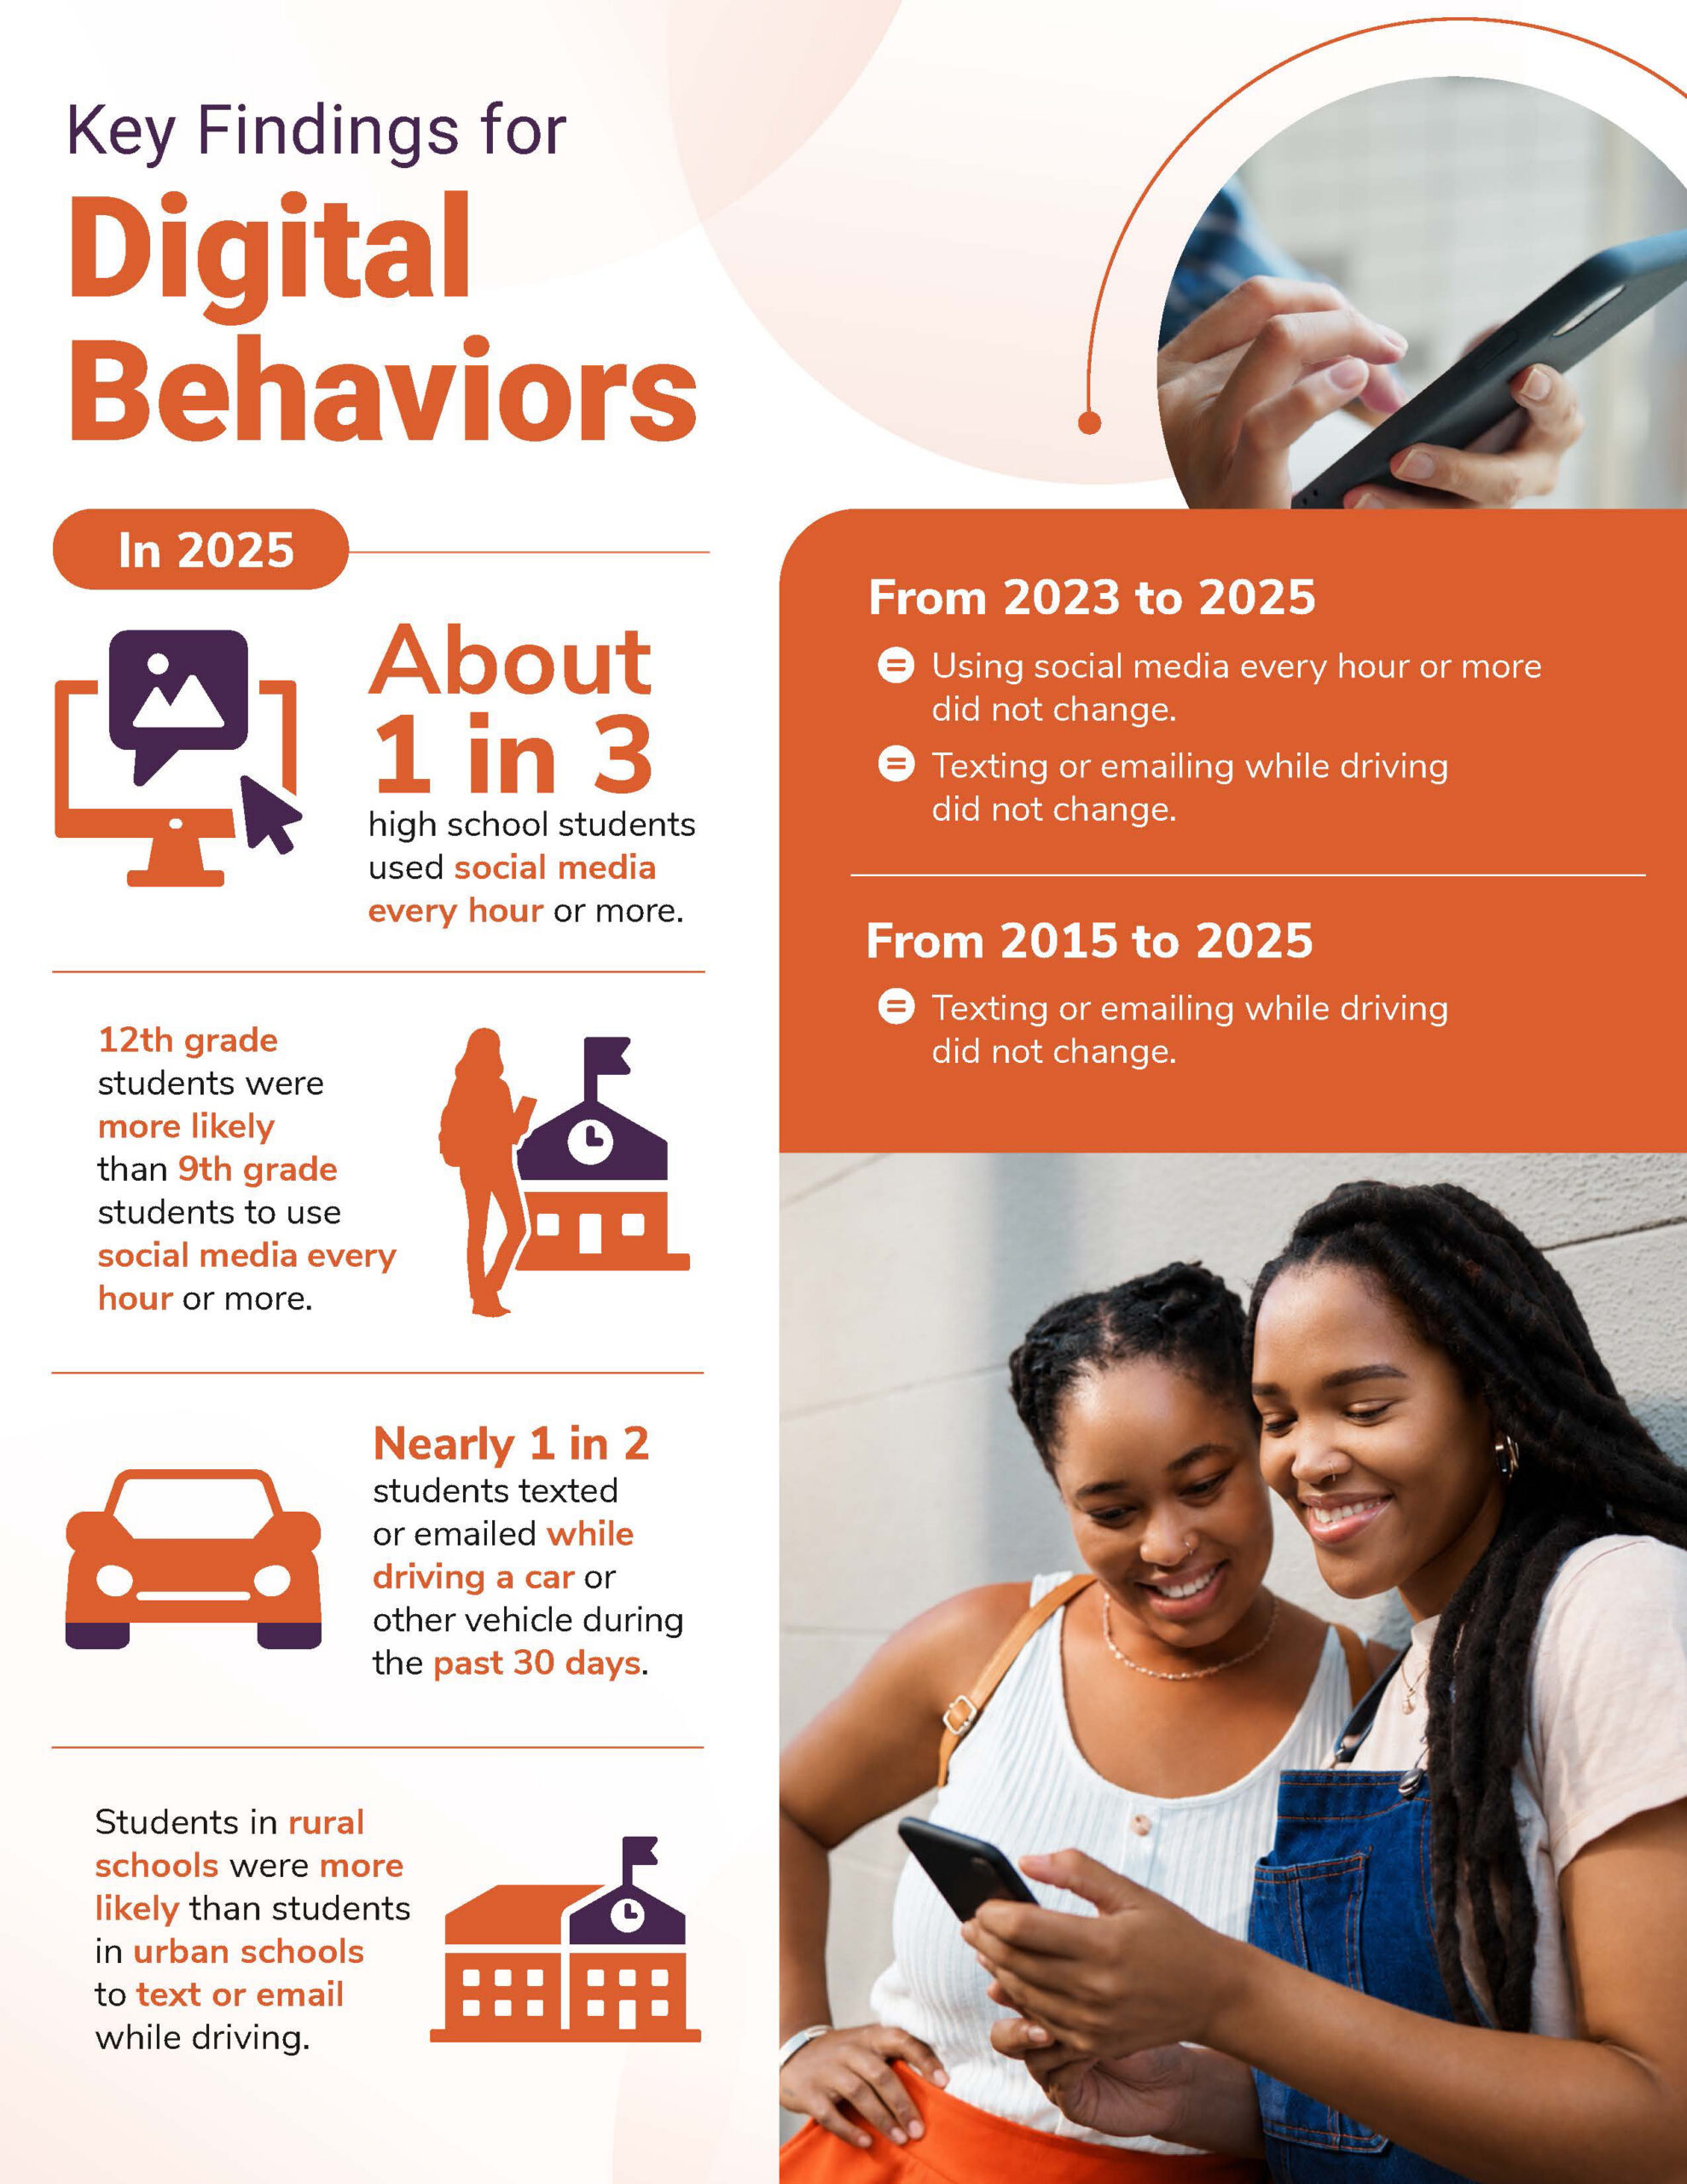
Key findings for digital behaviors.

Infographic titled 'Key Findings for Digital Behaviors.' In 2025, about 1 in 3 high school students used social media every hour or more. 12th grade students were more likely than 9th grade students to use social media every hour or more. Nearly 1 in 2 students texted or emailed while driving a car or other vehicle during the past 30 days. Students in rural schools were more likely than students in urban schools to text or email while driving. From 2023 to 2025, using social media every hour or more did not change, and texting or emailing while driving did not change. From 2015 to 2025, texting or emailing while driving did not change. Includes photos of a person holding a phone and two girls smiling while looking at a phone together.

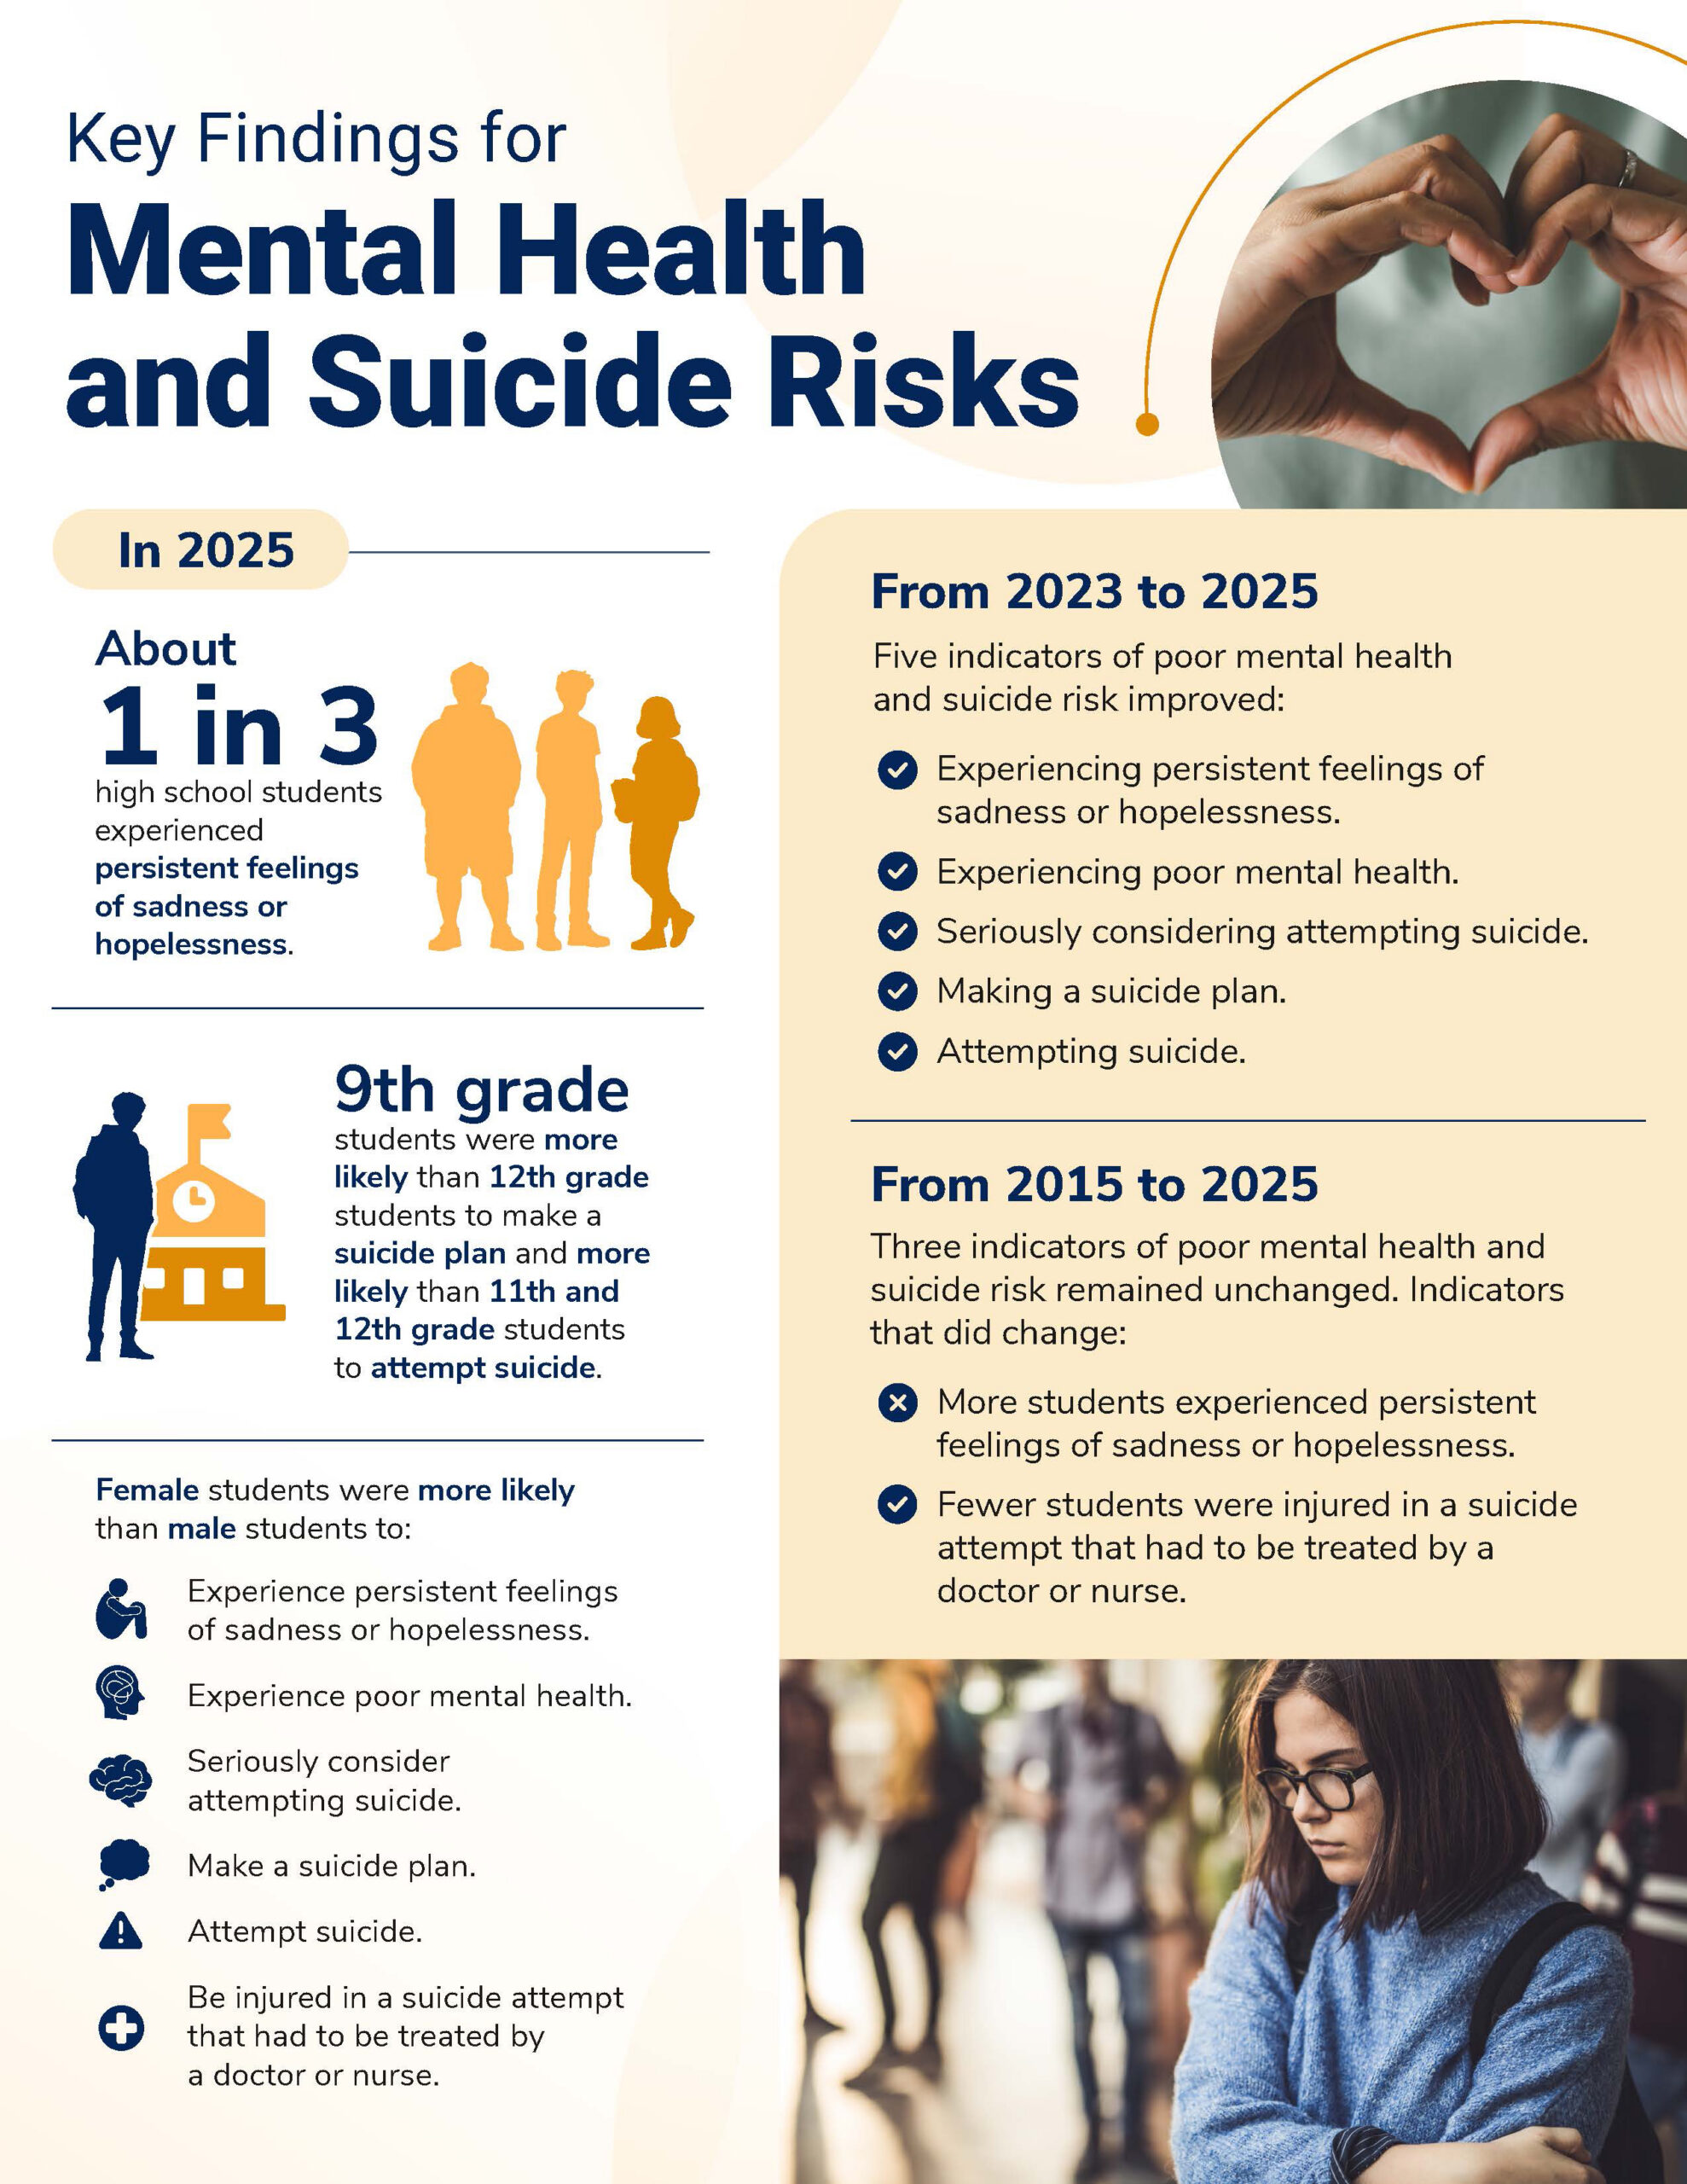
Key findings for mental health and suicide risks.

Infographic titled 'Key Findings for Mental Health and Suicide Risks.' In 2025, about 1 in 3 high school students experienced persistent feelings of sadness or hopelessness. 9th grade students were more likely than 12th grade students to make a suicide plan, and more likely than 11th and 12th grade students to attempt suicide. Female students were more likely than male students to experience persistent feelings of sadness or hopelessness, experience poor mental health, seriously consider attempting suicide, make a suicide plan, attempt suicide, and be injured in a suicide attempt requiring treatment. From 2023 to 2025, five indicators improved: persistent feelings of sadness or hopelessness, poor mental health, seriously considering attempting suicide, making a suicide plan, and attempting suicide. From 2015 to 2025, three indicators remained unchanged; more students experienced persistent feelings of sadness or hopelessness, while fewer students were injured in a suicide attempt requiring treatment. Includes a photo of hands forming a heart shape.

Content Source
Adolescent and School Health; National Center for Chronic Disease Prevention and Health Promotion
About This Page
Published:
Updated: August 14, 2026

This page was last updated on this date. Updates may include minor edits, image changes, or other modifications to page content.

Reviewed: August 14, 2026

The information on this page was last reviewed by subject matter experts to ensure accuracy.