What to know
- The data below come from CDC's State Unintentional Drug Overdose Reporting System (SUDORS).
- SUDORS collects data on unintentional and undetermined intent drug overdose deaths from death certificates, medical examiner or coroner reports, and postmortem toxicology results.
- States and local jurisdictions are increasingly better informed by systems like SUDORS, which presents comprehensive information on the characteristics and circumstances surrounding drug overdose deaths to inform prevention and response efforts.
About this dashboard
On this dashboard you can:
- View final SUDORS data by year and over time for available jurisdictions. Datasets are available for download with counts, percentages, rates (per 100,000 persons), and relative and absolute changes. Final data represent data that have undergone full quality control. See the Important Data Considerations section on the final data page for jurisdiction inclusion criteria and other important information about SUDORS data.
- View preliminary SUDORS data counts and percentage estimates for the most recent SUDORS reporting periods. Preliminary data represent more recent periods of data that have not yet completed quality control. See the Important Data Considerations section on the preliminary data page for a description of preliminary data and other important information about SUDORS data.
- View the accessible version of this dashboard. This is a text-based version that is compatible with screen reads. It can be accessed by clicking "View accessible version" in the blue navigation panel.
When visiting for the first time, the dashboard defaults to the final data page. In the blue navigation panel, select "Preliminary Data" in the "View" section to switch to the preliminary version of the dashboard. While on the preliminary data page, select "Final Data" to switch back to the final data page.
At the top of the dashboard, the blue navigation panel allows selections for data type, year(s), jurisdiction, and section. Selections made within this box filter the entire dashboard.
View: Select "Final data" to navigate to the final data page.
Data type: Select "Annual" to view single-year data overall or by jurisdiction. Select "Trend (multi-year)" to view data over time overall or by jurisdiction.
Year(s): When “Annual” is selected, choose a single year from a drop-down list of options to view data for that year. When “Trend (multi-year)” is selected, choose a starting year from the drop-down list to view data for a range of time. The most recent year of data available will remain the default end year for the trend view.
Jurisdiction: Select a single jurisdiction or “Overall” (all available jurisdictions combined) from the drop-down list of options to filter the entire dashboard to that jurisdiction. Included jurisdictions may differ based on year(s) selected. Please see Important Data Considerations for jurisdiction inclusion criteria. Other ways to filter the dashboard to a jurisdiction include:
- Annual data: Click on a specific jurisdiction's bar on the rate graph in the Drugs Involved section, or click on a specific jurisdiction on the map in the Drugs of Interest Detected section. To clear your selection and reset the view to Overall data, click the bar or jurisdiction again or click outside the map.
- Trend data: Click on a specific jurisdiction in the map views of the Drugs Involved and the Drugs of Interest Detected sections. To clear your selection and reset the view to Overall data, click the jurisdiction again or click outside the maps. Please note, when map view is selected, the jurisdiction drop-down in the blue navigation panel is disabled. To enable the drop-down menu, toggle off the map view.
View data for: Select from a drop-down list of options to view different charts focused on specific topic areas. The annual and trend data views have six sections:
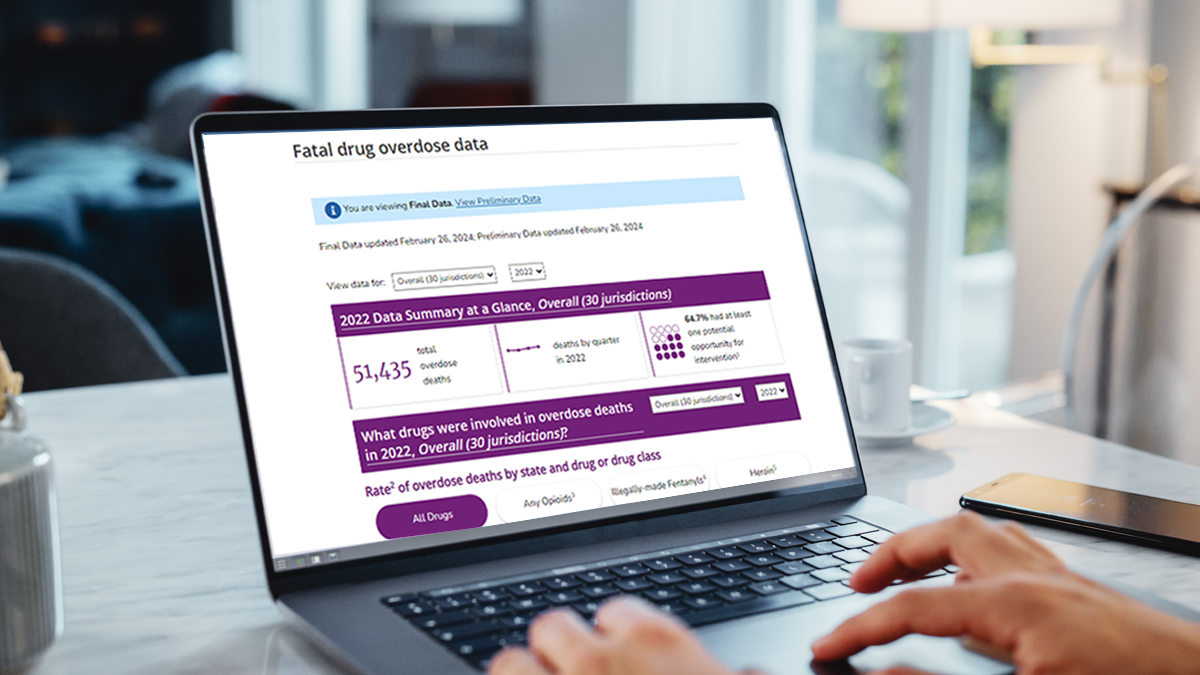
- Data Summary at a Glance
- Drugs Involved
- Drugs Involved: Combinations
- Drugs of Interest Detected (for eligible jurisdictions; see Important Data Considerations)
- Demographics
- Circumstances
Metric selection: Use the radio buttons to select a metric to change the corresponding chart or map. Available metrics differ between sections and can include the number, rate, or percent. Metric selections remain when toggling between chart types or selections (e.g., drugs) within a section.
Map/chart toggle (trend view): Map/chart toggles are available for the following sections:
- Drugs Involved (Number): Line chart and bar chart (quarterly data)
- Drugs Involved (Rate and Percent): Line chart and map
- Drugs of Interest Detected (Number and Percent): Map and bar chart
Use the toggle to the right of the metric selection box to change between line and bar chart or map views in the Drugs Involved section and between map and bar chart views in the Drugs of Interest Detected section. Map views are not available for the following sections: Drugs Involved: Combinations, Demographics, and Circumstances. Map views may include additional jurisdictions not shown on chart views; as such, the jurisdiction drop-down menu in the blue navigation panel is disabled when map view is shown (see Important Data Considerations for more information). Change the jurisdiction by clicking a jurisdiction on the map or toggling back to chart view to enable the blue navigation panel drop-down menu.
Statistics options (trend view): Pre-calculated statistics are available to help interpret trends. For line charts, click a line or label on the chart to view the change in number, rate, or percentage over the range of years selected in the navigation panel. This will also grey out other lines in the chart. Click the line or label again or click off the line to remove the statistic and restore other lines to their default, or click another line or label to change the statistic. For maps, click on a jurisdiction to view the change in number, rate, or percentage for that jurisdiction. Click the jurisdiction again, or click outside the map, to change back to an overall statistic across included jurisdictions. On the Drugs of Interest Detected bar charts, statistics will be displayed by default. Selections will remain when switching between metrics or toggling between line and bar charts or map view within a section. In the Circumstances section, click on a specific circumstance's box to view the statistic. Click the box again or click off the box to remove the statistic, or click another box to change the statistic. See Important Data Considerations for further information on these statistics.
Drug selection
- Annual view
- Drugs Involved: Click on the drop-down menu to select a drug or drug class and to change the charts to show the number or rate of overdose deaths that involved the selected drug or drug class.
- Drugs Involved: Combinations: Use the "Choose drug to view" drop-down menu to select a drug or drug class to view overdose deaths involving the selected drug/drug class alone or in combination with other drugs. Use the "Choose how to view" box to select percentages among all overdose deaths or among overdose deaths involving the selected drug/drug class only.
- Drugs of Interest Detected: Click on the drop-down menu to select a drug to change the maps to show the number or percentage of overdose deaths with the selected drug detected.
- Trend view
- Drugs involved (line charts): Use the interactive legend to select or deselect drugs to show or hide the corresponding lines on the chart. At the bottom of the legend, click "Show all selections" to quickly restore all lines on the line chart, or click "Clear all selections" to remove all lines from the chart.
- Drugs Involved and Drugs of Interest Detected (maps and bar charts): Click on the drop-down menu to select a drug or drug class to change the maps.
- If there are different metrics and chart types, drug selections will remain when switching between them.
Demographics selection (trend view): In the Demographics section, select demographic characteristics from the drop-down list to see the number, rate, and percentage of overdoses by sex, race/ethnicity, age, and age by sex.
Circumstance selection: Select a grouping of circumstances from the drop-down list to show percentages of deaths with select circumstances within the grouping.
Preliminary data are updated twice a year. Once all data for a given year are finalized, the preliminary data for that year will no longer be available. On the preliminary dashboard page, only overall data are available for the most recent reporting period of January–June of a calendar year or for the full calendar year. Individual jurisdictions cannot be selected for preliminary data. Hover over each data point to view the 95% confidence interval for the percentage.
Suggested citations
Suggested citation for final data:
Centers for Disease Control and Prevention. State Unintentional Drug Overdose Reporting System (SUDORS). Final Data. Atlanta, GA: US Department of Health and Human Services, CDC; [INSERT YEAR, MONTH, DAY]. Access at: https://www.cdc.gov/overdose-prevention/data-research/facts-stats/sudors-dashboard-fatal-overdose-data.html
Suggested citation for preliminary data:
Centers for Disease Control and Prevention. State Unintentional Drug Overdose Reporting System (SUDORS). Preliminary Data. Atlanta, GA: US Department of Health and Human Services, CDC; [INSERT YEAR, MONTH, DAY]. Access at: https://www.cdc.gov/overdose-prevention/data-research/facts-stats/sudors-dashboard-fatal-overdose-data.html
Related resources
- About CDC's State Unintentional Drug Overdose Reporting System (SUDORS)
- SUDORS Fact Sheet
- SUDORS Coding Manual
- Nonfatal Overdoses: CDC's Drug Overdose Surveillance and Epidemiology (DOSE) System
- DOSE Dashboard: Nonfatal Overdose Syndromic Surveillance Data
- DOSE Dashboard: Nonfatal Overdose Discharge Data
- Fentalog Study Dashboard: Nonfatal Opioid Overdoses with Toxicology Testing
- MMWR Articles
- Journal Articles