Co-involvement of Opioids in Drug Overdose Deaths Involving Cocaine and Psychostimulants, 2011–2021
- Key findings
- For 2011–2021, the rate of drug overdose deaths involving both cocaine and opioids increased more quickly than the rate of overdose deaths involving cocaine without opioids.
- In 2021, the percentage of drug overdose deaths involving cocaine and opioids varied by region.
- Since 2017, the rate of overdose deaths involving psychostimulants with opioid co-involvement surpassed the rate of overdose deaths involving psychostimulants without opioids for each year.
- In 2021, the percentage of overdose deaths that involved a psychostimulant varied by region.
- Summary
Data from the National Vital Statistics System
- From 2011 through 2021, the age-adjusted rate of overdose deaths involving both cocaine and opioids increased more quickly than the rate of overdose deaths involving cocaine alone.
- In 2021, 78.6% of overdose deaths involving cocaine also involved an opioid, with the percentage varying by Census region, from 73.4% in the West to 84.5% in the Northeast.
- From 2011 through 2016, the rates of overdose deaths involving psychostimulants without opioid involvement were higher than those involving both drugs, but from 2017 through 2021, rates involving both psychostimulants and opioids were higher.
- In 2021, 65.7% of overdose deaths involving psychostimulants also involved an opioid, with the percentage varying by region, from 57.5% in the West to 80.6% in the Northeast.
Drug overdose deaths involving cocaine and psychostimulants with abuse potential (that is, drugs such as methamphetamine, amphetamine, and methylphenidate) have risen in the past several years (1–4). A recent report highlighted that drug overdose deaths involving cocaine rose 22% and drug overdose deaths involving psychostimulants rose 33% from 2020 through 2021 (1). By the end of 2021, the report counted 24,486 drug overdose deaths involving cocaine and 32,537 drug overdose deaths involving psychostimulants (1,5). This report presents trends from 2011 through 2021 in death rates involving cocaine and psychostimulants, with and without opioid co-involvement, and by U.S. Census region in 2021.
Keywords: methamphetamine, co-occurrence, poisoning, National Vital Statistics System
For 2011–2021, the rate of drug overdose deaths involving both cocaine and opioids increased more quickly than the rate of overdose deaths involving cocaine without opioids.
- The age-adjusted rate of drug overdose deaths involving cocaine nearly quintupled, from 1.5 deaths per 100,000 standard population in 2011 to 7.3 in 2021 (Figure 1).
- The rate of drug overdose deaths involving both cocaine and opioids in 2021 (5.9) was 7.4 times the rate in 2011 (0.8).
- The rate involving cocaine without opioid co-involvement in 2021 (1.5) was 2.1 times the rate in 2011 (0.7).
Figure 1. Age-adjusted rate of drug overdose deaths involving cocaine, by co-involvement of opioids: United States, 2011–2021
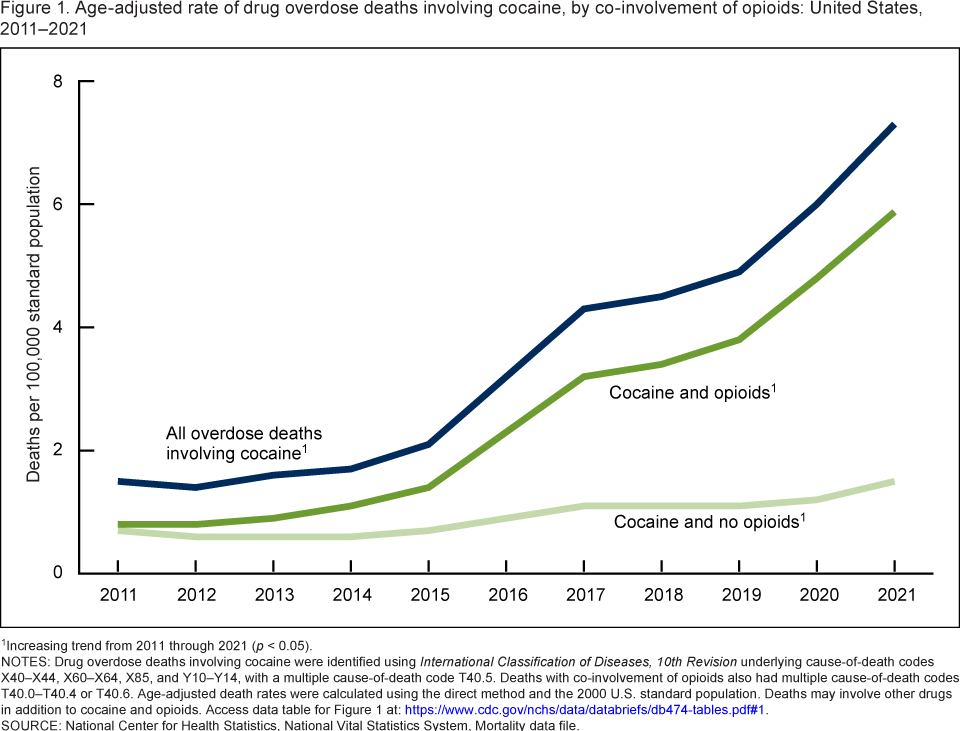
1Increasing trend from 2011 through 2021 (p < 0.05).
NOTES: Drug overdose deaths involving cocaine were identified using International Classification of Diseases, 10th Revision underlying cause-of-death codes X40–X44, X60–X64, X85, and Y10–Y14, with a multiple cause-of-death code T40.5. Deaths with co-involvement of opioids also had multiple cause-of-death codes T40.0–T40.4 or T40.6. Age-adjusted death rates were calculated using the direct method and the 2000 U.S. standard population. Deaths may involve other drugs in addition to cocaine and opioids. Access data table for Figure 1.
SOURCE: National Center for Health Statistics, National Vital Statistics System, Mortality data file.
In 2021, the percentage of drug overdose deaths involving cocaine and opioids varied by region.
- In 2021, 78.6% of drug overdose deaths involving cocaine also involved an opioid (Figure 2).
- The percentage of drug overdose deaths involving cocaine that also involved an opioid varied by region, with 73.4% in the West, 75.1% in the South, 79.6% in the Midwest, and 84.5% in the Northeast.
Figure 2. Percentage of drug overdose deaths involving cocaine with co-involvement of opioids, by Census region: United States, 2021
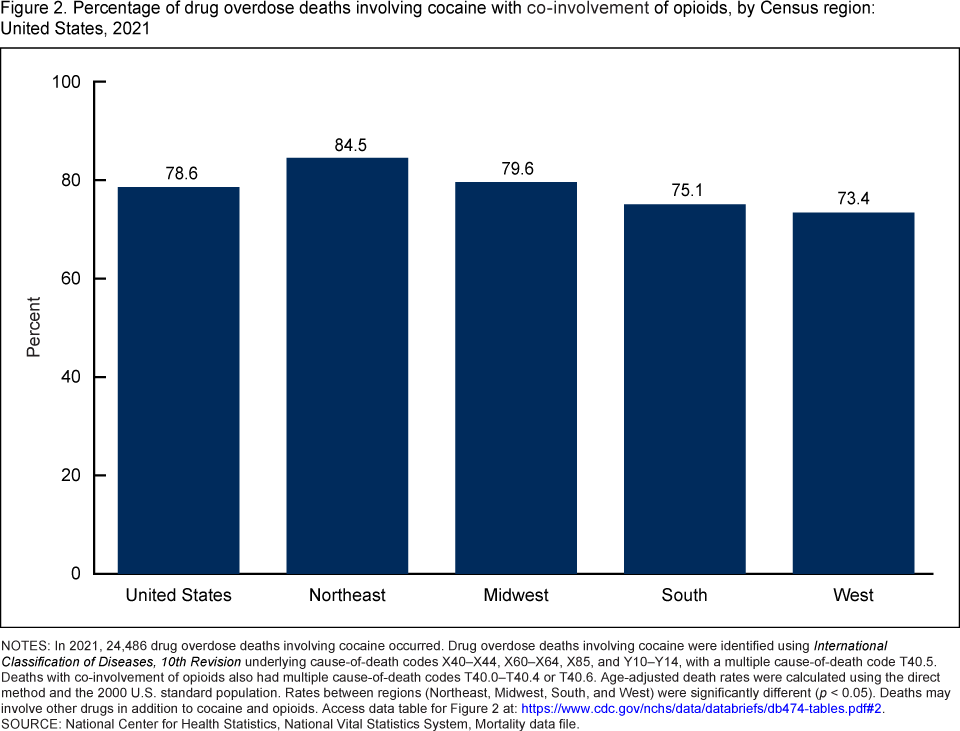
NOTES: In 2021, 24,486 drug overdose deaths involving cocaine occurred. Drug overdose deaths involving cocaine were identified using International Classification of Diseases, 10th Revision underlying cause-of-death codes X40–X44, X60–X64, X85, and Y10–Y14, with a multiple cause-of-death code T40.5. Deaths with co-involvement of opioids also had multiple cause-of-death codes T40.0–T40.4 or T40.6. Age-adjusted death rates were calculated using the direct method and the 2000 U.S. standard population. Rates between regions (Northeast, Midwest, South, and West) were significantly different (p < 0.05). Deaths may involve other drugs in addition to cocaine and opioids. Access data table for Figure 2.
SOURCE: National Center for Health Statistics, National Vital Statistics System, Mortality data file.
Since 2017, the rate of overdose deaths involving psychostimulants with opioid co-involvement surpassed the rate of overdose deaths involving psychostimulants without opioids for each year.
- The age-adjusted rate of drug overdose deaths involving psychostimulants increased 14.3 times from 0.7 deaths per 100,000 standard population in 2011 to 10.0 in 2021, and the rate increased 33.3% from 7.5 in 2020 to 2021 (Figure 3).
- The rate of drug overdose deaths involving both psychostimulants and opioids increased from 0.3 in 2011 to 6.7 in 2021.
- The rate of overdose deaths involving psychostimulants without opioid involvement increased from 0.5 in 2011 to 3.3 in 2021.
- From 2011 through 2016, the rate of overdose deaths involving psychostimulants without opioids was higher than the rate of drug overdose deaths involving both psychostimulants and opioids; this pattern reversed from 2017 through 2021, with higher rates of drug overdose deaths involving both psychostimulants and opioids.
Figure 3. Age-adjusted rate of drug overdose deaths involving psychostimulants, by co-involvement of opioids: United States, 2011–2021
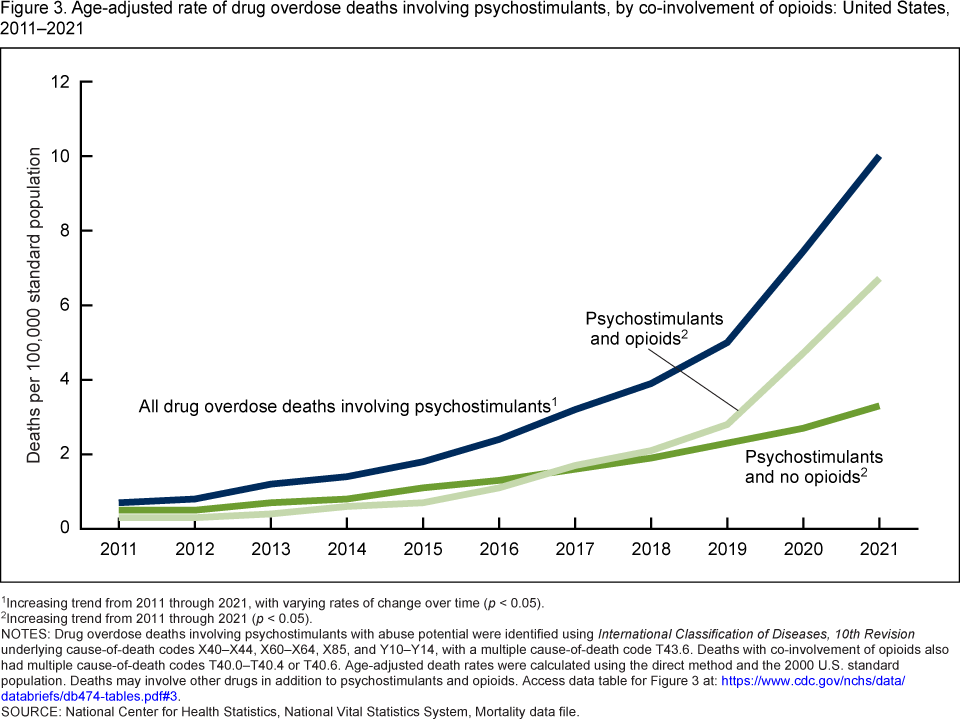
1Increasing trend from 2011 through 2021, with varying rates of change over time (p < 0.05).
2Increasing trend from 2011 through 2021 (p < 0.05).
NOTES: Drug overdose deaths involving psychostimulants with abuse potential were identified using International Classification of Diseases, 10th Revision underlying cause-of-death codes X40–X44, X60–X64, X85, and Y10–Y14, with a multiple cause-of-death code T43.6. Deaths with co-involvement of opioids also had multiple cause-of-death codes T40.0–T40.4 or T40.6. Age-adjusted death rates were calculated using the direct method and the 2000 U.S. standard population. Deaths may involve other drugs in addition to psychostimulants and opioids. Access data table for Figure 3.
SOURCE: National Center for Health Statistics, National Vital Statistics System, Mortality data file.
In 2021, the percentage of overdose deaths that involved a psychostimulant varied by region.
- In 2021, 65.7% of drug overdose deaths involving psychostimulants also involved an opioid (Figure 4).
- The percentage of overdose deaths involving a psychostimulant that also involved an opioid varied by region, from 57.5% in the West, 68.3% in the South, 69.5% in the Midwest, to 80.6% in the Northeast.
Figure 4. Percentage of drug overdose deaths involving psychostimulants with co-involvement of opioids, by Census region: United States, 2021
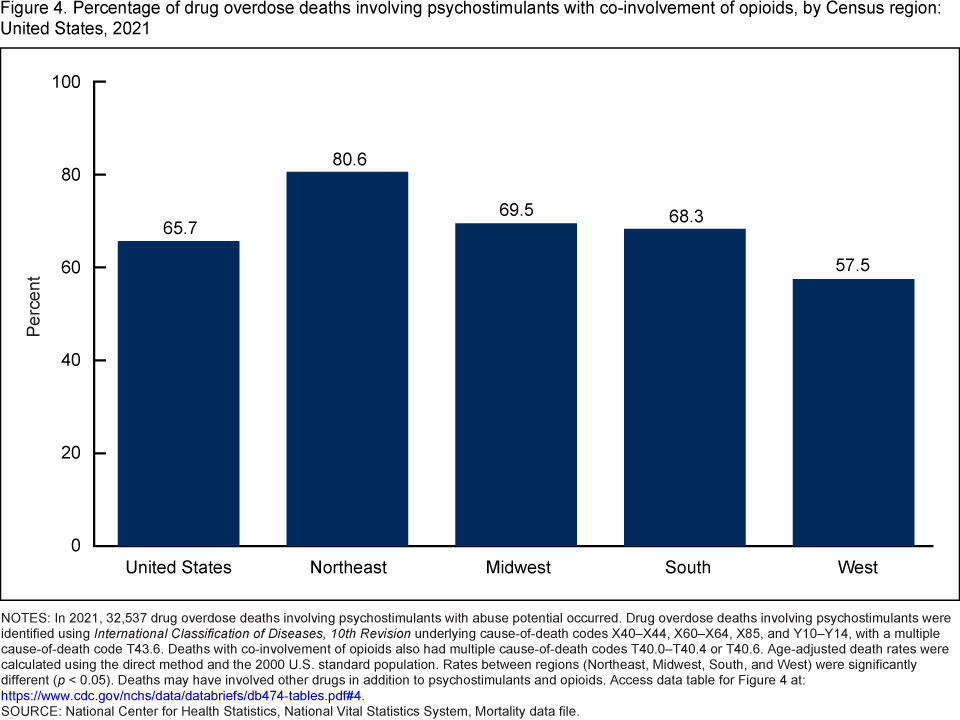
NOTES: In 2021, 32,537 drug overdose deaths involving psychostimulants with abuse potential occurred. Drug overdose deaths involving psychostimulants were identified using International Classification of Diseases, 10th Revision underlying cause-of-death codes X40–X44, X60–X64, X85, and Y10–Y14, with a multiple cause-of-death code T43.6. Deaths with co-involvement of opioids also had multiple cause-of-death codes T40.0–T40.4 or T40.6. Age-adjusted death rates were calculated using the direct method and the 2000 U.S. standard population. Rates between regions (Northeast, Midwest, South, and West) were significantly different (p < 0.05). Deaths may have involved other drugs in addition to psychostimulants and opioids. Access data table for Figure 4.
SOURCE: National Center for Health Statistics, National Vital Statistics System, Mortality data file.
Summary
This report highlights a continued increase in co-involvement of opioids in drug overdose deaths involving cocaine and psychostimulants over time. In 2021, the age-adjusted rate of drug overdose deaths involving both cocaine and opioids was 7.4 times the rate in 2011. Of the 24,486 overdose deaths involving cocaine in 2021, 78.6% involved an opioid. This percentage varied by region, with the lowest percentage in the West at 73.4% and the highest percentage in the Northeast at 84.5%. From 2011 through 2021, the rate of overdose deaths involving both cocaine and opioids increased more quickly than overdose deaths that involved cocaine but no opioids.
Drug overdose deaths involving psychostimulants rose, particularly in recent years. In 2021, the rate of overdose deaths involving psychostimulants (10.0) was 14.3 times the rate in 2011 (0.7); however, the rate increased 33.3% from 2020 through 2021. Of the 32,537 drug overdose deaths involving psychostimulants in 2021, 65.7% involved one or more opioids in 2021. Like drug overdose deaths involving cocaine, the percentage of overdose deaths involving psychostimulants varied by region, with the lowest percentage in the West at 57.5% and the highest percentage in the Northeast at 80.6%. From 2011 through 2016, the rate of overdose deaths involving psychostimulants without opioids was higher than the rate of overdose deaths with opioids, while from 2017 through 2021, the rate was higher for overdose deaths involving both psychostimulants and opioids.
Definitions
Any opioids: Includes natural and semisynthetic opioids such as opium, morphine, codeine, hydrocodone, and oxycodone; synthetic opioids such as methadone, fentanyl, fentanyl analogs, and tramadol; heroin; and mentions of opiates or opioids without naming a specific drug.
Drug poisoning (overdose) deaths: Includes deaths resulting from unintentional or intentional overdose of a drug, being given the wrong drug, taking a drug in error, or taking a drug inadvertently.
Psychostimulants with abuse potential: Includes drugs such as methamphetamine, amphetamine, and methylphenidate.
Data source and methods
Estimates are based on the National Vital Statistics System multiple cause-of-death mortality files (5). Drug poisoning (overdose) deaths involving cocaine were defined as deaths having an International Classification of Diseases, 10th Revision underlying cause-of-death code of X40–X44 (unintentional drug poisoning), X60–X64 (suicide by drug poisoning), X85 (homicide by drug poisoning), or Y10–Y14 (drug poisoning of undetermined intent), with a multiple cause-of-death code of T40.5. Drug poisoning deaths involving psychostimulants with abuse potential were defined as deaths having an underlying cause-of-death code of X40–X44, X60–X64, X85, or Y10–Y14, with a multiple cause-of-death code of T43.6. Deaths with co-involvement of opioids had a multiple cause-of-death code of T40.0–T40.4 or T40.6, in addition to T40.5 or T43.6. The decedent’s state of residence was grouped into one of four Census regions: Northeast, Midwest, South, and West (6).
Age-adjusted death rates were calculated using the direct method, adjusted to the 2000 U.S. standard population (7). Trends in age-adjusted death rates were evaluated using the Joinpoint Regression Program (Version 4.9.0.0) (8). The Joinpoint software fitted weighted least-squares regression models to the rates on the log transformed scale. Analyses were set to allow a maximum of three joinpoints across the period, a minimum of three observed time points from any given joinpoint to either end of the data, and a minimum of four observed time points between any two joinpoints. The permutation tests for model (number of joinpoints) significance were set at an overall alpha level of 0.05 (9). Pairwise comparisons were conducted using the z test with an alpha level of 0.05 (7).
Several factors related to death investigations and reporting may have affected the measurement of death rates involving specific drugs. At autopsy, the substances tested for and the circumstances under which the toxicology tests were performed varied by jurisdiction. This variability was more likely to affect substance-specific death rates than the overall drug overdose death rate. The percentage of drug overdose deaths that identified the specific drugs involved varied by year, ranging from 75% in 2011 to 79% in 2013 and increasing from 81% in 2014 to 95% in 2021. In 2021, at least one specific drug or drug category was mentioned in 95% of drug overdose deaths in the Northeast, 94% in the Midwest, 93% in the South, and 94% in the West. Some drug overdose deaths may involve other drugs in addition to cocaine, psychostimulants, and opioids. While the emphasis in this report is on drug overdose deaths involving cocaine or psychostimulants with or without involvement of opioids, all drugs mentioned as involved in the death are considered to have contributed to the death.
About the authors
Merianne Rose Spencer and Matthew F. Garnett are with the National Center for Health Statistics (NCHS) Division of Analysis and Epidemiology. Arialdi Miniño is with the NCHS Division of Vital Statistics.
References
- Spencer MR, Miniño AM, Warner M. Drug overdose deaths in the United States, 2001–2021. NCHS Data Brief, no 457. Hyattsville, MD: National Center for Health Statistics. 2022. DOI: https://dx.doi.org/10.15620/cdc:129733.
- Hedegaard H, Spencer MR, Garnett MF. Increase in drug overdose deaths involving cocaine: United States, 2009–2018. NCHS Data Brief, no 384. Hyattsville, MD: National Center for Health Statistics. 2020.
- Ahmad FB, Cisewski JA, Rossen LM, Sutton P. Provisional drug overdose death counts. National Center for Health Statistics. 2023.
- Kariisa M, Scholl L, Wilson N, Seth P, Hoots B. Drug overdose deaths involving cocaine and psychostimulants with abuse potential — United States, 2003–2017. MMWR Morb Mortal Wkly Rep 68(17):388–95. 2019. DOI: https://dx.doi.org/10.15585/mmwr.mm6817a3.
- National Center for Health Statistics. Public-use data files: Mortality multiple cause files. 2021.
- United States Census Bureau. Regional offices. 2022.
- Murphy SL, Xu JQ, Kochanek KD, Arias E, Tejada-Vera B. Deaths: Final data for 2018. National Vital Statistics Reports; vol 69 no 13. Hyattsville, MD: National Center for Health Statistics. 2020.
- National Cancer Institute. Joinpoint Regression Program (Version 4.9.0.0) [computer software]. 2021.
- Ingram DD, Malec DJ, Makuc DM, Kruszon-Moran D, Gindi RM, Albert M, et al. National Center for Health Statistics guidelines for analysis of trends. National Center for Health Statistics. Vital Health Stat 2(179). 2018.
Suggested citation
Spencer MR, Miniño AM, Garnett MF. Co-involvement of opioids in drug overdose deaths involving cocaine and psychostimulants, 2011–2021. NCHS Data Brief, no 474. Hyattsville, MD: National Center for Health Statistics. 2023. DOI: https://dx.doi.org/10.15620/cdc:129733.
Copyright information
All material appearing in this report is in the public domain and may be reproduced or copied without permission; citation as to source, however, is appreciated.
National Center for Health Statistics
Brian C. Moyer, Ph.D., Director
Amy M. Branum, Ph.D., Associate Director for Science
Division of Analysis and Epidemiology
Irma E. Arispe, Ph.D., Director
Julie D. Weeks, Ph.D., Acting Associate Director for Science
Division of Vital Statistics
Steven Schwartz, Ph.D., Director
Andrés A. Berruti, Ph.D., M.A., Associate Director for Science