Unintentional Drowning Deaths Among Children Aged 0–17 Years: United States, 1999–2019
NCHS Data Brief No. 413, July 2021
PDF Version (462KB) | Visual Abstract
- Key findings
- Rates of unintentional drowning deaths among children aged 0–17 years decreased from 1999 through 2019.
- Children aged 1–4 years had the highest rates of unintentional drowning deaths over the past 2 decades.
- After declining from 1999 through 2003, the unintentional drowning death rate for non-Hispanic black children remained stable from 2003 through 2019.
- Unintentional drowning death rates among children were highest in rural counties compared with urban counties from 1999 through 2019.
- During 2018–2019, the highest percentage of unintentional drowning deaths occurred in bathtubs for children aged under 1 year, in swimming pools for those aged 1–4 and 5–13, and in natural bodies of water for those aged 14–17.
Data from the National Vital Statistics System, Mortality
- Over the past 2 decades, the rate of unintentional drowning deaths among children aged 0–17 years declined 38%, from 1.6 per 100,000 in 1999 to 1.0 in 2019.
- Unintentional drowning death rates among children were highest for those aged 1–4, with rates decreasing from 3.2 in 1999 to 2.4 in 2019.
- In 1999–2019, unintentional drowning death rates were higher for non-Hispanic black children compared with non-Hispanic white and Hispanic children.
- For the period, unintentional drowning death rates were higher for children in rural compared with urban counties.
- During 2018–2019, the highest percentage of unintentional drowning deaths occurred in bathtubs for ages under 1 year, in swimming pools for ages 1–4 and 5–13, and in natural bodies of water for ages 14–17.
Drowning deaths are the second leading cause of unintentional injury deaths for children aged 0–17 years and the leading cause for those aged 1–4 (1). Previous studies using national data have shown that unintentional drowning deaths can differ by sex, age, race and ethnicity, and urban–rural category (2,3). This report uses the latest mortality data from the National Vital Statistics System (NVSS) to present national trends in unintentional drowning death rates from 1999 through 2019 for children aged 0–17.
Keywords: pediatric unintentional injury deaths, race/ethnicity, rural/urban, National Vital Statistics System, Mortality
Rates of unintentional drowning deaths among children aged 0–17 years decreased from 1999 through 2019.
- From 1999 through 2019, the rate of unintentional drowning deaths among children aged 0–17 declined from 1.6 per 100,000 in 1999 to 1.0 in 2019 (Figure 1).
- Rates for males decreased from 2.2 in 1999 to 1.4 in 2019. Rates for females decreased from 0.9 in 1999 to 0.6 in 2019.
- Rates for males were more than double the rates for females throughout the study period.
Figure 1. Unintentional drowning death rates among children aged
0–17 years, by sex: United States, 1999–2019
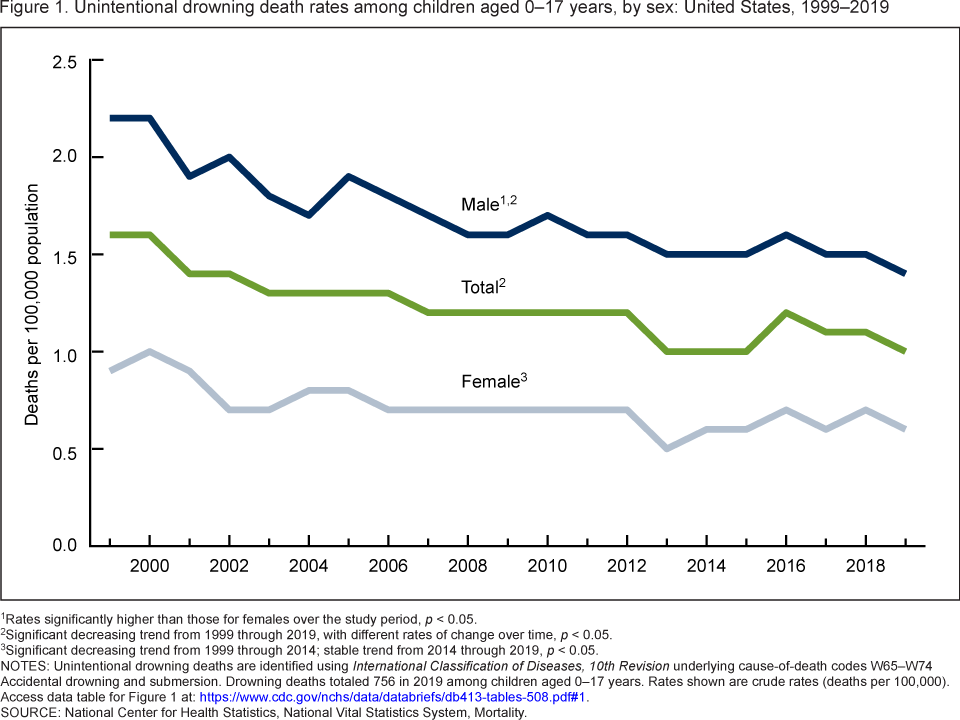
1Rates significantly higher than those for females over the study period, p < 0.05.
2Significant decreasing trend from 1999 through 2019, with different rates of change over time, p < 0.05.
3Significant decreasing trend from 1999 through 2014; stable trend from 2014 through 2019, p < 0.05.
NOTES: Unintentional drowning deaths are identified using International Classification of Diseases, 10th Revision underlying cause-of-death codes W65–W74 Accidental drowning and submersion. Drowning deaths totaled 756 in 2019 among children aged 0–17 years. Rates shown are crude rates (deaths per 100,000). Access data table for Figure 1.
SOURCE: National Center for Health Statistics, National Vital Statistics System, Mortality.
Children aged 1–4 years had the highest rates of unintentional drowning deaths over the past 2 decades.
- The rate of unintentional drowning deaths among children aged 0–17 decreased from 1999 through 2019 for all age groups (Figure 2).
- Throughout the period, rates were highest for those aged 1–4, although they decreased from 3.2 per 100,000 in 1999 to 2.4 in 2019.
- From 1999 to 2019, rates decreased among those aged under 1 year (from 1.8 to 0.9) and those aged 14–17 (1.5 to 0.9). Rates for those aged 5–13 declined from 0.9 in 1999 to 0.6 in 2005, and then remained stable through 2019 (0.5).
Figure 2. Unintentional drowning death rates among children aged
0–17 years, by age group: United States, 1999–2019
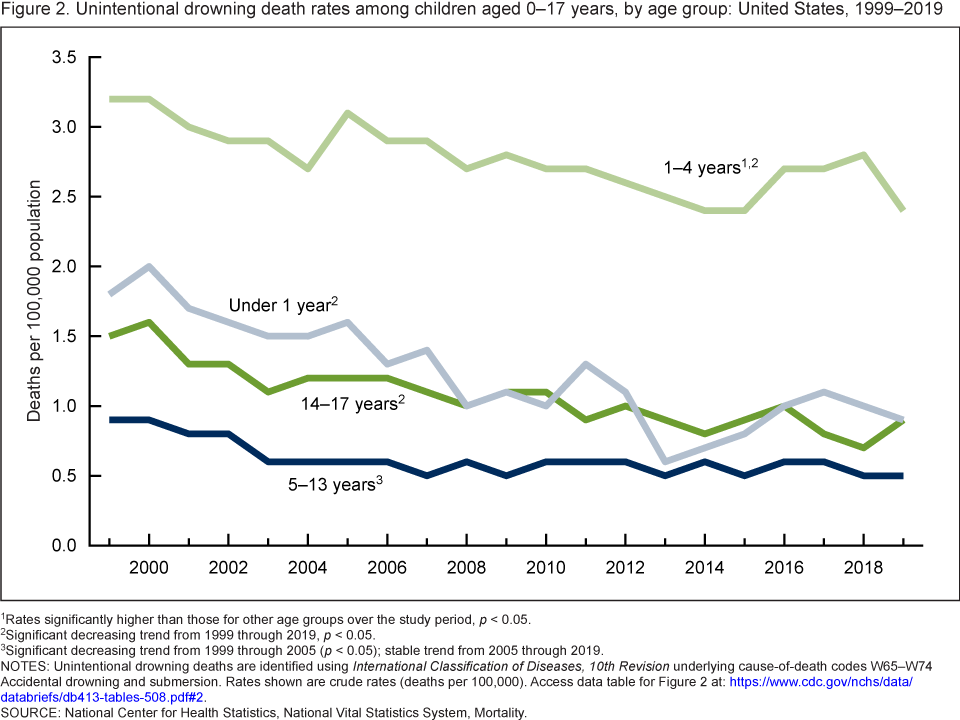
1Rates significantly higher than those for other age groups over the study period, p < 0.05.
2Significant decreasing trend from 1999 through 2019, p < 0.05.
3Significant decreasing trend from 1999 through 2005 p < 0.05; stable trend from 2005 through 2019.
NOTES: Unintentional drowning deaths are identified using International Classification of Diseases, 10th Revision underlying cause-of-death codes W65–W74 Accidental drowning and submersion. Rates shown are crude rates (deaths per 100,000) Access data table for Figure 2.
SOURCE: National Center for Health Statistics, National Vital Statistics System, Mortality.
After declining from 1999 through 2003, the unintentional drowning death rate for non-Hispanic black children remained stable from 2003 through 2019.
- From 1999 through 2019, rates of unintentional drowning deaths among children aged 0–17 years decreased for all race and ethnicity groups (Figure 3).
- Rates for non-Hispanic black children declined from 2.7 in 1999 to 1.6 in 2003, then remained stable from 2003 through 2019 (1.6).
- Rates declined an average 1.5% per year for non-Hispanic white children from 1.3 per 100,000 in 1999 to 1.0 in 2019, and an average 3.0% per year for Hispanic children from 1.4 in 1999 to 0.8 in 2019. Rates for non-Hispanic black children were significantly higher than for non-Hispanic white and Hispanic children over the entire period.
Figure 3. Unintentional drowning death rates among children aged
0–17 years, by race and Hispanic origin: United States, 1999–2019
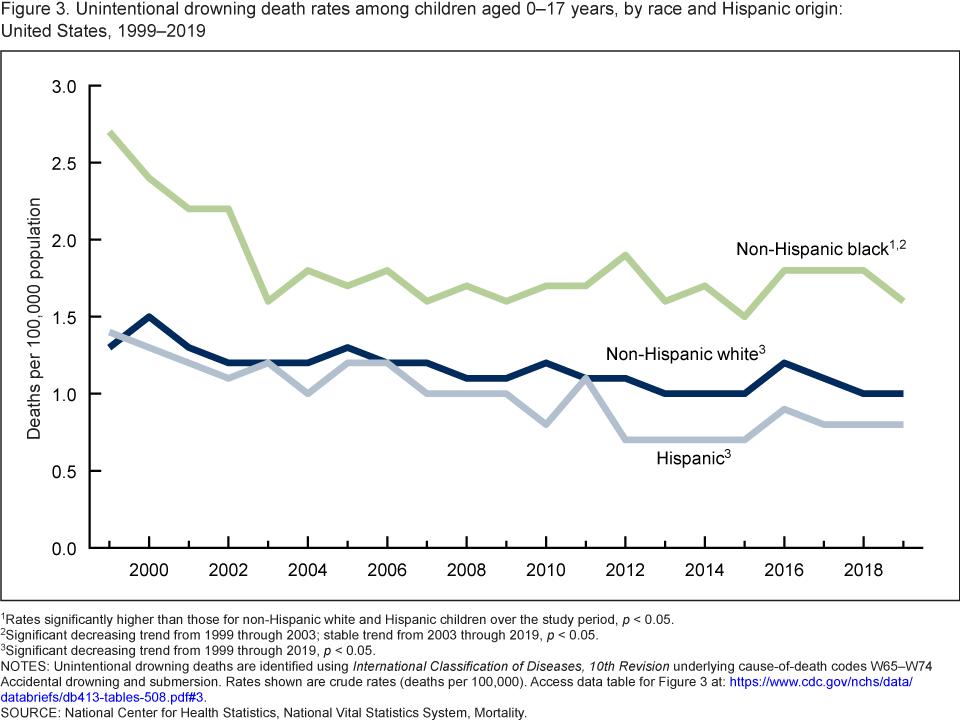
1Rates significantly higher than those for non-Hispanic white and Hispanic children over the study period, p < 0.05.
2Significant decreasing trend from 1999 through 2003; stable trend from 2003 through 2019, p < 0.05.
3Significant decreasing trend from 1999 through 2019, p < 0.05.
NOTES: Unintentional drowning deaths are identified using International Classification of Diseases, 10th Revision underlying cause-of-death codes W65–W74 Accidental drowning and submersion. Rates shown are crude rates (deaths per 100,000). Access data table for Figure 3.
SOURCE: National Center for Health Statistics, National Vital Statistics System, Mortality.
Unintentional drowning death rates among children were highest in rural counties compared with urban counties from 1999 through 2019.
- Rates of unintentional drowning deaths among children aged. 0–17 years decreased from 1999 through 2019 for both urban and rural groups (Figure 4).
- Rates for children living in rural counties decreased from 2.2 per 100,000 in 1999 to 1.6 in 2019.
- Rates for children living in urban counties decreased an average 2.7% per year from 1.5 in 1999 to 0.9 in 2013, then remained stable from 2013 through 2019 (1.0).
- Throughout the period, rates were higher among children living in rural counties than in urban counties.
Figure 4. Unintentional drowning death rates among children aged 0–17 years, by urban–rural status: United States, 1999–2019
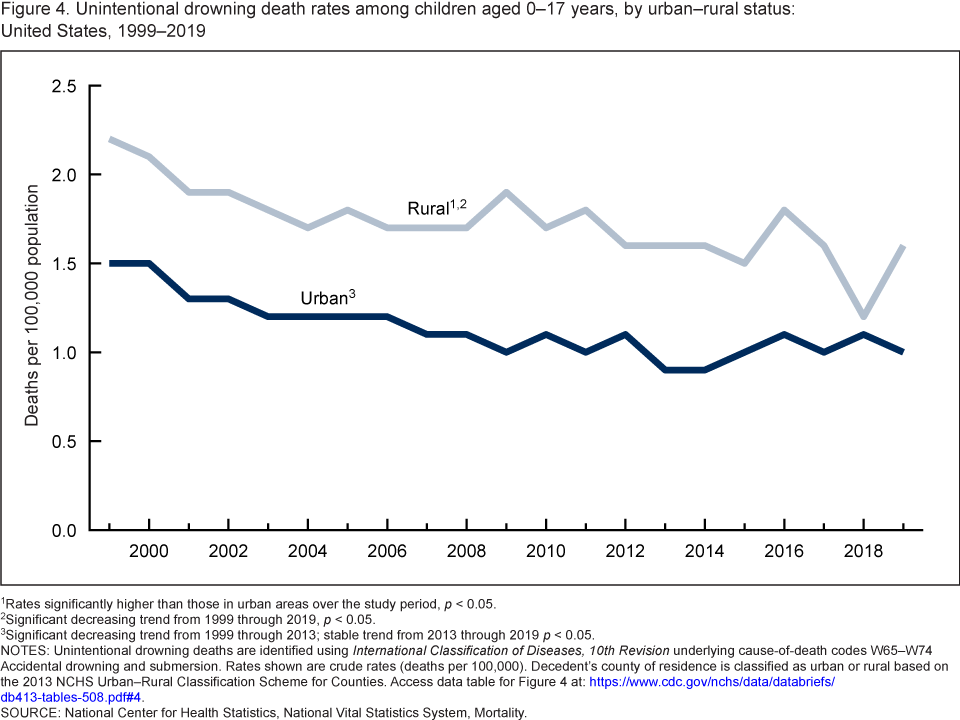
1Rates significantly higher than those in urban areas over the study period, p < 0.05.
2Significant decreasing trend from 1999 through 2019, p < 0.05.
3Significant decreasing trend from 1999 through 2013; stable trend from 2013 through 2019, p < 0.05.
NOTES: Unintentional drowning deaths are identified using International Classification of Diseases, 10th Revision underlying cause-of-death codes W65–W74 Accidental drowning and submersion. Rates shown are crude rates (deaths per 100,000). Decedent’s county of residence is classified as urban or rural based on the 2013 NCHS Urban–Rural Classification Scheme for Counties. Access data table for Figure 4.
SOURCE: National Center for Health Statistics, National Vital Statistics System, Mortality.
During 2018–2019, the highest percentage of unintentional drowning deaths occurred in bathtubs for children aged under 1 year, in swimming pools for those aged 1–4 and 5–13, and in natural bodies of water for those aged 14–17.
- During 2018–2019, most unintentional drowning deaths among children aged under 1 year occurred in bathtubs (75%), followed by swimming pools (7%) and natural bodies of water (3%); the remaining 15% occurred in other and unspecified places (Figure 5).
- The greatest percentage of such deaths among children aged 1–4 and 5–13 occurred in swimming pools (59% and 46%, respectively), followed by natural bodies of water (21% and 37%, respectively). For those aged 14–17, most unintentional drowning deaths occurred in natural bodies of water (62%).
Figure 5. Percentage of unintentional drowning deaths among children aged 0–17, by age group and place of drowning: United States,
2018–2019
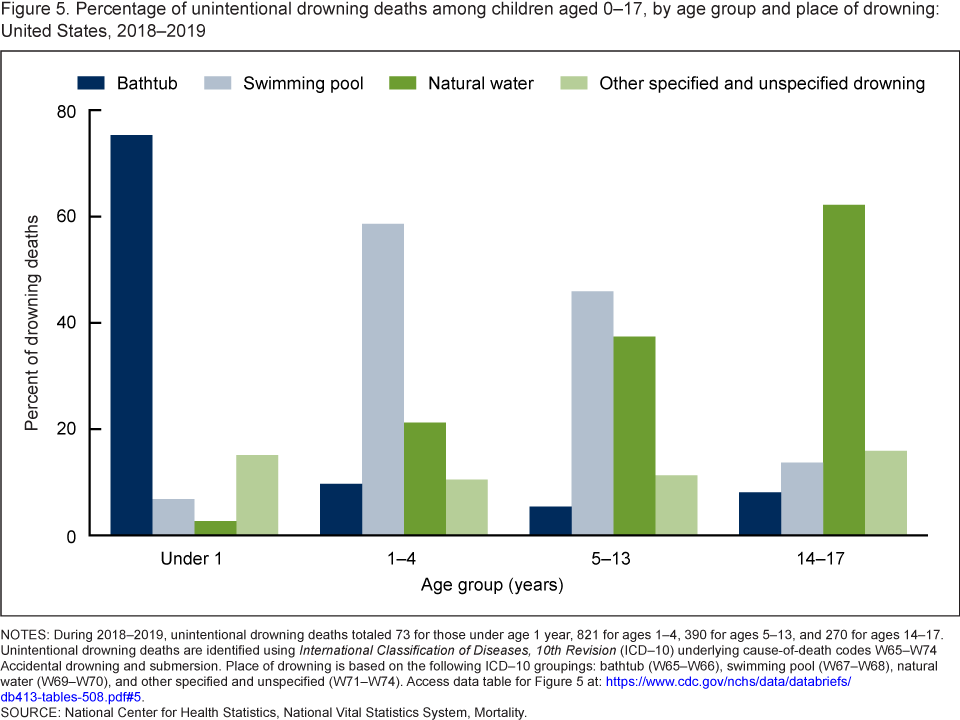
NOTES: During 2018–2019, unintentional drowning deaths totaled 73 for those under age 1 year, 821 for ages 1–4, 390 for ages 5–13, and 270 for ages 14–17. Unintentional drowning deaths are identified using International Classification of Diseases, 10th Revision (ICD–10) underlying cause-of-death codes W65–W74 Accidental drowning and submersion. Place of drowning is based on the following ICD–10 groupings: bathtub (W65–W66), swimming pool (W67–W68), natural water (W69–W70), and other specified and unspecified (W71–W74). Access data table for Figure 5.
SOURCE: National Center for Health Statistics, National Vital Statistics System, Mortality.
Summary
This report highlights differences in unintentional drowning death rates among children aged 0–17 years by sex, age group, race and ethnicity, urban–rural county of residence, and place of drowning. Overall, unintentional drowning death rates decreased from 1.6 per 100,000 in 1999 to 1.0 in 2019. Rates were higher for males than for females throughout the period. In 2019, the rate for males (1.4) was roughly twice that for females (0.6). While death rates declined for all age groups from 1999 through 2019, the rate for those aged 1–4 remained more than double the rates for other age groups. Throughout the period, rates were higher for non-Hispanic black children than for non-Hispanic white or Hispanic children. Rates were also consistently higher for children living in rural counties compared with urban counties. In 2018–2019, the place of drowning varied by age group. The greatest percentage of deaths occurred in bathtubs for those under 1 year, in swimming pools for those aged 1–4 and 5–13, and in natural bodies of water such as lakes, rivers, streams, and oceans for those aged 14–17.
Data source and methods
NVSS multiple cause-of-death mortality data for 1999–2019 (4) were used to study unintentional drowning deaths by sex, age group, race and ethnicity, urban–rural county of residence, and place of drowning. Unintentional drowning deaths are identified using International Classification of Diseases, 10th Revision (ICD–10) (5) underlying cause-of-death codes W65–W74 Accidental drowning and submersion. Rates for non-Hispanic American Indian and Alaska Native children (5–31 deaths per year) and non-Hispanic Asian and Pacific Islander children (25–45 deaths per year) are not shown due to low numbers and unstable rates. Place of drowning is determined based on the following ICD–10 groupings: bathtub (W65–W66), swimming pool (W67–W68), natural water (W69–W70), and other specified and unspecified drowning (W73–W74). Urban–rural county of residence is categorized using the 2013 NCHS Urban–Rural Classification Scheme for Counties (6). Counties are classified into six urbanization levels based on metropolitan–nonmetropolitan status, population distribution, and other factors. The four metropolitan categories—large central metro, large fringe metro, medium metro, and small metro—are grouped as urban counties. The two nonmetropolitan categories—micropolitan and noncore—are grouped as rural counties (6).
Crude rates (deaths per 100,000 population) (Figures 1–4) and the percentage of deaths by place of drowning (Figure 5) were calculated. Pairwise comparisons of rates (such as crude rates for males compared with those for females) were conducted using a z test with an alpha level of 0.05 (7). Statistically significant differences between rates for children under age 1 year (the one age group with fewer than 100 deaths each year) and for children in other age groups were determined by comparing 95% confidence intervals of the rates for the two groups. Consistent with other NCHS reports, 95% confidence intervals for rates with fewer than 100 deaths are based on the gamma distribution (7). Trends in death rates were evaluated using the Joinpoint Regression Program (Version 4.8.0.1) (8). Joinpoint software fitted weighted least-squares regression models to the rates on the log transformation scale. The permutation tests for model (number of joinpoints) significance were set at an overall alpha level of 0.05 (9).
About the authors
Merianne Rose Spencer and Holly Hedegaard are with the National Center for Health Statistics (NCHS), Division of Analysis and Epidemiology. Margaret Warner is with the NCHS Division of Vital Statistics.
References
- Centers for Disease Control and Prevention. WISQARS. Fatal injury data. Leading causes of death reports. 2019.
- Clemens T, Moreland B, Lee R. Persistent racial/ethnic disparities in fatal unintentional drowning rates among persons aged ≤29 years—United States, 1999–2019. MMWR Morb Mortal Wkly Rep 70(24):869–74. 2021.
- Xu JQ. Unintentional drowning deaths in the United States, 1999–2010. NCHS Data Brief, no 149. Hyattsville, MD: National Center for Health Statistics. 2014.
- National Center for Health Statistics. Public-use data files: Mortality multiple cause files. 2018.
- World Health Organization. International statistical classification of diseases and related health problems, 10th revision (ICD–10). 2008 ed. Geneva, Switzerland. 2009.
- Ingram DD, Franco SJ. 2013 NCHS urban–rural classification scheme for counties. National Center for Health Statistics. Vital Health Stat 2(166). 2014.
- Murphy SL, Xu JQ, Kochanek KD, Arias E, Tejada-Vera B. Deaths: Final data for 2018. National Vital Statistics Reports; vol 69 no 13. Hyattsville, MD: National Center for Health Statistics. 2021.
- National Cancer Institute. Joinpoint regression program (Version 4.8.0.1) [computer software]. 2021.
- Ingram DD, Malec DJ, Makuc DM, Kruszon-Moran D, Gindi RM, Albert M, et al. National Center for Health Statistics guidelines for analysis of trends. National Center for Health Statistics. Vital Health Stat 2(179). 2018.
Suggested citation
Spencer MR, Hedegaard H, Warner M. Unintentional drowning deaths among children aged 0–17 years: United States, 1999–2019. NCHS Data Brief, no 413. Hyattsville, MD: National Center for Health Statistics. 2021. DOI:
https://dx.doi.org/10.15620/cdc:107521.
Copyright information
All material appearing in this report is in the public domain and may be reproduced or copied without permission; citation as to source, however, is appreciated.
National Center for Health Statistics
Brian C. Moyer, Ph.D., Director
Amy M. Branum, Ph.D., Acting Associate Director for Science
Division of Analysis and Epidemiology
Irma E. Arispe, Ph.D., Director
Kevin C. Heslin, Ph.D., Associate Director for Science
Division of Vital Statistics
Steven Schwartz, Ph.D., Director
Isabelle Horon, Dr.P.H., Acting Associate Director for Science