Mortality

Mortality

This visual abstract shows the most frequent location of unintentional drowning deaths among children in 2019 varies by age.

view larger | report

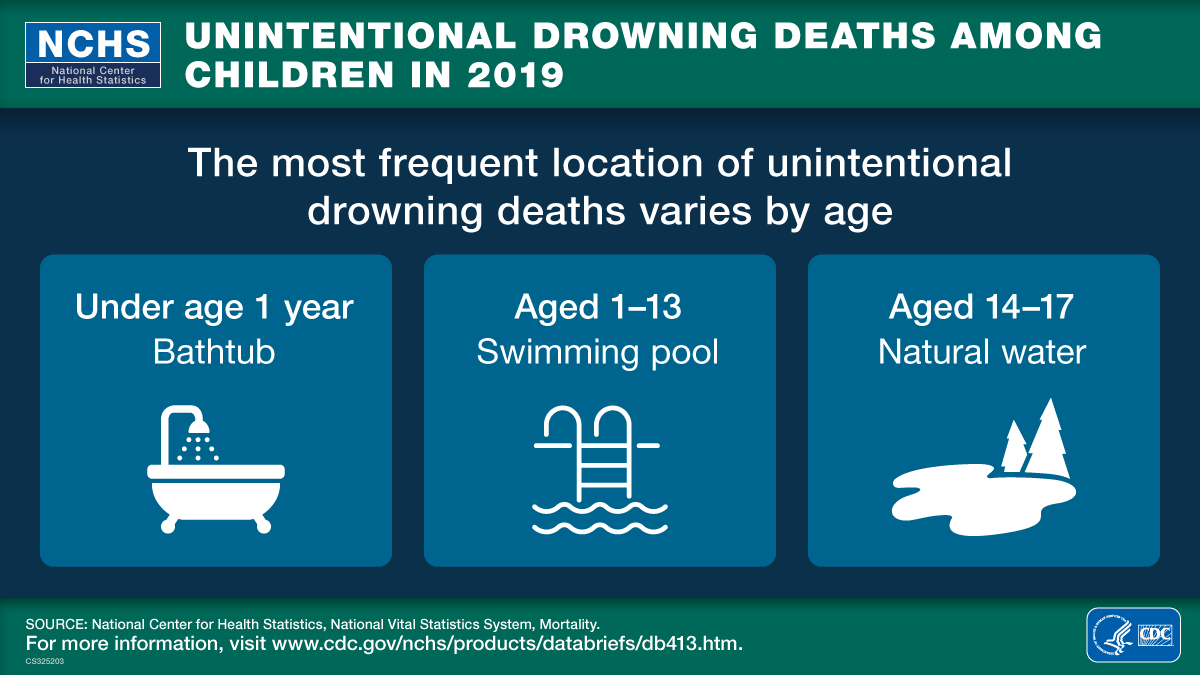
Keywords: pediatric unintentional injury deaths, race/ethnicity, rural/urban, National Vital Statistics System, Mortality

Published Date: July 2021
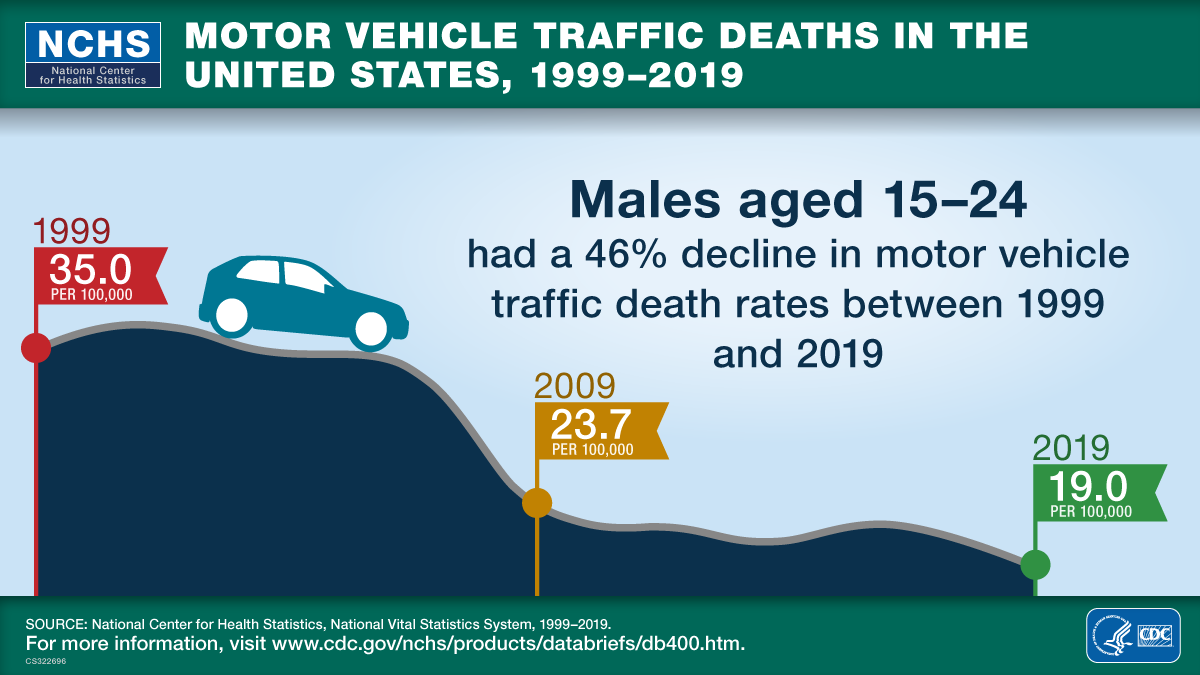
This visual abstract shows motor vehicle traffic deaths in the United States for males aged 15 through 24 from 1999 through 2019.

view larger | report

Keywordsnational trends, traffic fatalities, pedestrian fatalities, National Vital Statistics System

Related data visualizationsmortality trends

Published Date: March 2021

This visual abstract shows that the non-Hispanic black population had the greatest decrease in life expectancy in the first half of 2020 compared with 2019.

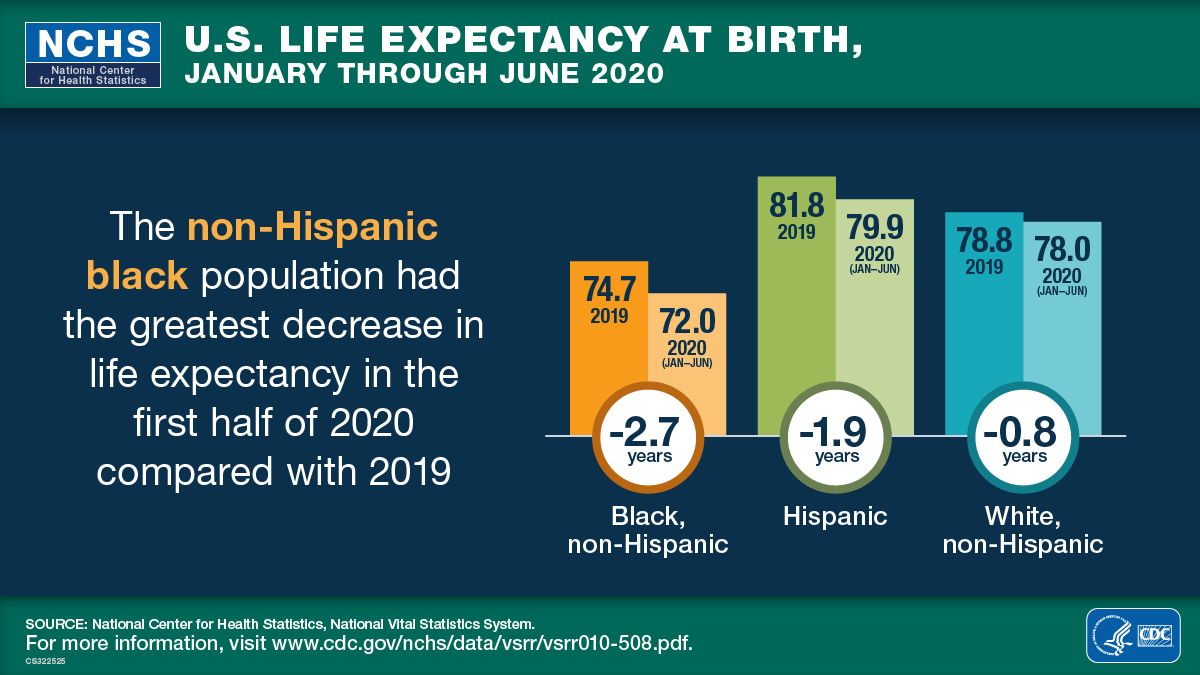
view larger | report [PDF – 731 KB]

Keywordslife expectancy, Hispanic origin, race, National Vital Statistics System

Related data visualizationsmortality trends mortality provisional estimates 

Published Date: February 2021
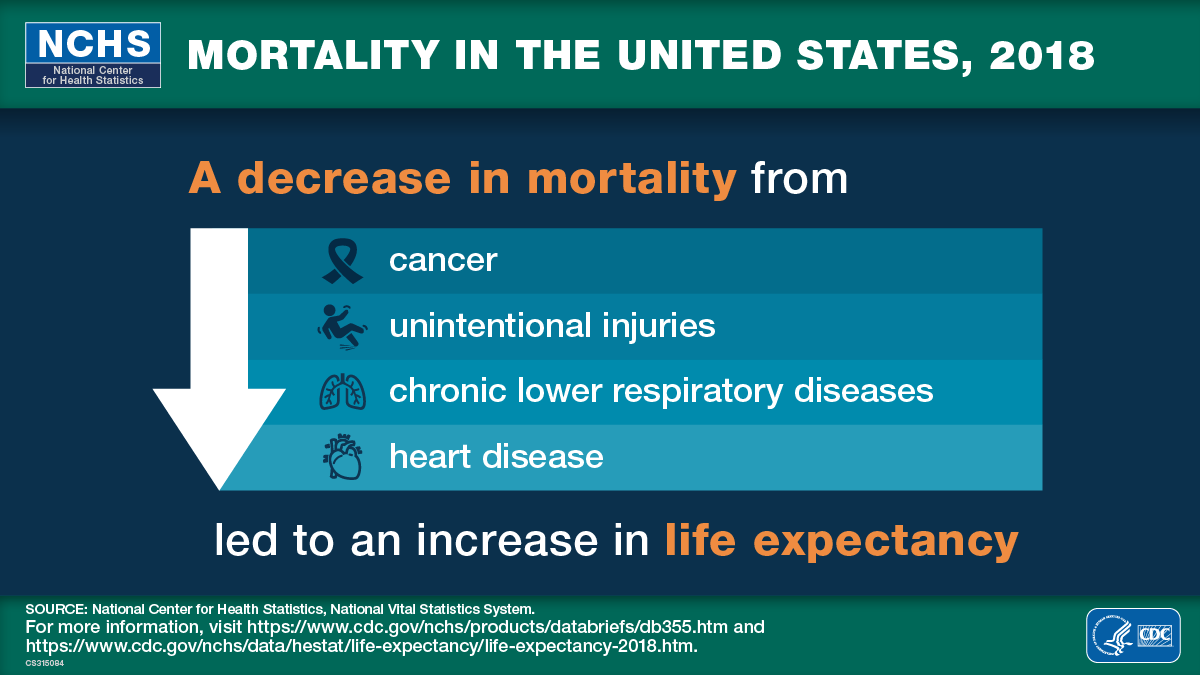
A decrease in mortality from cancer, unintentional injuries, chronic lower respiratory diseases, and heart disease led to an increase in life expectancy, A decrease in mortality from cancer, unintentional injuries, chronic lower respiratory diseases, and heart disease led to an increase in life expectancy, National Center for Health Statistics, National Vital Statistics System. Logo of the Department of Health and Human Services (HHS) and Centers for Disease Control and Prevention (CDC)

view larger | report

Keywords life expectancy, leading cause, National Vital Statistics System

Related data visualizations: mortality trends , leading causes of death, mortality provisional estimates 

Published Date: January 2020

Choose a Different Item
loading...
Page last reviewed: March 18, 2021