Mortality in the United States, 2018
- Key findings
- How long can we expect to live?
- What are the death rates for the 10 leading causes of death?
- Did age-specific death rates in 2018 change from 2017 among those aged 15 years and over?
- What are the mortality rates for the 10 leading causes of infant death?
- Summary
- Definitions
- Data sources and methods
- About the authors
- References
- Suggested citation
PDF Version (423 KB) | Visual Abstract
Key findings
Data from the National Vital Statistics System
- Life expectancy for the U.S. population in 2018 was 78.7 years, an increase of 0.1 year from 2017.
- The age-adjusted death rate decreased by 1.1% from 731.9 deaths per 100,000 standard population in 2017 to 723.6 in 2018.
- The 10 leading causes of death in 2018 remained the same as in 2017. From 2017 to 2018, age-adjusted death rates decreased for 6 of 10 leading causes of death and increased for 2.
- Age-specific death rates decreased from 2017 to 2018 for age groups 15–24, 25–34, 45–54, 65–74, 75–84, and 85 and over.
- The infant mortality rate decreased 2.3% from 579.3 infant deaths per 100,000 live births in 2017 to 566.2 in 2018.
- The 10 leading causes of infant death in 2018 remained the same as in 2017.
This report presents final 2018 U.S. mortality data on deaths and death rates by demographic and medical characteristics. These data provide information on mortality patterns among U.S. residents by variables such as sex, age, race and Hispanic origin, and cause of death. Life expectancy estimates, 10 leading causes of death, age-specific death rates, and 10 leading causes of infant death were analyzed by comparing 2018 and 2017 final data (1).
Keywords: life expectancy, leading cause, National Vital Statistics System
How long can we expect to live?
In 2018, life expectancy at birth was 78.7 years for the total U.S. population—an increase of 0.1 year from 78.6 years in 2017 (Figure 1). For males, life expectancy changed from 76.1 in 2017 to 76.2 in 2018—an increase of 0.1 year. For females, life expectancy increased 0.1 year from 81.1 years in 2017 to 81.2 in 2018.
Life expectancy for females was consistently higher than it was for males. In 2018, the difference in life expectancy between females and males was 5.0 years, the same as in 2017.
In 2018, life expectancy at age 65 for the total population was 19.5 years, an increase of 0.1 year from 2017. For males, life expectancy at age 65 increased 0.1 year from 18.0 in 2017 to 18.1 in 2018. For females, life expectancy at age 65 increased 0.1 year from 20.6 years in 2017 to 20.7 in 2018. The difference in life expectancy at age 65 between females and males was 2.6 years, unchanged from 2017.
Figure 1. Life expectancy at selected ages, by sex: United States, 2017 and 2018
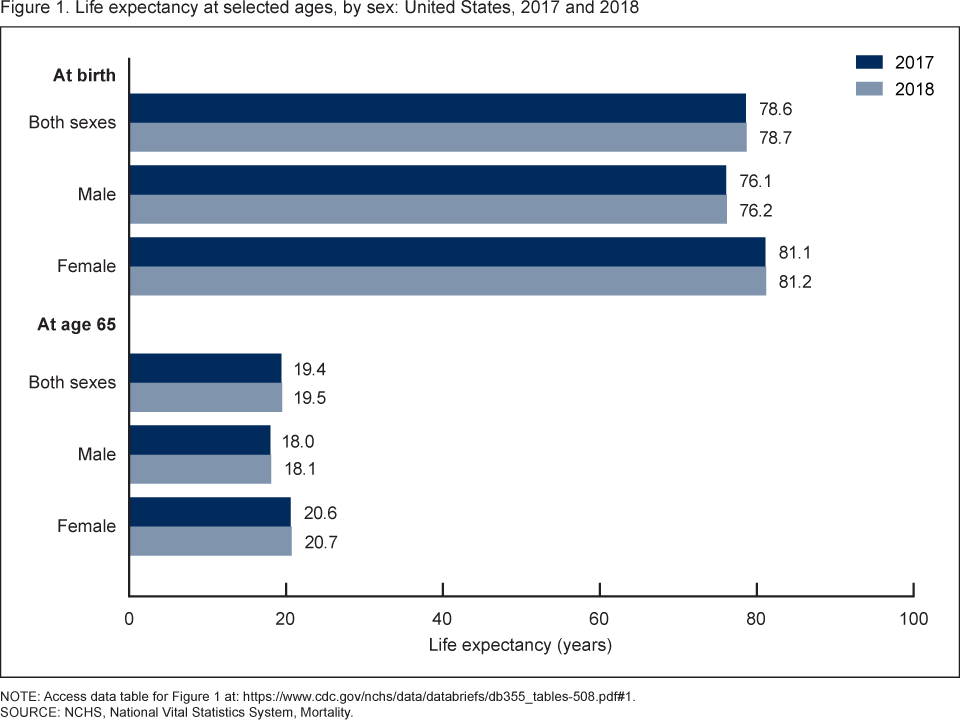
NOTE: Access data table for Figure 1.
SOURCE: NCHS, National Vital Statistics System, Mortality.
What are the death rates for the 10 leading causes of death?
The age-adjusted death rate for the total population decreased 1.1% from 731.9 deaths per 100,000 standard population in 2017 to 723.6 in 2018 (Figure 2).
In 2018, the 10 leading causes of death (heart disease, cancer, unintentional injuries, chronic lower respiratory diseases, stroke, Alzheimer disease, diabetes, influenza and pneumonia, kidney disease, and suicide) remained the same as in 2017. Causes of death are ranked according to number of deaths (1). The 10 leading causes accounted for 73.8% of all deaths in the United States in 2018.
From 2017 to 2018, age-adjusted death rates decreased for 6 of 10 leading causes of death and increased for 2. The rate decreased 0.8% for heart disease (from 165.0 in 2017 to 163.6 in 2018), 2.2% for cancer (152.5 to 149.1), 2.8% for unintentional injuries (49.4 to 48.0), 2.9% for chronic lower respiratory diseases (40.9 to 39.7), 1.3% for stroke (37.6 to 37.1), and 1.6% for Alzheimer disease (31.0 to 30.5). The rate increased 4.2% for influenza and pneumonia (14.3 to 14.9) and 1.4% for suicide (14.0 to 14.2). Rates for diabetes and kidney disease did not change significantly.
Figure 2. Age-adjusted death rates for all causes and the 10 leading causes of death in 2018: United States, 2017 and 2018
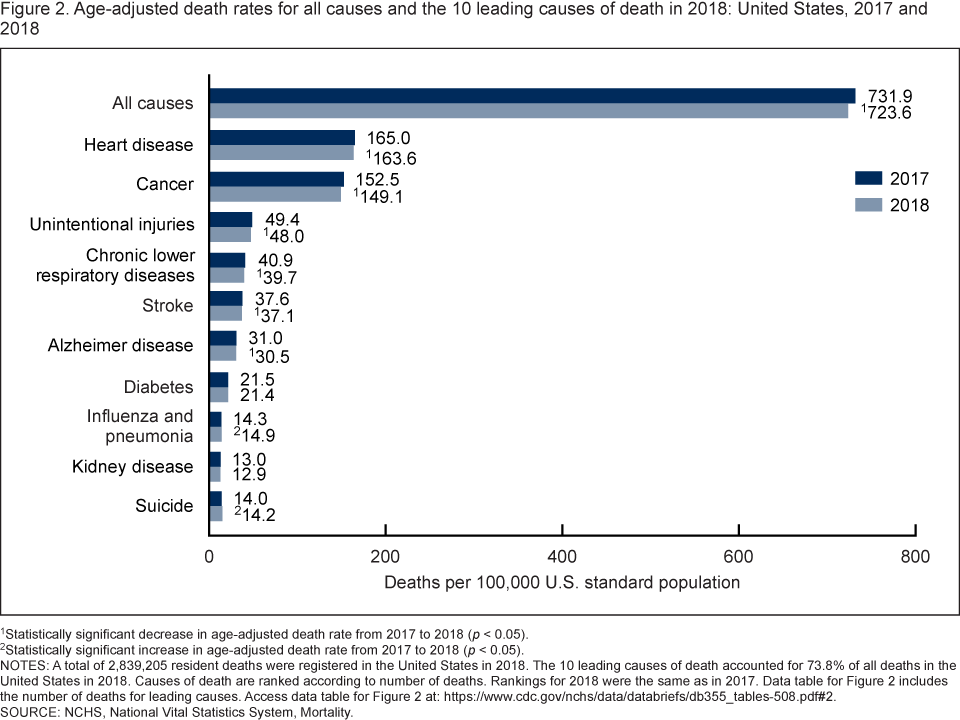
1Statistically significant decrease in age-adjusted death rate from 2017 to 2018 (p < 0.05).
2Statistically significant increase in age-adjusted death rate from 2017 to 2018 (p < 0.05).
NOTES: A total of 2,839,205 resident deaths were registered in the United States in 2018. The 10 leading causes of death accounted for 73.8% of all deaths in the United States in 2018. Causes of death are ranked according to number of deaths. Rankings for 2018 were the same as in 2017. Data table for Figure 2 includes the number of deaths for leading causes. Access data table for Figure 2.
SOURCE: NCHS, National Vital Statistics System, Mortality.
Did age-specific death rates in 2018 change from 2017 among those aged 15 years and over?
Between 2017 and 2018, death rates decreased 5.1% for age group 15–24 (from 74.0 deaths per 100,000 population in 2017 to 70.2 in 2018), 3.0% for age group 25–34 (132.8 to 128.8), 1.4% for age group 45–54 (401.5 to 395.9), 0.4% for age group 65–74 (1,790.9 to 1,783.3), 1.9% for age group 75–84 (4,472.6 to 4,386.1), and 0.9% for age group 85 and over (13,573.6 to 13,450.7) (Figure 3).
Rates for age groups 35–44 and 55–64 did not change significantly between 2017 and 2018.
Figure 3. Age-specific death rates for ages 15 years and over: United States, 2017 and 2018
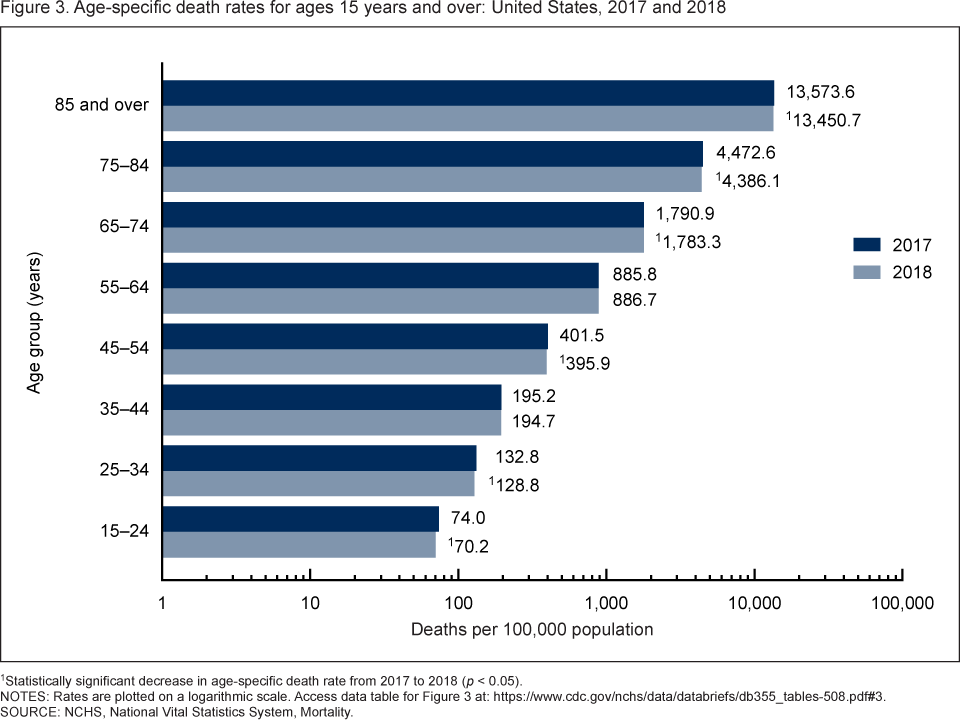
1Statistically significant decrease in age-specific death rate from 2017 to 2018 (p < 0.05).
NOTES: Rates are plotted on a logarithmic scale. Access data table for Figure 3.
SOURCE: NCHS, National Health Interview Survey, 2018.
What are the mortality rates for the 10 leading causes of infant death?
The infant mortality rate (IMR)—the ratio of infant deaths to live births in a given year—is generally regarded as a good indicator of the overall health of a population. The IMR decreased 2.3% from 579.3 infant deaths per 100,000 live births in 2017 to 566.2 in 2018.
Causes of infant death are ranked according to the number of infant deaths (1). The 10 leading causes of infant death in 2018 accounted for 67.6% of all infant deaths in the United States. The leading causes remained the same as in 2017 (Figure 4). The IMR decreased 9.9% from 34.2 in 2017 to 30.8 in 2018 for unintentional injuries and 12.8% from 21.9 in 2017 to 19.1 in 2018 for cord and placental complications. Mortality rates for other leading causes of infant death did not change significantly.
Figure 4. Infant mortality rates for the 10 leading causes of infant death in 2018: United States, 2017 and 2018
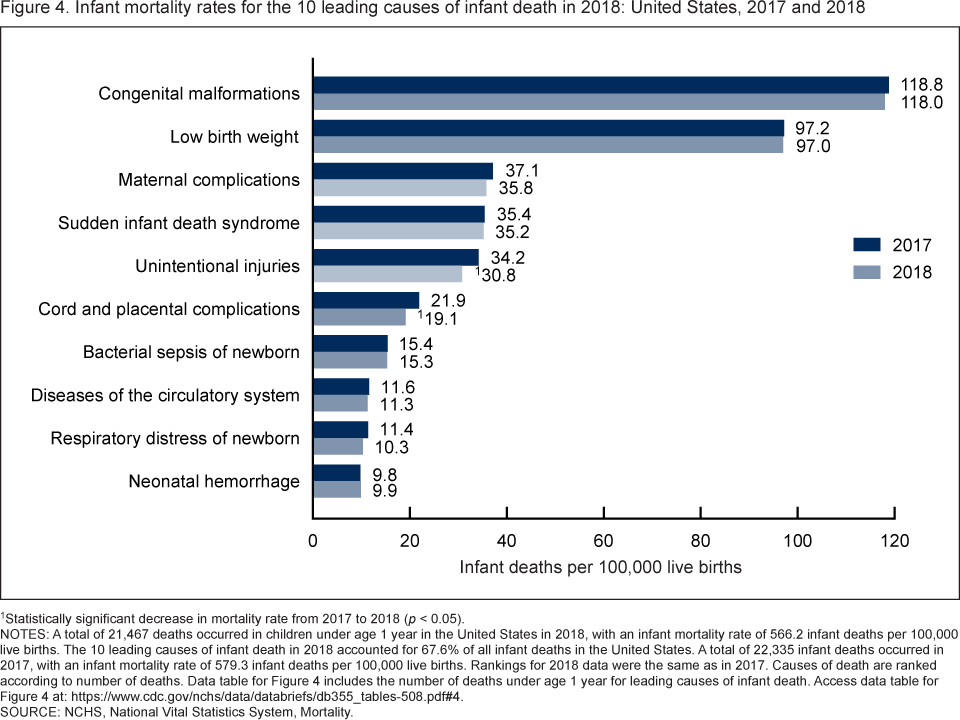
1Statistically significant decrease in mortality rate from 2017 to 2018 (p < 0.05).
NOTES: A total of 21,467 deaths occurred in children under age 1 year in the United States in 2018, with an infant mortality rate of 566.2 infant deaths per 100,000 live births. The 10 leading causes of infant death in 2018 accounted for 67.6% of all infant deaths in the United States. A total of 22,335 infant deaths occurred in 2017, with an infant mortality rate of 579.3 infant deaths per 100,000 live births. Rankings for 2018 data were the same as in 2017. Causes of death are ranked according to number of deaths. Data table for Figure 4 includes the number of deaths under age 1 year for leading causes of infant death. Access data table for Figure 4.
SOURCE: NCHS, National Vital Statistics System, Mortality.
Summary
In 2018, a total of 2,839,205 resident deaths were registered in the United States—25,702 more deaths than in 2017. From 2017 to 2018, the age-adjusted death rate for the total population decreased 1.1%, and life expectancy at birth increased 0.1 year. Age-specific death rates between 2017 and 2018 decreased for age groups 15–24, 25–34, 45–54, 65–74, 75–84, and 85 and over.
The 10 leading causes of death in 2018 remained the same as in 2017. Age-adjusted death rates decreased for six leading causes and increased for two. Life expectancy at birth increased 0.1 year from 78.6 years in 2017 to 78.7 in 2018, largely because of decreases in mortality from cancer, unintentional injuries, chronic lower respiratory diseases, and heart disease. After increasing 0.2 year between 2010 and 2014, life expectancy decreased 0.3 year between 2014 and 2017 (2). The 0.1-year increase in the 2018 life expectancy estimate for the total population results in the same estimate before the increase began (78.7 in 2010), and is 0.2 year below the peak life expectancy of 78.9 in 2014.
In 2018, a total of 21,467 deaths occurred in children under 1 year, which was 868 fewer infant deaths than in 2017. The leading causes of infant death were the same in 2018 and 2017. The IMR decreased for 2 (unintentional injuries and cord and placental complications) of the 10 leading causes of infant death.
Definitions
Cause of death: Based on medical information—including injury diagnoses and external causes of injury—entered on death certificates filed in the United States. This information is classified and coded in accordance with the International Statistical Classification of Diseases and Related Health Problems, 10th Revision (ICD–10) (3).
Death rates: For 2018, based on population estimates for July 1, 2018, that are consistent with the April 1, 2010, census. These population estimates (as well as population figures for the 2010 census) are available on the National Center for Health Statistics’ (NCHS) website (4). Age-adjusted death rates are useful when comparing different populations because they remove the potential bias that can occur when the populations being compared have different age structures. NCHS uses the direct method of standardization; see Technical Notes of “Deaths: Final Data for 2017” (1) for more information.
Infant mortality rate (IMR): Computed by dividing the number of infant deaths in a calendar year by the number of live births registered for that same time period. IMR is the most widely used index for measuring the risk of dying during the first year of life.
Leading causes of death: Ranked according to the number of deaths assigned to rankable causes (5).
Life expectancy: The expected average number of years of life remaining at a given age. It is denoted by ex, which means the average number of subsequent years of life for someone now aged x. Life expectancy estimates for 2018 are based on a methodology first implemented with 2008 final mortality data (6). Life expectancies for 2017 and 2018 are estimated using final Medicare data.
Data source and methods
The data shown in this report reflect information collected by NCHS for 2017 and 2018 from death certificates filed in all 50 states and the District of Columbia and compiled into national data known as the National Vital Statistics System. Death rates shown in this report are calculated based on postcensal population estimates as of July 1, 2017, and July 1, 2018, which are consistent with the April 1, 2010, census. Differences between death rates were evaluated using a two-tailed z test.
Beginning in 2018, all states reported deaths using the 2003 revision of the U.S. Standard Certificate of Death which allows the reporting of more than one race (7). The race categories on the 2003 version of the certificate are consistent with the 1997 Office of Management and Budget (OMB) standard (8). In 2017, some deaths were reported using the 1989 revision of the U.S. Standard Certificate of Death which allows only a single race to be reported (9,10). Prior to 2018, to provide uniformity and comparability of data, records with more than one race reported were bridged to a single race category. Because race categories for 2017 and 2018 data are not comparable, data by race and ethnicity are not presented in this report.
About the authors
Jiaquan Xu, Sherry L. Murphy, Kenneth D. Kochanek, and Elizabeth Arias are with the National Center for Health Statistics, Division of Vital Statistics.
References
- Kochanek KD, Murphy SL, Xu JQ, Arias E. Deaths: Final data for 2017. National Vital Statistics Reports; vol 68 no 9. Hyattsville, MD: National Center for Health Statistics. 2019.
- Kochanek KD, Anderson RN, Arias E. Changes in life expectancy at birth, 2010–2018. NCHS Health E-Stats. 2020.
- World Health Organization. International statistical classification of diseases and related health problems, 10th revision (ICD–10). 5th ed. Geneva, Switzerland. 2016.
- U.S. Census Bureau. Annual estimates of the resident population by single year of age and sex for the United States: April 1, 2010 to July 1, 2018.
- Heron M. Deaths: Leading causes for 2017. National Vital Statistics Reports; vol 68 no 6. Hyattsville, MD: National Center for Health Statistics. 2019.
- Arias E. United States life tables, 2008. National Vital Statistics Reports; vol 61 no 3. Hyattsville, MD: National Center for Health Statistics. 2012.
- National Center for Health Statistics. 2003 revision of the U.S. standard certificate of death. 2003.
- Office of Management and Budget. Revisions to the standards for the classification of federal data on race and ethnicity. Fed Regist 62(210):58782. 1997.
- Tolson GC, Barnes JM, Gay GA, Kowaleski JL. The 1989 revision of the U.S. standard certificates and reports. National Center for Health Statistics. Vital Health Stat 4(28). 1991.
- Office of Management and Budget. Race and ethnic standards for federal statistics and administrative reporting. Statistical Policy Directive 15. Washington, DC. 1977.
Suggested citation
Xu JQ, Murphy SL, Kochanek KD, Arias E. Mortality in the United States, 2018. NCHS Data Brief, no 355. Hyattsville, MD: National Center for Health Statistics. 2020.
Copyright information
All material appearing in this report is in the public domain and may be reproduced or copied without permission; citation as to source, however, is appreciated.
National Center for Health Statistics
Jennifer H. Madans, Ph.D., Acting Director
Amy M. Branum, Ph.D., Acting Associate Director for Science
Division of Vital Statistics
Steven Schwartz, Ph.D., Director
Hanyu Ni, Ph.D., M.P.H., Associate Director for Science