Use of Yoga, Meditation, and Chiropractors Among U.S. Adults Aged 18 and Over
- Key findings
- Did the use of yoga, meditation, and chiropractors change from 2012 to 2017?
- Was there a difference in the use of yoga, meditation, and chiropractors by sex?
- Did the use of yoga, meditation, and chiropractors vary by age group?
- Did the use of yoga, meditation, and chiropractors vary by race and Hispanic origin?
- Summary
- Definition
- Data source and methods
- About the authors
- References
- Suggested citation
PDF Version (401 KB) | Visual Abstract
Tainya C. Clarke, Ph.D., M.P.H.; Patricia M. Barnes, M.A.; Lindsey I. Black, M.P.H.; Barbara J. Stussman, B.A.; and Richard L. Nahin, Ph.D., M.P.H.
Key findings
Data from the National Health Interview Survey, 2012 and 2017
- Among adults aged 18 and over, increases were seen from 2012 to 2017 in the use of yoga, meditation, and chiropractors during the past 12 months.
- Yoga was the most commonly used complementary health approach among U.S. adults in 2012 (9.5%) and 2017 (14.3%).
- In 2017, women were more likely to use yoga, meditation, and chiropractors in the past 12 months compared with men.
- Non-Hispanic white adults were more likely to use yoga, meditation, and chiropractors compared with Hispanic and non-Hispanic black adults.
Complementary health is the use of holistic or unconventional medicine with mainstream Western medicine for health and wellness (1,2). Past research has identified yoga, meditation, and seeing a chiropractor as some of the most commonly used approaches (3). This report examines changes over time in the percentage of adults who used yoga, meditation, and chiropractors in the past 12 months, as well as variation by sex, age, and race and Hispanic origin.
Keywords: complementary health, alternative health, National Health Interview Survey
Did the use of yoga, meditation, and chiropractors change from 2012 to 2017?
Increases were seen from 2012 to 2017 in the use of complementary health approaches in the past 12 months among U.S. adults for all modalities examined (Figure 1). The use of yoga increased from 9.5% to 14.3%, while the use of meditation increased more than threefold from 4.1% in 2012 to 14.2% in 2017. The use of chiropractors increased from 9.1% to 10.3%.
Figure 1. Age-adjusted percentage of adults who used yoga, meditation, or a chiropractor during the past 12 months, by year: United States, 2012 and 2017

1Significantly different from 2012 (p < 0.05).
NOTES: Estimates are age adjusted using the projected 2000 U.S. population as the standard population and three age groups: 18–44, 45–64, and 65 and over. Estimates are based on household interviews of a sample of the civilian noninstitutionalized population. Access data table for Figure 1 [PDF – 118 KB].
SOURCE: NCHS, National Health Interview Survey, 2012 and 2017.
Was there a difference in the use of yoga, meditation, and chiropractors by sex?
In 2017, women were more than twice as likely to use yoga in the past 12 months (19.8%) compared with men (8.6%) (Figure 2). Women were also more likely than men to use meditation (16.3% compared with 11.8%) and see a chiropractor (11.1% compared with 9.4%).
Figure 2. Age-adjusted percentage of adults who used yoga, meditation, or a chiropractor during the past 12 months, by sex: United States, 2017
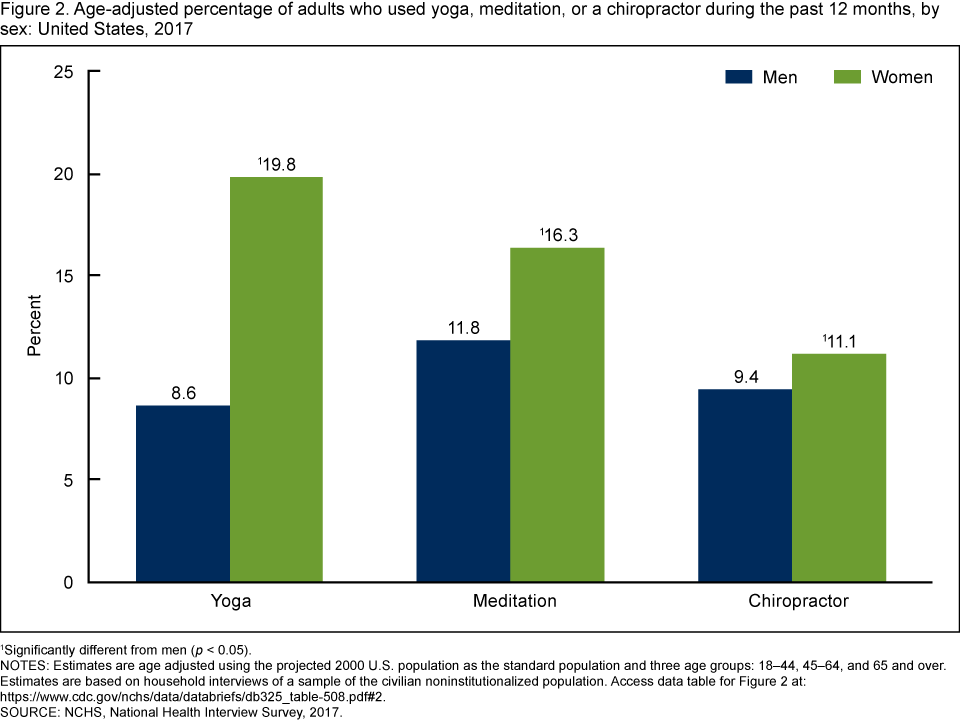
1Significantly different from men (p < 0.05).
NOTES: Estimates are age adjusted using the projected 2000 U.S. population as the standard population and three age groups: 18–44, 45–64, and 65 and over. Estimates are based on household interviews of a sample of the civilian noninstitutionalized population. Access data table for Figure 2 [PDF – 118 KB].
SOURCE: NCHS, National Health Interview Survey, 2017.
Did the use of yoga, meditation, and chiropractors vary by age group?
The use of yoga in the past 12 months was highest among adults aged 18–44 (17.9%) and decreased with increasing age (Figure 3). The use of yoga among adults aged 18–44 was more than twice that of adults aged 65 and over (6.7%). The use of meditation was higher among adults aged 45–64 (15.9%) compared with those aged 18–44 and 65 and over (13.4% each). Similarly, the proportion of adults aged 45–64 who saw a chiropractor (11.4%) was greater than those aged 18–44 (9.9%) and 65 and over (9.5%).
Figure 3. Percentage of adults who used yoga, meditation, or a chiropractor during the past 12 months, by age: United States, 2017
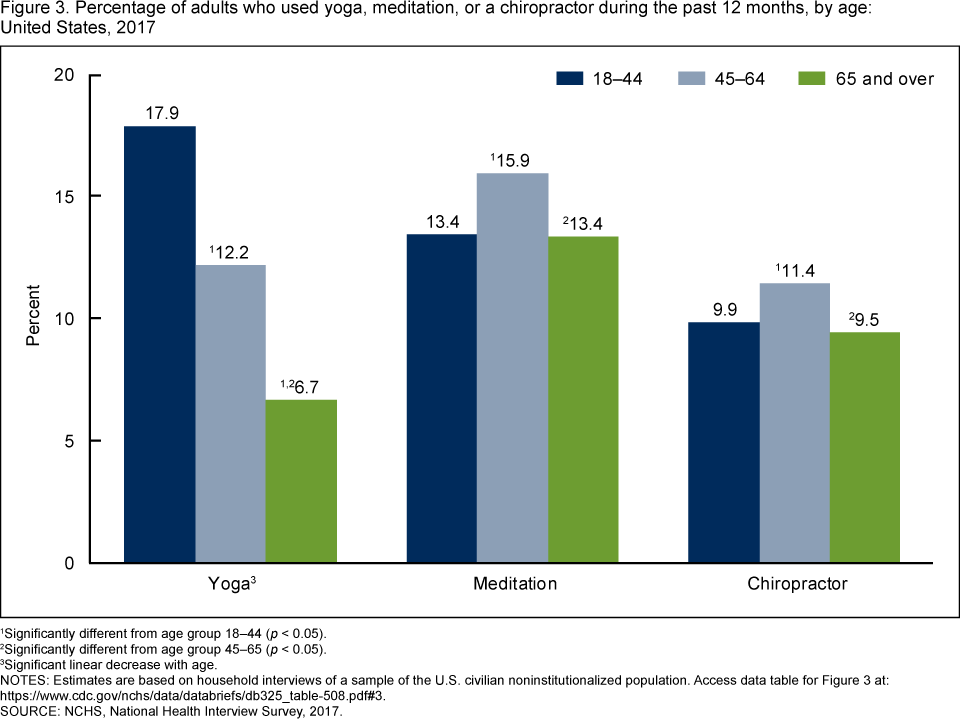
1Significantly different from age group 18–44 (p < 0.05).
2Significantly different from age group 45–64 (p < 0.05).
3Significant linear decrease with age.
NOTES: Estimates are based on household interviews of a sample of the U.S. civilian noninstitutionalized population. Access data table for Figure 3 [PDF – 118 KB].
SOURCE: NCHS, National Health Interview Survey, 2017.
Did the use of yoga, meditation, and chiropractors vary by race and Hispanic origin?
In 2017, non-Hispanic white adults were more likely to use yoga (17.1%) and see a chiropractor (12.7%) in the past 12 months compared with Hispanic (8.0% and 6.6%, respectively) and non-Hispanic black (9.3% and 5.5%, respectively) adults (Figure 4). The use of meditation was higher among non-Hispanic white (15.2%) and non-Hispanic black (13.5%) adults compared with Hispanic (10.9%) adults.
Figure 4. Age-adjusted percentage of adults who used yoga, meditation, or a chiropractor during the past 12 months, by race and Hispanic origin: United States, 2017

1Significantly different from non-Hispanic white adults (p < 0.05).
2Significantly different from non-Hispanic black adults (p < 0.05).
NOTES: Estimates are age adjusted using the projected 2000 U.S. population as the standard population and three age groups: 18–44, 45–64, and 65 and over. Estimates are based on household interviews of a sample of the civilian noninstitutionalized population. Access data table for Figure 4 [PDF – 118 KB].
SOURCE: NCHS, National Health Interview Survey, 2017.
Summary
The use of yoga, meditation, and chiropractors in the past 12 months among U.S. adults increased from 2012 to 2017. Of these, yoga and meditation had the largest percentage-point change. Women were more likely than men to use yoga, meditation, and chiropractors. Additionally, the use among non-Hispanic white adults was generally higher than among Hispanic and non-Hispanic black adults. The pattern of use by age varied for each approach.
Yoga was the most popular approach used in 2012 and 2017, with 9.5% (22.4 million) and 14.3% (35.2 million) adult users, respectively. In 2012, seeing a chiropractor was as popular as yoga, followed by meditation; however, the popularity of meditation surpassed that of seeing a chiropractor to become the second most-used approach among those examined in 2017. In recent years, the practice of yoga and meditation has become more mainstream (4–7). Most adults who see a chiropractor have health insurance coverage for this approach (8).
Definitions
Chiropractor: A person who performs hands-on therapy concerned with the diagnosis and treatment of mechanical disorders of the musculoskeletal system, primarily the spine, and its function.
Meditation: The act of engaging in mental exercise to reach a heightened level of spiritual awareness or mindfulness. This report uses a composite measure based on responses to three questions regarding the use of: 1) mantra meditation, including transcendental meditation, relaxation response, and clinically standardized meditation; 2) mindfulness meditation, including vipassana, Zen Buddhist meditation, mindfulness-based stress reduction, and mindfulness-based cognitive therapy; and 3) spiritual meditation, including centering prayer and contemplative meditation.
Race and Hispanic origin: Based on responses to two questions that determine Hispanic or Latino origin and race. Persons of Hispanic or Latino origin may be of any race. Non-Hispanic white and non-Hispanic black refer to persons with a single race group indicated. Data for persons of other races or with more than one race group indicated are not shown in this report.
Yoga: A combination of breathing exercises, meditation, and physical postures, of Hindu origin, used to achieve a state of relaxation and balance of mind, body, and spirit.
Data source and methods
Data from the 2012 and 2017 National Health Interview Survey (NHIS) were used for this analysis. NHIS is a nationally representative, continuously fielded cross-sectional household interview survey from the National Center for Health Statistics (NCHS), which produces annual estimates of the health of the U.S. civilian noninstitutionalized population. Interviews are conducted in respondents’ homes, with follow-ups to complete interviews conducted by telephone if needed. For further information about NHIS, including the questionnaire, visit the NHIS website.
Information on the use of complementary health approaches was collected from a sample of adults aged 18 and over who participated in the 2012 (n = 34,525) and 2017 (n = 26,742) NHIS adult alternative medicine or complementary health supplements, respectively. The percentage of adults who saw a chiropractor in the past 12 months was obtained from the “Adult Access to Health Care and Utilization” section of the Sample Adult Core questionnaire for both years.
Analyses were conducted using SAS-callable SUDAAN version 11.0.3 (9), which accounts for the complex sample design of NHIS. All estimates for adults were weighted using the annual sample weights for adults. Data weighting procedures are described in more detail elsewhere (10). The Taylor series linearization method was chosen for estimation of standard errors. Trend in use of yoga by age was evaluated using the Joinpoint Regression Program (11). Differences between percentages were evaluated using two-sided significance tests at the 0.05 level with no adjustments made for multiple comparisons. All estimates in this report meet NCHS standards of reliability as specified in “National Center for Health Statistics Data Presentation Standards for Proportions” (12).
About the authors
Tainya C. Clarke and Lindsey I. Black are with the National Center for Health Statistics, Division of Health Interview Statistics; Patricia M. Barnes is with the National Center for Health Statistics, Division of Research and Methodology; and Barbara J. Stussman and Richard L. Nahin are with the National Institutes of Health, National Center for Complementary and Integrative Health.
References
- National Center for Complementary and Integrative Health. Complementary, alternative, or integrative health: What’s in a name? NCCIH Publication No. D347. 2018.
- Bloom S. Holistic medicine vs. Western medicine. Livestrong: Holistic medicine. August 14, 2017.
- Clarke TC, Black LI, Stussman BJ, Barnes PM, Nahin RL. Trends in the use of complementary health approaches among adults: United States, 2002–2012 [PDF – 240 KB]. National Health Statistics Reports; no 79. Hyattsville, MD: National Center for Health Statistics. 2015.
- Wieczner J. Meditation has become a billion-dollar business. Fortune. March 12, 2016.
- Laurinavicius T. 10 hot mindfulness and meditation apps to watch. Forbes Technology. January 6, 2018.
- Nag M. 8 meditation gadgets to begin the week on a fresh note. Gadget Flow: Product roundups. June 19, 2017.
- Lisi AJ, Brandt CA. Trends in the use and characteristics of chiropractic services in the Department of Veterans Affairs. J Manipulative Physiol Ther 39(5):381–6. 2016.
- Nahin RL, Barnes PM, Stussman BJ. Insurance coverage for complementary health approaches among adult users: United States, 2002 and 2012. NCHS Data Brief, no 235. Hyattsville, MD: National Center for Health Statistics. 2016.
- RTI International. SUDAAN (Release 11.0.3) [computer software]. 2018.
- Parsons VL, Moriarity C, Jonas K, Moore TF, Davis KE, Tompkins L. Design and estimation for the National Health Interview Survey, 2006–2015 [PDF – 1.4 MB]. National Center for Health Statistics. Vital Health Stat 2(165). 2014.
- National Cancer Institute, Surveillance Research Program. Joinpoint Regression Program (Version 4.5.0.1) [computer software]. 2017.
- Parker JD, Talih M, Malec DJ, Beresovsky V, Carroll M, Gonzalez JF Jr, et al. National Center for Health Statistics Data Presentation Standards for Proportions. National Center for Health Statistics. Vital Health Stat 2(175). 2017.
Suggested citation
Clarke TC, Barnes PM, Black LI, Stussman BJ, Nahin RL. Use of yoga, meditation, and chiropractors among U.S. adults aged 18 and over. NCHS Data Brief, no 325. Hyattsville, MD: National Center for Health Statistics. 2018.
Copyright information
All material appearing in this report is in the public domain and may be reproduced or copied without permission; citation as to source, however, is appreciated.
National Center for Health Statistics
Charles J. Rothwell, M.S., M.B.A., Director
Jennifer H. Madans, Ph.D., Associate Director for Science
Division of Health Interview Statistics
Stephen J. Blumberg, Ph.D., Director
Robin A. Cohen, Ph.D., Acting Associate Director for Science
Division of Research and Methodology
Jennifer D. Parker, Ph.D., Director
Donald J. Malec, Ph.D., Associate Director for Science