Insurance Coverage for Complementary Health Approaches Among Adult Users: United States, 2002 and 2012
- Key findings
- The use of acupuncture, chiropractic, and massage therapy increased between 2002 and 2012.
- Although increases were observed in the percentage of adults who saw a practitioner for acupuncture, chiropractic, or massage therapy and did not have health insurance coverage for these visits, no changes were observed among those who saw a practitioner and had coverage for these complementary health approaches.
- Adults who had health insurance coverage for acupuncture, chiropractic, or massage therapy were more likely to have partial than complete coverage.
- Summary
- Definitions
- Data source and methods
- About the authors
- References
- Suggested citation
NCHS Data Brief No. 235, January 2016
PDF Version (692 KB)
Richard L. Nahin, Ph.D., M.P.H.; Patricia M. Barnes, M.A.; and Barbara J. Stussman, B.A.
Key findings
Data from the 2002 and 2012 National Health Interview Surveys
- Between 2002 and 2012, the use of acupuncture, chiropractic, and massage therapy increased among adults who did not have health insurance coverage for these complementary health approaches. No change in use was observed among those who had coverage for these approaches.
- While 60% of adults who saw a practitioner for chiropractic had at least some health insurance coverage for this approach, far fewer adults seeing a practitioner for acupuncture (25%) or massage therapy (15%) had coverage for these approaches.
- Adults who saw practitioners for acupuncture and chiropractic—and had health insurance coverage for these approaches—were more likely to have partial than complete coverage.
Between 30% and 40% of U.S. adults have used complementary health approaches in a given year (1–4). According to national surveys, the type of health insurance an individual holds affects whether they use these approaches (2–5). Health insurance coverage for individual complementary health approaches, however, has not been as widely studied. The most recent national data on this topic was released nearly 20 years ago (1). Recognizing that health insurance benefits have changed over this period, this report presents estimates of insurance coverage among adult users of the three most commonly licensed practitioner-based complementary health approaches in the United States (acupuncture, chiropractic, and massage therapy) (6), using data from the 2002 and 2012 National Health Interview Surveys (NHIS).
Keywords: health insurance, National Health Interview Survey (NHIS)
The use of acupuncture, chiropractic, and massage therapy increased between 2002 and 2012.
- In both 2002 and 2012, a significantly larger percentage of adults saw a practitioner for chiropractic (7.5% in 2002 and 8.3% in 2012) than for acupuncture (1.1% in 2002 and 1.5% in 2012) or massage therapy (5.0% in 2002 and 6.9% in 2012) (Figure 1).
- In both 2002 and 2012, a significantly larger percentage of adults saw a practitioner for massage therapy (5.0% in 2002 and 6.9% in 2012) than for acupuncture (1.1% in 2002 and 1.5% in 2012).
- For each of the three practitioner-based complementary health approaches examined, there was a significant increase in use between 2002 and 2012. The absolute increase in use ranged from 1.6% for massage therapy to 0.4% for acupuncture.
Figure 1. Age-adjusted percentages of adults who saw a practitioner for acupuncture, chiropractic, and massage therapy: United States, 2002 and 2012
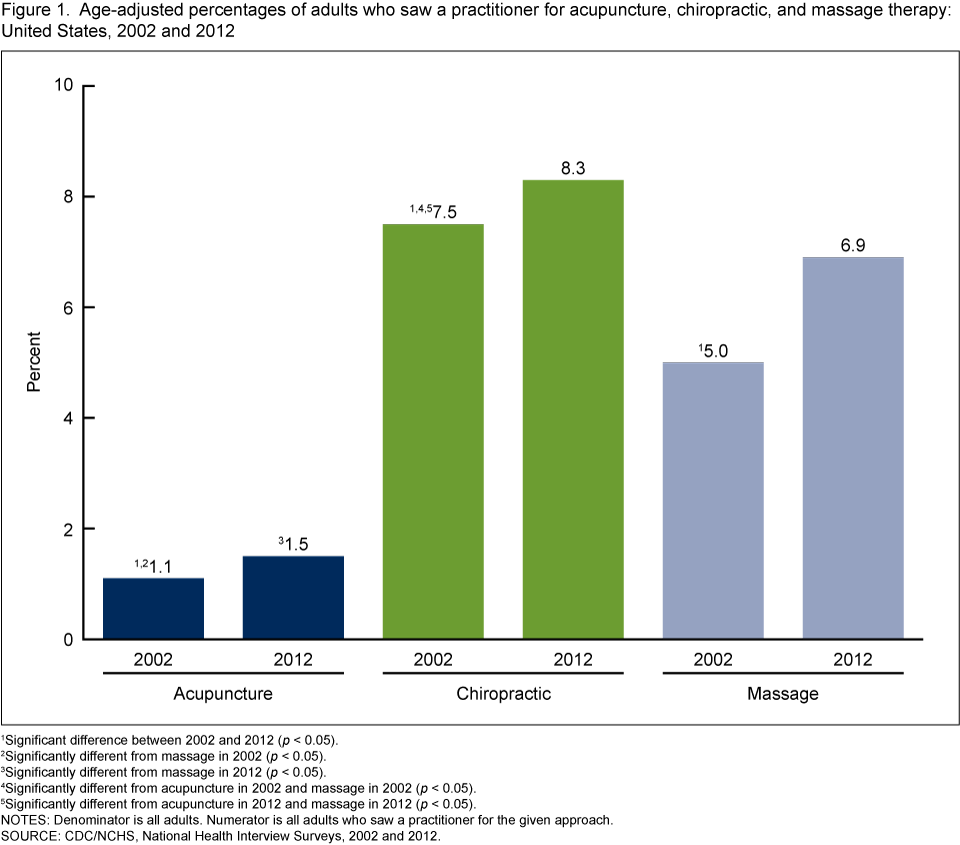
1Significant difference between 2002 and 2012 (p < 0.05).
2Significantly different from massage in 2002 (p < 0.05).
3Significantly different from massage in 2012 (p < 0.05).
4Significantly different from acupuncture in 2002 and massage in 2002 (p < 0.05).
5Significantly different from acupuncture in 2012 and massage in 2012 (p < 0.05).
NOTES: Denominator is all adults. Numerator is all adults who saw a practitioner for the given approach.
SOURCE: CDC/NCHS, National Health Interview Surveys, 2002 and 2012.
Although increases were observed in the percentage of adults who saw a practitioner for acupuncture, chiropractic, or massage therapy and did not have health insurance coverage for these visits, no changes were observed among those who saw a practitioner and had coverage for these complementary health approaches.
- In both 2002 and 2012, most adults who saw a practitioner for acupuncture or massage therapy did not have health insurance coverage for these complementary health approaches (p < 0.05). However, most adults who saw a practitioner for chiropractic had coverage for this approach (p < 0.05) (Figure 2).
- Between 2002 and 2012, there was a significant increase in the percentage of adults who saw a practitioner for acupuncture but did not have health insurance coverage for this approach (0.6% in 2002 and 1.1% in 2012). No difference was observed between 2002 and 2012 in the percentage of adults who saw a practitioner for acupuncture and had health insurance coverage (0.3% in 2002 and 0.4% in 2012) for this approach.
- Between 2002 and 2012, there was a significant increase in the percentage of adults who saw a practitioner for chiropractic but did not have health insurance coverage for this approach (2.2% in 2002 and 3.3% in 2012). No difference was observed between 2002 (4.8%) and 2012 (5.1%) in the percentage of adults who saw a practitioner for chiropractic and had coverage for this approach.
- Between 2002 and 2012, there was a significant increase in the percentage of adults who saw a practitioner for massage therapy but did not have health insurance coverage for this approach (3.8% in 2002 and 5.8% in 2012). No difference was observed between 2002 (0.7%) and 2012 (1.0%) in the percentage of adults who saw a practitioner for massage therapy and had coverage for this approach.
Figure 2. Age-adjusted percentages of adults who saw a practitioner for acupuncture, chiropractic, and massage therapy, by whether insurance covered any of the costs for the approach: United States, 2002 and 2012
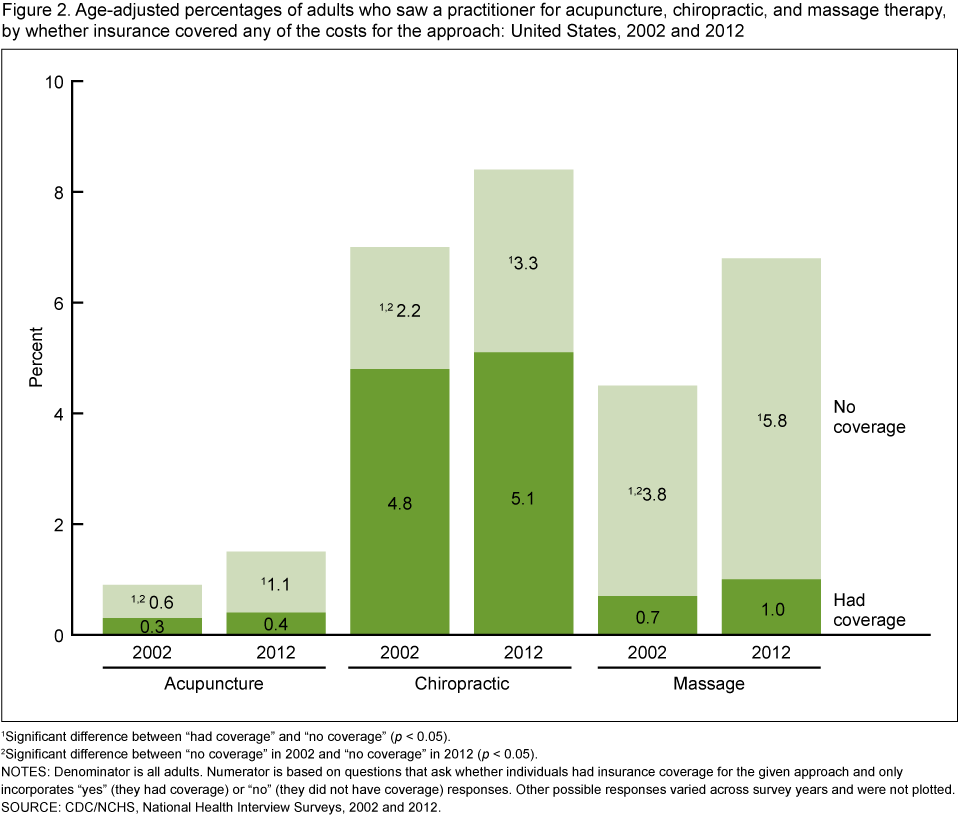
1Significant difference between “had coverage” and “no coverage” (p < 0.05).
2Significant difference between “no coverage” in 2002 and “no coverage” in 2012 (p < 0.05).
NOTES: Denominator is all adults. Numerator is based on questions that ask whether individuals had insurance coverage for the given approach and only incorporates “yes” (they had coverage) or “no” (they did not have coverage) responses. Other possible responses varied across survey years and were not plotted.
SOURCE: CDC/NCHS, National Health Interview Surveys, 2002 and 2012.
Adults who had health insurance coverage for acupuncture, chiropractic, or massage therapy were more likely to have partial than complete coverage.
- One-quarter of adults seeing a practitioner for acupuncture had health insurance coverage for this complementary health approach. These adults were significantly more likely to have partial (16.5%) than complete (8.5%) coverage (Figure 3).
- About 60% of adults seeing a practitioner for chiropractic reported having either partial or complete health insurance coverage for this approach. These adults were significantly more likely to report having partial (41.4%) than complete (18.7%) coverage.
- Only 15% of adults seeing a practitioner for massage therapy had either partial or complete health insurance coverage for this approach.
Figure 3. Age-adjusted percentages of adults seeing a practitioner for acupuncture, chiropractic, or massage therapy who reported that health insurance covered all, some, or none of the costs of using the approach: United States, 2012
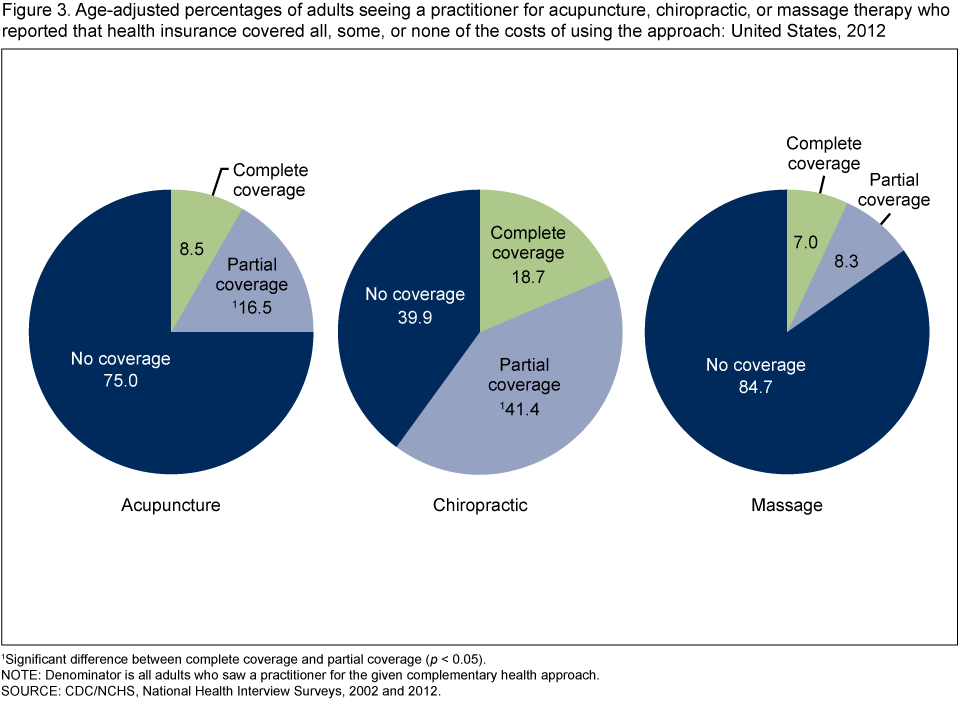
1Significant difference between complete coverage and partial coverage (p < 0.05).
NOTE: Denominator is all adults who saw a practitioner for the given complementary health approach.
SOURCE: CDC/NCHS, National Health Interview Surveys, 2002 and 2012.
Summary
While most adults who saw a practitioner for chiropractic had health insurance coverage for this complementary health approach, most adults who saw a practitioner for acupuncture and massage therapy did not have coverage for these approaches, according to data from the 2002 and 2012 NHIS. For acupuncture and chiropractic, adults with health insurance coverage were more likely to have only partial coverage than complete coverage.
Increased use of acupuncture, chiropractic, and massage therapy between 2002 and 2012 was previously noted (4). There was a significant increase in the percentage of adults who saw a practitioner for acupuncture, chiropractic, or massage therapy but did not have health insurance coverage for these approaches. No change in use was observed among those with insurance coverage. These data suggest that consumers are increasingly willing to pay out of pocket for the use of acupuncture, chiropractic, and massage.
Prior to this report, the only national data on insurance coverage for complementary health approaches were based on a 1997 telephone survey using random-digit dialing (1). Similar to the current data, Eisenberg et al. (1) found that most individuals using chiropractic had at least some health insurance coverage for this approach, while most individuals using massage therapy and acupuncture did not have coverage. Both the current report and Eisenberg et al. (1) found that coverage was more likely to be partial than complete. The amount and type of health insurance coverage for acupuncture, chiropractic, and massage therapy may change as state laws on coverage for these complementary health approaches continue to develop (7).
Definitions
Acupuncture: A family of procedures involving stimulation of anatomical points on the body by a variety of techniques. In its classical form, acupuncture is a characteristic component of traditional Chinese medicine.
Chiropractic: Involves the adjustment of the spine and joints to influence the body’s nervous system and natural defense mechanisms to alleviate pain and improve general health. Chiropractic is primarily used to treat back problems, headaches, nerve inflammation, muscle spasms, and other injuries and traumas.
Level of health insurance coverage: Level of coverage for complementary health approaches was determined from responses to the following questions: “During the past 12 months, were any of the costs of seeing a practitioner for [therapy] covered by health insurance?” and “During the past 12 months, did your health insurance cover all of the cost or just some of the cost of seeing a practitioner for [therapy]?”
Massage: Massage therapists manipulate muscle and connective tissue to enhance the function of these tissues and to promote relaxation and well-being.
Practitioner-based complementary health approaches: Complementary health approaches for which the services of a practitioner are generally necessary. Examples include acupuncture, chiropractic, and massage therapy.
Data source and methods
The estimates in this report are based on data from the 2002 and 2012 NHIS Adult Complementary and Alternative Medicine Supplements. The processes used to develop the supplements are described elsewhere (8). NHIS is a nationally representative, cross-sectional household interview survey that is fielded continuously by the Centers for Disease Control and Prevention’s (CDC) National Center for Health Statistics (NCHS) and produces annual estimates of the health of the U.S. civilian noninstitutionalized population. Interviews are conducted in respondents’ homes, but follow-ups to complete interviews may be conducted over the telephone. In 2002 and 2012, information was collected on a total of 31,044 and 34,525 adults aged 18 and over, respectively.
Analyses were conducted using SAS-callable SUDAAN version, 11.0.0 (9), which accounts for the complex sample design of NHIS. All estimates were weighted using the annual sample adult weights for their respective survey year. Estimates were age-adjusted, which allows for comparison across years of various sociodemographic subgroups that may have different age distributions. Age adjustment and data weighting procedures are described in more detail elsewhere (10). The Taylor series linearization method was chosen for estimation of standard errors. Differences between percentages were evaluated using two-sided significance tests at the 0.05 level.
About the authors
Richard L. Nahin and Barbara J. Stussman are with the National Institutes of Health, National Center for Complementary and Integrative Health. Patricia M. Barnes is with CDC’s National Center for Health Statistics, Research Data Center.
References
- Eisenberg DM, Davis RB, Ettner SL, Appel S, Wilkey S, Van Rompay M, Kessler RC. Trends in alternative medicine use in the United States, 1990–1997: Results of a follow-up national survey. JAMA 280(18):1569–75. 1998.
- Barnes PM, Powell-Griner E, McFann K, Nahin RL. Complementary and alternative medicine use among adults: United States, 2002. Advance data from vital and health statistics; no 343. Hyattsville, MD: National Center for Health Statistics. 2004.
- Barnes PM, Bloom B, Nahin RL. Complementary and alternative medicine use among adults and children: United States, 2007. National health statistics reports; no 12. Hyattsville, MD: National Center for Health Statistics. 2008.
- Clarke TC, Black LI, Stussman BJ, et al. Trends in the use of complementary health approaches among adults: United States, 2002–2012. National health statistics reports; no 79. Hyattsville, MD: National Center for Health Statistics. 2015.
- Black LI, Clarke TC, Barnes PM, et al. Use of complementary health approaches among children aged 4–17 years in the United States: National Health Interview Survey, 2007–2012. National health statistics reports; no 78. Hyattsville, MD: National Center for Health Statistics. 2015.
- Eisenberg DM, Cohen MH, Hrbek A, Grayzel J, Van Rompay MI, Cooper RA. Credentialing complementary and alternative medical providers. Ann Intern Med 137(12):965–73. 2002.
- Fan AY. “Obamacare” covers fifty-four million Americans for acupuncture as Essential Healthcare Benefit. J Integr Med 12(4):390–3. 2014.
- Stussman BJ, Bethell CD, Gray C, Nahin RL. Development of the adult and child complementary medicine questionnaires fielded on the National Health Interview Survey. BMC Complement Altern Med 13:328. 2013.
- RTI International. SUDAAN (Release 11.0) [computer software]. 2009.
- Parsons VL, Moriarity C, Jonas K, et al. Design and estimation for the National Health Interview Survey, 2006–2015. National Center for Health Statistics. Vital Health Stat 2(165). 2014.
Suggested citation
Nahin RL, Barnes PM, Stussman BJ. Insurance coverage for complementary health approaches among adult users: United States, 2002 and 2012. NCHS data brief, no 235. Hyattsville, MD: National Center for Health Statistics. 2016.
Copyright information
All material appearing in this report is in the public domain and may be reproduced or copied without permission; citation as to source, however, is appreciated.
National Center for Health Statistics
Charles J. Rothwell, M.S., M.B.A., Director
Nathaniel Schenker, Ph.D., Deputy Director
Jennifer H. Madans, Ph.D., Associate Director for Science
Division of Research and Methodology
Nathaniel Schenker, Ph.D., Acting Director
Donald Malec, Ph.D., Associate Director for Science