Continued Declines in Teen Births in the United States, 2015
- Key findings
- The 2015 teen birth rate fell to another historic low for the nation.
- Teen birth rates declined to historic lows for each race and Hispanic-origin group in 2015.
- Birth rates for younger teenagers fell to historic lows for nearly all race and Hispanic-origin groups in 2015.
- Birth rates for older teenagers fell to historic lows for all race and Hispanic-origin groups in 2015.
- Summary
- Definitions
- Data sources and methods
- About the authors
- References
- Suggested citation
NCHS Data Brief No. 259, September 2016
PDF Version (507 KB)
Brady E. Hamilton, Ph.D., and T.J. Mathews, M.S.
Key findings
Data from the National Vital Statistics System
- The teen birth rate declined to another historic low for the United States in 2015, down 8% from 2014 to 22.3 births per 1,000 females aged 15–19.
- The birth rates for teenagers aged 15–17 and 18–19 declined in 2015 to 9.9 and 40.7, respectively, which are record lows for both groups.
- In 2015, birth rates declined to 6.9 for Asian or Pacific Islander, 16.0 for non-Hispanic white, 25.7 for American Indian or Alaska Native, 31.8 for non-Hispanic black, and 34.9 for Hispanic female teenagers aged 15–19.
- Birth rates fell to record lows for nearly all race and Hispanic-origin groups of females aged 15–19, 15–17, and 18–19 in 2015.
The birth rate for teenagers aged 15–19 has fallen almost continuously since 1991, reaching historic lows for the nation every year since 2009 (1–4). Despite declines in all racial and ethnic groups, teen birth rates continue to vary considerably by race and ethnicity. Moreover, the U.S. teen birth rate remains higher than in other industrialized countries (5). Childbearing by teenagers continues to be a matter of public concern. This report presents the recent and long-term trends and disparity in teen childbearing by race and Hispanic origin.
Keywords: teen childbearing, race and Hispanic origin, National Vital Statistics System
The 2015 teen birth rate fell to another historic low for the nation.
- The birth rate for U.S. teenagers aged 15–19 fell 8% from 2014 to 2015, to 22.3 births per 1,000 females aged 15–19, falling below the record low set in 2014 (Figure 1). The rate for this group has declined 46% since 2007 and 64% since 1991.
- The birth rate for teenagers aged 15–17 fell 9% from 2014 to 2015, to 9.9 births per 1,000 females aged 15–17, a historic low. The rate for these younger teenagers was down 54% from 2007 and 74% from 1991.
- The rate for teenagers aged 18–19 dropped 7% from 2014 to 2015, to 40.7 births per 1,000 females aged 18–19, also a historic low. The rate for these older teenagers was down 43% from 2007 and 57% since 1991.
Figure 1. Birth rates for females aged 15–19, by age group: United States, 1991–2015
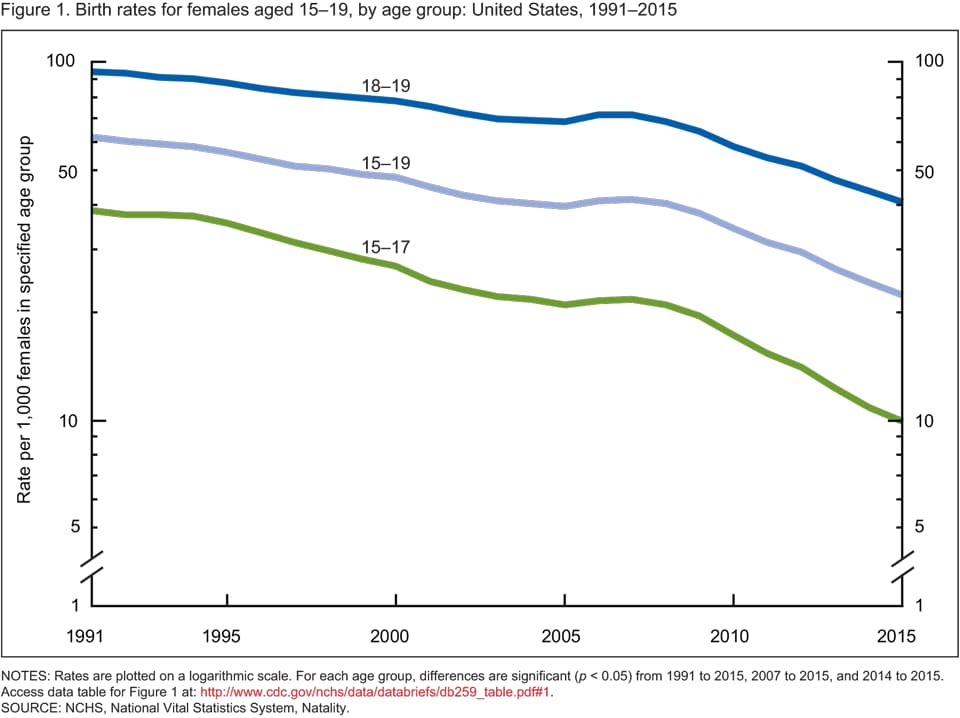
NOTES: Rates are plotted on a logarithmic scale. For each age group, differences are significant (p < 0.05) from 1991 to 2015, 2007 to 2015, and 2014 to 2015. Access data table for Figure 1.
SOURCE: NCHS, National Vital Statistics System, Natality.
Teen birth rates declined to historic lows for each race and Hispanic-origin group in 2015.
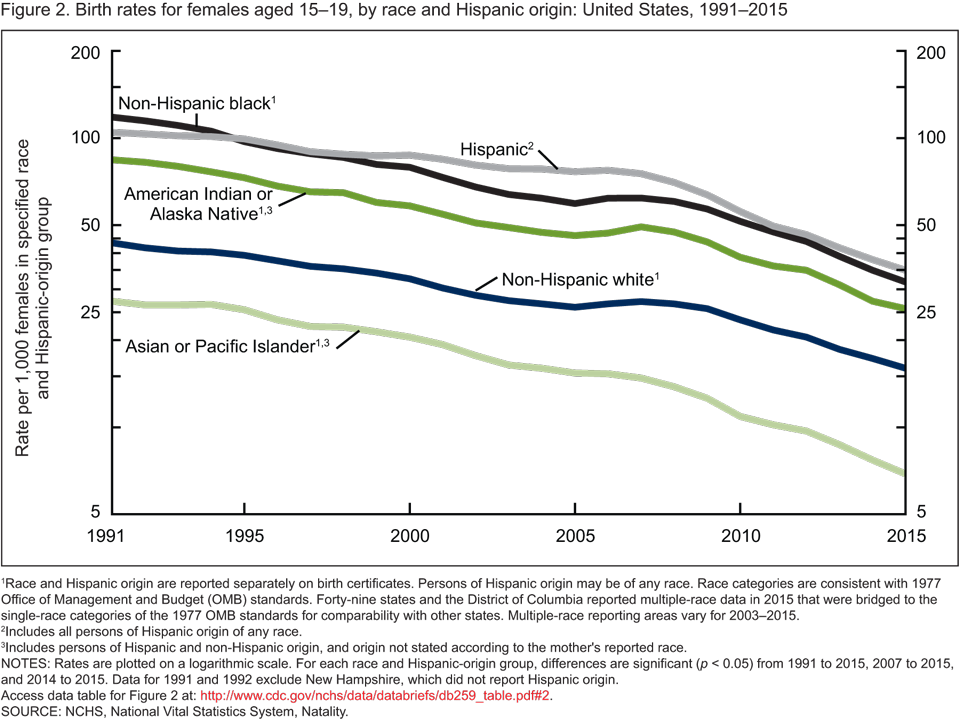
- From 2014 to 2015, the birth rate for females aged 15–19 declined 10% for Asian or Pacific Islander (API) (to 6.9), 9% for non-Hispanic black (31.8), 8% for both non-Hispanic white (16.0) and Hispanic (34.9), and 6% for American Indian or Alaska Native (AIAN) (25.7) females (Figure 2).
- Since 2007, declines in teen birth rates have ranged from 41% for non-Hispanic white females to 54% for Hispanic females. Since 1991, declines have ranged from 63% for non-Hispanic white females to 75% for API females.
- Differences in teen childbearing across the race and Hispanic-origin groups have narrowed from 1991 to 2015. In 1991, there was a difference of 77 births per 1,000 teenagers aged 15–19 between the lowest rate (27.3 for API females) and the highest rate (104.6 for Hispanic females), compared with a difference of 28 births between the lowest rate (6.9 for API females) and the highest rate (34.9 for Hispanic females) in 2015.
Figure 2. Birth rates for females aged 15–19, by race and Hispanic origin: United States, 1991–2015
1Race and Hispanic origin are reported separately on birth certificates. Persons of Hispanic origin may be of any race. Race categories are consistent with 1977 Office of Management and Budget (OMB) standards. Forty-nine states and the District of Columbia reported multiple-race data in 2015 that were bridged to the single-race categories of the 1977 OMB standards for comparability with other states. Multiple-race reporting areas vary for 2003–2015.
2Includes all persons of Hispanic origin of any race.
3Includes persons of Hispanic and non-Hispanic origin, and origin not stated according to the mother’s reported race.
NOTES: Rates are plotted on a logarithmic scale. For each race and Hispanic-origin group, differences are significant (p < 0.05) from 1991 to 2015, 2007 to 2015, and 2014 to 2015. Data for 1991 and 1992 exclude New Hampshire, which did not report Hispanic origin. Access data table for Figure 2.
SOURCE: NCHS, National Vital Statistics System, Natality.
Birth rates for younger teenagers fell to historic lows for nearly all race and Hispanic-origin groups in 2015.
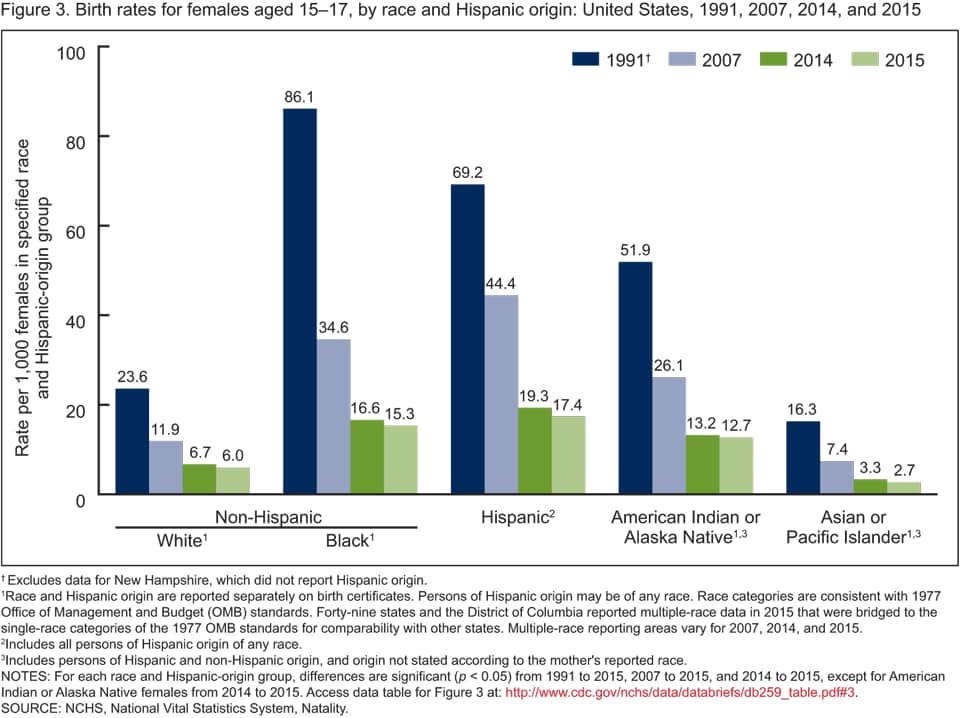
- In 2015, birth rates for younger teenagers (aged 15–17) declined from 2014 for the three largest race and Hispanic-origin groups: non-Hispanic white (down 10% from 2014 to 6.0 births per 1,000 teenagers aged 15–17), non-Hispanic black (down 8% to 15.3), and Hispanic females (down 10% to 17.4) (Figure 3). The rate for API teenagers declined 18% to 2.7; the rate for AIAN teenagers was essentially unchanged from 2014 to 2015.
- Birth rates for teenagers aged 15–17 have declined for each race and Hispanic-origin group over the last 2½ decades. From 2007 to 2015, declines ranged from 50% (non-Hispanic white teenagers) to 64% (API teenagers).
- The difference between the lowest and highest birth rates for the younger teenagers by race and Hispanic-origin group was 70 births per 1,000 females aged 15–17 in 1991 (16.3 for API teenagers and 86.1 for non-Hispanic black teenagers) compared with 15 births in 2015 (2.7 for API teenagers and 17.4 for Hispanic teenagers).
Figure 3. Birth rates for females aged 15–17, by race and Hispanic origin: United States, 1991, 2007, 2014, and 2015
† Excludes data for New Hampshire, which did not report Hispanic origin.
1Race and Hispanic origin are reported separately on birth certificates. Persons of Hispanic origin may be of any race. Race categories are consistent with 1977 Office of Management and Budget (OMB) standards. Forty-nine states and the District of Columbia reported multiple-race data in 2015 that were bridged to the single-race categories of the 1977 OMB standards for comparability with other states. Multiple-race reporting areas vary for 2007, 2014, and 2015.
2Includes all persons of Hispanic origin of any race.
3Includes persons of Hispanic and non-Hispanic origin, and origin not stated according to the mother’s reported race.
NOTES: For each race and Hispanic-origin group, differences are significant (p < 0.05) from 1991 to 2015, 2007 to 2015, and 2014 to 2015, except for American Indian or Alaska Native females from 2014 to 2015. Access data table for Figure 3.
SOURCE: NCHS, National Vital Statistics System, Natality.
Birth rates for older teenagers fell to historic lows for all race and Hispanic-origin groups in 2015.
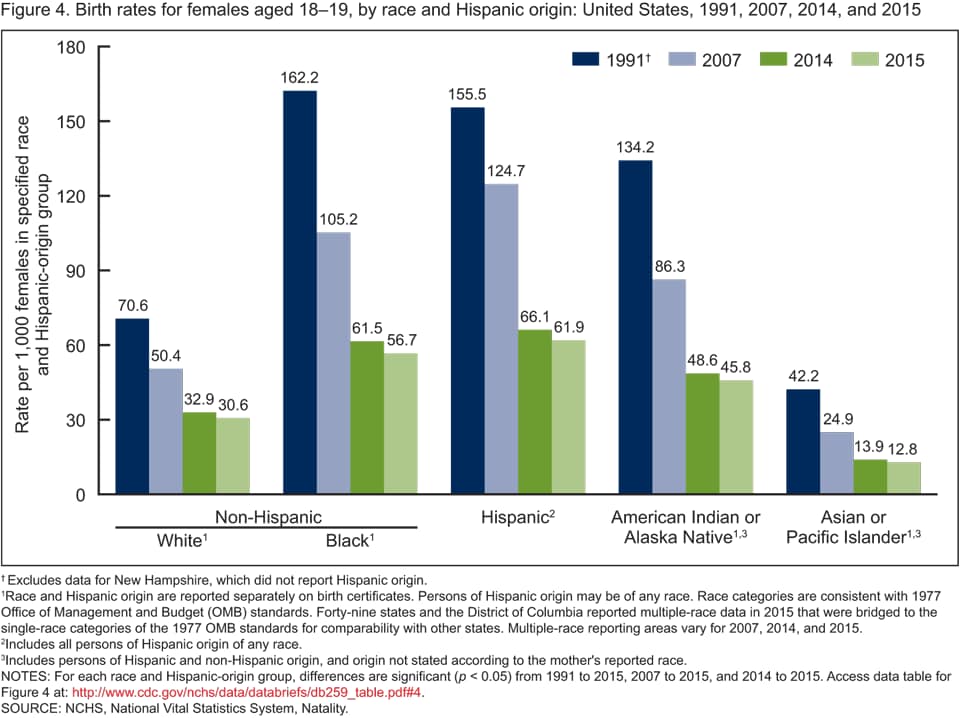
- Birth rates for non-Hispanic white, non-Hispanic black, and Hispanic females aged 18–19 declined from 2014 to 2015, down 7% (to 30.6 births per 1,000 females aged 18–19), 8% (to 56.7), and 6% (to 61.9), respectively (Figure 4). Rates were also down 8% for API (to 12.8) and 6% for AIAN females (to 45.8) in 2015.
- Birth rates for teenagers aged 18–19 have declined for each race and Hispanic-origin group since 2007. Recent declines from 2007 to 2015 ranged from 39% (non-Hispanic white females) to 50% (Hispanic females).
- The difference for the older teenagers between the lowest and highest birth rates by race and Hispanic-origin group was 120 births per 1,000 females aged 18–19 in 1991 (42.2 for API teenagers and 162.2 for non-Hispanic black teenagers) compared with 49 births in 2015 (12.8 for API teenagers and 61.9 for Hispanic teenagers).
Figure 4. Birth rates for females aged 18–19, by race and Hispanic origin: United States, 1991, 2007, 2014, and 2015
† Excludes data for New Hampshire, which did not report Hispanic origin.
1Race and Hispanic origin are reported separately on birth certificates. Persons of Hispanic origin may be of any race. Race categories are consistent with 1977 Office of Management and Budget (OMB) standards. Forty-nine states and the District of Columbia reported multiple-race data in 2015 that were bridged to the single-race categories of the 1977 OMB standards for comparability with other states. Multiple-race reporting areas vary for 2007, 2014, and 2015.
2Includes all persons of Hispanic origin of any race.
3Includes persons of Hispanic and non-Hispanic origin, and origin not stated according to the mother’s reported race.
NOTES: For each race and Hispanic-origin group, differences are significant (p < 0.05) from 1991 to 2015, 2007 to 2015, and 2014 to 2015. Access data table for Figure 4.
SOURCE: NCHS, National Vital Statistics System, Natality.
Summary
In 2015, teen birth rates for the nation declined to record lows for nearly all age and race and Hispanic-origin groups. As a result of these declines, particularly with large long-term declines for the groups with higher rates, differences in rates across race and Hispanic-origin groups have narrowed for teenagers aged 15–19, and for both younger (aged 15–17) and older (aged 18–19) teenagers (2–4,6). A number of factors have been cited in the downward trend in teen birth rates since 1991, including declines in the proportion of teenagers who have ever had sex and, for sexually active teenagers, increases in the use of effective contraception and practices, as well as increases in teen pregnancy prevention programs (7–12). Research has also shown diminished differences by race and Hispanic ethnicity in contraceptive use at first and most recent sex (7). Despite the large declines in teen childbearing outlined in this report, the U.S. birth rate remains higher than in other industrialized countries, and disparities in rates of teen childbearing by race and Hispanic origin persist (1–6).
Definitions
Teen birth rate: The number of births to females aged 15–19 (or other teen age group) per 1,000 females aged 15–19 (or other teen age group).
Race and Hispanic origin: Race and Hispanic origin are reported separately on birth certificates. Persons of Hispanic origin may be of any race. Persons of non-Hispanic ancestry are further classified by race because of substantial differences in fertility and maternal characteristics between Hispanic and non-Hispanic persons. Persons of AIAN and API ancestry are not classified separately by Hispanic origin because the majority of these persons are non-Hispanic. Multiple-race data reported since 2003 were bridged to single-race categories for comparability among states and for trend analyses (1–3,13).
Data sources and methods
This report contains data from the birth data set, which is part of the National Vital Statistics System (NVSS) (1,3,13). NVSS includes all live births reported in the United States and is based on information derived from birth certificates. The birth data set is the primary data set for analyzing birth trends and patterns in the United States. Birth data sets (based on final birth data) are available from: https://www.cdc.gov/nchs/data_access/vitalstatsonline.htm.
Rates for Hispanic, non-Hispanic white, and non-Hispanic black females in 1991 and 1992 exclude data for New Hampshire, which did not report Hispanic origin (1,3).
References to increases or decreases in rates indicate that differences are statistically significant at the 0.05 level.
About the authors
Brady E. Hamilton and T.J. Mathews are with the National Center for Health Statistics, Division of Vital Statistics, Reproductive Statistics Branch.
References
- Martin JA, Hamilton BE, Osterman MJK, et al. Births: Final data for 2015. National vital statistics reports. Hyattsville, MD: National Center for Health Statistics. In press 2016.
- Hamilton BE, Martin JA, Osterman MJK. Births: Preliminary data for 2015. National vital statistics reports; vol 65 no 3. Hyattsville, MD: National Center for Health Statistics. 2016.
- Hamilton BE, Martin JA, Osterman MJK, et al. Births: Final data for 2014. National vital statistics reports; vol 64 no 12. Hyattsville, MD: National Center for Health Statistics. 2015.
- Ventura SJ, Hamilton BE, Mathews TJ. National and state patterns of teen births in the United States, 1940–2013. National vital statistics reports; vol 63 no 4. Hyattsville, MD: National Center for Health Statistics. 2014.
- United Nations Department of Economic and Social Affairs, Statistics Division. Demographic yearbook 2014. Table 10. Live births by age of mother and sex of child, general and age-specific fertility rates: Latest available year, 2005–2014. New York, NY: United Nations. 2015.
- Romero L, Pazol K, Warner L, Cox S, Kroelinger C, Besera G, et al. Reduced disparities in birth rates among teens aged 15–19 years—United States, 2006–2007 and 2013–2014. MMWR 65(16):409–14. 2016.
- Martinez G, Copen CE, Abma JC. Teenagers in the United States: Sexual activity, contraceptive use, and childbearing, 2006–2010 National Survey of Family Growth. National Center for Health Statistics. Vital Health Stat 23(31). 2011.
- Santelli JS, Lindberg LD, Finer LB, Singh S. Explaining recent declines in adolescent pregnancy in the United States: The contribution of abstinence and improved contraceptive use. Am J Public Health 97(1):150–6. 2007.
- Lindberg L, Santelli J, Desai S. Understanding the decline in adolescent fertility in the United States, 2007–2012. J Adolesc Health. In press 2016.
- Kirby D. Emerging answers 2007: Research findings on programs to reduce teen pregnancy and sexually transmitted diseases. Washington, DC: The National Campaign to Prevent Teen and Unplanned Pregnancy. 2007.
- Oringanje C, Meremikwu MM, Eko H, Esu E, Meremikwu A, Ehiri JE. Interventions for preventing unintended pregnancies among adolescents. Cochrane Database Syst Rev (4):CD005215. 2009.
- Suellentrop K. What works 2011–2012: Curriculum-based programs that help prevent teen pregnancy. Washington, DC: The National Campaign to Prevent Teen and Unplanned Pregnancy. 2011.
- National Center for Health Statistics. The public use natality file—2015 update. Hyattsville, MD. 2016.
Suggested citation
Hamilton BE, Mathews TJ. Continued declines in teen births in the United States, 2015. NCHS data brief, no 259. Hyattsville, MD: National Center for Health Statistics. 2016.
Copyright information
All material appearing in this report is in the public domain and may be reproduced or copied without permission; citation as to source, however, is appreciated.
National Center for Health Statistics
Charles J. Rothwell, M.S., M.B.A., Director
Jennifer H. Madans, Ph.D., Associate Director for Science
Division of Vital Statistics
Delton Atkinson, M.P.H., M.P.H., P.M.P., Director
Hanyu Ni, Ph.D., M.P.H., Associate Director for Science