Hypertension Among Adults in the United States, 2009–2010
- Key findings
- What was the age-adjusted prevalence of hypertension among U.S. adults, and were there differences by age, gender, or race and Hispanic origin?
- Has overall awareness, treatment, and control of hypertension changed since 2007–2008?
- Did the age-adjusted awareness and treatment of hypertension among U.S. adults with hypertension differ by age, gender, or race and Hispanic origin?
- Did the age-adjusted control of hypertension among adults with hypertension differ by age, gender, or race and Hispanic origin in the United States in 2009–2010?
- Summary
- Definitions
- Data source and methods
- About the authors
- References
- Suggested citation
NCHS Data Brief No. 107, October 2012
PDF Version (752 KB)
Sung Sug Yoon, R.N., Ph.D.; Vicki Burt, R.N., Sc.M.; Tatiana Louis, M.S.; and Margaret D. Carroll, M.S.P.H.
Key findings
Data from the National Health and Nutrition Examination Survey, 2009–2010
- The overall age-adjusted prevalence of hypertension among U.S. adults aged 18 and over was 28.6% in 2009–2010; there was no significant change from 2007–2008 (29.7%).
- Among adults with hypertension in 2009–2010, 81.9% were aware of their hypertension.
- Among adults with hypertension in 2009–2010, 76.4% were currently taking medication to lower their blood pressure.
- The age-adjusted percentage of adults with hypertension whose blood pressure was controlled increased from 48.4% in 2007–2008 to 53.3% in 2009–2010.
Significant increases have been seen over the past 10 years in hypertension awareness, treatment, and control among adults with hypertension. However, less than 50% of adults with hypertension controlled their blood pressure (BP) in 2007–2008 (1). The high prevalence of undiagnosed and uncontrolled hypertension, especially among minority groups, remains a challenge (2,3). A recent prediction model showed that every 10% increase in hypertension treatment could prevent an additional 14,000 deaths per year in the adult population ages 25–79 (4). This report examines the most recent national data on hypertension prevalence, awareness, treatment, and control.
Keywords: hypertension prevalence, hypertension treatment, high blood pressure
What was the age-adjusted prevalence of hypertension among U.S. adults, and were there differences by age, gender, or race and Hispanic origin?
- The age-adjusted prevalence of hypertension among U.S. adults aged 18 and over was 28.6% in 2009–2010 (Figure 1). There was no significant change from 2007–2008.
- The prevalence of hypertension was 6.8% among those aged 18–39, 30.4% for those aged 40–59, and 66.7% for those aged 60 and over.
- The age-adjusted prevalence of hypertension was higher among non-Hispanic black persons (40.4%) than among non-Hispanic white persons (27.4%) or Hispanic persons (26.1%).
Figure 1. Age-specific and age-adjusted prevalence of hypertension among adults aged 18 and over: United States, 2009–2010
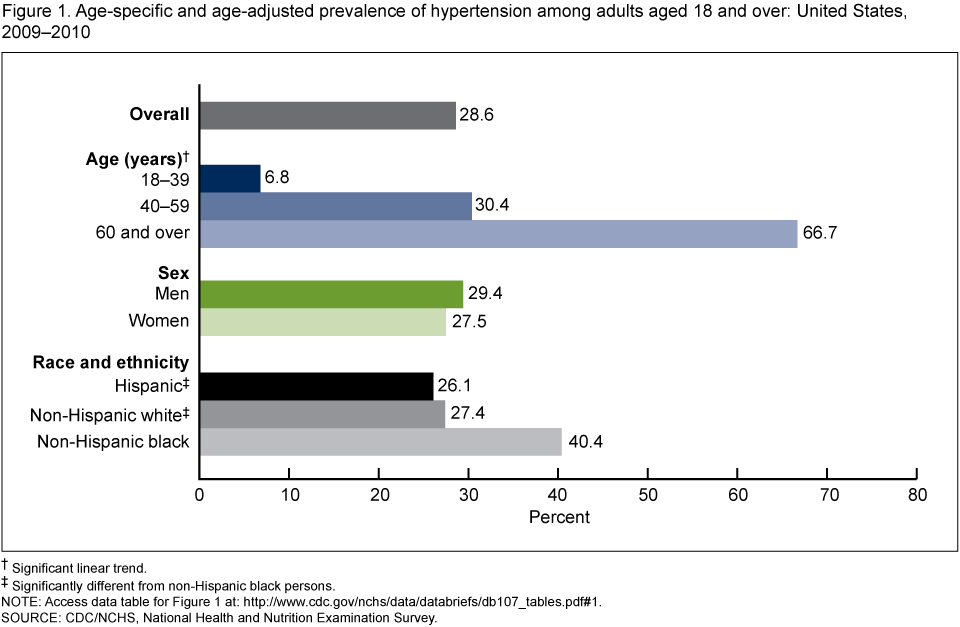
†Significant linear trend.
‡Significantly different from non-Hispanic black persons.
NOTE: Access data table for Figure 1 [PDF – 16 KB].
SOURCE: CDC/NCHS, National Health and Nutrition Examination Survey.
Has overall awareness, treatment, and control of hypertension changed since 2007–2008?
- Among adults with hypertension in 2009–2010, 81.9% were aware of their hypertension and 76.4% reported currently taking prescribed medication to lower their BP (Figure 2). There was no change from 2007–2008 in the awareness and treatment of hypertension.
- Among adults with hypertension, the percentage with controlled hypertension increased from 48.4% in 2007–2008 to 53.3% in 2009–2010.
Figure 2. Age-adjusted awareness, treatment, and control of hypertension among adults with hypertension: United States, 2007–2010
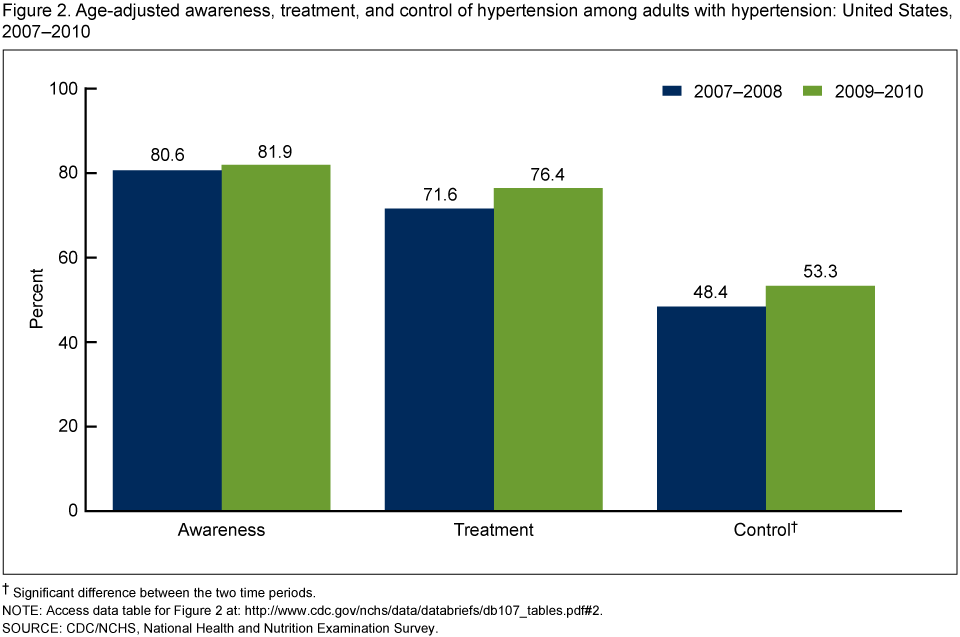
†Significant difference between the two time periods.
NOTE: Access data table for Figure 2 [PDF – 16 KB].
SOURCE: CDC/NCHS, National Health and Nutrition Examination Survey.
Did the age-adjusted awareness and treatment of hypertension among U.S. adults with hypertension differ by age, gender, or race and Hispanic origin?
- Among adults with hypertension, awareness of hypertension among those aged 18–39 (58.7%) was lower than among those aged 40–59 (84.1%) and those aged 60 and over (84.1%) (Figure 3). Current use of medication to lower BP showed a similar tendency (46.0% for those aged 18–39 compared with 77.1% for ages 40–59 and 80.7% for ages 60 and over). There were no significant differences in the awareness and treatment of hypertension between adults aged 40–59 and those aged 60 and over.
- Men with hypertension were less likely than women to be aware of their condition and to be currently taking antihypertensive medication. Awareness among men was 79.6% compared with 84.9% for women; treatment among men was 73.1% compared with 80.6% for women.
- Non-Hispanic black adults were more aware of their hypertension (87.0%) than were Hispanic adults (77.7%). Also, Hispanic adults with hypertension were less likely to take antihypertensive medication (69.6%) compared with non-Hispanic white adults (76.6%) and non-Hispanic black adults (79.7%).
Figure 3. Age-specific and age-adjusted awareness and treatment of hypertension among adults with hypertension: United States, 2009–2010
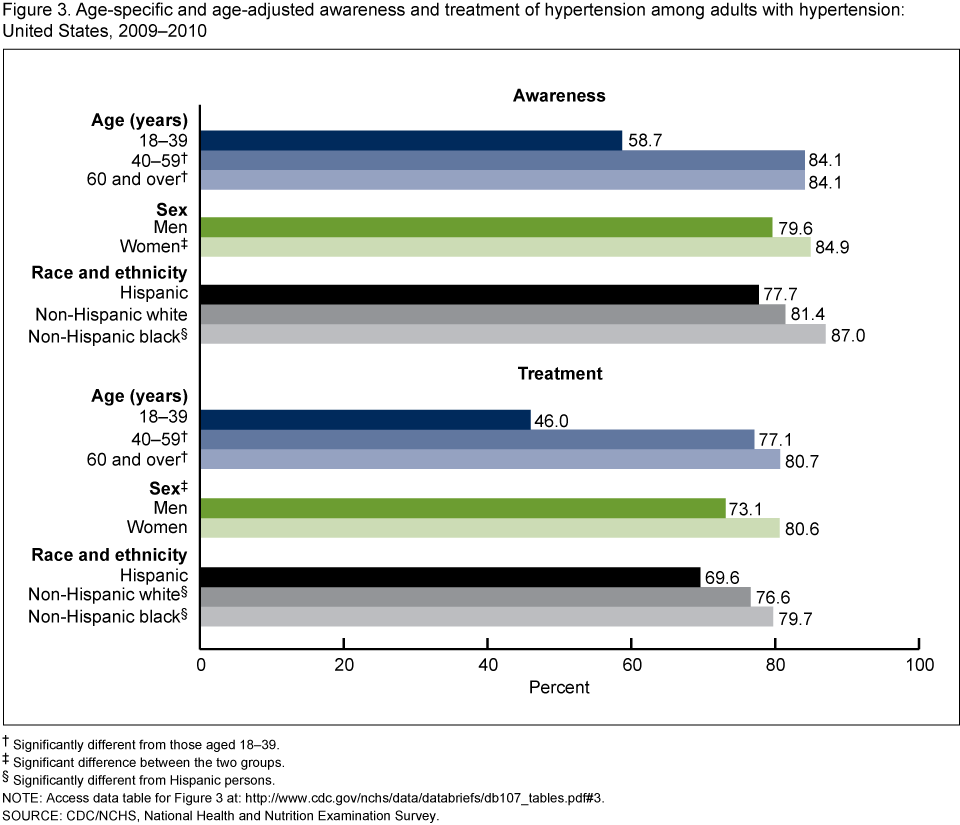
†Significantly different from those aged 18–39.
‡Significant difference between the two groups.
§Significantly different from Hispanic persons.
NOTE: Access data table for Figure 3 [PDF – 16 KB].
SOURCE: CDC/NCHS, National Health and Nutrition Examination Survey.
Did the age-adjusted control of hypertension among adults with hypertension differ by age, gender, or race and Hispanic origin in the United States in 2009–2010?
- Among adults with hypertension, those aged 18–39 were less likely to have controlled high BP (32.8%) than those aged 40–59 (55.7%) or 60 and over (54.9%) (Figure 4).
- Age-adjusted hypertension control among adults with hypertension was higher for women (57.5%) than for men (50.4%).
- Age-adjusted control of hypertension was greater among non-Hispanic white adults with hypertension (56.3%) compared with non-Hispanic black adults (47.9%) and Hispanic adults (40.7%) with hypertension.
Figure 4. Age-specific and age-adjusted control of hypertension among adults with hypertension: United States, 2009–2010

†Significantly different from those aged 18–39.
‡Significant difference between the two groups.
§Significantly different from non-Hispanic white persons.
NOTE: Access data table for Figure 4 [PDF – 16 KB].
SOURCE: CDC/NCHS, National Health and Nutrition Examination Survey.
Summary
The age-adjusted prevalence of hypertension among U.S. adults was 28.6% in 2009–2010. Among adults with hypertension, 81.9% were aware of their hypertension and 76.4% were currently taking medication to lower their BP. There have been significant increases in hypertension control over time among persons with hypertension, from 48.4% in 2007–2008 to 53.3% in 2009–2010.
Awareness, treatment, and control of hypertension in the U.S. adult population were significantly higher among women with hypertension than among men with hypertension. A higher percentage of non-Hispanic black adults with hypertension were aware of their hypertension and were taking medication to lower BP, compared with non-Hispanic white adults and Hispanic adults. However, non-Hispanic black adults had a lower percentage of hypertension control than non-Hispanic white adults. Hypertension control among non-Hispanic white adults was higher than among non-Hispanic black adults or Hispanic adults.
Definitions
Hypertension: Systolic BP greater than or equal to 140 mm Hg, or diastolic BP greater than or equal to 90 mm Hg, or currently taking medication to lower high BP (5,6).
Awareness of hypertension: An affirmative response to the question, “Have you ever been told by a doctor or health professional that you had hypertension, also called high blood pressure?” Calculated among those with hypertension. Estimates are age-adjusted among hypertensives.
Treatment for hypertension: Currently taking medication to lower BP, based on affirmative responses to the following questions: (a) “Because of your high blood pressure/hypertension, have you ever been told to take prescribed medicine?” and (b) “Are you now following this advice to take prescribed medicine?” Calculated among those with hypertension. Estimates are age-adjusted among hypertensives.
Controlled hypertension: Having systolic BP less than 140 mm Hg and diastolic BP less than 90 mm Hg among those with hypertension (3,4). Estimates are age-adjusted among hypertensives.
Data source and methods
Data for this report are from the National Health and Nutrition Examination Survey (NHANES), conducted by the Centers for Disease Control and Prevention’s (CDC) National Center for Health Statistics (NCHS). NHANES is a cross-sectional survey designed to monitor the health and nutritional status of the civilian, noninstitutionalized U.S. population (7). The survey consists of interviews conducted in the participant’s home; a standardized physical examination that includes measurement of BP, weight, and height, conducted in a mobile examination center; and laboratory tests utilizing the blood and urine specimens provided by the participant during the physical examination.
The NHANES sample is selected through a complex, multistage design that includes the selection of primary sampling units (i.e., counties), household segments within the counties, households within household segments, and sample participants from selected households. The sample design includes oversampling to obtain reliable estimates of health and nutritional measures for population subgroups. In 1999, NHANES became a continuous survey, fielded on an ongoing basis. Each year of data collection is based on a representative sample covering all ages. Public-use data files are released in 2-year cycles.
The average of up to three brachial systolic and diastolic BP readings was used to obtain systolic and diastolic values. Nearly all participants (98.3%) had two or three complete BP measurements. For participants with only one BP reading (1.4%), that single measurement was used. All BP readings were obtained during a participant’s physical examination. BP was measured in a mobile examination center by trained physicians following a standard protocol. Appropriate BP cuff sizes were used for participants based on measurement of mid-arm circumference.
Sample weights, which account for the differential probabilities of selection and are adjusted for nonresponse and noncoverage, were incorporated into the estimation process. Because of the complex multistage design of NHANES, the survey data must be weighted in order to produce national estimates. The standard errors of the percentages were estimated using Taylor series linearization, a method that incorporates the sample weights and accounts for the complex sample design.
Statistical analyses were performed using the statistical packages SAS for Windows, version 9.2 (SAS Institute, Cary, N.C.) and SUDAAN, version 10.0 (RTI International, Research Triangle Park, N.C.). Age-adjusted prevalence estimates were calculated for race and Hispanic origin and sex, using SUDAAN PROC DESCRIPT and the 2000 U.S. census projected population age groups of 18–39 years, 40–59 years, and 60 years and over (8). Age-adjusted prevalence of awareness, treatment, and control of hypertension were calculated using the subpopulation of persons who had hypertension. Differences in distribution of prevalence, awareness, treatment, and control by sex, age group, and race and Hispanic origin were tested using chi-squared tests. For comparison of estimates by age and race and Hispanic origin, adjustments for multiple comparisons were made using the Bonferroni method by dividing 0.05 by the number of implied comparisons. All differences reported are statistically significant unless otherwise indicated. Statistical tests were considered significant when p < 0.05 (two-tailed).
About the authors
Sung Sug (Sarah) Yoon, Vicki Burt, Tatiana Louis, and Margaret Carroll are with CDC’s National Center for Health Statistics, Division of Health and Nutrition Examination Surveys.
References
- Yoon S, Ostchega Y, Louis T. Recent trends in the prevalence of high blood pressure and its treatment and control, 1999–2008 [PDF – 1.16 MB]. NCHS data brief, no 48. Hyattsville, MD: National Center for Health Statistics. 2010.
- Fryar CD, Hirsch R, Eberhardt MS, et al. Hypertension, high serum total cholesterol, and diabetes: Racial and ethnic prevalence differences in U.S. adults, 1999–2006 [PDF – 1.2 MB]. NCHS data brief, no 36. Hyattsville, MD: National Center for Health Statistics. 2010.
- Gillespie C, Kuklina EV, Briss PA, Blair NA, Hong Y. Vital signs: Prevalence, treatment, and control of hypertension—United States, 1999–2002 and 2005–2008. MMWR 60(04):103–8. 2011.
- Farley TA, Dalal MA, Mostashari F, Frieden TR. Deaths preventable in the U.S. by improvements in use of clinical preventive services. Am J Prev Med 38(6):600–9. 2010.
- Chobanian AV, Bakris GL, Black HR, Cushman WC, Green LA, Izzo JL Jr, et al. The seventh report of the Joint National Committee on Prevention, Detection, Evaluation, and Treatment of High Blood Pressure: The JNC 7 report. JAMA 289(19):2560–72. 2003.
- National Heart Lung and Blood Institute. Health information for the public. Explore high blood pressure. 2012. Accessed May 2012.
- National Health and Nutrition Examination Survey (NHANES) examination manuals. Hyattsville, MD: National Center for Health Statistics. 1999–2000, 2001–2002, 2003–2004, 2005–2006. Accessed August 2012.
- Klein RJ, Schoenborn CA. Age adjustment using the 2000 projected U.S. population [PDF – 122 KB]. Healthy People 2010 statistical notes, no 20. Hyattsville, MD: National Center for Health Statistics. 2001.
Suggested citation
Yoon SS, Burt V, Louis T, Carroll MD. Hypertension among adults in the United States, 2009–2010. NCHS data brief, no 107. Hyattsville, MD: National Center for Health Statistics. 2012.
Copyright information
All material appearing in this report is in the public domain and may be reproduced or copied without permission; citation as to source, however, is appreciated.
National Center for Health Statistics
Edward J. Sondik, Ph.D., Director
Jennifer H. Madans, Ph.D., Associate Director for Science
Division of Health and Nutrition Examination Surveys
Clifford L. Johnson, M.S.P.H., Director