* Additional information is available at http://www.cdc.gov/nchs/tutorials/nhanes/faqs.htm.
† Available at https://www.cms.gov/PQRI.
Persons using assistive technology might not be able to fully access information in this file. For assistance, please send e-mail to: mmwrq@cdc.gov. Type 508 Accommodation and the title of the report in the subject line of e-mail.
On February 1, this report was posted as an MMWR Early Release on the MMWR website (http://www.cdc.gov/mmwr).
Background: Hypertension is a modifiable risk factor for cardiovascular disease. It affects one in three adults in the United States and contributes to one out of every seven deaths and nearly half of all cardiovascular disease--related deaths in the United States.
Methods: CDC analyzed data from the National Health and Nutrition Examination Survey (NHANES) on the prevalence, treatment, and control of hypertension among U.S. adults aged ≥18 years. Hypertension was defined as an average blood pressure ≥140/90 mmHg or the current use of blood pressure--lowering medication. Control of hypertension was reported as an average treated systolic/diastolic blood pressure <140/90 mmHg. Multivariate analysis was performed to assess changes in prevalence of hypertension, use of pharmacologic treatment, and control of blood pressure between the 1999--2002 and 2005--2008 survey cycles.
Results: During 2005--2008, approximately 68 million (31%) U.S. adults aged ≥18 years had hypertension, and this prevalence has shown no improvement in the past decade. Of these adults, 48 million (70%) were receiving pharmacologic treatment and 31 million (46%) had their condition controlled. Although 86% of adults with uncontrolled blood pressure had medical insurance, the prevalence of blood pressure control among adults with hypertension was especially low among participants who did not have a usual source of medical care (12%), received medical care less than twice in the previous year (21%), or did not have health insurance (29%). Control prevalence also was low among young adults (31%) and Mexican Americans (37%). Although the prevalence of hypertension did not change from 1999--2002 to 2005--2008, significant increases were observed in the prevalence of treatment and control.
Conclusions: Hypertension affects millions of persons in the United States, and less than half of those with hypertension have their condition controlled. Prevalence of treatment and control are even lower among persons who do not have a usual source of medical care, those who are not receiving regular medical care, and those who do not have health insurance.
Implications for Public Health Practice: To improve blood pressure control in the United States, a comprehensive approach is needed that involves policy and system changes to improve health-care access, quality of preventive care, and patient adherence to treatment. Nearly 90% of persons with uncontrolled hypertension have health insurance, indicating a need for health-care system improvements. Health-care system improvements, including use of electronic health records with registry and clinical decision support functions, could facilitate better treatment and follow-up management, and improve patient-physician interaction. Allied health professionals (e.g., nurses, dietitians, health educators and pharmacists) could help increase patient adherence to medications. Patient adoption of healthy behaviors could improve their blood pressure control. Reducing dietary intake of salt would greatly support prevention and control of hypertension; a 32% decrease in average daily consumption, from 3,400 mg to 2,300 mg, could reduce hypertension by as many as 11 million cases. Further reductions in sodium intake to 1,500 mg/day could reduce hypertension by 16.4 million cases.
Hypertension, a major risk factor for cardiovascular disease, affects approximately one in three adults in the United States. Every year, hypertension contributes to one out of every seven deaths in the United States and to nearly half of all cardiovascular disease--related deaths, including stroke (1). If all hypertensive patients were treated sufficiently to reach the goal specified in current clinical guidelines, 46,000 deaths might be averted each year (2). In addition to the cost in lives lost, hypertension is costly to the health-care system. The American Heart Association recently estimated that direct and indirect costs of hypertension are more than $93.5 billion per year, and that cardiovascular disease and stroke account for 17% of the total health expenditures in the United States annually (3).
This report uses data from the National Health and Nutrition Examination Survey (NHANES) to examine the prevalence, pharmacologic treatment, and control of hypertension among U.S. adults. The examination focuses on indicators of the use of medical care, as well as on demographic characteristics and socioeconomic factors.
NHANES is a complex, multistage probability sample of the noninstitutionalized population of the United States. Details of the NHANES methodology can be found elsewhere (4). Data from NHANES from 2005--2008, the most recent nationally representative data available on hypertension, were analyzed. During this time frame, 11,154 participants aged ≥18 years were interviewed and examined. Women who were pregnant or whose pregnancy status could not be determined (505) were excluded, as were participants who did not have at least one complete blood pressure measurement or information on current medication usage (617), or were missing covariates of interest (56), yielding an analytic sample of 10,037.
To examine changes over time, 1999--2002 NHANES data also were analyzed. From the 10,393 adult participants included in those data, 830 women who were pregnant or whose pregnancy status was unknown were excluded, as were 631 participants who were missing blood pressure information and 275 participants who were missing data on the covariates of interest, yielding a sample size of 8,851. Mobile examination center response rates for NHANES ranged from 75% to 80% during the study period.
This study used the average of up to three blood pressure measurements, obtained under standard conditions during a single physical examination at the mobile examination center (4). Approximately 95% of participants had two or three complete blood pressure measurements. For participants with only one blood pressure measurement, that single measurement was used in place of an average. Current use of blood pressure--lowering medication was determined based on participant self-report. Hypertension was defined as an average systolic blood pressure ≥140 mmHg, an average diastolic blood pressure ≥90 mmHg, or the current use of blood pressure--lowering medication. Treatment of blood pressure was defined as the self-reported current use of blood pressure--lowering medication, and its prevalence was calculated among all those defined as having hypertension. Blood pressure control was defined as a treated blood pressure <140 mmHg systolic and <90 mmHg diastolic, and its prevalence was calculated among all those with hypertension, as defined above (Figure 1).
Multivariate regression analysis was used to examine changes in prevalence of high blood pressure, blood pressure medication use, and pharmacologic control of high blood pressure from 1999--2002 to 2005--2008. All analyses were conducted using statistical software to account for sampling weights and adjust variances for the multistage, clustered sample designs. Population counts were calculated using the Current Population Surveys.*
The overall U.S. prevalence of hypertension among adults aged ≥18 years in 2005--2008 was 30.9% and was highest among persons aged ≥65 years (69.7%), non-Hispanic blacks (38.6%), and those participants with Medicare coverage (68.1%) (Table). Among persons with hypertension, the prevalence of pharmacologic treatment in 2005--2008 was 69.9%. The prevalence of treatment was lowest among persons aged 18--39 years (37.4%), Mexican Americans (56.1%), those without a usual source of medical care (19.8%), those who reported receiving medical care less than twice during the previous year (33.8%), and those without health insurance (43.5%). The overall prevalence of control among participants with hypertension was 45.8% during 2005--2008. The prevalence of control was lowest among persons aged 18--39 years (31.4%), Mexican Americans (36.9%), those without a usual source of medical care (12.1%), those who received medical care less than twice in the previous year (21.1%), and those without health insurance (29.0%) (Table). However, additional analysis using the same 2005--2008 NHANES data showed that 86.1% of adults with uncontrolled hypertension had either public or private medical insurance.
The prevalence of hypertension did not change significantly from 1999--2002 (28.1%) to 2005--2008 (30.9%) (Figure 2), after adjustment for sex, age, race/ethnicity, and poverty-income ratio (p=0.24). The prevalence of pharmacologic treatment among those with hypertension increased from 60.3% to 69.9% during this period, and the adjusted increase was significant (p<0.01). The prevalence of control also changed significantly during this time, increasing from 33.2% in 1999--2002 to 45.8% in 2005--2008 (p<0.01).
The results of this analysis show that the prevalence of hypertension in U.S. adults during 2005--2008 was approximately 30%; another NHANES report has shown that this prevalence has remained unchanged during the past 10 years (5). Significant increases in the prevalence of pharmacologic treatment and control of blood pressure among persons with hypertension have been observed in the past decade.
In spite of these gains, 30% of patients with hypertension are not being treated pharmacologically, and only 46% of persons with hypertension have their blood pressure under control. The greatest need for improvement in control is among those persons who do not have a usual source of medical care, those who reported receiving care less than twice in the previous year, and those without health insurance.
The findings of this study are consistent with the findings of other studies illustrating that inadequate control of hypertension often is related to gaps in availability of, access to, use of, or continuity of health care (6,7). The Affordable Care Act (ACA) is intended to extend insurance coverage to 94% of the non-elderly U.S. population by 2019 (8,9). By reducing patient out-of-pocket expenses for medical visits, ACA provisions extending insurance coverage for preventive services with no cost sharing are designed to enhance patient access to those preventive services and are anticipated to improve patient use of those services (8,9). Among those with uncontrolled hypertension, approximately 86% reported having some form of health insurance, indicating that for most patients, insurance is necessary but not sufficient to achieve blood pressure control. Several programmatic initiatives promoted by ACA, including patient-centered medical homes, accountable care organizations, and the federally qualified health center program (9), can contribute to improved health-care access and quality.
Poor adherence to medication regimens is another barrier to blood pressure control and might explain, in part, the low prevalence of blood pressure control observed even among patients with health insurance. Medication costs, complicated regimens, adverse effects, and insufficient physician-patient communication are among major factors cited as associated with decreased patient adherence to medication regimens (10).
The American Heart Association; the Joint National Committee on the Prevention, Detection, Evaluation, and Treatment of High Blood Pressure; and the U.S. Preventive Services Task Force also recommend the adoption of non-pharmacologic therapies associated with reductions in blood pressure. These recommendations include 1) achieving and maintaining a healthy body weight; 2) participating in regular leisure-time physical activity; 3) adoption of a healthy diet, including reduced salt intake and increased potassium intake; 4) smoking cessation; and 5) stress management.
Numerous clinical trials and longitudinal studies demonstrate that even small reductions in salt intake lower blood pressure and might prevent development of hypertension or improve blood pressure control among adults with hypertension (11). If average sodium intake in the United States was reduced from the current level of >3,400 mg/day to no more than 2,300 mg/day, an estimated 11 million fewer adults would be hypertensive. A reduction of 16.4 million cases of hypertension could be observed if intake were decreased to the recommended adequate intake of 1,500 mg/day (12). However, 90% of U.S. adults consume more salt than is recommended currently, nearly 80% of which comes from packaged, processed, and restaurant foods (13).
Reducing sodium intake to recommended levels will require changes in the manufacture and production of packaged, processed, and restaurant food, as well as changes by persons in their food consumption. Some manufacturers have committed to substantial sodium reduction, as has been done in other countries (14). On January 20, 2011, for example, Walmart announced plans to reduce sodium content of their corporate label foods by 25% by 2015 (15). Persons can lower their sodium intake by consuming more fresh fruits and vegetables and selecting food products and menu items labeled as "low sodium" or "no sodium added." This is particularly important for those in population groups that have a high risk for cardiovascular disease, including those with hypertension, older adults, African Americans, and those with diabetes or chronic kidney disease (16). Food manufacturers and restaurants have an opportunity to positively affect the health of the nation by voluntarily and gradually reducing the amount of sodium used in processed, packaged, and restaurant foods.
Lifestyle and environmental strategies to reduce blood pressure also might benefit persons who have blood pressure that is below 140/90 mmHg, but not necessarily optimal. Blood pressure reductions below the threshold for clinical hypertension (i.e., down to 115/75 mmHg) can have additional health benefits over time. For example, in a meta-analysis of 61 prospective observational studies of blood pressure and mortality, each 20 mmHg increase in usual systolic blood pressure (or, approximately equivalently, 10 mmHg increase in usual diastolic blood pressure) above 115/75 mmHg was associated with more than a twofold increase in stroke mortality, and with a twofold increase in death from coronary heart disease and other vascular causes of death at ages 40--69 years (17).
Progress in hypertension control cannot be achieved without improvements in health-care quality. Efforts to improve measurement of successes and shortfalls, such as the Physician Quality Reporting Initiative,† are designed to improve provider performance. System improvements, including adoption of electronic health records with registry and clinical decision support functions, will facilitate better patient management and the generation of patient and physician reminders to improve patient-physician interaction and patient follow-up (18). Other promising system improvements include nurse- or pharmacist-led care, which can improve preventive care delivery and reduce time pressures on physicians. Improved access and quality improvement efforts might need to be particularly focused on groups for whom the prevalence of control is especially low, such as young adults and Mexican Americans.
The findings in this report are subject to at least three limitations. First, the prevalence of hypertension in the U.S. population might be underestimated because older persons residing in nursing homes and other institutions, who have a higher prevalence of age-related hypertension, are not included in the NHANES. Second, although data collection is standardized, NHANES self-reported data on the use of blood pressure medications from interviews and questionnaires might be subject to misunderstanding and/or recall bias. Finally, this report focuses exclusively on pharmacologic treatment of hypertension. It does not take into account patients who might have reduced their blood pressure through lifestyle or dietary changes. Some of the participants in this study whose blood pressure levels were measured as normal might have been treated and successfully controlled with life-style modifications; thus, they would not have been classified as having hypertension.
Hypertension affects an estimated 68 million U.S. adults, yet only 70% receive treatment and fewer than half of these conditions are controlled. Better control of blood pressure is needed, not only through improved access to and use of health care, but also through improvements in medical care delivery systems and patients' adherence to treatment, increased access to healthful foods, and physical activity. The development of targeted programs for special groups (e.g., persons who are uninsured) is warranted. Success in improving blood pressure control requires comprehensive strategies with participation from federal, state, and local governments; health-care providers; employers; nonprofit organizations; and food, restaurant, and pharmaceutical industries.
C Gillespie, MS, EV Kuklina, MD, PhD, PA Briss, MD, NA Blair, MPH, Y Hong, MD, PhD, Div for Heart Disease and Stroke Prevention, National Center for Chronic Disease Prevention and Health Promotion, CDC.
This report is based, in part, on contributions by B Bowman, S Posner, National Center for Chronic Disease Prevention and Health Promotion; and S Yoon, N Sonnenfeld, and S Schober, National Center for Health Statistics, CDC.
* Additional information is available at http://www.cdc.gov/nchs/tutorials/nhanes/faqs.htm.
† Available at https://www.cms.gov/PQRI.
|
Key Points |
|
FIGURE 1. Study definitions for adults with hypertension whose blood pressure was treated or controlled for hypertension --- National Health and Nutrition Examination Survey (NHANES), United States, 1999-2002 and 2005-2008
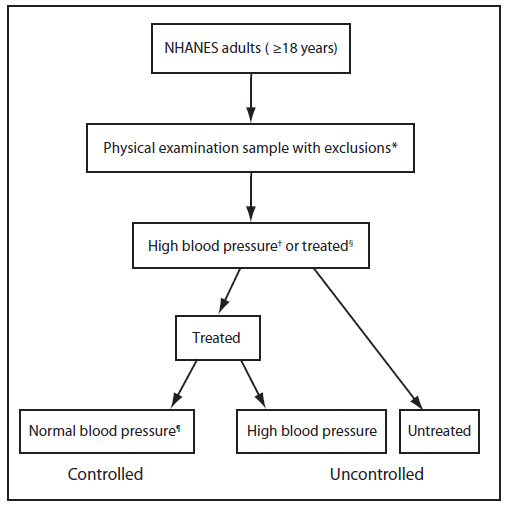
* Excludes pregnant women and participants with missing data needed for determining hypertension status.
† Average systolic pressure ≥140 mmHg or average diastolic pressure ≥90 mmHg.
§ Self-reported currently taking blood pressure--lowering medication.
¶ Average systolic pressure <140 mmHg and average diastolic pressure <90 mmHg.
Alternate Text: The figure above shows study definitions for adults with hypertension who are treated or controlled for hypertension in the United States from 1999-2002 and 2005-2008, according to the National Health and Nutrition Examination Survey (NHANES). This study used the average of up to three blood pressure measurements, obtained under standard conditions during a single physical examination at the mobile examination center. Hypertension was defined as an average systolic blood pressure ≥140 mmHg, an average diastolic blood pressure ≥90 mmHg, or the current use of blood pressure-lowering medication. Treatment of blood pressure was defined as the self-reported current use of blood pressure-lowering medication, and its prevalence was calculated among all those defined as having hypertension. Blood pressure control was defined as a treated blood pressure <140 mmHg systolic and <90 mmHg diastolic, and its prevalence was calculated among all those with hypertension.
FIGURE. 2 Prevalence of hypertension,* prevalence of treatment† and control§ of blood pressure among persons with hypertension --- National Health and Nutrition Examination Survey, United States 1999--2002 and 2005--2008.
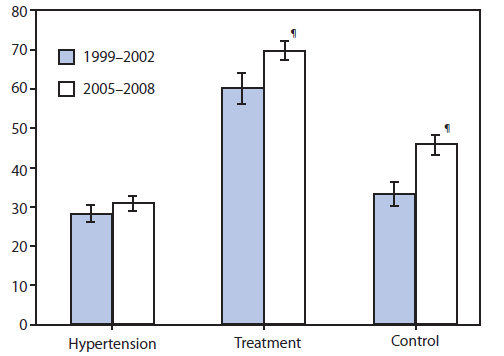
* Average systolic blood pressure ≥140 mm Hg, average diastolic pressure ≥90 mmHg, or current blood pressure--lowering medication use.
† An answer of "yes" to the question, "Are you currently taking medication to lower your blood pressure?" Among those with hypertension (average systolic blood pressure ≥140 mmHg, average diastolic pressure ≥90 mmHg, or current medication use). Unadjusted prevalence.
§ Average treated blood pressure <140/90 mmHg on examination among all persons with hypertension. Unadjusted prevalence.
¶ Test for difference in prevalence statistically significant (p<0.01) after adjustment for sex, age group, race/ethnicity, and poverty-income ratio.
Alternate Text: The figure above shows the prevalence of hypertension, prevalence of treatment and control of hypertension in the United States from 1999-2002 and 2005-2008, according to the National Health and Nutrition Examination Survey. The prevalence of hypertension did not change significantly from 1999-2002 (28.1%) to 2005-2008 (30.9%) after adjustment for sex, age, race/ethnicity, and poverty-income.
Use of trade names and commercial sources is for identification only and does not imply endorsement by the U.S. Department of
Health and Human Services.
References to non-CDC sites on the Internet are
provided as a service to MMWR readers and do not constitute or imply
endorsement of these organizations or their programs by CDC or the U.S.
Department of Health and Human Services. CDC is not responsible for the content
of pages found at these sites. URL addresses listed in MMWR were current as of
the date of publication.
All MMWR HTML versions of articles are electronic conversions from typeset documents.
This conversion might result in character translation or format errors in the HTML version.
Users are referred to the electronic PDF version (http://www.cdc.gov/mmwr)
and/or the original MMWR paper copy for printable versions of official text, figures, and tables.
An original paper copy of this issue can be obtained from the Superintendent of Documents, U.S.
Government Printing Office (GPO), Washington, DC 20402-9371;
telephone: (202) 512-1800. Contact GPO for current prices.
**Questions or messages regarding errors in formatting should be addressed to
mmwrq@cdc.gov.
