Health Insurance Coverage: Early Release of Estimates From the National Health Interview Survey, 2009
by Robin A. Cohen, Ph.D., Michael E. Martinez, M.P.H., M.H.S.A., and Brian W. Ward, Ph.D., Division of Health Interview Statistics, National Center for Health Statistics
PDF Version (336 KB)
Highlights
- Once each year, this quarterly report presents insurance coverage rates for selected states. In 2009, the percentage of persons who were uninsured at the time of interview among the 20 largest states ranged from 3.7% in Massachusetts to 24.6% in Texas.
- In 2009, 46.3 million persons of all ages (15.4%) were uninsured at the time of interview, 58.5 million (19.4%) had been uninsured for at least part of the year prior to interview, and 32.8 million (10.9%) had been uninsured for more than a year at the time of interview.
- The percentage of adults aged 18-64 years who lacked coverage at the time of interview increased from 19.7% in 2008 to 21.1% in 2009. There was a corresponding decrease in private coverage among adults aged 18-64 from 68.1% in 2008 to 65.8% in 2009.
- In 2009, 22.4% of persons under age 65 years with private health insurance were enrolled in a high deductible health plan (HDHP), including 6.3% who were enrolled in a consumer-directed health plan (CDHP). Almost 50% of persons with a private plan obtained by means other than through employment were in a HDHP. An estimated 20.4% of persons with a private plan were in a family with a flexible spending account (FSA) for medical expenses.
Introduction
The Centers for Disease Control and Prevention’s (CDC) National Center for Health Statistics (NCHS) is releasing selected estimates of health insurance coverage for the civilian noninstitutionalized U.S. population based on data from the 2009 National Health Interview Survey (NHIS), along with comparable estimates from the 1997-2008 NHIS. Data analyses for the 2009 NHIS were based on 88,129 persons in the Family Core.
Three measures of lack of health insurance coverage are provided: (i) uninsured at the time of interview, (ii) uninsured at least part of the year prior to interview (which also includes persons uninsured for more than a year), and (iii) uninsured for more than a year at the time of interview. Estimates of public and private coverage are also presented.
For individuals with private health insurance, estimates are presented for enrollment in high deductible health plans (HDHPs), enrollment in consumer-directed health plans (CDHPs), and being in a family with a flexible spending account (FSA) for medical expenses. For more information about NHIS and the Early Release (ER) Program, please see the Technical Notes and Additional Early Release Program Products sections of this report.
This report is updated quarterly and is part of the NHIS ER Program, which releases updated selected estimates that are available from the NHIS website.
Results
Lack of health insurance coverage
In 2009, the percentage of persons uninsured at the time of interview was 15.4% (46.3 million) for persons of all ages, 17.5% (46.0 million) for persons under age 65 years, 21.1% (40.0 million) for persons aged 18-64, and 8.2% (6.1 million) for children under age 18 (Tables 1 and 2).
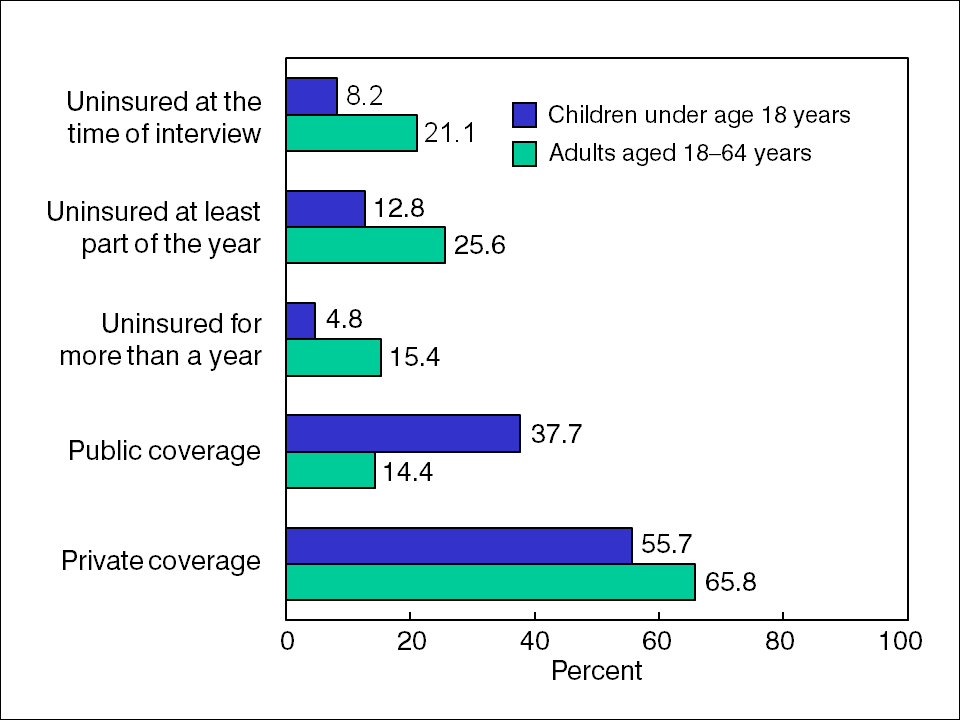
Based on data from the 2009 NHIS, a total of 58.5 million (19.4%) persons of all ages were uninsured for at least part of the year prior to interview (Tables 1 and 2). Adults aged 18-64 were twice as likely to experience this lack of coverage (25.6%) as children (12.8%).
Data from 2009 also revealed that 12.4% (32.6 million) of persons under age 65 (15.4% of adults and 4.8% of children) had been uninsured for more than a year (Tables 1 and 2). Adults aged 18-64 were three times as likely as children to have been uninsured for more than a year (Figure 1). The percentage of adults aged 18-64 who lacked coverage at the time of interview increased from 19.7% in 2008 to 21.1% in 2009.
Public and private coverage
In 2009, 21.0% of persons under age 65 years were covered by public plans at the time of interview (Table 3). More than one-third of children (37.7%) were covered by a public plan, compared with 14.4% of adults aged 18-64 (Figure 1). The percentage of children covered by a public health plan increased from 34.2% in 2008 to 37.7% in 2009.
In 2009, 62.9% of persons under age 65 were covered by private health insurance plans at the time of interview (Table 3). Almost two-thirds (65.8%) of adults aged 18-64 were covered by a private plan, compared with 55.7% of children under age 18 (Figure 1). The percentage of adults aged 18-64 covered by a private plan decreased from 68.1% in 2008 to 65.8% in 2009.
Insurance coverage by poverty status
In 2009, 11.8% of poor children and 12.1% of near poor children (see Technical Notes for definition of poverty) did not have health insurance coverage at the time of interview (Table 4). The percentage of near poor children who lacked coverage at the time of interview decreased from 15.6% in 2008 to 12.1% in 2009. The percentage of poor adults aged 18-64 years who lacked coverage at the time of interview increased from 37.7% in 2008 to 42.5% in 2009.
In 2009, 81.4% of poor children and 58.4% of near poor children were covered by a public health plan at the time of interview (Table 5). Public coverage for near poor children increased from 53.4% in 2008 to 58.4% in 2009. Based on 2009 data, 40.3% of poor adults aged 18-64 were covered by a public plan (Table 5).
In 2009, 8.2% of poor children and 32.8% of near poor children were covered by private health insurance at the time of interview (Table 6). There was no significant change in private coverage for poor, near poor, and not poor children between 2008 and 2009. Private coverage among poor adults aged 18-64 decreased from 22.7% in 2008 to 18.0% in 2009.
Lack of coverage, by selected demographic characteristics
Race/ethnicity
Based on data from the January to September 2009 NHIS, Hispanic persons were more likely than non-Hispanic white persons, non-Hispanic black persons, and non-Hispanic Asian persons to be uninsured at the time of interview, to have been uninsured for at least part of the past 12 months, and to have been uninsured for more than a year (Table 7). Approximately one-third of Hispanic persons were uninsured at the time of interview or had been uninsured for at least part of the past year, and almost one-fourth of Hispanic persons had been without health insurance coverage for more than a year.
Age and sex
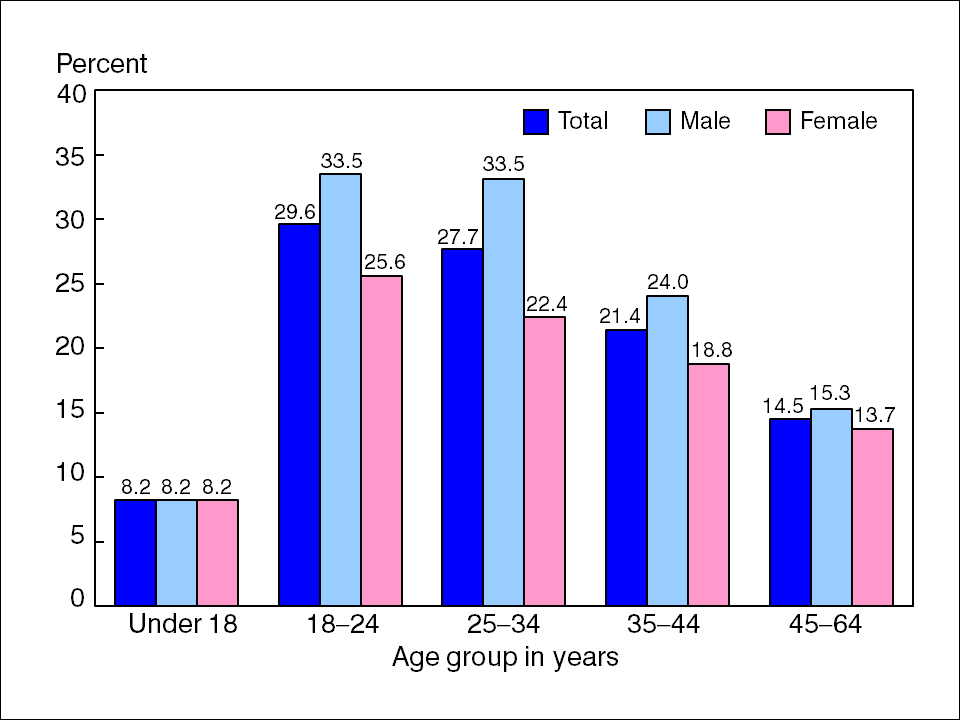
For all persons under age 65 years, the percentage who were uninsured at the time of interview was highest among those aged 18-24 (29.6%) and lowest among those under age 18 (8.2%) (Figure 2). Starting at age 18, younger adults were more likely than older adults to lack health insurance coverage. Among adults under age 65, men were more likely than women to lack health insurance coverage at the time of interview.
Other demographic characteristics
Lack of health insurance coverage was greatest in the South and West regions of the United States (Table 7). Among adults who lacked a high school diploma, 32.9% were uninsured at the time of interview, 36.4% had been uninsured for at least part of the past year, and 27.4% had been uninsured for more than a year at the time of interview. These rates are two to more than three times as high as those for persons with more than a high school education. Among currently unemployed adults aged 18-64 years, 59.7% had been uninsured for at least part of the past year, and 32.3% had been uninsured for more than a year. Among employed adults aged 18-64, 22.1% had been uninsured for at least part of the past year, and 13.8% had been uninsured for more than a year. Married or widowed adults were more likely to have coverage than those who were divorced, separated, living with a partner, or never married.
Estimates of enrollment in HDHPs, CDHPs, and FSAs
Based on data from the 2009 NHIS, 22.4% of persons under age 65 years with private health insurance were enrolled in a HDHP, including 6.3% who were enrolled in a CDHP and 16.1% who were enrolled in a HDHP without a health savings account (HSA) (Figure 3). (See Technical Notes for definitions of HDHP, CDHP, and HSA.) Enrollment in HDHPs increased from 17.5% in 2007 to 22.4% in 2009. There was a significant increase in enrollment in HDHPs without HSAs and in CDHPs.
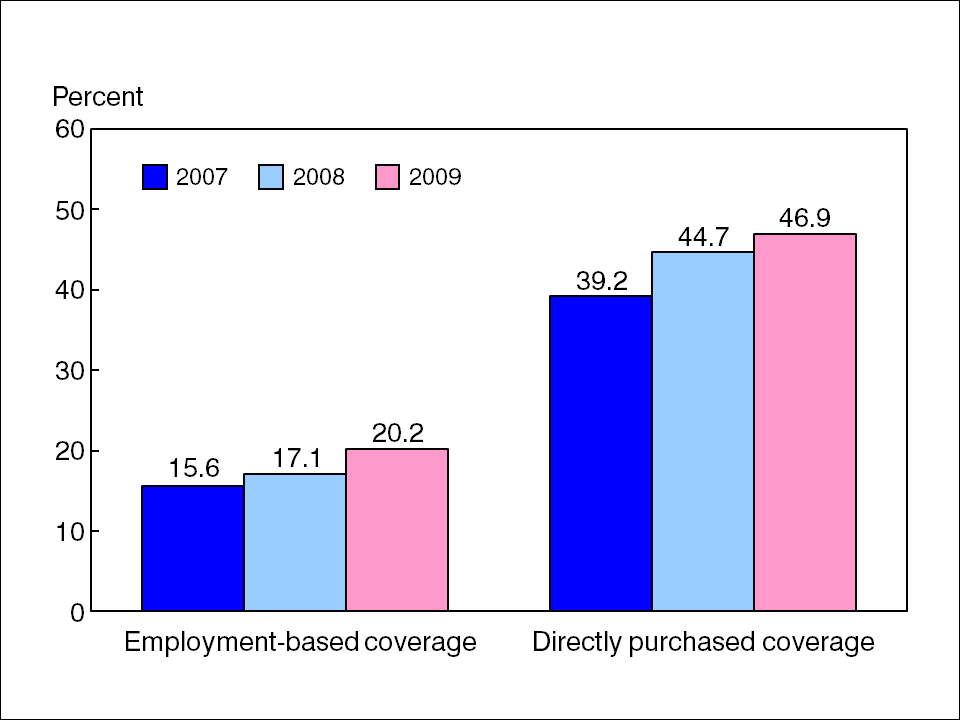
Based on data for 2009, among persons under age 65 with private health insurance, 20.2% with employment-based coverage were enrolled in a HDHP, compared with 46.9% of those with a private plan that was directly purchased or obtained through means other than employment (Figure 4). The percentage of persons covered by employment-based private plans that are HDHPs increased from 15.6% in 2007 to 20.2% in 2009. The percentage of persons covered by directly purchased private health plans that are HDHPs increased from 39.2% in 2007 to 46.9% in 2009. For persons under age 65, approximately 8% of private health plans are directly purchased (estimates not shown). HDHPs constitute a growing share of both employment-based and directly purchased health plans.
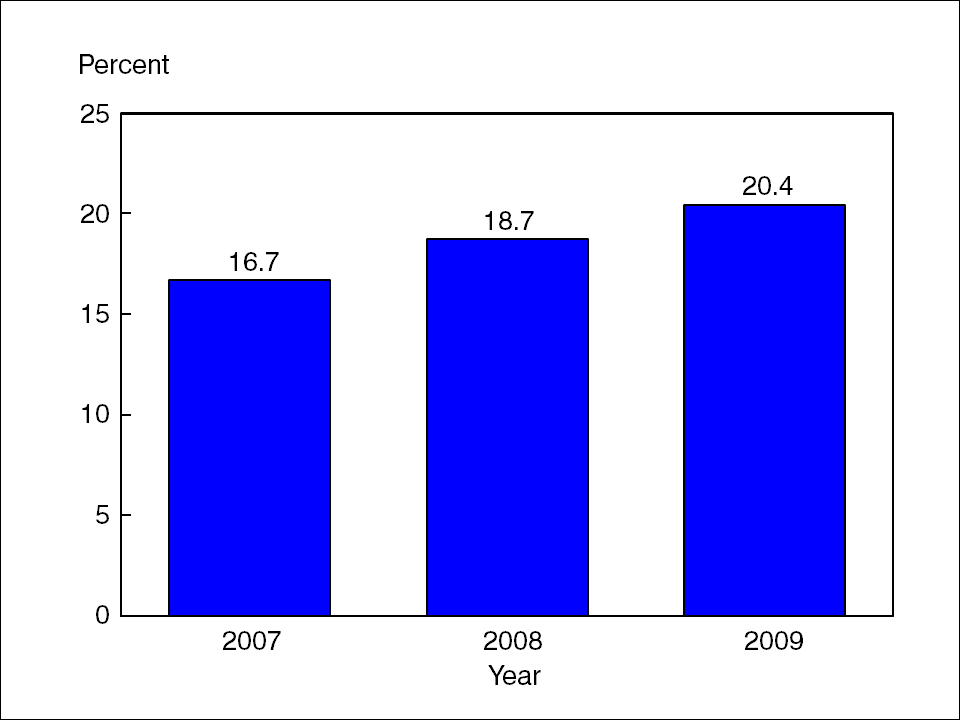
In 2009, among persons under age 65 with private health insurance, 20.4% were in a family that had a FSA for medical expenses (Figure 5). (See Technical Notes for definition of FSA.) This is an increase from 2007, when 16.7% of persons under age 65 with private insurance were in a family with a FSA.
Insurance coverage in selected states
Nationally, 17.5% of persons under age 65 years lacked health insurance coverage at the time of interview in 2009 (Table 8). However, approximately one in four persons under age 65 in Florida and Texas, and one in five persons under age 65 in California and Georgia, lacked coverage at the time of interview. By contrast, rates of noncoverage at the time of interview in Illinois, Massachusetts, Michigan, New Jersey, New York, Ohio, Pennsylvania, Washington, and Wisconsin were lower than the national average.
Nationally, 8.2% children in 2009 lacked coverage at the time of interview, but rates were higher in Florida (13.1%), Indiana (14.0%), and Texas (16.9%).
Nationally, 37.7% of children had public health care coverage. Among the states examined for this report, public coverage for children ranged from 24.6% in New Jersey to 43.0% in Washington.
Nationally, 62.9% of persons under age 65 had private coverage. Among the states examined, private coverage rates for persons under age 65 ranged from 75.2% in Massachusetts to 52.2% in Texas. Maryland, Massachusetts, New Jersey, Ohio, Pennsylvania, and Wisconsin had rates above the national average.
Long-term trends in coverage
Lack of health insurance coverage
The percentage of children uninsured at the time of interview decreased from 13.9% in 1997 to 8.2% in 2009 (Figure 6). Since 1997, the percentage of adults aged 18-64 years who were uninsured at the time of interview has ranged between 17.8% in 1999 and 21.1% in 2009 (Table 1). There has been a generally increasing trend in the percentage of adults aged 18-64 who lacked coverage at the time of interview.
The percentage of children who were uninsured during at least part of the year prior to interview decreased from 18.1% in 1997 to 12.8% in 2009 (Figure 6). However, since 2004, the percentage of children uninsured during at least part of the year prior to interview has remained relatively stable and has ranged from 12.6% to 13.3%. Between 1997 and 2009, the percentage of adults aged 18-64 who lacked coverage for at least part of the year prior to interview ranged between 22.2% in 1999 and 25.6% in 2009 (Figure 7 and Table 1). However, there has been an generally increasing trend in the percentage of adults aged 18-64 who lacked coverage for at least part of the year from 1997 to 2009.
Among adults aged 18-64, between 1997 and 2009 the percentage uninsured for more than a year ranged between 11.9% in 1999 and 15.4% in 2009 (Figure 7 ). By contrast, the percentage of children uninsured for more than a year decreased from 8.4% in 1997 to 5.3% in 2003 (Figure 6). Since 2003, the percentage of children uninsured for more than a year has remained relatively steady, ranging between 4.8% and 5.6%.
Public and private coverage
Public coverage rates among both children and adults aged 18-64 years are higher now than in 1997. However, the increase among adults is smaller than the increase among children (Table 3). Conversely, private health care coverage rates among both children and adults aged 18-64 are lower now than in 1997.
Insurance coverage by poverty status
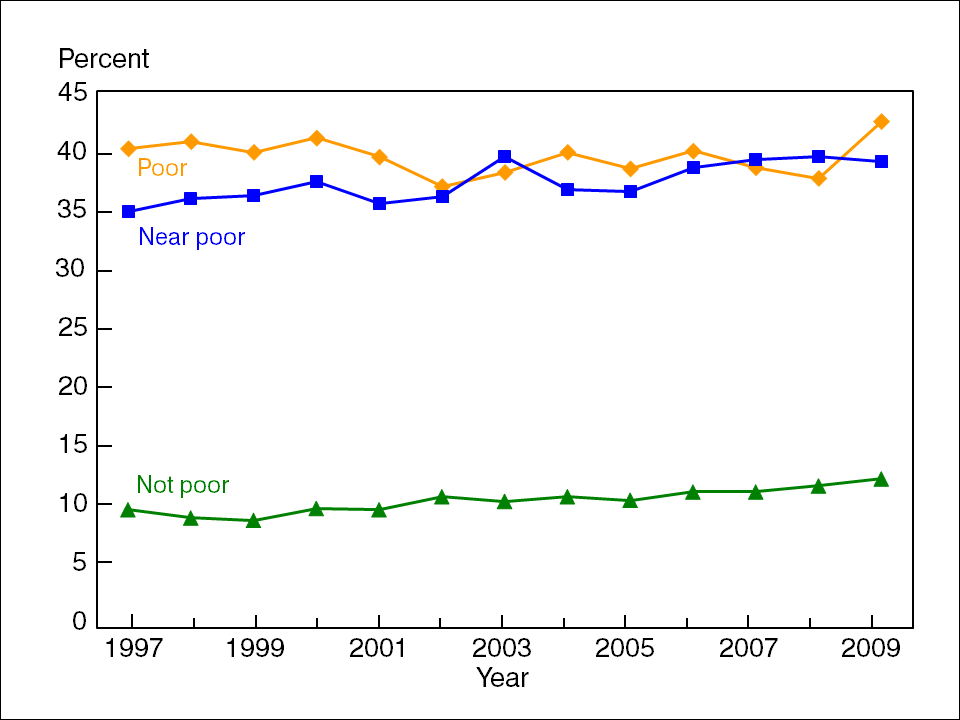
The percentage of poor children who were uninsured at the time of interview decreased from 1997 through 2009 (Figure 8). During the same period, the percentage of poor adults who were uninsured remained relatively stable (Figure 9).
Among children, all poverty status groups experienced an increase in public coverage between 1997 and 2009 (Table 5). However, the largest increase was seen among near poor children, for whom coverage by a public plan more than doubled during the same period.
The rate of private coverage among near poor children was 22.2 percentage points lower in 2009 than in 1997 (Table 6). As shown in Figure 10, among near poor children the percentage without health insurance and the percentage with private health insurance coverage have declined since 1997, while public coverage increased. Private coverage decreased among near poor adults aged 18-64 years, from 52.6% in 1997 to 37.7% in 2009, so that the uninsured and private coverage rates for this population are almost the same (Figure 11). Private coverage among not poor adults aged 18-64 decreased from 87.1% in 1997 to 81.4% in 2009.
References
- U.S. Government Accountability Office (GAO). Consumer-directed health plans: Early enrollee experiences with health savings accounts and eligible health plans. GAO-06-798. Washington, DC: GAO 2006.
- Joinpoint Regression Program, version 3.4 [computer software]. Bethesda, MD: Statistical Research and Applications Branch, National Cancer Institute. 2009.
- Cohen RA, Martinez ME. Impact of Medicare and Medicaid probe questions on health insurance estimates from the National Health Interview Survey, 2004. Health E-Stats: National Center for Health Statistics. 2005.
- Lamison-White L. Poverty in the United States, 1996. U.S. Bureau of the Census. Current population reports, series P60-198. Washington, DC: U.S. Government Printing Office. 1997.
- Dalaker J, Naifeh M. Poverty in the United States, 1997. U.S. Bureau of the Census. Current population reports, series P60-201. Washington, DC: U.S. Government Printing Office. 1998.
- Dalaker J. Poverty in the United States, 1998. U.S. Census Bureau. Current population reports, series P60-207. Washington, DC: U.S. Government Printing Office. 1999.
- Dalaker J, Proctor BD. Poverty in the United States, 1999. U.S. Census Bureau. Current population reports, series P60-210. Washington, DC: U.S. Government Printing Office. 2000.
- Dalaker J. Poverty in the United States, 2000. U.S. Census Bureau. Current population reports, series P60-214. Washington, DC: U.S. Government Printing Office. 2001.
- Proctor BD, Dalaker J. Poverty in the United States, 2001. U.S. Census Bureau. Current population reports, series P60-219. Washington, DC: U.S. Government Printing Office. 2002.
- Proctor BD, Dalaker J. Poverty in the United States, 2002. U.S. Census Bureau Current population reports, series P60-222. Washington, DC: U.S. Government Printing Office. 2003.
- DeNavas-Walt C, Proctor BD, Mills RJ. Income, poverty, and health insurance coverage in the United States: 2003. U.S. Census Bureau. Current population reports, series P60-226. Washington, DC: U.S. Government Printing Office. 2004.
- DeNavas-Walt C, Proctor BD, Lee CH. Income, poverty, and health insurance coverage in the United States: 2004. U.S. Census Bureau. Current population reports, series P60-229. Washington, DC: U.S. Government Printing Office. 2005.
- DeNavas-Walt C, Proctor BD, Lee CH. Income, poverty, and health insurance coverage in the United States: 2005. U.S. Census Bureau. Current population reports, series P60-231. Washington, DC: U.S. Government Printing Office. 2006.
- DeNavas-Walt C, Proctor BD, Smith J. Income, poverty, and health insurance coverage in the United States: 2006. U.S. Census Bureau. Current population reports, series P60-233. Washington, DC: U.S. Government Printing Office. 2007.
- DeNavas-Walt C, Proctor BD, Smith JC. Income, poverty, and health insurance coverage in the United States: 2007. U.S. Census Bureau. Current population reports, series P60-235. Washington, DC: U.S. Government Printing Office. 2008.
- DeNavas-Walt C, Proctor BD, Smith JC. Income, poverty, and health insurance coverage in the United States: 2008. U.S. Census Bureau. Current population reports, series P60-236. Washington, DC: U.S. Government Printing Office. 2009.
- Pleis JR, Dahlhamer JM, Meyer PS. Unfolding the answers? Income nonresponse and income brackets in the National Health Interview Survey. Proceedings of the 2006 Joint Statistical Meetings [CD-ROM]. Alexandria, VA: American Statistical Association, Alexandria, Virginia; 3540-47. 2007.
- Pleis JR, Cohen RA. Impact of income bracketing on poverty measures used in the National Health Interview Survey’s Early Release Program: Preliminary data from the 2007 NHIS. Hyattsville, MD: National Center for Health Statistics. December 2007. Available from: /nchs/data/nhis/income.pdf [PDF – 516 KB].
- National Center for Health Statistics. Health, United States, 2009: With Special Feature on Medical Technology. Hyattsville, Maryland. 2010.
- Barnes PM, Heyman KM, Freeman G, Schiller JS. Early release of selected estimates based on data from the 2009 National Health Interview Survey. National Center for Health Statistics. June 2010. Available from: NHIS website.
- Blumberg SJ, Luke JV. Wireless substitution: Early release of estimates based on data from the National Health Interview Survey, July–December 2009 [PDF – 305 KB]. National Center for Health Statistics. May 2010.
Technical Notes
Introduction
The Centers for Disease Control and Prevention’s (CDC) National Center for Health Statistics (NCHS) is releasing selected estimates of health insurance coverage for the civilian noninstitutionalized U.S. population based on data from the 2009 National Health Interview Survey (NHIS), along with comparable estimates from the 1997-2008 NHIS.
Three measures of lack of health insurance coverage are provided: (i) uninsured at the time of interview, (ii) uninsured at least part of the year prior to interview (which also includes persons uninsured for more than a year), and (iii) uninsured for more than a year at the time of interview. To reflect different policy-relevant perspectives, different time frames are used to measure lack of insurance coverage. The measure of uninsured at the time of interview provides an estimate of persons who at any given time may experience barriers to obtaining needed health care. The estimate of persons who were uninsured at any time in the year prior to interview provides an annual caseload of persons who may experience these barriers. This measure includes persons who have insurance at the time of interview, but who had a period of noncoverage in the year prior to interview, as well as those who are currently uninsured and who may have been uninsured for a long period of time. Finally, the measure of lack of coverage for more than a year provides an estimate of those with a persistent lack of coverage who may be at high risk of not obtaining preventive services as well as care for illness and injury. These three measures of lack of coverage are not mutually exclusive, and a given individual may be counted in more than one of the measures. Estimates of enrollment in public and private coverage are also provided.
This report also includes estimates of three types of consumer-directed private health care. Consumer-directed health care may enable individuals to have more control over when and how they access care, what types of care they use, and how much they spend on health care services. National attention to consumer-directed health care increased following the enactment of the Medicare Prescription Drug Improvement and Modernization Act of 2003 (P.L. 108-173), which established tax-advantaged health savings accounts (1). In 2007, three additional questions were added to the health insurance section of NHIS to monitor enrollment in consumer-directed health care among persons with private health insurance. Estimates for 2009 are provided for enrollment in high deductible health plans (HDHPs), plans with high deductibles coupled with health savings accounts (CDHPs), and being in a family with a flexible spending account (FSA) for medical expenses not otherwise covered. For a more complete description of consumer-directed health care, see “Definitions of selected terms” below.
The 2009 health insurance estimates are being released prior to final data editing and final weighting, to provide access to the most recent information from NHIS. The resulting estimates for persons without health insurance are generally 0.1-0.3 percentage points lower than those based on the editing procedures used for the final data files. Occasionally, due to decisions made for the final data editing and weighting, estimates based on preliminary editing procedures may differ by more than 0.3 percentage points from estimates based on final files.
Estimates for 2009 are stratified by age group, sex, race/ethnicity, poverty status, marital status, employment status, region, and educational attainment.
Data Source
NHIS is the source of data for this report. NHIS is a multistage probability sample survey of the civilian noninstitutionalized population of the United States. The survey is conducted continuously throughout the year for NCHS by interviewers of the U.S. Census Bureau.
NHIS is a comprehensive health survey that can be used to relate health insurance coverage to health outcomes and health care utilization. It has a low item nonresponse rate (about 1%) for the health insurance questions. Because NHIS is conducted throughout the year, yielding a nationally representative sample each week, data can be analyzed weekly or quarterly to monitor health insurance coverage trends.
The sample for NHIS is redesigned about every 10 years. A new sample design for NHIS was implemented in 2006. The fundamental structure of the new 2006 NHIS sample design is very similar to the previous 1995-2005 NHIS sample design. Oversampling of the black and Hispanic populations has been retained, and the new sample design also oversamples the Asian population. In addition, persons aged 65 years and over have a higher probability of being selected as a sample adult. The impact of the new sample design on estimates presented in this report is minimal. Visit the NHIS website for more information on the design, content, and use of NHIS.
The data for this report are derived from the Family Core component of the 1997-2009 NHIS, which collects information on all family members in each household. Data analyses for the 2009 NHIS were based on 88,129 persons in the Family Core.
Estimation procedures
NCHS creates survey weights for each calendar quarter of the NHIS sample. The NHIS data weighting procedure [PDF – 300 KB] is described in more detail elsewhere. Estimates were calculated by using the NHIS survey weights, which are calibrated to census totals for sex, age, and race/ethnicity of the U.S. civilian noninstitutionalized population. The weights for the 1997-1999 NHIS data were derived from 1990-census-based population estimates. Weights for the 2000-2009 NHIS data were derived from 2000- census-based population estimates.
An error was made in the poststratification component of weights from January 2004 through 2008. The error affected “nonminority” person weights. Compared with the corrected weight estimates, those made with the original weights generally differ by 0.01 percentage points, and variances generally differ by 0.001 percentage points.
Point estimates, and estimates of their variances, were calculated using SUDAAN software to account for the complex sample design of NHIS. The Taylor series linearization method was chosen for variance estimation. State-specific estimates are presented for 20 states. The Taylor series linearization method was chosen for estimation of standard errors for the 10 states with the largest sample sizes (California, Florida, Illinois, Michigan, New Jersey, New York, North Carolina, Ohio, Pennsylvania, and Texas). Due to small sample sizes and limitations in the NHIS design, estimated standard errors for other states could be unstable or negatively biased. For these states, an estimated design effect was used to calculate standard errors. For this report, the design effect is the ratio of the true standard error of an estimated percentage (taking into account the complex sample design) to the standard error of the estimated percentage from a simple random sample (SRS) based on the same number of persons.
The average design effect for each health insurance measure and domain was estimated by averaging the design effect derived from SUDAAN-based estimates of standard errors for the 10 largest states. For this report, standard errors for 10 states were estimated by multiplying the SRS standard error by the average design effect for each health insurance measure and domain. The average design effects ranged from 1.78 for uninsured adults aged 18-64 years to 2.65 for all persons with private coverage. The estimated standard error of the difference between state and national estimates accounted for the nonindependence of these estimates by incorporating their covariance.
Both of the September 2007 Early Release (ER) reports used final in-house design variables for estimating variance for the 2006 estimates. ER reports other than the September 2007 update use ER interim design variables to estimate variance, with the exception of the state-level estimates, which use the final in-house design variables to estimate variance.
Unless otherwise noted, all estimates shown meet the NCHS standard of having less than or equal to 30% relative standard error. Differences between percentages or rates were evaluated using two-sided significance tests at the 0.05 level. Trends in coverage were assessed by using Joinpoint regression (2), which characterizes trends as joined linear segments. A joinpoint is the year when two segments with different slopes meet. Joinpoint software uses statistical criteria to determine the fewest number of segments necessary to characterize a trend and the year(s) when segments begin and end. Terms such as “greater than” and “less than” indicate a statistically significant difference. Terms such as “similar” and “no difference” indicate that the estimates being compared were not significantly different. Lack of comments regarding the difference between any two estimates does not necessarily mean that the difference was tested and found to be not significant.
Definitions of selected terms
Health insurance coverage – The“private health insurance coverage”category excludes plans that pay for only one type of service, such as accidents or dental care. The “public health plan coverage” category includes Medicaid, Children’s Health Insurance Program (CHIP), state-sponsored or other government-sponsored health plans, Medicare, and military plans. A small number of persons were covered by both public and private plans and were included in both categories. A person was defined as “uninsured” if he or she did not have any private health insurance, Medicare, Medicaid, CHIP, state-sponsored or other government-sponsored health plan, or military plan, at the time of interview. A person was also defined as uninsured if he or she had only Indian Health Service coverage or had only a private plan that paid for one type of service, such as accidents or dental care. The analyses excluded persons with unknown health insurance status (about 1% of respondents each year).
The terms HIKIND, MCAREPRB, and MCAIDPRB refer to questions in NHIS. Data on type of health insurance are collected through the HIKIND question: “What kind of health insurance or health care coverage [fill: do you/does person’s name] have? INCLUDE those that pay for only one type of service (nursing home care, accidents, or dental care). EXCLUDE private plans that only provide extra cash while hospitalized.” Respondents can indicate private and public plans or indicate that they or family members are not covered by insurance.
Two additional questions were added to the health insurance section of NHIS beginning with the third quarter of 2004. One question, MCAREPRB, was asked of persons aged 65 years and over who had not indicated that they had Medicare. The MCAREPRB question is: “People covered by Medicare have a card which looks like this. [fill: Are you/Is person’s name] covered by Medicare?” The other question, MCAIDPRB, was asked of persons under age 65 who had not indicated any type of coverage. The MCAIDPRB question is: “There is a program called Medicaid that pays for health care for persons in need. In this State it is also called (* fill State name). [fill: Are you/Is person’s name] covered by Medicaid?”
Respondents who were considered insured at the time of interview were asked about periods of noncoverage in the past year. For persons who did not have health insurance at the time of interview, a question was asked concerning the length of time since the respondent had coverage. Respondents who originally classified themselves as uninsured but, whose classification was changed to Medicare or Medicaid on the basis of a “yes” response to either probe question, subsequently received appropriate follow-up questions concerning periods of noncoverage for insured respondents.
Method 1 estimates are based solely on one question (HIKIND). Method 2 estimates are based on responses to three questions (HIKIND, MCAREPRB, and MCAIDPRB). Prior to 2004, estimates in earlier releases of this report were generated using Method 1. Estimates for 2004 are presented using Method 2 in the figures and both Method 1 and Method 2 in the tables. Estimates using Method 1 for the “uninsured for more than a year”measureexcluded persons whose classification was changed from uninsured to either Medicare or Medicaid coverage by either additional probe question. As a result, these respondents did not receive the follow-up question concerning how long had it been since they had coverage. However, they were asked the questions concerning noncoverage in the past 12 months for insured persons. All estimates beginning in 2005 are calculated using the two additional questions (Method 2).
Of the 892 people (unweighted) who were eligible to receive the MCAREPRB question in the third and fourth quarters of 2004, 55.4% indicated they were covered by Medicare. Of the 9,146 people (unweighted) who were eligible to receive the MCAIDPRB question in the third and fourth quarters of 2004, 3.0% indicated they were covered by Medicaid.
From July through December 2004 (the third and fourth quarters combined), the estimates (weighted) for the “uninsured at the time of interview”measure decreased from 10.4% to 9.9% for children under age 18 years, from 19.7% to 19.5% for adults aged 18-64, and from 1.7% to 1.2% for persons aged 65 and over with the use of Method 2 as compared with Method 1. The estimates for public coverage increased from 28.1% to 29.6% for children under age 18, from 11.3% to 11.4% for adults aged 18-64, and from 89.5% to 93.3% for persons aged 65 and over with the use of Method 2 as compared with Method 1. The tabulation of “uninsured for more than a year”using Method 1 excludes respondents whose classification was changed to Medicare or Medicaid by either probe question because these individuals did not receive the question concerning duration of noncoverage for persons who are uninsured. The two additional questions had no impact on the estimates for private coverage. Additional information on the impact of these two probe questions on health insurance estimates can be found in “Impact of Medicare and Medicaid probe questions on health insurance estimates from the National Health Interview Survey, 2004”(3).
For persons with private health insurance, a new question regarding the annual deductible of each private health insurance plan was added beginning in 2007. For plans considered to be high deductible health plans (HDHPs), a follow-up question was asked regarding special accounts or funds used to pay for medical expenses: a health savings account (HSA) or a health reimbursement account (HRA). Lastly, a new question was added about family enrollment in a flexible spending account (FSA) for medical expenses.
Data on health insurance status were edited using an automated system based on logic checks and keyword searches. For comparability, the estimates for all years were created using these same procedures.
High deductible health plan (HDHP) – A HDHP is defined in 2009 as a private health plan with an annual deductible of not less than $1,150 for self-only coverage or $2,300 for family coverage. The deductible is adjusted annually for inflation. For 2007 and 2008, the annual deductible for self-only coverage was $1,100 and for family coverage was $2,200.
Consumer-directed health plan (CDHP) – A CDHP is defined as a HDHP with a special account to pay for medical expenses; unspent funds are carried over to subsequent years. A person is considered to have a CDHP if there was a “yes” response to the following question: “With this plan, is there a special account or fund that can be used to pay for medical expenses? The accounts are sometimes referred to as Health Savings Accounts (HSAs), Health Reimbursement Accounts (HRAs), Personal Care accounts, Personal Medical funds, or Choice funds, and are different from Flexible Spending Accounts.”
Health savings account (HSA) – A HSA is a tax-advantaged account or fund that can be used to pay for medical expenses. It must be coupled with a HDHP. The funds contributed to the account are not subject to federal income tax at the time of deposit. Unlike Flexible Spending Accounts (FSAs), funds roll over and accumulate year to year if not spent. HSAs are owned by the individual. Funds may be used to pay for qualified medical expenses at any time without federal tax liability.
Flexible spending account (FSA) for medical expenses – A person is considered to be in a family with a FSA if there was a “yes” response to the following question: “[fill 1: Do you/Does anyone in your family] have a Flexible Spending Account for health expenses? These accounts are offered by some employers to allow employees to set aside pre-tax dollars of their own money for their use throughout the year to reimburse themselves for their out-of-pocket expenses for health care. With this type of account, any money remaining in the account at the end of the year, following a short grace period, is lost to the employee.”
The measures of HDHP enrollment, CDHP enrollment, and being in a family with a FSA for medical expenses are not mutually exclusive. Therefore, a person may be counted in more than one measure.
Directly purchased coverage – Private insurance that was originally obtained through direct purchase or through other means not related to employment.
Employment-based coverage – Private insurance that was originally obtained through a present or former employer or union or a professional association.
Education – The categories of education are based on the years of school completed or highest degree obtained for persons aged 18 years and over. Only years completed in a school that advances a person toward an elementary or high school diploma, General Educational Development high school equivalency diploma (GED), college, university, or professional degree are included. Education in other schools, or home schooling, is counted only if the credits are accepted in a regular school system.
Employment – Employment status is assessed at the time of interview and is obtained for persons aged 18 years and over. In this release, it is presented only for persons aged 18-64.
Hispanic or Latino origin and race – Hispanic or Latino origin and race are two separate and distinct categories. Persons of Hispanic or Latino origin may be of any race. Hispanic or Latino origin includes persons of Mexican, Puerto Rican, Cuban, Central and South American, or Spanish origins. Race is based on the family respondent’s description of his or her own race background, as well as the race background of other family members. For conciseness, the text, tables, and figures in this report use shorter versions of the 1997 Office of Management and Budget (OMB) race and Hispanic or Latino origin terms. For example, the category “not Hispanic or Latino, black or African American, single race” is referred to as “non-Hispanic black, single race” in the text, tables, and figures. Estimates for non-Hispanic persons of races other than white only, black only, Asian only, or of multiple races are combined into the “other races or multiple race” category.
Poverty status – Poverty categories are based on the ratio of the family’s income in the previous calendar year to the appropriate poverty threshold (given the family’s size and number of children) defined by the U.S. Census Bureau for that year (4-16). Persons categorized as “poor” had a ratio less than 1.0 (i.e., their family income was below the poverty threshold); “near poor” persons have incomes of 100% to less than 200% of the poverty threshold; and “not poor” persons have incomes that are 200% of the poverty threshold or greater. The remaining group of respondents is coded as “unknown” with respect to poverty status. The percentage of respondents with unknown poverty status (19.1% in 1997, 23.6% in 1998, 26.4% in 1999, 27.0% in 2000, 27.1% in 2001, 28.1% in 2002, 31.5% in 2003, 29.6% in 2004, 28.9% in 2005, 30.7% in 2006, 18.0% in 2007, 15.8% in 2008, and 12.3% in 2009) is disaggregated by insurance status and age in Tables 4, 5, and 6.
In 2004, the NHIS instrument recorded a much larger than expected proportion of respondents with a family income for the previous calendar year of “$2.” The ER updates from March 2005 through December 2005 used these preliminary data. Following extensive review, the “$2” responses were coded to “not ascertained” for the final 2004 NHIS microdata files. The 2004 estimates of coverage by poverty status were recalculated using the final microdata. The revised estimates were released in the March 2006 ER update and continue to be used in subsequent ER updates. The problem with the “$2” income reports was fixed in the 2005 NHIS.
See the NHIS Survey Description Documents for 1997-2008 (available from the NHIS website) for more information on the unknown income and unknown poverty status categories.
Prior to 2007, the “Income and Assets” section in the Family Core of the NHIS instrument allowed respondents to report their family income in several ways. Respondents were first asked to provide their combined family income before taxes from all sources for the previous calendar year in a dollar amount (from $0 to $999,995). Respondents who did not know or refused to state an amount were then asked if their combined family income in the previous calendar year was $20,000 or more, or less than $20,000. If they again refused to answer or said they did not know, they were not asked any more questions about their family income. Respondents who did reply to the “above-below $20,000” question were then handed a list (flash card) of detailed income categories (top-coded at “$75,000 or more”) and asked to select the interval containing their best estimate of their combined family income. Thus, NHIS respondents fell into one of four categories with respect to combined family income information: (i) those willing to supply a dollar amount; (ii) those who indicated their combined family income from a fairly detailed set of intervals; (iii) those who said that their combined family income was either $20,000 or more, or less than $20,000; and (iv) those unwilling to provide any information whatsoever. However, the flash card approach had a very low item response rate (15%-18%), and this led to income variables such as poverty ratio having relatively high levels of missing data (approximately 30% item nonresponse rate).
In the 2007 NHIS, the family income section of the questionnaire was redesigned to improve the collection of income information and to reduce the amount of income nonresponse. Questions used to collect income data from respondents who initially would not indicate the amount of their family’s income in the last calendar year were changed from using a flash card approach to using a set of unfolding brackets. The unfolding bracket method asks a series of closed-ended income range questions (e.g., “Is it less than $50,000?”) if the respondent did not provide an answer to an exact income amount question. These questions utilize a series of income intervals, and respondents answering the complete path of questions would answer either two or three questions. The first follow-up income question asks a respondent if the family’s income is less than $50,000. With this as a starting point, for respondents who answer “yes” to this question, additional questions are asked to determine if the family’s income is below $35,000 and if the family’s income is below the poverty threshold. Alternately, for respondents who answered “no” to the less than $50,000 question, additional questions are asked to determine if the family income is below $100,000 and below $75,000. The pilot test used to develop these questions is described elsewhere (17).
Based on preliminary data from the first quarter of 2007, 56% of the respondents eligible for the modified income follow-up questions answered all the questions in the applicable path. Initial evaluations of the distribution of poverty among selected demographic variables in the first quarter of 2007 suggest that poverty estimates are generally comparable with years 2006 and earlier (18). As a result of the changes in the questions, the 2007 through 2009 poverty ratio variable has fewer missing values compared with prior years. This reflects improved income item response rates.
NCHS imputes income for approximately 30% of NHIS records. Beginning with survey year 2007, the imputation procedure was modified to take into account the changes made to the income section. The imputed income files are released a few months after the annual release of NHIS microdata and are not available for the ER updates. Therefore, ER health insurance estimates stratified by poverty status are based only on the reported income and may differ from similar estimates produced later (e.g., in Health, United States (19)) that are based on both reported and imputed income.
Region – In the geographic classification of the U.S. population, states are grouped into the following four regions used by the U.S. Census Bureau:
| Region | States included |
|---|---|
| Northeast | Maine, Vermont, New Hampshire, Massachusetts, Connecticut, Rhode Island, New York, New Jersey, and Pennsylvania |
| Midwest | Ohio, Illinois, Indiana, Michigan, Wisconsin, Minnesota, Iowa, Missouri, North Dakota, South Dakota, Kansas, and Nebraska |
| South | Delaware, Maryland, District of Columbia, West Virginia, Virginia, Kentucky, Tennessee, North Carolina, South Carolina, Georgia, Florida, Alabama, Mississippi, Louisiana, Oklahoma, Arkansas, and Texas |
| West | Washington, Oregon, California, Nevada, New Mexico, Arizona, Idaho, Utah, Colorado, Montana, Wyoming, Alaska, and Hawaii |
Additional Early Release Program Products
Two additional reports are published through the Early Release (ER) Program. Early Release of Selected Estimates Based on Data From the National Health Interview Survey (20) is published quarterly and provides estimates of 15 selected measures of health, including insurance coverage. Other measures of health include estimates of usual place to go for medical care, obtaining needed medical care, influenza vaccination, pneumococcal vaccination, obesity, leisure-time physical activity, current smoking, alcohol consumption, HIV testing, general health status, personal care needs, serious psychological distress, diagnosed diabetes, and asthma episodes and current asthma. Wireless Substitution: Early Release of Estimates From the National Health Interview Survey (21) is published in May and December and provides selected estimates of telephone coverage in the United States.
New measures may be added as work continues and in response to changing data needs. Feedback on these releases is welcome (e-mail).
Announcements about ERs, other new data releases, publications, or corrections related to NHIS will be sent to members of the HISUSERS listserv. To join, visit the CDC Mailing list page.
Suggested citation
Cohen RA, Martinez ME, Ward BW. Health insurance coverage: Early release of estimates from the National Health Interview Survey, 2009. National Center for Health Statistics. June 2010. Available from: /nchs/nhis.htm.
Figures
Figure 1. Percentage of persons without health insurance, by three measurements and age group, and percentage of persons with health insurance at the time of interview, by coverage type and age group: United States, 2009
DATA SOURCE: CDC/NCHS, National Health Interview Survey, 2009, Family Core component. Data are based on household interviews of a sample of the civilian noninstitutionalized population.
Figure 2. Percentage of persons under age 65 years without health insurance coverage at the time of interview, by age group and sex: United States, 2009
DATA SOURCE: CDC/NCHS, National Health Interview Survey, 2009, Family Core component. Data are based on household interviews of a sample of the civilian noninstitutionalized population.
Figure 3. Percentage of persons under age 65 years who are enrolled in a high deductible health plan without a health savings account or in a consumer-directed health plan, among those with private health insurance: United States, 2007- 2009
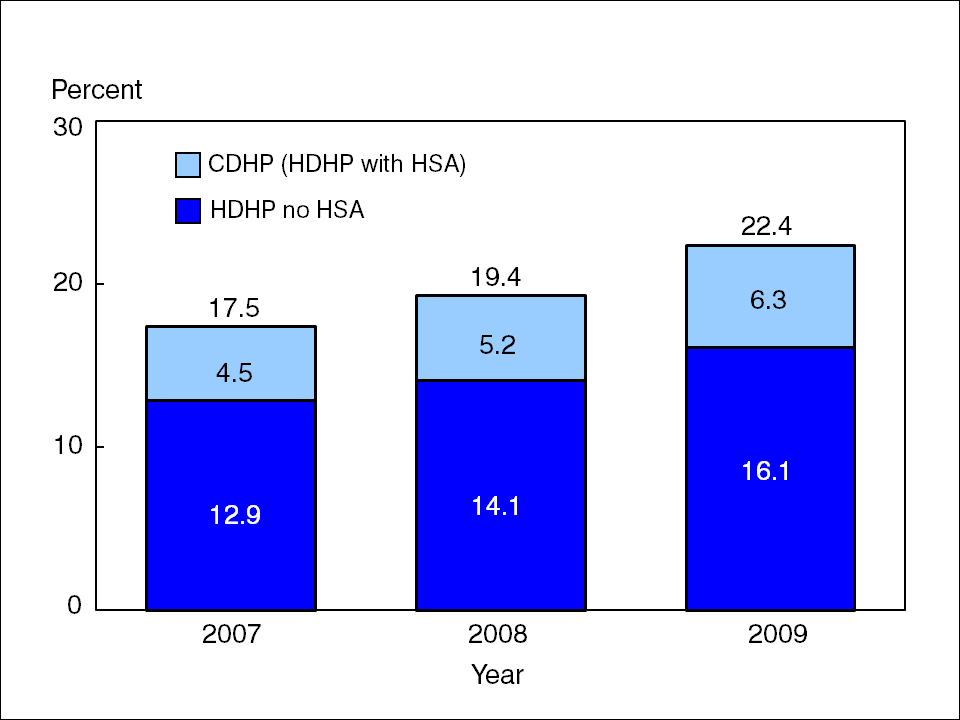
NOTES: HDHP no HSA is high deductible health plan without a health savings account. CDHP is consumer-directed health plan, which is a HDHP with a HSA. The individual components of HDHPs may not add to up to the total, due to rounding.
DATA SOURCE: CDC/NCHS, National Health Interview Survey, 2007-2009, Family Core component. Data are based on household interviews of a sample of the civilian noninstitutionalized population.
Figure 4. Percentage of persons under age 65 years with private health insurance who are enrolled in a high deductible health plan, by source of coverage: United States, 2007- 2009
DATA SOURCE: CDC/NCHS, National Health Interview Survey, 2007-2009, Family Core component. Data are based on household interviews of a sample of the civilian noninstitutionalized population.
Figure 5. Percentage of persons under age 65 years with private health insurance who are in a family with a flexible spending account for medical expenses: United States, 2007- 2009
DATA SOURCE: CDC/NCHS, National Health Interview Survey, 2007-2009, Family Core component. Data are based on household interviews of a sample of the civilian noninstitutionalized population.
Figure 6. Percentage of children under age 18 years who lacked health insurance coverage at the time of interview, for at least part of the past year, or for more than a year: United States, 1997- 2009
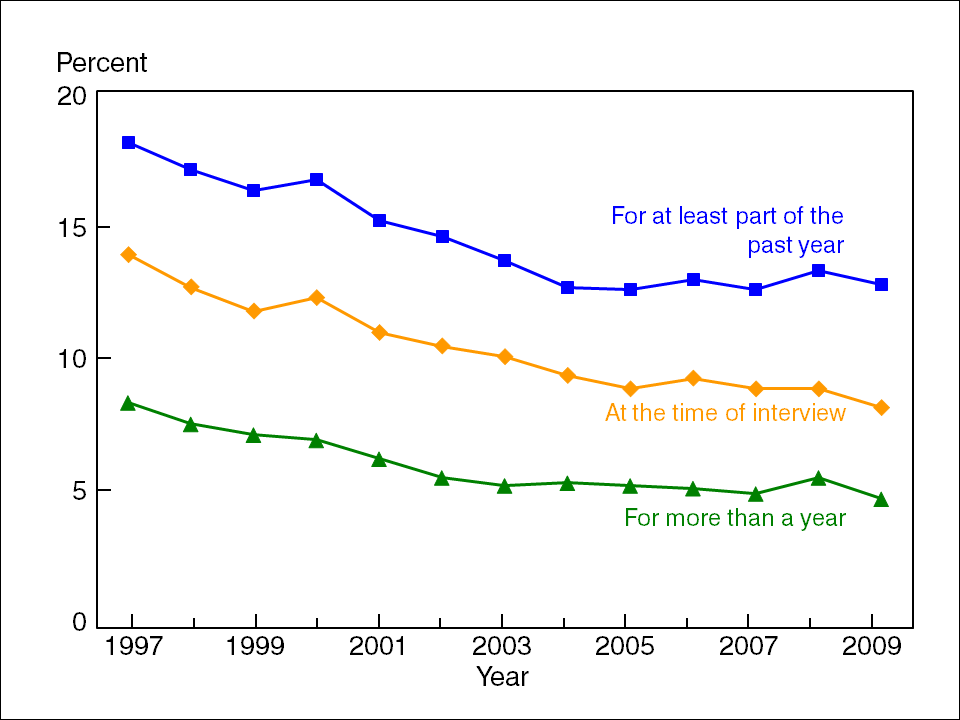
DATA SOURCE: CDC/NCHS, National Health Interview Survey, 1997-2009, Family Core component. Data are based on household interviews of a sample of the civilian noninstitutionalized population.
Figure 7. Percentage of adults aged 18-64 years who lacked health insurance coverage at the time of interview, for at least part of the past year, or for more than a year: United States, 1997- 2009
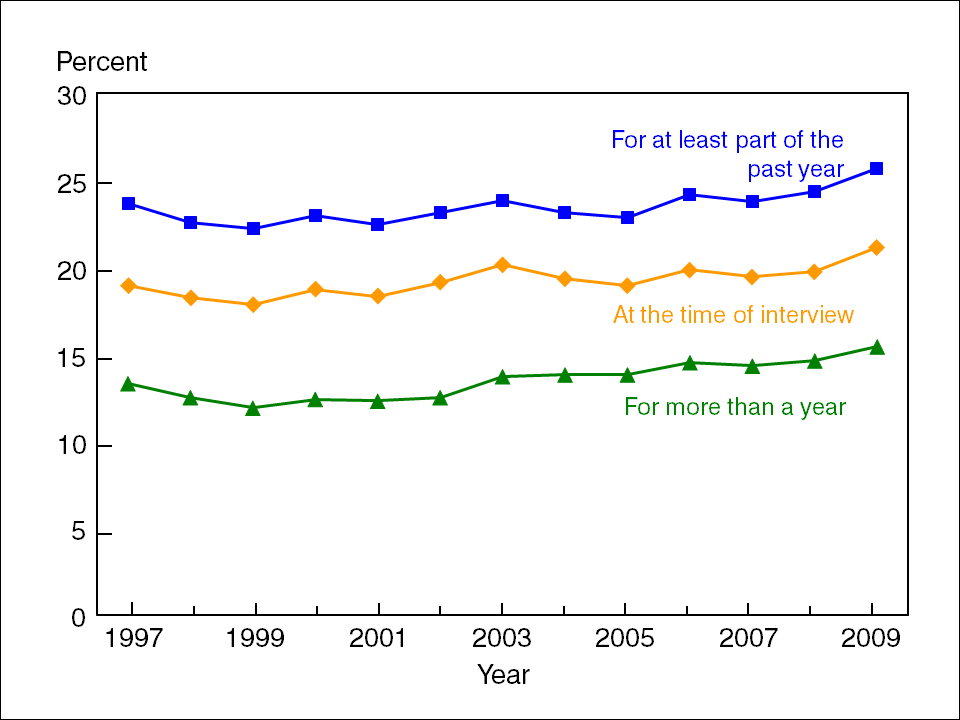
DATA SOURCE: CDC/NCHS, National Health Interview Survey, 1997-2009, Family Core component. The Data are based on household interviews of a sample of the civilian noninstitutionalized population.
Figure 8. Percentage uninsured at the time of interview, by poverty status, for children under age 18 years: United States, 1997- 2009
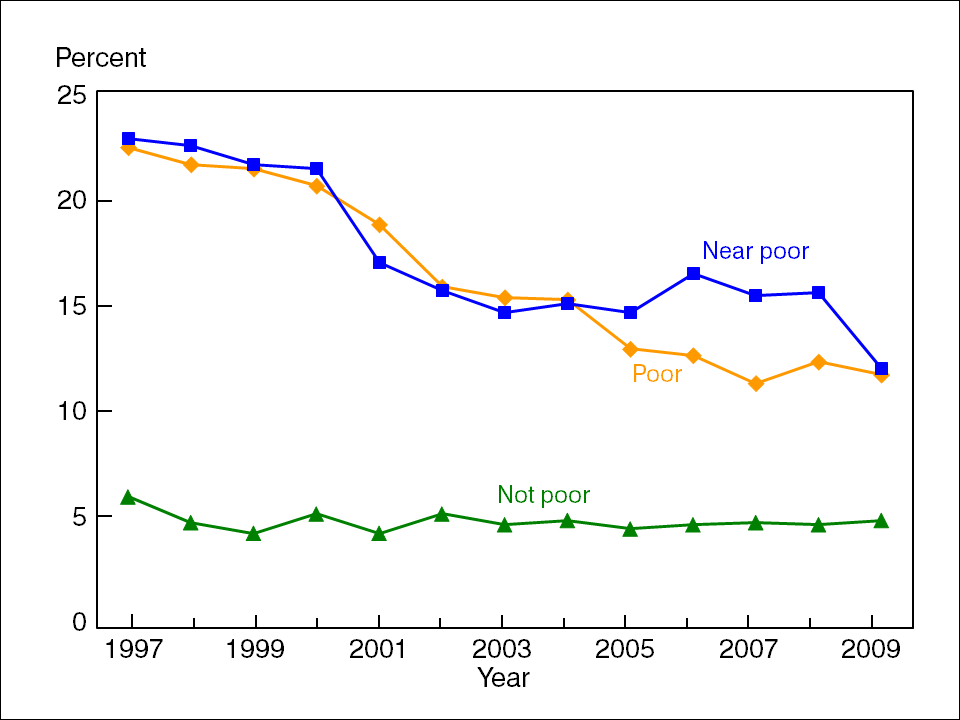
DATA SOURCE: CDC/NCHS, National Health Interview Survey, 1997-2009, Family Core componentData are based on household interviews of a sample of the civilian noninstitutionalized population.
Figure 9. Percentage uninsured at the time of interview, by poverty status, for adults aged 18-64 years: United States, 1997- 2009
DATA SOURCE: CDC/NCHS, National Health Interview Survey, 1997-2009, Family Core component. Data are based on household interviews of a sample of the civilian noninstitutionalized population.
Figure 10. Percentage with health insurance, by coverage type, and percentage uninsured at the time of interview, for near poor children under age 18 years: United States, 1997- 2009
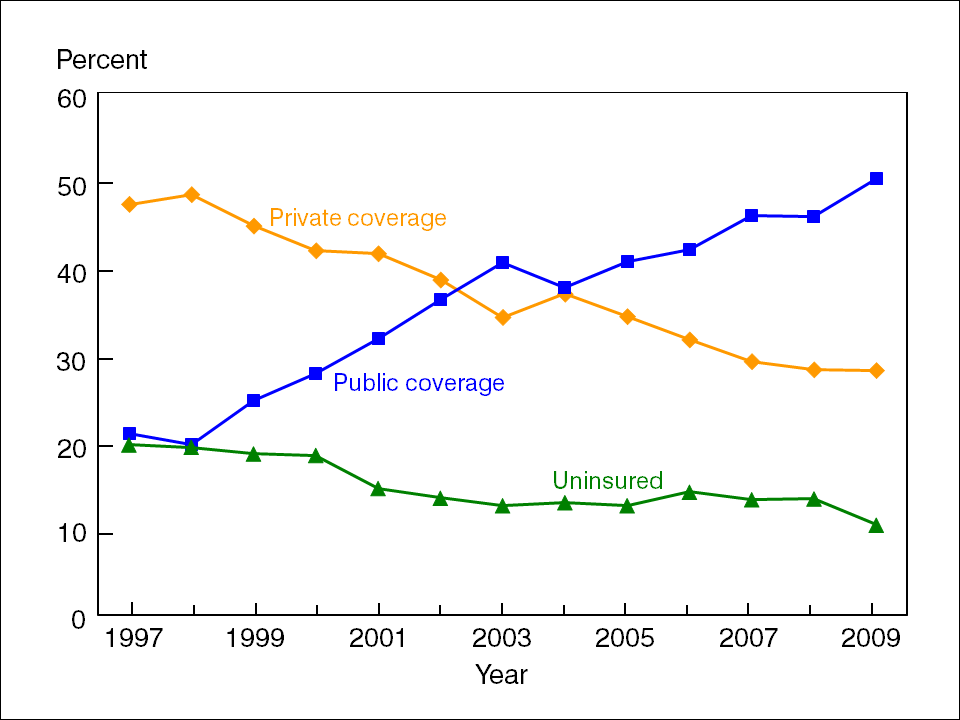
DATA SOURCE: CDC/NCHS, National Health Interview Survey, 1997-2009, Family Core component. Data are based on household interviews of a sample of the civilian noninstitutionalized population.
Figure 11. Percentage with health insurance, by coverage type, and percentage uninsured at the time of interview, for near poor adults aged 18-64 years: United States, 1997- 2009
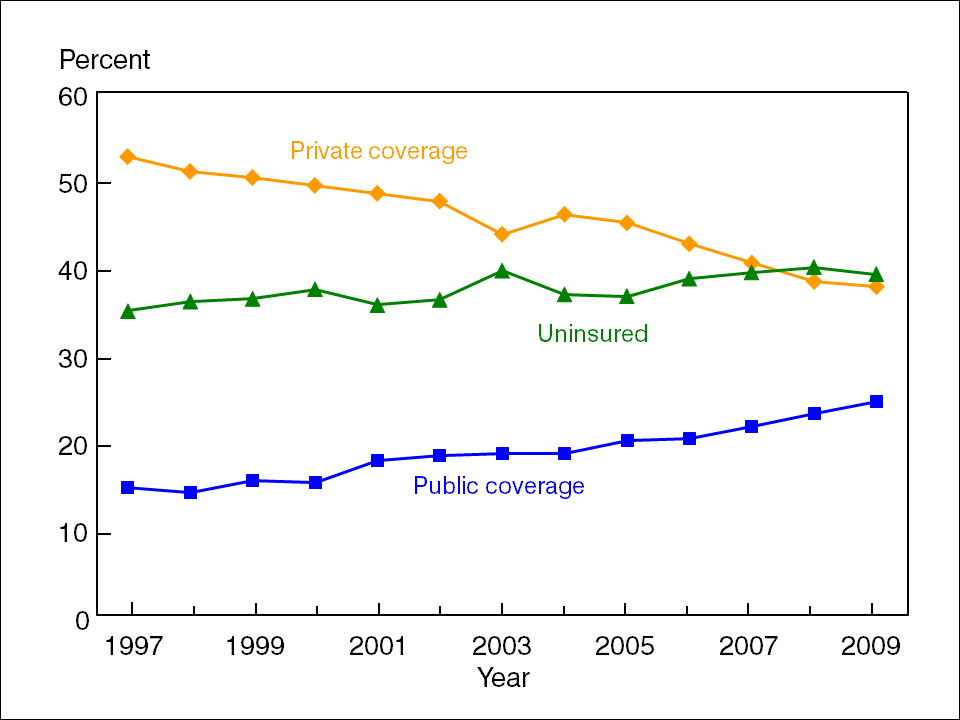
DATA SOURCE: CDC/NCHS, National Health Interview Survey, 1997-2009, Family Core component. Data are based on household interviews of a sample of the civilian noninstitutionalized population.
Tables
Table 1
Table 1a. Percentage of persons of all ages who lacked health insurance coverage at the time of interview, for at least part of the past year, or for more than a year: United States, 1997- 2009
|
All ages |
Uninsured1 at the time of interview | Uninsured1 for at least part of the past year2 | Uninsured1 for more than a year2 |
|---|---|---|---|
| Percent (standard error) | |||
| 1997 | 15.4 (0.21) | 19.5 (0.24) | 10.4 (0.18) |
| 1998 | 14.6 (0.23) | 18.6 (0.26) | 9.8 (0.19) |
| 1999 | 14.2 (0.22) | 18.2 (0.25) | 9.3 (0.19) |
| 2000 | 14.9 (0.22) | 18.7 (0.24) | 9.6 (0.18) |
| 2001 | 14.3 (0.23) | 18.0 (0.26) | 9.3 (0.18) |
| 2002 | 14.7 (0.22) | 18.3 (0.24) | 9.3 (0.17) |
| 2003 | 15.2 (0.24) | 18.6 (0.26) | 10.0 (0.19) |
| 2004 (Method 1)3 | 14.7 (0.21) | 18.0 (0.23) | 10.1 (0.17) |
| 2004 (Method 2)3 | 14.6 (0.20) | 17.9 (0.23) | 10.1 (0.17) |
| 2005 3 | 14.2 (0.21) | 17.6 (0.23) | 10.0 (0.18) |
| 2006 3,4 | 14.8 (0.26) | 18.6 (0.29) | 10.5 (0.22) |
| 2007 3 | 14.5 (0.29) | 18.2 (0.34) | 10.3 (0.24) |
| 2008 3 | 14.7 (0.32) | 18.7 (0.33) | 10.6 (0.26) |
| 2009 3 | 15.4 (0.30) | 19.4 (0.32) | 10.9 (0.26) |
See footnotes at end of Table 1d.
Table 1b. Percentage of persons under age 65 years who lacked health insurance coverage at the time of interview, for at least part of the past year, or for more than a year: United States, 1997- 2009
| Under 65 years | Uninsured1 at the time of interview | Uninsured1 for at least part of the past year2 | Uninsured1 for more than a year2 |
|---|---|---|---|
| Percent (standard error) | |||
| 1997 | 17.4 (0.24) | 21.9 (0.28) | 11.8 (0.21) |
| 1998 | 16.5 (0.26) | 20.9 (0.29) | 11.0 (0.21) |
| 1999 | 16.0 (0.25) | 20.4 (0.28) | 10.5 (0.21) |
| 2000 | 16.8 (0.24) | 21.0 (0.26) | 10.8 (0.20) |
| 2001 | 16.2 (0.26) | 20.3 (0.29) | 10.5 (0.21) |
| 2002 | 16.5 (0.24) | 20.6 (0.27) | 10.4 (0.19) |
| 2003 | 17.2 (0.27) | 20.9 (0.28) | 11.2 (0.21) |
| 2004 (Method 1)3 | 16.6 (0.23) | 20.2 (0.26) | 11.4 (0.19) |
| 2004 (Method 2)3 | 16.4 (0.23) | 20.1 (0.26) | 11.4 (0.19) |
| 2005 3 | 16.0 (0.24) | 19.9 (0.26) | 11.3 (0.21) |
| 2006 3,4 | 16.8 (0.29) | 20.9 (0.32) | 11.8 (0.25) |
| 2007 3 | 16.4 (0.33) | 20.5 (0.38) | 11.7 (0.27) |
| 2008 3 | 16.7 (0.36) | 21.2 (0.37) | 12.0 (0.29) |
| 2009 3 | 17.5 (0.34) | 22.0 (0.36) | 12.4 (0.29) |
See footnotes at end of Table 1d.
Table 1c. Percentage of persons aged 18-64 years who lacked health insurance coverage at the time of interview, for at least part of the past year, or for more than a year: United States, 1997- 2009
| 18-64 years | Uninsured1 at the time of interview | Uninsured1 for at least part of the past year2 | Uninsured1 for more than a year2 |
|---|---|---|---|
| Percent (standard error) | |||
| 1997 | 18.9 (0.23) | 23.6 (0.26) | 13.3 (0.21) |
| 1998 | 18.2 (0.27) | 22.5 (0.30) | 12.5 (0.23) |
| 1999 | 17.8 (0.26) | 22.2 (0.29) | 11.9 (0.23) |
| 2000 | 18.7 (0.27) | 22.9 (0.29) | 12.4 (0.23) |
| 2001 | 18.3 (0.27) | 22.4 (0.29) | 12.3 (0.22) |
| 2002 | 19.1 (0.26) | 23.1 (0.29) | 12.5 (0.21) |
| 2003 | 20.1 (0.29) | 23.8 (0.31) | 13.7 (0.25) |
| 2004 (Method 1)3 | 19.4 (0.26) | 23.2 (0.29) | 13.8 (0.21) |
| 2004 (Method 2)3 | 19.3 (0.26) | 23.1 (0.29) | 13.8 (0.21) |
| 2005 3 | 18.9 (0.26) | 22.8 (0.28) | 13.8 (0.23) |
| 2006 3,4 | 19.8 (0.33) | 24.1 (0.36) | 14.5 (0.29) |
| 2007 3 | 19.4 (0.36) | 23.7 (0.40) | 14.3 (0.32) |
| 2008 3 | 19.7 (0.40) | 24.3 (0.40) | 14.6 (0.34) |
| 2009 3 | 21.1 (0.37) | 25.6 (0.38) | 15.4 (0.34) |
See footnotes at end of Table 1d.
Table 1d. Percentage of persons under age 18 years who lacked health insurance coverage at the time of interview, for at least part of the past year, or for more than a year: United States, 1997- 2009
| Under age 18 | Uninsured1 at the time of interview | Uninsured1 for at least part of the past year2 | Uninsured1 for more than a year2 |
|---|---|---|---|
| Percent (standard error) | |||
| 1997 | 13.9 (0.36) | 18.1 (0.41) | 8.4 (0.29) |
| 1998 | 12.7 (0.34) | 17.1 (0.40) | 7.6 (0.27) |
| 1999 | 11.8 (0.32) | 16.3 (0.39) | 7.2 (0.26) |
| 2000 | 12.3 (0.32) | 16.7 (0.35) | 7.0 (0.23) |
| 2001 | 11.0 (0.34) | 15.2 (0.41) | 6.3 (0.25) |
| 2002 | 10.5 (0.32) | 14.6 (0.37) | 5.6 (0.24) |
| 2003 | 10.1 (0.34) | 13.7 (0.37) | 5.3 (0.25) |
| 2004 (Method 1)3 | 9.6 (0.29) | 12.9 (0.33) | 5.4 (0.25) |
| 2004 (Method 2)3 | 9.4 (0.29) | 12.7 (0.33) | 5.4 (0.25) |
| 2005 3 | 8.9 (0.29) | 12.6 (0.33) | 5.3 (0.24) |
| 2006 3,4 | 9.3 (0.34) | 13.0 (0.40) | 5.2 (0.26) |
| 2007 3 | 8.9 (0.40) | 12.6 (0.48) | 5.0 (0.28) |
| 2008 3 | 8.9 (0.43) | 13.3 (0.49) | 5.6 (0.35) |
| 2009 3 | 8.2 (0.40) | 12.8 (0.47) | 4.8 (0.31) |
1A person was defined as uninsured if he or she did not have any private health insurance, Medicare, Medicaid, Children’s Health Insurance Program (CHIP), state-sponsored or other government-sponsored health plan, or military plan. A person was also defined as uninsured if he or she had only Indian Health Service coverage or had only a private plan that paid for one type of service, such as accidents or dental care.
2A year is defined as the 12 months prior to interview.
3Beginning in the third quarter of 2004, two additional questions were added to the National Health Interview Survey (NHIS) insurance section to reduce potential errors in reporting Medicare and Medicaid status. Persons aged 65 years and over not reporting Medicare coverage were asked explicitly about Medicare coverage, and persons under age 65 with no reported coverage were asked explicitly about Medicaid coverage. Estimates of uninsurance for 2004 were calculated without using the additional information from these questions (noted as Method 1) and with the responses to these questions (noted as Method 2). Respondents who were reclassified as “covered” by the additional questions received the appropriate follow-up questions concerning periods of noncoverage for insured respondents. These reclassified respondents were excluded in the tabulation of “uninsured for more than a year” using Method 1 in 2004. Beginning in 2005, all estimates were calculated using Method 2. See “Technical Notes ” for additional information.
4In 2006, NHIS underwent a sample redesign. The impact of the new sample design on estimates presented in this report is minimal.
DATA SOURCE: CDC/NCHS, National Health Interview Survey, 1997-2009, Family Core component. Data are based on household interviews of a sample of the civilian noninstitutionalized population.
Table 2
Table 2a. Number of persons of all ages who lacked health insurance coverage at the time of interview, for at least part of the past year, or for more than a year: United States, 1997- 2009
| All ages | Uninsured1 at the time of interview | Uninsured1 for at least part of the past year2 | Uninsured1 for more than a year2 |
|---|---|---|---|
| Number in millions | |||
| 1997 | 41.0 | 51.9 | 27.7 |
| 1998 | 39.3 | 49.9 | 26.3 |
| 1999 | 38.7 | 49.4 | 25.3 |
| 2000 | 41.3 | 51.8 | 26.6 |
| 2001 | 40.2 | 50.4 | 26.1 |
| 2002 | 41.5 | 51.7 | 26.2 |
| 2003 | 43.6 | 53.1 | 28.5 |
| 2004 (Method 1)3 | 42.5 | 52.0 | 29.2 |
| 2004 (Method 2)3 | 42.1 | 51.6 | 29.2 |
| 2005 3 | 41.2 | 51.3 | 29.2 |
| 2006 3,4 | 43.6 | 54.5 | 30.7 |
| 2007 3 | 43.1 | 53.9 | 30.6 |
| 2008 3 | 43.8 | 55.9 | 31.7 |
| 2009 3 | 46.3 | 58.5 | 32.8 |
See footnotes at end of Table 2d.
Table 2b. Number of persons under age 65 years who lacked health insurance coverage at the time of interview, for at least part of the past year, or for more than a year: United States, 1997- 2009
| Under 65 years | Uninsured1 at the time of interview | Uninsured1 for at least part of the past year2 | Uninsured1 for more than a year2 |
|---|---|---|---|
| Number in millions | |||
| 1997 | 40.7 | 51.4 | 27.6 |
| 1998 | 39.0 | 49.5 | 26.2 |
| 1999 | 38.3 | 48.9 | 25.1 |
| 2000 | 40.8 | 51.3 | 26.4 |
| 2001 | 39.8 | 49.9 | 25.9 |
| 2002 | 41.1 | 51.2 | 25.9 |
| 2003 | 43.2 | 52.5 | 28.3 |
| 2004 (Method 1)3 | 42.0 | 51.3 | 28.9 |
| 2004 (Method 2)3 | 41.7 | 51.0 | 28.9 |
| 2005 3 | 41.0 | 50.9 | 29.0 |
| 2006 3,4 | 43.3 | 54.0 | 30.5 |
| 2007 3 | 42.8 | 53.5 | 30.4 |
| 2008 3 | 43.6 | 55.5 | 31.6 |
| 2009 3 | 46.0 | 57.9 | 32.6 |
See footnotes at end of Table 2d.
Table 2c. Number of persons aged 18-64 years who lacked health insurance coverage at the time of interview, for at least part of the past year, or for more than a year: United States, 1997- 2009
| 18-64 years | Uninsured1 at the time of interview | Uninsured1 for at least part of the past year2 | Uninsured1 for more than a year2 |
|---|---|---|---|
| Number in millions | |||
| 1997 | 30.8 | 38.5 | 21.7 |
| 1998 | 30.0 | 37.2 | 20.7 |
| 1999 | 29.8 | 37.1 | 19.9 |
| 2000 | 32.0 | 39.2 | 21.3 |
| 2001 | 31.9 | 38.9 | 21.4 |
| 2002 | 33.5 | 40.6 | 21.9 |
| 2003 | 35.9 | 42.5 | 24.5 |
| 2004 (Method 1)3 | 35.0 | 41.9 | 25.0 |
| 2004 (Method 2)3 | 34.9 | 41.8 | 25.0 |
| 2005 3 | 34.5 | 41.7 | 25.2 |
| 2006 3,4 | 36.5 | 44.5 | 26.8 |
| 2007 3 | 36.3 | 44.2 | 26.8 |
| 2008 3 | 37.1 | 45.6 | 27.5 |
| 2009 3 | 40.0 | 48.4 | 29.1 |
See footnotes at end of Table 2d.
Table 2d. Number of persons under age 18 years who lacked health insurance coverage at the time of interview, for at least part of the past year, or for more than a year: United States, 1997- 2009
| Under 18 years | Uninsured1 at the time of interview | Uninsured1 for at least part of the past year2 | Uninsured1 for more than a year2 |
|---|---|---|---|
| Number in millions | |||
| 1997 | 9.9 | 12.9 | 6.0 |
| 1998 | 9.1 | 12.3 | 5.5 |
| 1999 | 8.5 | 11.8 | 5.2 |
| 2000 | 8.9 | 12.0 | 5.1 |
| 2001 | 7.9 | 11.0 | 4.5 |
| 2002 | 7.6 | 10.6 | 4.1 |
| 2003 | 7.3 | 10.0 | 3.9 |
| 2004 (Method 1)3 | 7.0 | 9.4 | 4.0 |
| 2004 (Method 2)3 | 6.8 | 9.3 | 3.9 |
| 2005 3 | 6.5 | 9.3 | 3.9 |
| 2006 3,4 | 6.8 | 9.5 | 3.8 |
| 2007 3 | 6.5 | 9.3 | 3.7 |
| 2008 3 | 6.6 | 9.9 | 4.1 |
| 2009 3 | 6.1 | 9.5 | 3.6 |
1A person was defined as uninsured if he or she did not have any private health insurance, Medicare, Medicaid, Children’s Health Insurance Program (CHIP), state-sponsored or other government-sponsored health plan, or military plan. A person was also defined as uninsured if he or she had only Indian Health Service coverage or had only a private plan that paid for one type of service, such as accidents or dental care.
2A year is defined as the 12 months prior to interview.
3Beginning in the third quarter of 2004, two additional questions were added to the National Health Interview Survey (NHIS) insurance section to reduce potential errors in reporting Medicare and Medicaid status. Persons aged 65 years and over not reporting Medicare coverage were asked explicitly about Medicare coverage, and persons under age 65 with no reported coverage were asked explicitly about Medicaid coverage. Estimates of uninsurance for 2004 were calculated without using the additional information from these questions (noted as Method 1) and with the responses to these questions (noted as Method 2). Respondents who were reclassified as “covered” by the additional questions received the appropriate follow-up questions concerning periods of noncoverage for insured respondents. These reclassified respondents were excluded in the tabulation of “uninsured for more than a year”using Method 1 in 2004. Beginning in 2005, all estimates were calculated using Method 2. See “Technical Notes ” for additional information.
4In 2006, NHIS underwent a sample redesign. The impact of the new sample design on estimates presented in this report is minimal.
DATA SOURCE: CDC/NCHS, National Health Interview Survey, 1997-2009, Family Core component. Data are based on household interviews of a sample of the civilian noninstitutionalized population.
Table 3
Table 3a. Percentage of persons under age 65 years with public health plan coverage at the time of interview, by age group: United States, 1997- 2009
| Public health plan coverage1 | Under 65 years | Under 18 years | 18-64 years |
|---|---|---|---|
| Percent (standard error) | |||
| 1997 | 13.6 (0.25) | 21.4 (0.48) | 10.2 (0.20) |
| 1998 | 12.7 (0.26) | 20.0 (0.49) | 9.5 (0.21) |
| 1999 | 12.4 (0.24) | 20.4 (0.46) | 9.0 (0.19) |
| 2000 | 12.9 (0.26) | 22.0 (0.50) | 9.1 (0.19) |
| 2001 | 13.6 (0.26) | 23.6 (0.50) | 9.4 (0.21) |
| 2002 | 15.2 (0.29) | 27.1 (0.54) | 10.3 (0.23) |
| 2003 | 16.0 (0.31) | 28.6 (0.58) | 10.9 (0.24) |
| 2004 (Method 1)3 | 16.1 (0.29) | 28.5 (0.54) | 11.1 (0.22) |
| 2004 (Method 2)3 | 16.2 (0.29) | 28.7 (0.54) | 11.1 (0.23) |
| 2005 3 | 16.8 (0.29) | 29.9 (0.56) | 11.5 (0.22) |
| 2006 3,4 | 18.1 (0.35) | 32.3 (0.69) | 12.4 (0.26) |
| 2007 3 | 18.1 (0.40) | 32.7 (0.77) | 12.3 (0.31) |
| 2008 3 | 19.3 (0.42) | 34.2 (0.79) | 13.4 (0.33) |
| 2009 3 | 21.0 (0.39) | 37.7 (0.76) | 14.4 (0.31) |
See footnotes at end of Table 3b.
Table 3b. Percentage of persons under age 65 years with private health insurance coverage at the time of interview, by age group: United States, 1997- 2009
| Private health insurance coverage2 | Under 65 years | Under 18 years | 18-64 years |
|---|---|---|---|
| Percent (standard error) | |||
| 1997 | 70.8 (0.35) | 66.2 (0.57) | 72.8 (0.30) |
| 1998 | 72.0 (0.36) | 68.5 (0.55) | 73.5 (0.32) |
| 1999 | 73.1 (0.36) | 69.1 (0.55) | 74.7 (0.33) |
| 2000 | 71.8 (0.34) | 67.1 (0.53) | 73.8 (0.32) |
| 2001 | 71.6 (0.37) | 66.7 (0.57) | 73.7 (0.33) |
| 2002 | 69.8 (0.39) | 63.9 (0.61) | 72.3 (0.35) |
| 2003 | 68.2 (0.40) | 62.6 (0.60) | 70.6 (0.36) |
| 2004 3 | 68.6 (0.39) | 63.1 (0.59) | 70.9 (0.36) |
| 2005 3 | 68.4 (0.39) | 62.4 (0.60) | 70.9 (0.36) |
| 2006 3,4 | 66.5 (0.48) | 59.7 (0.72) | 69.2 (0.43) |
| 2007 3 | 66.8 (0.53) | 59.9 (0.82) | 69.6 (0.47) |
| 2008 3 | 65.4 (0.57) | 58.3 (0.84) | 68.1 (0.54) |
| 2009 3 | 62.9 (0.54) | 55.7 (0.86) | 65.8 (0.47) |
1“Public health plan coverage” includes Medicaid, Children’s Health Insurance Program (CHIP), state-sponsored or other government-sponsored health plan, Medicare (disability), and military plans.
2“Private health insurance coverage” excludes plans that paid for only one type of service, such as accidents or dental care. A small number of persons were covered by both public and private plans and were included in both categories.
3Beginning in the third quarter of 2004, two additional questions were added to the National Health Interview Survey (NHIS) insurance section to reduce potential errors in reporting Medicare and Medicaid status. Persons aged 65 years and over not reporting Medicare coverage were asked explicitly about Medicare coverage, and persons under age 65 with no reported coverage were asked explicitly about Medicaid coverage. Estimates of uninsurance for 2004 were calculated without using the additional information from these questions (noted as Method 1) and with the responses to these questions (noted as Method 2). Respondents who were reclassified as “covered” by the additional questions received the appropriate follow-up questions concerning periods of noncoverage for insured respondents. The two additional questions added beginning in the third quarter of 2004 did not affect the estimates of private coverage. Beginning in 2005, all estimates were calculated using Method 2. See “Technical Notes ” for additional information.
4In 2006, NHIS underwent a sample redesign. The impact of the new sample design on estimates presented in this report is minimal.
DATA SOURCE: CDC/NCHS, National Health Interview Survey, 1997-2009, Family Core component. Data are based on household interviews of a sample of the civilian noninstitutionalized population.
Table 4
Table 4a. Percentage uninsured at the time of interview for persons under age 65 years, by poverty status: United States, 1997- 2009
| Under 65 years | Poverty status1 | ||||
|---|---|---|---|---|---|
| Total | Poor | Near poor | Not poor | Unknown | |
| Percent uninsured2 (standard error) | |||||
| 1997 | 17.4 (0.24) | 32.7 (0.80) | 30.4 (0.70) | 8.9 (0.22) | 21.6 (0.59) |
| 1998 | 16.5 (0.26) | 32.7 (0.84) | 30.8 (0.79) | 8.0 (0.22) | 20.7 (0.59) |
| 1999 | 16.0 (0.25) | 32.1 (0.93) | 30.7 (0.73) | 7.8 (0.20) | 20.1 (0.48) |
| 2000 | 16.8 (0.24) | 32.7 (0.89) | 31.3 (0.69) | 8.7 (0.22) | 19.7 (0.51) |
| 2001 | 16.2 (0.26) | 31.0 (0.99) | 28.6 (0.69) | 8.4 (0.21) | 20.3 (0.53) |
| 2002 | 16.5 (0.24) | 28.6 (0.80) | 28.3 (0.70) | 9.5 (0.24) | 20.7 (0.55) |
| 2003 | 17.2 (0.27) | 29.4 (0.91) | 30.2 (0.70) | 9.1 (0.25) | 21.3 (0.52) |
| 2004 (Method 1)3,4 | 16.6 (0.23) | 30.5 (0.93) | 29.1 (0.67) | 9.4 (0.23) | 18.7 (0.48) |
| 2004 (Method 2)3,4 | 16.4 (0.23) | 30.1 (0.91) | 28.9 (0.67) | 9.4 (0.23) | 18.6 (0.48) |
| 2005 3 | 16.0 (0.24) | 28.4 (0.78) | 28.6 (0.63) | 9.1 (0.22) | 18.5 (0.48) |
| 2006 3,5 | 16.8 (0.29) | 29.2 (0.98) | 30.8 (0.80) | 9.7 (0.29) | 17.5 (0.49) |
| 2007 6 | 16.4 (0.33) | 28.0 (1.04) | 30.2 (0.91) | 9.8 (0.27) | 20.8 (0.74) |
| 2008 3 | 16.7 (0.36) | 27.9 (1.08) | 30.6 (0.82) | 10.2 (0.27) | 21.0 (0.73) |
| 2009 3 | 17.5 (0.34) | 30.2 (0.89) | 29.4 (0.77) | 10.7 (0.29) | 22.3 (0.85) |
See footnotes at end of Table 4c.
Table 4b. Percentage uninsured at the time of interview for persons under age 18 years, by poverty status: United States, 1997- 2009
| Under 18 years | Poverty status1 | ||||
|---|---|---|---|---|---|
| Total | Poor | Near poor | Not poor | Unknown | |
| Percent uninsured2 (standard error) | |||||
| 1997 | 13.9 (0.36) | 22.4 (0.99) | 22.8 (0.96) | 6.1 (0.33) | 18.3 (0.90) |
| 1998 | 12.7 (0.34) | 21.6 (1.02) | 22.5 (0.97) | 4.9 (0.29) | 16.5 (0.75) |
| 1999 | 11.8 (0.32) | 21.4 (1.13) | 21.6 (0.92) | 4.4 (0.29) | 14.9 (0.69) |
| 2000 | 12.3 (0.32) | 20.6 (1.04) | 21.4 (0.93) | 5.3 (0.30) | 15.0 (0.72) |
| 2001 | 11.0 (0.34) | 18.8 (1.24) | 17.0 (0.85) | 4.4 (0.26) | 15.5 (0.84) |
| 2002 | 10.5 (0.32) | 15.9 (0.97) | 15.7 (0.84) | 5.3 (0.36) | 14.1 (0.76) |
| 2003 | 10.1 (0.34) | 15.4 (1.06) | 14.7 (0.88) | 4.8 (0.33) | 13.5 (0.67) |
| 2004 (Method 1)3,4 | 9.6 (0.29) | 16.2 (1.23) | 15.5 (0.81) | 5.0 (0.30) | 10.5 (0.56) |
| 2004 (Method 2)3,4 | 9.4 (0.29) | 15.3 (1.17) | 15.1 (0.81) | 5.0 (0.30) | 10.3 (0.56) |
| 2005 3 | 8.9 (0.29) | 13.0 (0.92) | 14.7 (0.79) | 4.6 (0.30) | 11.0 (0.66) |
| 2006 3,5 | 9.3 (0.34) | 12.7 (1.06) | 16.5 (1.05) | 4.8 (0.39) | 10.0 (0.63) |
| 2007 6 | 8.9 (0.40) | 11.4 (1.08) | 15.5 (1.10) | 4.9 (0.34) | 11.8 (1.01) |
| 2008 3 | 8.9 (0.43) | 12.4 (1.13) | 15.6 (1.07) | 4.8 (0.39) | 11.0 (0.97) |
| 2009 3 | 8.2 (0.40) | 11.8 (0.94) | 12.1 (0.90) | 5.0 (0.39) | 9.8 (0.99) |
See footnotes at end of Table 4c.
Table 4c. Percentage uninsured at the time of interview for persons aged 18-64 years, by poverty status: United States, 1997- 2009
| 18-64 years | Poverty status1 | ||||
|---|---|---|---|---|---|
| Total | Poor | Near poor | Not poor | Unknown | |
| Percent uninsured2 (standard error) | |||||
| 1997 | 18.9 (0.23) | 40.2 (0.88) | 34.9 (0.71) | 9.9 (0.22) | 22.9 (0.58) |
| 1998 | 18.2 (0.27) | 40.8 (1.02) | 36.0 (0.83) | 9.2 (0.23) | 22.2 (0.60) |
| 1999 | 17.8 (0.26) | 39.9 (1.11) | 36.3 (0.81) | 9.0 (0.20) | 22.2 (0.50) |
| 2000 | 18.7 (0.27) | 41.1 (1.05) | 37.4 (0.77) | 10.0 (0.24) | 21.5 (0.53) |
| 2001 | 18.3 (0.27) | 39.5 (1.19) | 35.6 (0.78) | 9.9 (0.22) | 22.1 (0.52) |
| 2002 | 19.1 (0.26) | 37.0 (1.09) | 36.2 (0.77) | 11.0 (0.25) | 23.2 (0.56) |
| 2003 | 20.1 (0.29) | 38.2 (1.19) | 39.5 (0.81) | 10.6 (0.27) | 24.2 (0.56) |
| 2004 (Method 1)3,4 | 19.4 (0.26) | 40.1 (1.10) | 36.9 (0.72) | 11.0 (0.26) | 21.7 (0.54) |
| 2004 (Method 2)3,4 | 19.3 (0.26) | 39.9 (1.09) | 36.8 (0.73) | 11.0 (0.26) | 21.6 (0.54) |
| 2005 3 | 18.9 (0.26) | 38.5 (0.95) | 36.6 (0.73) | 10.7 (0.24) | 21.2 (0.52) |
| 2006 3,5 | 19.8 (0.33) | 40.0 (1.33) | 38.6 (0.89) | 11.4 (0.31) | 20.3 (0.54) |
| 2007 6 | 19.4 (0.36) | 38.6 (1.47) | 39.3 (1.01) | 11.4 (0.29) | 23.8 (0.79) |
| 2008 3 | 19.7 (0.40) | 37.7 (1.49) | 39.9 (0.94) | 11.9 (0.28) | 24.4 (0.83) |
| 2009 3 | 21.1 (0.37) | 42.5 (1.20) | 39.1 (0.85) | 12.5 (0.31) | 26.7 (0.99) |
1Poverty status is based on family income and family size, using the U.S. Census Bureau’s poverty thresholds. “Poor” persons are defined as those below the poverty threshold; “near poor” persons have incomes of 100% to less than 200% of the poverty threshold; and “not poor” persons have incomes of 200% of the poverty threshold or greater. The percentage of respondents with unknown poverty status was 19.1% in 1997, 23.6% in 1998, 26.4% in 1999, 27.0% in 2000, 27.1% in 2001, 28.1% in 2002, 31.5% in 2003, 29.6% in 2004, 28.9% in 2005, 30.7% in 2006, 18.0% in 2007, 15.8% in 2008, and 12.3% in 2009. For more information on the unknown income and poverty status categories, see the National Health Interview Survey (NHIS) Survey Description Document for years 1997-2005, available from: /nchs/nhis.htm. Estimates may differ from estimates based on both reported and imputed income. See “Technical Notes” for a discussion of the use of imputed income in the stratification of health insurance coverage by poverty status.
2A person was defined as uninsured if he or she did not have any private health insurance, Medicare, Medicaid, Children’s Health Insurance Program (CHIP), state-sponsored or other government-sponsored health plan, or military plan at the time of the interview. A person was also defined as uninsured if he or she had only Indian Health Service coverage or had only a private plan that paid for one type of service, such as accidents or dental care.
3Beginning in the third quarter of 2004, two additional questions were added to the NHIS insurance section to reduce potential errors in reporting Medicare and Medicaid status. Persons aged 65 years and over not reporting Medicare coverage were asked explicitly about Medicare coverage, and persons under age 65 with no reported coverage were asked explicitly about Medicaid coverage. Estimates of uninsurance for 2004 were calculated without using the additional information from these questions (noted as Method 1) and with the responses to these questions (noted as Method 2). Respondents who were reclassified as “covered” by the additional questions
received the appropriate follow-up questions concerning periods of noncoverage for insured respondents. Beginning in 2005, all estimates were calculated using Method 2. See “Technical Notes” for additional information.
4In 2004, a much larger than expected proportion of respondents reported a family income of “$2.” Based on extensive review, these “$2” responses were coded to “not ascertained” for the final 2004 NHIS data files. Effective with the March 2006 Early Release report, the 2004 estimates were recalculated to reflect this editing decision. For a complete discussion, see the NHIS Survey Description Document for 2004, available from the NHIS website. The problem with the “$2” income reports was fixed in the 2005 NHIS.
5In 2006, NHIS underwent a sample redesign. The impact of the new sample design on estimates presented in this report is minimal.
6In 2007, the income section of NHIS was redesigned, and estimates by poverty status may not be directly comparable with earlier years. See “Technical Notes ” for further information on the income question changes.
DATA SOURCE: CDC/NCHS, National Health Interview Survey, 1997-2009, Family Core component. Data are based on household interviews of a sample of the civilian noninstitutionalized population.
Table 5
Table 5a. Percentage of persons under age 65 years with public health plan coverage at the time of interview, by poverty status: United States, 1997- 2009
| Under 65 years | Poverty status1 | ||||
|---|---|---|---|---|---|
| Total | Poor | Near poor | Not poor | Unknown | |
| Percent of persons with public health plan coverage2 (standard error) | |||||
| 1997 | 13.6 (0.25) | 46.1 (1.01) | 18.2 (0.56) | 5.3 (0.19) | 13.2 (0.49) |
| 1998 | 12.7 (0.26) | 44.7 (1.05) | 17.5 (0.57) | 5.1 (0.23) | 13.4 (0.45) |
| 1999 | 12.4 (0.24) | 43.4 (1.04) | 20.5 (0.63) | 4.8 (0.18) | 13.2 (0.43) |
| 2000 | 12.9 (0.26) | 43.7 (1.11) | 21.7 (0.62) | 5.3 (0.21) | 12.8 (0.42) |
| 2001 | 13.6 (0.26) | 45.0 (1.14) | 25.0 (0.69) | 5.7 (0.21) | 13.1 (0.42) |
| 2002 | 15.2 (0.29) | 47.0 (1.07) | 27.5 (0.72) | 6.1 (0.24) | 16.6 (0.45) |
| 2003 | 16.0 (0.31) | 48.8 (1.16) | 29.3 (0.75) | 6.6 (0.27) | 15.8 (0.48) |
| 2004 (Method 1)3,4 | 16.1 (0.29) | 50.7 (1.02) | 27.6 (0.69) | 6.9 (0.23) | 16.0 (0.47) |
| 2004 (Method 2)3,4 | 16.2 (0.29) | 51.1 (1.01) | 27.8 (0.68) | 6.9 (0.23) | 16.1 (0.47) |
| 2005 3 | 16.8 (0.29) | 50.6 (0.98) | 30.0 (0.72) | 7.4 (0.22) | 16.4 (0.48) |
| 2006 3,5 | 18.1 (0.35) | 51.5 (1.17) | 30.5 (0.78) | 7.5 (0.28) | 17.9 (0.64) |
| 2007 6 | 18.1 (0.40) | 53.3 (1.34) | 33.9 (0.91) | 7.6 (0.30) | 18.6 (0.77) |
| 2008 3 | 19.3 (0.42) | 55.5 (1.22) | 34.7 (0.92) | 8.5 (0.30) | 19.4 (0.90) |
| 2009 3 | 21.0 (0.39) | 56.7 (1.06) | 36.7 (0.85) | 9.0 (0.30) | 20.8 (0.88) |
See footnotes at end of Table 5c.
Table 5b. Percentage of persons under age 18 years with public health plan coverage at the time of interview, by poverty status: United States, 1997- 2009
| Under 18 years | Poverty status1 | ||||
|---|---|---|---|---|---|
| Total | Poor | Near poor | Not poor | Unknown | |
| Percent of persons with public health plan coverage2 (standard error) | |||||
| 1997 | 21.4 (0.48) | 62.1 (1.31) | 24.3 (0.93) | 6.3 (0.32) | 21.4 (0.97) |
| 1998 | 20.0 (0.49) | 61.1 (1.34) | 22.9 (0.95) | 6.0 (0.39) | 22.1 (0.95) |
| 1999 | 20.4 (0.46) | 60.7 (1.37) | 28.7 (1.15) | 6.0 (0.32) | 22.2 (0.88) |
| 2000 | 22.0 (0.50) | 61.8 (1.48) | 32.4 (1.13) | 7.4 (0.39) | 22.1 (0.85) |
| 2001 | 23.6 (0.50) | 65.2 (1.47) | 37.0 (1.23) | 8.1 (0.39) | 23.1 (0.94) |
| 2002 | 27.1 (0.54) | 69.0 (1.33) | 42.2 (1.18) | 8.9 (0.45) | 30.7 (0.99) |
| 2003 | 28.6 (0.58) | 72.3 (1.32) | 47.2 (1.27) | 9.8 (0.48) | 28.5 (1.00) |
| 2004 (Method 1)3,4 | 28.5 (0.54) | 72.5 (1.36) | 43.4 (1.20) | 9.7 (0.45) | 30.4 (1.01) |
| 2004 (Method 2)3,4 | 28.7 (0.54) | 73.4 (1.34) | 43.8 (1.20) | 9.7 (0.45) | 30.6 (1.01) |
| 2005 3 | 29.9 (0.56) | 73.3 (1.32) | 47.3 (1.21) | 10.7 (0.47) | 30.8 (1.05) |
| 2006 3,5 | 32.3 (0.69) | 75.8 (1.32) | 49.0 (1.45) | 10.4 (0.53) | 33.1 (1.25) |
| 2007 6 | 32.7 (0.77) | 78.7 (1.38) | 53.5 (1.44) | 11.0 (0.60) | 34.0 (1.54) |
| 2008 3 | 34.2 (0.79) | 79.4 (1.37) | 53.4 (1.58) | 13.1 (0.62) | 35.1 (1.72) |
| 2009 3 | 37.7 (0.76) | 81.4 (1.11) | 58.4 (1.42) | 13.7 (0.63) | 36.1 (2.05) |
See footnotes at end of Table 5c.
Table 5c. Percentage of persons aged 18-64 years with public health plan coverage at the time of interview, by poverty status: United States, 1997- 2009
| 18-64 years | Poverty status1 | ||||
|---|---|---|---|---|---|
| Total | Poor | Near poor | Not poor | Unknown | |
| Percent of persons with public health plan coverage2 (standard error) | |||||
| 1997 | 10.2 (0.20) | 34.3 (0.93) | 14.6 (0.51) | 5.0 (0.18) | 10.1 (0.41) |
| 1998 | 9.5 (0.21) | 32.9 (1.08) | 14.1 (0.53) | 4.8 (0.21) | 10.0 (0.34) |
| 1999 | 9.0 (0.19) | 30.8 (0.98) | 15.4 (0.52) | 4.4 (0.17) | 9.6 (0.33) |
| 2000 | 9.1 (0.19) | 31.1 (1.00) | 15.2 (0.54) | 4.5 (0.19) | 9.1 (0.33) |
| 2001 | 9.4 (0.21) | 30.8 (1.10) | 17.8 (0.62) | 4.8 (0.20) | 9.4 (0.33) |
| 2002 | 10.3 (0.23) | 32.5 (1.10) | 18.3 (0.66) | 5.1 (0.22) | 11.2 (0.35) |
| 2003 | 10.9 (0.24) | 34.0 (1.19) | 18.6 (0.68) | 5.5 (0.24) | 11.1 (0.37) |
| 2004 (Method 1)3,4 | 11.1 (0.22) | 36.1 (1.03) | 18.5 (0.61) | 5.9 (0.21) | 10.8 (0.35) |
| 2004 (Method 2)3,4 | 11.1 (0.23) | 36.3 (1.03) | 18.6 (0.60) | 5.9 (0.21) | 10.9 (0.35) |
| 2005 3 | 11.5 (0.22) | 35.6 (0.98) | 20.0 (0.61) | 6.2 (0.20) | 11.3 (0.36) |
| 2006 3,5 | 12.4 (0.26) | 35.6 (1.25) | 20.3 (0.68) | 6.5 (0.25) | 12.3 (0.48) |
| 2007 6 | 12.3 (0.31) | 37.0 (1.41) | 21.7 (0.85) | 6.5 (0.27) | 13.4 (0.61) |
| 2008 3 | 13.4 (0.33) | 40.4 (1.34) | 23.1 (0.80) | 7.0 (0.28) | 14.1 (0.77) |
| 2009 3 | 14.4 (0.31) | 40.3 (1.21) | 24.5 (0.75) | 7.6 (0.26) | 15.5 (0.69) |
1Poverty status is based on family income and family size, using the U.S. Census Bureau’s poverty thresholds. “Poor” persons are defined as those below the poverty threshold; “near poor” persons have incomes of 100% to less than 200% of the poverty threshold; and “not poor” persons have incomes of 200% of the poverty threshold or greater. The percentage of respondents with unknown poverty status was 19.1% in 1997, 23.6% in 1998, 26.4% in 1999, 27.0% in 2000, 27.1% in 2001, 28.1% in 2002, 31.5% in 2003, 29.6% in 2004, 28.9% in 2005, 30.7% in 2006, 18.0% in 2007, 15.8% in 2008, and 12.3% in 2009. For more information on the unknown income and poverty status categories, see the National Health Interview Survey (NHIS) Survey Description Document for years 1997-2005, available from: /nchs/nhis.htm. Estimates may differ from estimates based on both reported and imputed income. See “Technical Notes ” for a discussion of the use of imputed income in the stratification of health insurance coverage by poverty status.
2The category “public health plan coverage” includes Medicaid, Children’s Health Insurance Program (CHIP), state-sponsored or other government-sponsored health plans, Medicare (disability), and military plans. A small number of persons were covered by both public and private plans and were included in both categories. See Table 6 for persons covered by private plans.
3Beginning in the third quarter of 2004, two additional questions were added to the NHIS insurance section to reduce potential errors in reporting Medicare and Medicaid status. Persons aged 65 years and over not reporting Medicare coverage were asked explicitly about Medicare coverage, and persons under age 65 with no reported coverage were asked explicitly about Medicaid coverage. Estimatesof uninsurance for 2004 were calculated without using the additional information from these questions (noted as Method 1) and with the responses to these questions (noted as Method 2). Respondents who were reclassified as “covered” by the additional questions received the appropriate follow-up questions concerning periods of noncoverage for insured respondents. Beginning in 2005, all estimates were calculated using Method 2. See “Technical Notes” for additional information.
4 In 2004, a much larger than expected proportion of respondents reported a family income of “$2.” Based on extensive review, these “$2” responses were coded to “not ascertained” for the final 2004 NHIS data files. Effective with the March 2006 Early Release report, the 2004 estimates were recalculated to reflect this editing decision. For a complete discussion, see the NHIS Survey Description Document for 2004, available from the NHIS website. The problem with the “$2” income reports was fixed in the 2005 NHIS.
5In 2006, NHIS underwent a sample redesign. The impact of the new sample design on estimates presented in this report is minimal.
6In 2007, the income section of NHIS was redesigned, and estimates by poverty status may not be directly comparable with earlier years. See “Technical Notes ” for further information on the income question changes.
DATA SOURCE: CDC/NCHS, National Health Interview Survey, 1997-2009, Family Core component. Data are based on household interviews of a sample of the civilian noninstitutionalized population.
Table 6
Table 6a. Percentage of persons under age 65 years with private health insurance coverage at the time of interview, by poverty status: United States, 1997- 2009
| Under 65 years | Poverty status1 | ||||
|---|---|---|---|---|---|
| Total | Poor | Near poor | Not poor | Unknown | |
| Percent of persons with private health insurance coverage2 (standard error) | |||||
| 1997 | 70.8 (0.35) | 22.9 (0.93) | 53.5 (0.80) | 87.6 (0.27) | 66.7 (0.71) |
| 1998 | 72.0 (0.36) | 23.1 (1.02) | 53.0 (0.92) | 88.1 (0.29) | 67.1 (0.71) |
| 1999 | 73.1 (0.36) | 26.1 (1.12) | 50.9 (0.86) | 88.9 (0.24) | 68.0 (0.65) |
| 2000 | 71.8 (0.34) | 25.2 (1.00) | 49.1 (0.87) | 87.4 (0.28) | 68.8 (0.63) |
| 2001 | 71.6 (0.37) | 25.5 (1.13) | 48.4 (0.85) | 87.2 (0.27) | 67.8 (0.69) |
| 2002 | 69.8 (0.39) | 26.0 (1.14) | 46.5 (0.89) | 86.0 (0.33) | 63.9 (0.71) |
| 2003 | 68.2 (0.40) | 23.4 (1.21) | 42.3 (0.90) | 85.8 (0.34) | 64.1 (0.68) |
| 2004 3 | 68.6 (0.39) | 20.0 (1.11) | 44.9 (0.85) | 85.0 (0.32) | 66.3 (0.70) |
| 2005 | 68.4 (0.39) | 22.1 (0.89) | 43.2 (0.89) | 84.7 (0.30) | 66.2 (0.68) |
| 2006 4 | 66.5 (0.48) | 20.6 (1.29) | 40.6 (0.91) | 84.1 (0.41) | 65.7 (0.79) |
| 2007 5 | 66.8 (0.53) | 20.1 (1.41) | 37.9 (1.00) | 83.8 (0.40) | 61.7 (1.04) |
| 2008 3 | 65.4 (0.58) | 17.9 (1.21) | 36.3 (1.00) | 82.5 (0.38) | 60.7 (1.16) |
| 2009 3 | 62.9 (0.54) | 14.1 (0.87) | 35.9 (0.93) | 81.6 (0.42) | 57.9 (1.24) |
See footnotes at end of Table 6c.
Table 6b. Percentage of persons under age 18 years with private health insurance coverage at the time of interview, by poverty status: United States, 1997- 2009
| Under 18 years | Poverty status1 | ||||
|---|---|---|---|---|---|
| Total | Poor | Near poor | Not poor | Unknown | |
| Percent of persons with private health insurance coverage2 (standard error) | |||||
| 1997 | 66.2 (0.57) | 17.5 (1.09) | 55.0 (1.15) | 88.9 (0.43) | 61.7 (1.18) |
| 1998 | 68.5 (0.55) | 19.3 (1.17) | 56.3 (1.22) | 89.9 (0.48) | 62.1 (1.13) |
| 1999 | 69.1 (0.55) | 20.2 (1.16) | 52.1 (1.23) | 90.6 (0.39) | 63.8 (1.02) |
| 2000 | 67.1 (0.53) | 19.5 (1.21) | 48.8 (1.23) | 88.4 (0.47) | 64.2 (0.99) |
| 2001 | 66.7 (0.57) | 18.1 (1.12) | 48.4 (1.23) | 88.4 (0.40) | 62.2 (1.16) |
| 2002 | 63.9 (0.61) | 17.2 (1.08) | 44.9 (1.29) | 86.9 (0.54) | 56.3 (1.19) |
| 2003 | 62.6 (0.60) | 14.4 (1.06) | 39.9 (1.28) | 86.5 (0.56) | 58.8 (1.07) |
| 2004 3 | 63.1 (0.59) | 12.6 (0.97) | 43.0 (1.29) | 86.4 (0.52) | 60.0 (1.11) |
| 2005 | 62.4 (0.60) | 15.0 (1.10) | 40.0 (1.31) | 85.6 (0.52) | 59.3 (1.16) |
| 2006 4 | 59.7 (0.72) | 13.1 (1.10) | 36.9 (1.37) | 85.9 (0.63) | 57.8 (1.28) |
| 2007 5 | 59.9 (0.82) | 11.9 (1.08) | 34.0 (1.46) | 85.1 (0.63) | 54.8 (1.82) |
| 2008 3 | 58.3 (0.84) | 10.4 (0.95) | 32.9 (1.46) | 83.1 (0.67) | 54.8 (1.78) |
| 2009 3 | 55.7 (0.86) | 8.2 (0.81) | 32.8 (1.43) | 82.4 (0.73) | 55.3 (2.07) |
See footnotes at end of Table 6c.
Table 6c. Percentage of persons aged 18-64 years with private health insurance coverage at the time of interview, by poverty status: United States, 1997- 2009
| 18-64 years | Poverty status1 | ||||
|---|---|---|---|---|---|
| Total | Poor | Near poor | Not poor | Unknown | |
| Percent of persons with private health insurance coverage2 (standard error) | |||||
| 1997 | 72.8 (0.30) | 26.8 (1.09) | 52.6 (0.76) | 87.1 (0.26) | 68.6 (0.65) |
| 1998 | 73.5 (0.32) | 25.8 (1.17) | 50.9 (0.90) | 87.4 (0.27) | 69.1 (0.66) |
| 1999 | 74.7 (0.33) | 30.4 (1.39) | 50.2 (0.85) | 88.2 (0.24) | 69.7 (0.60) |
| 2000 | 73.8 (0.32) | 29.2 (1.16) | 49.3 (0.83) | 87.1 (0.27) | 70.6 (0.61) |
| 2001 | 73.7 (0.33) | 31.7 (1.41) | 48.4 (0.82) | 86.8 (0.28) | 69.9 (0.61) |
| 2002 | 72.3 (0.35) | 31.8 (1.50) | 47.5 (0.85) | 85.7 (0.30) | 66.9 (0.62) |
| 2003 | 70.6 (0.36) | 29.0 (1.60) | 43.7 (0.88) | 85.5 (0.33) | 66.0 (0.62) |
| 2004 3 | 70.9 (0.36) | 24.9 (1.39) | 46.0 (0.79) | 84.6 (0.31) | 68.6 (0.65) |
| 2005 | 70.9 (0.36) | 26.8 (1.03) | 45.0 (0.85) | 84.4 (0.29) | 68.7 (0.61) |
| 2006 4 | 69.2 (0.43) | 25.5 (1.72) | 42.6 (0.92) | 83.6 (0.40) | 68.6 (0.71) |
| 2007 5 | 69.6 (0.47) | 25.4 (1.92) | 40.4 (1.01) | 83.4 (0.38) | 64.0 (0.92) |
| 2008 3 | 68.1 (0.54) | 22.7 (1.65) | 38.3 (1.01) | 82.4 (0.37) | 62.7 (1.13) |
| 2009 3 | 65.8 (0.47) | 18.0 (1.15) | 37.7 (0.84) | 81.4 (0.38) | 58.8 (1.13) |
1Poverty status is based on family income and family size, using the U.S. Census Bureau’s poverty thresholds. “Poor” persons are defined as those below the poverty threshold; “near poor” persons have incomes of 100% to less than 200% of the poverty threshold; and “not poor” persons have incomes of 200% of the poverty threshold or greater. The percentage of respondents with unknown poverty status was 19.1% in 1997, 23.6% in 1998, 26.4% in 1999, 27.0% in 2000, 27.1% in 2001, 28.1% in 2002, 31.5% in 2003, 29.6% in 2004, 28.9% in 2005, 30.7% in 2006, 18.0% in 2007, 15.8% in 2008, and 12.3% in 2009. For more information on the unknown income and poverty status categories, see the National Health Interview Survey (NHIS) Survey Description Document for years 1997-2005, available from: /nchs/nhis.htm. Estimates may differ from estimates based on both reported and imputed income. See “Technical Notes ” for a discussion of the use of imputed income in the stratification of health insurance coverage by poverty status.
2The category “private health insurance” excludes plans that paid for only one type of service, such as accidents or dental care. A small number of persons were covered by both public and private plans and thus were included in both categories. See Table 5 for persons covered by public plans.
3In 2004, a much larger than expected proportion of respondents reported a family income of “$2.” Based on extensive review, these “$2” responses were coded to “not ascertained” for the final 2004 NHIS data files. Effective with the March 2006 Early Release report the 2004 estimates were recalculated to reflect this editing decision. For a complete discussion, see the NHIS Survey Description Document for 2004, available from the NHIS website. The problem with the “$2” income reports was fixed in the 2005 NHIS.
4In 2006, NHIS underwent a sample redesign. The impact of the new sample design on estimates presented in this report is minimal.
5In 2007, the income section of NHIS was redesigned, and estimates by poverty status may not be directly comparable with earlier years. See “Technical Notes ” for further information on the income question changes.
DATA SOURCE: CDC/NCHS, National Health Interview Survey, 1997-2009, Family Core component. Data are based on household interviews of a sample of the civilian noninstitutionalized population.
Table 7
Table 7a. Percentage of persons who lacked health insurance coverage at the time of interview, for at least part of the past year, or for more than a year, by age: United States, 2009
| Age | Uninsured1 at the time of interview | Uninsured1 for at least part of the past year2 | Uninsured1 for more than a year2 |
|---|---|---|---|
| Percent (standard error) | |||
| All ages | 15.4 (0.30) | 19.4 (0.32) | 10.9 (0.26) |
| Under 65 years | 17.5 (0.34) | 22.0 (0.36) | 12.4 (0.29) |
| Under 18 years | 8.2 (0.40) | 12.8 (0.47) | 4.8 (0.31) |
| 18-64 years | 21.1 (0.37) | 25.6 (0.38) | 15.4 (0.34) |
| 65 years and over | 1.0 (0.13) | 1.7 (0.16) | 0.7 (0.11) |
See footnotes at end of Table 7g.
Table 7b. Percentage of persons who lacked health insurance coverage at the time of interview, for at least part of the past year, or for more than a year, by sex: United States, 2009
| Sex | Uninsured1 at the time of interview | Uninsured1 for at least part of the past year2 | Uninsured1 for more than a year2 |
|---|---|---|---|
| Percent (standard error) | |||
| Male | 17.3 (0.36) | 21.0 (0.38) | 12.6 (0.31) |
| Female | 13.6 (0.30) | 17.9 (0.33) | 9.3 (0.25) |
See footnotes at end of Table 7g.
Table 7c. Percentage of persons who lacked health insurance coverage at the time of interview, for at least part of the past year, or for more than a year, by race/ethnicity: United States, 2009
| Race/ethnicity | Uninsured1 at the time of interview | Uninsured1 for at least part of the past year2 | Uninsured1 for more than a year2 |
|---|---|---|---|
| Percent (standard error) | |||
| Hispanic or Latino | 31.2 (0.82) | 35.3 (0.81) | 24.9 (0.80) |
| Non-Hispanic White, single race |
11.1 (0.29) | 15.1 (0.34) | 7.4 (0.22) |
| Non-Hispanic Black, single race |
17.3 (0.55) | 22.2 (0.64) | 11.4 (0.47) |
| Non-Hispanic Asian, single race |
14.3 (0.94) | 17.1 (1.07) | 10.8 (0.81) |
| Non-Hispanic Other races and multiple races |
18.6 (1.41) | 23.3 (1.54) | 10.6 (1.14) |
See footnotes at end of Table 7g.
Table 7d. Percentage of persons who lacked health insurance coverage at the time of interview, for at least part of the past year, or for more than a year, by region: United States, 2009
| Region | Uninsured1 at the time of interview | Uninsured1 for at least part of the past year2 | Uninsured1 for more than a year2 |
|---|---|---|---|
| Percent (standard error) | |||
| Northeast | 10.0 (0.52) | 13.5 (0.54) | 7.2 (0.40) |
| Midwest | 12.7 (0.52) | 16.6 (0.60) | 8.1 (0.39) |
| South | 18.6 (0.60) | 22.8 (0.60) | 13.5 (0.54) |
| West | 17.1 (0.58) | 21.5 (0.70) | 12.4 (0.47) |
See footnotes at end of Table 7g.
Table 7e. Percentage of persons who lacked health insurance coverage at the time of interview, for at least part of the past year, or for more than a year, by education: United States, 2009
| Education3 | Uninsured1 at the time of interview | Uninsured1 for at least part of the past year2 | Uninsured1 for more than a year2 |
|---|---|---|---|
| Percent (standard error) | |||
| Less than high school | 32.9 (0.77) | 36.4 (0.79) | 27.4 (0.79) |
| High school diploma or GED4 | 21.2 (0.48) | 25.1 (0.52) | 15.6 (0.44) |
| More than high school | 11.8 (0.26) | 15.8 (0.30) | 7.7 (0.21) |
See footnotes at end of Table 7g.
Table 7f. Percentage of persons who lacked health insurance coverage at the time of interview, for at least part of the past year, or for more than a year, by employment status: United States, 2009
| Employment status5 | Uninsured1 at the time of interview | Uninsured1 for at least part of the past year2 | Uninsured1 for more than a year2 |
|---|---|---|---|
| Percent (standard error) | |||
| Employed | 18.0 (0.37) | 22.1 (0.39) | 13.8 (0.33) |
| Unemployed | 52.6 (1.04) | 59.7 (1.05) | 33.3 (1.10) |
| Not in workforce | 20.6 (0.56) | 25.3 (0.60) | 14.6 (0.45) |
See footnotes at end of Table 7g.
Table 7g. Percentage of persons who lacked health insurance coverage at the time of interview, for at least part of the past year, or for more than a year, by marital status: United States, 2009
| Marital status3 | Uninsured1 at the time of interview | Uninsured1 for at least part of the past year2 | Uninsured1 for more than a year2 |
|---|---|---|---|
| Percent (standard error) | |||
| Married | 12.6 (0.35) | 15.6 (0.39) | 9.5 (0.31) |
| Widowed | 5.2 (0.46) | 6.4 (0.49) | 4.2 (0.41) |
| Divorced or separated | 21.1 (0.56) | 26.1 (0.60) | 15.8 (0.49) |
| Living with partner | 32.4 (1.03) | 39.2 (1.06) | 22.9 (0.91) |
| Never married | 28.0 (0.56) | 33.4 (0.59) | 19.6 (0.52) |
1A person was defined as uninsured if he or she did not have any private health insurance, Medicare, Medicaid, Children’s Health Insurance Program (CHIP), state-sponsored or other government-sponsored health plan, or military plan. A person was also defined as uninsured if he or she had only Indian Health Service coverage or had only a private plan that paid for one type of service, such as accidents or dental care.
2A year is defined as the 12 months prior to interview.
3Education and marital status are shown only for persons aged 18 years and over.
4GED is General Educational Development high school equivalency diploma.
5Employment status is shown only for persons aged 18-64 years.
DATA SOURCE: CDC/NCHS, National Health Interview Survey, 2009, Family Core component. Data are based on household interviews of a sample of the civilian noninstitutionalized population.
Table 8
Table 8a. Percentage of persons of all ages in selected states who lacked health insurance coverage at the time of interview or with public or private coverage at the time of interview: United States, 2009
| All ages | Uninsured1 at the time of interview | Public2 coverage | Private3 coverage |
|---|---|---|---|
| Percent (standard error) | |||
| All states4 | 15.4 (0.25) | 30.4 (0.37) | 61.9 (0.45) |
| Arizona | 16.4 (1.57) | 33.1 (2.25) | 54.4 (2.77) |
| California | 18.2 (0.74) | 30.3 (0.98) | 56.1 (1.24) |
| Florida | 19.3 (1.03) | 34.5 (1.43) | 53.7 (1.49) |
| Georgia | 18.7 (1.41) | 30.6 (1.89) | 57.1 (2.36) |
| Illinois | 12.6 (1.23) | 31.3 (1.80) | 64.8 (2.55) |
| Indiana | 17.8 (1.71) | 28.4 (2.27) | 62.0 (2.85) |
| Maryland | 13.2 (1.59) | 25.8 (2.32) | 71.1 (2.79) |
| Massachusetts | 3.7 (0.82) | 30.4 (2.26) | 74.1 (2.50) |
| Michigan | 12.7 (1.17) | 33.5 (2.11) | 65.0 (2.14) |
| Missouri | 15.1 (1.56) | 28.3 (2.21) | 64.0 (2.74) |
| New Jersey | 12.3 (1.24) | 23.9 (1.85) | 71.2 (2.33) |
| New York | 10.2 (0.76) | 32.5 (1.50) | 63.9 (1.60) |
| North Carolina | 16.4 (1.46) | 33.5 (2.34) | 58.5 (1.60) |
| Ohio | 11.4 (1.06) | 31.9 (1.51) | 67.0 (2.05) |
| Pennsylvania | 10.9 (1.36) | 30.7 (1.83) | 68.5 (2.18) |
| Tennessee | 14.5 (1.56) | 33.2 (2.37) | 58.0 (2.89) |
| Texas | 24.6 (1.07) | 28.6 (1.54) | 51.4 (1.76) |
| Virginia | 14.8 (1.37) | 30.2 (2.00) | 63.8 (2.44) |
| Washington | 12.2 (1.36) | 29.4 (2.14) | 65.4 (2.60) |
| Wisconsin | 9.6 (1.39) | 28.3 (2.39) | 74.6 (2.69) |
See footnotes at end of table 8d.
Table 8b. Percentage of persons under age 65 years in selected states who lacked health insurance coverage at the time of interview or with public or private coverage at the time of interview: United States, 2009
| Under 65 years | Uninsured1 at the time of interview | Public2 coverage | Private3 coverage |
|---|---|---|---|
| Percent (standard error) | |||
| All states4 | 17.5 (0.28) | 21.0 (0.37) | 62.9 (0.49) |
| Arizona | 18.3 (1.78) | 25.5 (2.38) | 57.2 (2.91) |
| California | 20.4 (0.84) | 22.1 (0.97) | 58.4 (1.39) |
| Florida | 23.2 (1.13) | 21.1 (1.63) | 57.0 (1.77) |
| Georgia | 21.1 (1.61) | 21.9 (1.94) | 58.4 (2.49) |
| Illinois | 14.2 (1.37) | 22.6 (1.86) | 65.1 (2.88) |
| Indiana | 19.7 (1.94) | 20.5 (2.33) | 62.0 (3.02) |
| Maryland | 15.3 (1.84) | 14.5 (2.13) | 71.7 (2.94) |
| Massachusetts | 4.1 (0.94) | 21.2 (2.30) | 75.2 (2.62) |
| Michigan | 14.6 (1.32) | 23.4 (2.12) | 64.1 (2.45) |
| Missouri | 16.8 (1.78) | 19.6 (2.23) | 65.4 (2.89) |
| New Jersey | 13.8 (1.41) | 14.9 (1.66) | 72.4 (2.43) |
| New York | 11.5 (0.83) | 23.1 (1.48) | 66.2 (1.74) |
| North Carolina | 19.1 (1.66) | 22.7 (2.07) | 59.2 (1.72) |
| Ohio | 13.3 (1.21) | 20.6 (1.62) | 67.7 (2.09) |
| Pennsylvania | 12.4 (1.41) | 20.4 (1.64) | 68.9 (2.33) |
| Tennessee | 16.3 (1.79) | 24.8 (2.49) | 59.7 (3.05) |
| Texas | 27.0 (1.16) | 21.7 (1.60) | 52.2 (1.86) |
| Virginia | 16.6 (1.58) | 21.0 (2.05) | 63.4 (2.61) |
| Washington | 13.5 (1.54) | 21.8 (2.21) | 66.6 (2.72) |
| Wisconsin | 11.4 (1.67) | 15.8 (2.26) | 74.8 (2.91) |
See footnotes at end of table 8d.
Table 8c. Percentage of persons aged 18-64 years in selected states who lacked health insurance coverage at the time of interview or with public or private coverage at the time of interview: United States, 2009
| 18-64 years | Uninsured1 at the time of interview | Public2 coverage | Private3 coverage |
|---|---|---|---|
| Percent (standard error) | |||
| All states4 | 21.1 (0.32) | 14.4 (0.28) | 65.8 (0.43) |
| Arizona | 22.2 (1.90) | 18.9 (2.07) | 59.9 (2.72) |
| California | 25.2 (0.97) | 14.5 (0.78) | 61.2 (1.22) |
| Florida | 26.8 (1.18) | 14.0 (1.46) | 60.7 (1.69) |
| Georgia | 25.2 (1.71) | 14.4 (1.55) | 62.2 (2.24) |
| Illinois | 18.8 (1.83) | 14.9 (1.22) | 67.7 (2.66) |
| Indiana | 22.1 (2.00) | 12.5 (1.80) | 66.5 (2.68) |
| Maryland | 18.6 (2.12) | 8.8 (1.60) | 73.8 (2.59) |
| Massachusetts | *5.2 (1.96) | 18.8 (2.04) | 76.5 (2.32) |
| Michigan | 18.3 (1.40) | 17.6 (1.67) | 65.8 (2.19) |
| Missouri | 20.8 (1.84) | 13.8 (1.84) | 67.0 (2.62) |
| New Jersey | 17.6 (1.77) | 11.3 (1.37) | 72.6 (2.28) |
| New York | 14.3 (0.98) | 18.7 (1.24) | 68.1 (1.62) |
| North Carolina | 24.2 (1.82) | 14.8 (1.61) | 62.2 (1.71) |
| Ohio | 16.4 (1.51) | 14.5 (1.28) | 70.1 (2.12) |
| Pennsylvania | 14.2 (1.25) | 15.4 (1.52) | 71.7 (1.99) |
| Tennessee | 19.5 (1.08) | 19.0 (2.11) | 62.6 (2.73) |
| Texas | 31.6 (1.22) | 13.0 (1.04) | 56.4 (1.57) |
| Virginia | 19.6 (1.84) | 15.7 (1.70) | 66.1 (2.32) |
| Washington | 17.7 (1.85) | 12.9 (1.72) | 70.7 (2.45) |
| Wisconsin | 13.3 (2.08) | 10.6 (1.82) | 77.5 (2.58) |
See footnotes at end of table 8d.
Table 8d. Percentage of persons under age 18 years in selected states who lacked health insurance coverage at the time of interview or with public or private coverage at the time of interview: United States, 2009
| Under 18 years | Uninsured1 at the time of interview | Public2 coverage | Private3 coverage |
|---|---|---|---|
| Percent (standard error) | |||
| All states4 | 8.2 (0.36) | 37.7 (0.72) | 55.7 (0.77) |
| Arizona | 9.3 (2.12) | 41.0 (4.04) | 51.0 (4.26) |
| California | 8.9 (1.00) | 40.4 (1.69) | 51.6 (2.09) |
| Florida | 13.1 (1.59) | 41.6 (2.68) | 46.4 (2.54) |
| Georgia | 9.9 (2.02) | 41.9 (3.75) | 48.3 (3.94) |
| Illinois | *2.5 (0.88) | 42.5 (3.95) | 58.3 (4.14) |
| Indiana | 14.0 (2.88) | 40.1 (4.57) | 51.0 (4.83) |
| Maryland | *6.1 (2.14) | 30.3 (4.63) | 65.9 (4.95) |
| Massachusetts | † | 28.2 (4.20) | 71.5 (4.36) |
| Michigan | *5.2 (1.67) | 38.2 (4.06) | 59.8 (4.11) |
| Missouri | 7.7 (2.12) | 32.9 (4.20) | 61.7 (4.51) |
| New Jersey | 3.8 (0.95) | 24.6 (3.18) | 71.8 (3.45) |
| New York | 3.8 (0.83) | 35.5 (2.81) | 61.2 (2.87) |
| North Carolina | 6.4 (1.56) | 42.5 (3.80) | 51.6 (2.86) |
| Ohio | 5.5 (1.34) | 35.7 (2.93) | 61.7 (3.19) |
| Pennsylvania | *7.8 (2.64) | 33.1 (2.99) | 61.6 (3.81) |
| Tennessee | 7.4 (2.20) | 40.8 (4.64) | 51.8 (4.89) |
| Texas | 16.9 (1.68) | 41.1 (2.82) | 42.6 (2.78) |
| Virginia | 8.2 (2.03) | 36.3 (4.00) | 55.7 (4.29) |
| Washington | *3.6 (1.37) | 43.0 (4.10) | 56.8 (4.25) |
| Wisconsin | *6.8 (2.18) | 28.5 (4.39) | 68.2 (4.70) |
* Estimates preceded by an asterisk have a relative standard error greater than 30% and less than or equal to 50% and should be used with caution as they do not meet the standards of reliability or precision.
† Estimates with a relative standard error greater than 50% are indicated with a dagger but are not shown.
1A person was defined as uninsured if he or she did not have any private health insurance, Medicare, Medicaid, Children’s Health Insurance Program (CHIP), state-sponsored or other government-sponsored health plan, or military plan. A person was also defined as uninsured if he or she had only Indian Health Service coverage or had only a private plan that paid for one type of service, such as accidents or dental care.
2The category “public health plan coverage” includes Medicaid, Children’s Health Insurance Program (CHIP), state-sponsored or other government-sponsored health plan, Medicare (disability), and military plan. A small number of persons were covered by both public and private plans and were included in both categories.
3The category “private health insurance” excludes plans that paid for only one type of service, such as accidents or dental care. A small number of persons were covered by both public and private plans and, thus were included in both categories.
4Includes all 50 states and the District of Columbia.
DATA SOURCE: CDC/NCHS, National Health Interview Survey, 2009, Family Core component. Data are based on household interviews of a sample of the civilian noninstitutionalized population.