Success Stories - Identifying Communities at Risk
California – Preventing Exposures to Nitrates in Drinking Water
What is the problem?
Nitrate-contaminated drinking water can lead to serious illness in infants. Also, exposure to nitrates has been associated with certain cancers and adverse reproductive outcomes, including various birth defects. In California, some communities are at higher risk for having nitrate contamination in their drinking water. Because there was no statewide digital map of the areas served by drinking water systems, identifying communities at higher risk for nitrate exposure has been difficult. Moreover, the state had no central location for gathering this information.

What did Tracking do?
The California Tracking Program created a Web-based tool to help water systems create digital maps of the areas they serve. Prior to this effort, many systems only had paper maps. The tracking program’s water tool has received information for public water systems that serve almost 90% of the state’s total population. With this information, users can also identify communities that may be using unregulated private wells, which are also at high risk for nitrate contamination.
Improved public health
The University of California at Davis, on behalf of the state Water Resources Control Board, used data from the water tool and other sources in a report to the state legislature. The report identified communities most exposed to nitrate contamination in drinking water and proposed potential remediation solutions. Findings and recommendations in the report have led to prevention, monitoring, training, and funding activities in high risk areas.
California – Identifying Exposures to Air Pollution from Traffic

What is the problem?
Air pollution from traffic is associated with a variety of health problems. Researchers and public health workers use data on traffic to estimate air pollution and to look at the relationship between traffic pollution and health. However, traffic data can be difficult to access and use.
What did Tracking do?
The California Tracking Program developed a traffic tool to make it easier to access and use CalTrans traffic data for public health activities. People can use the tool to calculate a range of traffic features, such as the average number of vehicles traveling near a location per day. Users of the tool can find out how much traffic passes through any geography, such as a zip code, neighborhood, or another custom area around a specific address. Researchers can compare data from the traffic tool with health data from the CA Tracking Network or other sources to understand better the possible links between air pollution and health.
Improved public health
Several agencies have used the traffic tool to protect and improve public health. For example, the Bay Area Air Quality Management District uses the traffic tool to determine if a proposed project will increase risks of exposure to traffic pollutants. And the CA Environmental Protection Agency used the traffic tool to identify locations more likely to be exposed to pollution from traffic. The agency added this information to its screening tool which identifies communities likely to be affected most by environmental exposures and poor health.
California – Identifying the increases in preterm birth rates in Fresno County
What is the problem?
Research shows that preterm birth is associated with the mother’s exposure to traffic pollutants and lead. A routine review of data on the California Tracking Network revealed a pattern in the risk of preterm birth in Fresno County, one of the major population centers in the state’s Central Valley area.
What did Tracking do?
California’s Environmental Health Tracking Program informed the Fresno Department of Public Health of the trends. The local health department asked the Tracking Network for more data about:
- Preterm birth trends reported by race and ethnicity.
- Maternal Infant Health (MIH) indicators, including very preterm birth (less than 32 weeks gestation).
- Rates by census tracts.
Improved public health
Fresno County used the information to identify locations for targeting activities that are related to childhood lead poisoning, air quality, and asthma. Fresno County officials reported that the data and assistance from the tracking network were very helpful to the local childhood lead poisoning prevention program.
California – Improving community access to useful information
What is the problem?
Variations in health status most frequently occur at the community level, but health information often is available only at the county level. The challenge is how to use existing data to increase the public’s knowledge about how the environment affects their community’s health, without compromising individual privacy. The affected communities should be able to gain access to this information.
What did Tracking do?
The California Tracking Network used special analytic and mapping techniques to locate areas in Alameda County with:
- high rates of preterm birth.
- high rates of full term births with low birth weight.
- a range of asthma indicators.
The staff explored possible relationships between these outcomes and environmental hazards. The project demonstrated how the California Tracking Network can identify elevated rates of community health outcomes while maintaining individual confidentiality. The California Tracking Network also identified disparities in rates by race and ethnicity, income, and geography.
Improved public health
The California Tracking Program partnered with the Urban Strategies Council and several other organizations in a community collaborative called InfoAlameda-County. The collaboration aimed to make these data available publicly and to provide technical assistance to promote equity and empowerment for low-income neighborhoods and communities of color in Alameda County. The information generated by the Tracking Network was incorporated into the InfoAlamedaCounty.org interactive mapping Web site so that community residents will continue to have access to the data even after the project ends.
Florida – Consuming fish safely: Mercury biomonitoring project
What is the problem?
Mercury is a toxin that occurs in the environment naturally and as a result of industrial pollution. Methylmercury is a form of mercury found in some fish and shellfish. It poses a risk to people who consume certain types of fish and shellfish. The greatest risk is to women of childbearing age and to children, who should not eat certain types of fish. Mercury can damage the nervous system of young children and developing fetuses.
Human exposure to mercury through fish consumption is a growing concern in the United States. Areas with high mercury emissions from coal-fired power plants and that have populations who frequently consume fish are of most concern. To help people eat the proper amount and species, they need accurate information about how much and what types of fish to consume.
What did Tracking do?
Researchers evaluated fish eating patterns among women of child-bearing age in Duval and Martin Counties, their research also included mercury biomonitoring. Participants completed a survey about their fish eating habits, knowledge of fish consumption advisories, pregnancy status, demographic and socio-economic information, and mercury exposure history. And each participant provided a scalp hair sample for mercury analysis.
Results showed that women of child-bearing age in Duval and Martin Counties consume more fish than their counterparts in other areas of the United States and that their hair-mercury levels are higher than the participants of the study who do not consume fish. Because of the low local awareness of fish advisories, increased education is needed about the advisories and about mercury exposure among at-risk populations in Duval and Martin Counties.
Improved public health
The Florida Tracking Program created the Fish for Your Health Wallet Card. It contains information about what types and amounts of fish to eat. It encourages women to enjoy the health benefits of certain kinds of fish but also avoid unsafe amounts of mercury. The card lists:
- Species of fish by different categories of mercury content, and
- Suggested amounts of fish to eat each week.
The Florida Tracking Program distributes the wallet cards to county health departments, state fish markets and grocery stores, and to the Florida Medical Association (FMA). The FMA sends the wallet cards to local branches and to physicians’ offices.
Iowa – Pesticides in Private Water Wells
What is the problem?
Contact with pesticides may be related to a variety of acute and chronic health problems. Private water wells have the potential to be contaminated with pesticides, especially in farming areas. About 15% of Iowans use private wells for drinking water. Little is known about the extent of human pesticide exposure from private well water.
What did Tracking do?
To improve the state’s ability to measure pesticide exposure, the Iowa Tracking Program will work with the State Hygienic Laboratory and the Iowa Department of Agriculture and Land Stewardship to map off-label pesticide use, pesticide sales, pesticide application statistics, and private well contamination data.
Improved public health
Being able to identify areas with high pesticide use will help Iowa monitor those areas for health problems that are related to using pesticides. This may also help the Iowa Department of Public Health determine if education and intervention programs are needed or if new regulations or guidelines are needed for monitoring drinking wells.
Maine – Educating Residents about a New Risk for Carbon Monoxide Poisoning

What is the problem?
In May 2012, three adults died from carbon monoxide (CO) poisoning after their off-roading vehicle became stuck in a mudbog in central Maine. While CO poisoning has long been a public health concern in Maine, off-roading was not among the list of potentially risky activities included in the state health department’s public education efforts about preventing CO poisoning.
What did Tracking do?
Immediately responding to the deaths, Maine Tracking Program staff used data from their case-based CO poisoning surveillance system to identify a similar event that occurred in 2010. Using information about the two events, the tracking program identified off-roading as a more significant risk for CO poisoning than previously thought. Within a day of the 2012 deaths, tracking staff began educating reporters about CO poisoning, providing them guidance about preventing CO poisoning while off-roading to include in the ongoing news coverage of the deaths.
Improved public health
A few weeks following the deaths, the tracking program issued its annual advisory about preventing CO poisoning during summertime activities. This advisory included specific CO poisoning prevention advice about off-roading. These recommendations are now part of Maine’s standard health advisory issued each spring.
Maine – Preventing childhood lead poisoning
What is the problem?
The number of newly identified cases of childhood lead poisoning in Maine has decreased steadily over the last five years. But lead poisoning continues to threaten children’s health and development. To continue reducing the number of cases of lead poisoning, the Maine Childhood Lead Poisoning Prevention Program needed to understand more about the state’s at risk children.
What did Tracking do?
The Maine Tracking Program used geo-coding and mapping to analyze childhood lead poisoning data. This fresh look at an old problem shed light on some previously unknown critical risk factors. For example, the new analysis revealed that 40% of all childhood lead poisonings occur in just five urban areas. Further probing showed that within those five urban areas, more than 80% of lead-poisoned children lived in rental housing. Data from the U.S. Census Bureau then allowed the tracking program to look by census blocks at the percentage of houses built before 1950. This revealed streets and whole neighborhoods where children were most at risk.
Improved public health
The Maine Tracking Program gave the Childhood Lead Poisoning Prevention Program an advanced understanding of lead poisoning distribution throughout the state. Childhood Lead Poisoning Prevention could now shift resources where they were most needed. Community groups in the five urban areas where 40% of childhood lead poisonings occur could now receive contracts from the Maine CDC for targeted prevention activities in their communities. The contracts help to educate local landlords and tenants about the dangers of lead paint dust and help landlords test their units for lead dust. After just one year of targeted outreach, about 240 rental units were tested for lead dust. Landlords whose units tested high for lead dust were given support or were enrolled in the Lead Hazard Control Program. The Maine Tracking Program has been critical in helping prevent lead poisoning in Maine children.
Maine – Tracking the effect of outdoor air quality on health
What is the problem?
Asthma is one of the most common and costly illnesses in the United States. Maine has one of the highest rates of asthma in the country. About 130,000 Mainers–including 28,000 children–have asthma. Put another way, about one in 10 children and adults in Maine have asthma. Maine often has elevated levels of ozone and particulate matter. People are understandably concerned about the effects of ozone on asthma. Ozone is a main ingredient in smog. At ground level, ozone can be a health risk. Studies have shown that as ozone levels increase, asthma-related hospital stays and emergency department visits tend also to increase.
What did Tracking do?
Maine’s Tracking Program linked outdoor ozone data with asthma-related emergency department data. Now scientists can estimate ozone-related asthma cases both in a community and statewide. Further studies show asthma cases associated with ozone levels by age, sex, and geography.
Improved public health
The tracking program has analyzed the association between asthma and outdoor air quality. The health department has used this information to identify Mainers at high risk. Asthma has no cure, but it can be controlled. Learning about this association has helped the Maine Tracking Program provide information to health care professionals. They can now target people who are at risk and can share prevention tips.
Minnesota – Preparing for Extreme Heat Events

What is the problem?
Extreme heat events, or heat waves, are the most common cause of weather-related deaths in the United States. In Minnesota each year, heat-related illnesses lead to hundreds of emergency department visits and hospital stays. Planning successful prevention and response activities for extreme heat events can be difficult for public health agencies when they do not have a clear picture of who is most at risk.
What did Tracking do?
The Minnesota Tracking Program analyzed data on heat-related illnesses and deaths to inform health professionals about groups most at risk during extreme heat events. They found surprising new information, including:
- 15- to 34-year-olds are an at-risk age group, in addition to people aged 65-years and older.
- Rates of hospital stays and emergency department visits were higher in greater Minnesota compared to the 7-county metropolitan area that includes the Twin Cities.
State and local health professionals used the tracking data to develop and update maps showing areas with at-risk populations. The maps show which areas need support to prepare for heat waves.
Improved public health
Health agencies across Minnesota now have a clearer understanding of the people most at risk for illness or death from extreme heat. Each summer, they use the data to focus outreach and planning efforts. Then they use the data to evaluate the effectiveness of their prevention and response efforts and to monitor trends of heat-related illness over time.
Minnesota – Preventing Melanoma

What is the problem?
Melanoma is the most dangerous form of skin cancer. It is one of the most rapidly increasing cancers among Minnesotans. CDC estimates that exposure to ultraviolet (UV) light causes 65-90% of all melanoma. UV light comes from the sun but can also come from tanning beds. Despite the risks for melanoma, tanning bed use remains common in Minnesota.
What did Tracking do?
The Minnesota Tracking Program published interactive maps and charts on their state tracking network showing trends and geographic patterns of melanoma across the state. They also collaborated with the state cancer registry to add county-level melanoma data to MN County Health Tables, a resource used by state and county public health officials to guide program planning and evaluation.
Improved public health
Since making melanoma data easy to find and use, tracking program staff have worked with state programs and other partners, such as the American Cancer Society of MN and the MN Cancer Alliance, to use tracking data to support program and policy initiatives to prevent melanoma. For example, these partners identified reducing the use of artificial UV light for tanning as a key objective in Cancer Plan Minnesota: 2011-2016pdf iconexternal icon, a framework for preventing and controlling different types of cancer. In addition, tracking data will be used to evaluate the effectiveness of melanoma prevention program and policy initiatives over time.
Minnesota – Evaluating Indoor Smoking Ban Legislation to Protect Residents from Secondhand Smoke

What is the problem?
Secondhand smoke, also known as environmental tobacco smoke, causes cancer and other health problems in both children and adults. To help reduce exposure to secondhand smoke, Minnesota passed Freedom to Breathe legislation in 2007. The legislation banned smoking in almost all indoor public places and indoor work sites, including bars and restaurants. In 2011, some legislators worked to repeal the legislation.
What did Tracking do?
The Minnesota Tracking Program maintains data on secondhand smoke among nonsmokers for the state. Tracking staff analyzed state data to determine if Freedom to Breathe legislation helped reduce residents’ exposures to secondhand smoke. Tracking staff found that since 2007, exposures to secondhand smoke decreased among non-smokers. In addition, children’s exposures decreased by 20% and adults’ exposures decreased by 25%.
Improved public health
Freedom to Breathe legislation remains in place because the tracking program demonstrated that the legislation was associated with a decrease in exposures to secondhand smoke and because there is strong support to keep the smoking bans in Minnesota. In addition, tobacco prevention programs and others have been able to use the tracking data to plan more effective smoking cessation and awareness activities.
New York – Tracking carbon monoxide risk factors to prevent poisonings
What is the problem?
Many New Yorkers use portable generators when the power goes out. Generator use increases the risk of carbon monoxide (CO) poisoning. Little information is available about how many households use portable generators during power outages. Also, the number of households that have properly installed and maintained CO alarms is unknown.
What did Tracking do?
To learn more about portable generator and CO alarm use, New York State’s Tracking Program added questions to the 2008 New York State Behavioral Risk Factor Surveillance System survey. The Tracking Program collected and analyzed survey results that showed nearly 20% of state residents and more than 33% of residents living outside major cities had a portable generator. Almost 30% of all residents did not have a CO alarm in their homes.
Improved public health
The state department of health used the tracking program information to identify areas most at risk for CO poisoning. The state worked with local health departments and other partners to distribute generator safety posters and CO poisoning-prevention door hangers to area residents. The survey data will track the success of the generator campaign. The data will also show whether people follow the 2009 state law mandating CO alarms in all homes.
New York City – Informing health care providers about asthma
What is the problem?
Each fall NYC sees a large increase in hospital stays and in emergency department visits for asthma, especially among children. Illness rates in the fall can be three times higher than rates during the summer. Possible reasons include infections among children returning to school, seasonal pollen, and cooler weather.
What did Tracking do?
The NYC Tracking Program analyzed childhood asthma data. It used the results to write messages for health care providers. The messages—sent through the city’s Health Alert Network—urged providers to update patients’ asthma management plans in time for school year start.
Improved public health
In the last few years, the seasonal fall mailing to health care providers and other asthma prevention activities have coincided with a decrease in rates of NYC hospital stays among children.
Because of the program’s success, advisories to health care providers have become a standard practice at the beginning of each school year in NYC.
Oregon – Increasing Awareness of and Testing for Radon

What is the problem?
Radon is the second leading cause of lung cancer and is the leading environmental cause of cancer deaths in the United States. Radon is a colorless, odorless, tasteless radioactive gas. Testing is the only way to know if radon levels are high in a building or home. In 1993, the U.S. Environmental Protection Agency identified Oregon as having low to moderate levels of radon. However, recent data show that some areas of the state have high radon levels. The state needed more accurate data on radon hazards to promote testing.
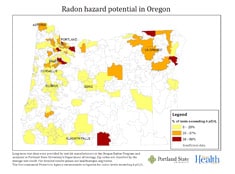
What did Tracking do?
The Oregon Tracking Program and partners developed maps showing radon hazards for areas smaller than counties. Tracking staff used these maps to support public education to encourage in-home radon testing during January 2013, Radon Action Month. They published the radon maps on the health department’s Radon Program web pages and on Oregon Tracking’s Facebook page. They sent news releases to media outlets announcing the maps and providing information about radon testing.
Improved public health
Television news coverage and two front-page articles in The Oregonian newspaper about the maps helped raise public awareness of radon hazards and encourage radon testing. Following the media coverage, monthly average visits to the Radon Program’s web pages tripled. Data from the American Lung Association (ALA) of Oregon showed that they sold nearly 300 test kits during the first day the front page Oregonian article ran. Within three days, ALA sold more radon test kits online than they did in the entire year of 2012. Increases in radon testing likely will lead to more people taking steps to decrease the amount of radon they come in contact with.
Pennsylvania – Documenting elevated blood lead levels
What is the problem?
Studies have shown Pennsylvania to have elevated blood lead level (BLLs) prevalence rates for adults and children that are higher than the national average.
What did Tracking do?
Pennsylvania’s Tracking Program began using the state’s National Electronic Disease Surveillance System (PA-NEDSS) to analyze 123 clusters of family members, containing 268 people with elevated BLLs.
Improved public health
Tracking elevated BLLs is of particular interest because biomonitoring for the disease can be accomplished. The surveillance showed that the PA-NEDSS database could provide an extensive resource of those individuals showing high levels of a serious environmental toxin, and that through tracking collaborative efforts, a more complete and thorough surveillance system could be established, linking the environmental hazards, exposures, and adverse health effects of lead.
Pennsylvania – Arsenic concentrations in groundwater
What is the problem?
Pennsylvania has a large rural population dependent on private wells for drinking water. Some of these wells pull groundwater that contains high levels of arsenic. Several studies have suggested that long-term exposure to arsenic contamination in groundwater increases the risk of developing bladder, kidney, liver, bronchus and lung, and prostate cancer.
What did Tracking do?
In order to better evaluate distribution of arsenic in the state’s ground water, USGS, Pennsylvania Department of Health, and Pennsylvania Department of Environmental Protection began surveillance in 2005 to relate arsenic concentrations in major aquifers. Aquifers are a formation, group of formations, or part of a formation that contains sufficient saturated, permeable material to yield significant quantities of water to wells and springs. Of 169 domestic wells and springs tested, arsenic was detected in 18. Of these, 10 wells had total arsenic levels greater than the U.S. Environmental Protection Agency (EPA) maximum containment level.
Improved public health
Pennsylvania’s Tracking Program counseled families in high risk areas to use bottled water and referred one person to a doctor because of extremely high arsenic levels. Also, doctors were advised to provide arsenic tests to residents in areas where severely elevated arsenic concentrations had been identified.
Utah – Lowering exposure to arsenic from private well water
What is the problem?
Some Millard County residents use private wells for cooking and drinking water. The Health Hazard Assessment team of the Utah Department of Health confirmed that in the Delta Conservation Districts, many of the private wells had arsenic concentrations high enough to be an urgent public health hazard.
What did Tracking do?
The Health Hazard Assessment team used drinking water data from the Utah Tracking Network to assess health effects in residents of Millard County caused by drinking arsenic- contaminated water from private wells.
Improved public health
Due to the high levels of arsenic found in this study, the Health Hazard Assessment team recommended that well water in this area not be used for drinking or cooking. They also suggested that residents of the area purchase and install water systems to reduce arsenic exposure in the community. Arsenic levels in water will be monitored until amounts are at levels that are not harmful to human health.
Utah – Reducing exposure to lead
What is the problem?
The Eureka Valley was heavily mined from the 1870s to 1965. Several large mine waste rock piles are located on the south side of the town of Eureka, close to homes and businesses. Mining activity and housing construction spread mine waste throughout the town. The mine waste exposed many residents to lead from the Eureka Mills Superfund site.
What did Tracking do?
Blood lead data available in the Utah Tracking Network showed highly elevated blood lead levels in children in Eureka. Soil sampling by the U.S. Environmental Protection Agency and the Utah Department of Environmental Quality also showed elevated levels of lead in soil in this community. These data resulted in an emergency cleanup of the area.
Improved public health
During the cleanup period, the Health Hazard Assessment team (HHA) and the Blood Lead Poisoning Prevention Program conducted free quarterly blood lead testing and provided education to the community. Since cleanup began, fewer children have shown signs of elevated blood lead levels. Now blood lead testing frequency has been reduced from every three months to once a year. The Utah Tracking Program with the Central Utah Public Health Department, Utah Department of Health, and the HHA team will continue blood lead testing for children living in Eureka until 2013.