Effect of Proxy Responses on Tobacco Use Surveys in Thailand, 2011
RESEARCH BRIEF — Volume 15 — October 25, 2018
Jason Hsia, PhD1; Hataichanok Puckcharern, MS2; Machell Town, PhD1 (View author affiliations)
Suggested citation for this article: Hsia J, Puckcharern H, Town M. Effect of Proxy Responses on Tobacco Use Surveys in Thailand, 2011. Prev Chronic Dis 2018;15:180158. DOI: http://dx.doi.org/10.5888/pcd15.180158external icon.
PEER REVIEWED
Abstract
Proxy responses are often allowed in household tobacco surveys when all household members are included in a sample. To assess the effect of proxy responses on prevalence estimates, we compared 2 surveys in 2011 that gauged tobacco use in Thailand: the Cigarette Smoking and Alcohol Drinking Survey (SADS) and the Global Adult Tobacco Survey (GATS). Both surveys had similar nonsampling errors and design, but SADS allowed proxy responses and GATS did not. When proxy responses were included in SADS, the prevalence estimate was 10% lower in GATS for men (41.69% in GATS vs 46.55% in SADS) and 18% lower in GATS for women (2.14% in GATS vs 2.61% in SADS). Eliminating proxy responses is recommended to increase accuracy of tobacco-use surveillance.
Objective
Household surveys with equal selection probability design often use selection probability proportional to size in the first few stages and simple random sampling to select a fixed household number in the last stage; then they interview all members of selected households. Although this design may have smaller sampling errors than unequal probability selection designs have, proxy responses introduce nonsampling errors, because of the varying availability of household members for interviews. The objective of this study was to assess the effect of proxy responses on estimating the prevalence of tobacco use in Thailand.
Methods
We used data from 2 tobacco-use surveys in Thailand that differed in proxy use but had similar sample design and other nonsampling errors (Appendix). The Smoking and Alcohol Drinking Survey (SADS) has been used for surveillance of tobacco and alcohol use in Thailand since 1991 (1). The Global Adult Tobacco Survey (GATS) was first used for tobacco surveillance in 2009 (2). SADS and GATS target noninstitutionalized persons (aged ≥11 in SADS and ≥15 in GATS). Both surveys categorize geography into 5 regions (Bangkok, Central, North, Northeast, or South) and 2 levels of urbanicity (urban or rural). All primary sampling units (PSUs) were enumeration areas designated by the National Statistical Office of Thailand (1,2). The number of PSUs was proportionally allocated to each stratum of geography and urbanicity. For first-stage SADS, 4,830 PSUs were selected by using selection probability proportional to the number of households. The second stage randomly chose an equal number of households from previously selected PSUs. All eligible people in the randomly selected household were interviewed; 1 present adult household member answered questions for unavailable members. In the first stage of GATS sampling, 1,088 PSUs were selected by using the same sampling method that SADS used. The second stage of sampling in GATS was also the same as in SADS. At the third stage, only 1 randomly selected member from all eligible household members was interviewed. The GATS survey protocol requires that at least 3 attempts are made to visit the selected household member; proxy responses are prohibited. Our comparison was based on 177,350 persons in SADS and 21,488 persons in GATS (all aged ≥15).
Thailand’s National Statistical Office conducted the surveys with similar interviewers, supervisors, interview techniques, response rates, and quality of fieldwork. Using the most recent survey data available (2011), we assessed a key survey variable, current smoking, for proxy responses. In Thailand, more than 95% of tobacco users are cigarette smokers; the prevalence of tobacco use is low among women. We calculated and compared current smoking prevalence and their 95% confidence intervals (CIs) for SADS (with and without proxy responses) and GATS.
Results
The response rate was 97.2% for SADS and 97.7% for GATS at the household level and 98.5% for GATS at the individual level. The proxy rate was 42.6% for SADS. Of proxy responses, 81.7% were provided by participants aged 45 or older and 67.9% were provided by women.
The prevalence of current smoking decreased for both men and women from 1991 to 2004 and then stayed flat thereafter in SADS (Figure). Estimates in SADS were lower than estimates in GATS in 2009 and 2011. In a comparison of GATS and SADS in 2011, when proxy responses were included in SADS, the prevalence estimate was 10% lower in GATS for men (41.69% vs 46.55%) and 18% lower in GATS for women (2.14% vs 2.61% ) (Table). The percentage-point differences between SADS and GATS were −4.87 (95% CI, −6.60 to −3.13; P < .001) for men and −0.47 (95% CI, −0.93 to −0.02; P = .04) for women. When proxy responses in SADS were excluded, the estimated prevalence in SADS increased to 45.27% for men and 2.86% for women in 2011, not significantly different from the estimates in GATS. We found similar results by age, residence, region, and income for all subgroups of men and most subgroups of women (Table). We found a different pattern for some subgroups of women. For example, among women aged 15 to 24, the prevalence increased when we excluded proxy responses in SADS, but the difference between the estimate in SADS (1.33%) was significantly different from the estimate in GATS (0.43%). With few exceptions, the estimated prevalence was higher in SADS after excluding proxy responses, and these estimates were closer to GATS estimates for men and women overall and among subgroups.
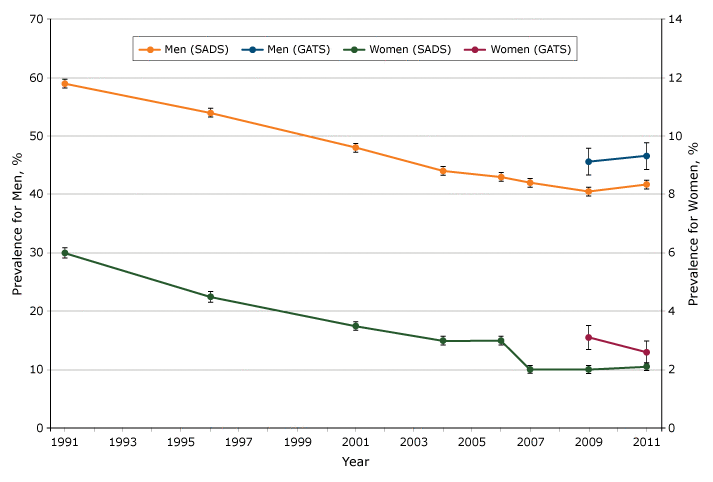
Figure.
Prevalence of current smoking estimated from SADS and GATS in Thailand, 2011. No data were available from GATS from 1991 through 2007. Error bars indicate 95% confidence intervals. Abbreviations: GATS, Global Adults Tobacco Survey (2); SADS, Cigarette Smoking and Alcohol Drinking Survey (1). [A tabular version of this figure is also available.]
Discussion
SADS and GATS in Thailand in 2011 provided a rare opportunity to compare prevalence estimates. Whereas SADS used equal probability sample and proxy responses, GATS used unequal probability sample and no proxy responses. The same authoritative statistical agency conducted both surveys, using similar interviewers, supervisors, and interview techniques and following the same field-operation protocol. Nonsampling errors other than those due to proxy responses, therefore, can be assumed to be similar to each other or at least not a major cause of nonsampling error in the comparison. When proxy responses were removed and prevalence estimates in SADS were recalculated, the estimates increased and were much closer to those in GATS, indicating that proxy reports generate lower estimates of smoking rates than self-reported data. Previous studies reported similar findings (3,4).
This study has several limitations. First, the study was conducted in Thailand, and the extent to which stigma about smoking may affect proxy responses is not known. For example, some family members may wish to hide another family member’s smoking behavior. Some proxy validation studies in the United States did not find this effect (5,6); in the United States, family members usually do not hide the smoking behavior of other family members. Second, small numbers of female smokers might have resulted in unstable estimates among subgroups of women in GATS, these unstable estimates might have affected the subgroup analysis among women, such as those aged 15 to 24. Third, older household members possibly acted as proxies for the more-often unavailable younger members. In the past decade, Thailand has developed a greater social tolerance for younger female smokers (1), and thus, household proxies may have had less of an effect on the reporting of stigmatized behaviors than they did previously (3).
The China Health Service Survey had similar findings in its multistage cluster sampling design, which permitted household proxies. The prevalence of current smoking among men in the China Health Service Survey was lower (46.5%) than the prevalence in a survey that had a similar design but prohibited household proxies (52.1%) (7,8). In summary, the results of our research in Thailand suggest that proxy responses generally lead to an underestimation of the prevalence of current smokers.
Acknowledgments
We did not have financial support for this project, nor do we have any conflicts of interest to disclose. No copyrighted materials or survey/instruments/tools were used. We thank the peer reviewers for their valuable comments.
Author Information
Corresponding Author: Jason Hsia, PhD, Division of Population Health, Centers for Disease Control and Prevention, 4770 Buford Hwy NE, MS-F78, Atlanta, GA 30341. Telephone: 770-488-6362. Email: zxx1@cdc.gov.
Author Affiliations: 1Division of Population Health, Centers for Disease Control and Prevention, Atlanta, Georgia. 2Division of Statistical System Management, National Statistical Office, Bangkok, Thailand.
References
- Termsirikulchai L, Benjakul S, Kengganpanich M, Theskayan N, Nakju S. Thailand tobacco control country profile. Bangkok (TH): Tobacco Control Research and Knowledge Management Center, Mahidol University; 2008. http://service.nso.go.th/nso/nsopublish/pubs/pubsfiles/sumSmoke54.pdf. Accessed August 2, 2018.
- World Health Organization. Global adult tobacco survey: Thailand report, 2011. World Health Organization, Regional Office for South-East Asia; 2011. http://www.searo.who.int/tobacco/surveillance/Global_Adult_Tobacco_Survey_Thailand_Report_2011.pdf. Accessed July 31, 2018.
- Berk ML, Horgan CM, Meyers SM. The reporting of stigmatizing health conditions: a comparison of proxy and self-reporting. J Econ Soc Meas 1986;14(3):197–205. PubMedexternal icon
- Gilpin EA, Pierce JP, Cavin SW, Berry CC, Evans NJ, Johnson M, et al. Estimates of population smoking prevalence: self-vs proxy reports of smoking status. Am J Public Health 1994;84(10):1576–9. CrossRefexternal icon PubMedexternal icon
- Navarro AM. Smoking status by proxy and self report: rate of agreement in different ethnic groups. Tob Control 1999;8(2):182–5. CrossRefexternal icon PubMedexternal icon
- Hyland A, Cummings KM, Lynn WR, Giffen CA. Effect of proxy-reported smoking status on population estimates of smoking prevalence. Am J Epidemiol 1997;145 (8):746–51.
- Qian J, Cai M, Gao J, Tang S, Xu L, Critchley JA. Trends in smoking and quitting in China from 1993 to 2003: National Health Service Survey data. Bull World Health Organ 2010;88(10):769–76. CrossRefexternal icon PubMedexternal icon
- Li Q, Hsia J, Yang G. Prevalence of smoking in China in 2010. N Engl J Med 2011;364(25):2469–70. CrossRefexternal icon PubMedexternal icon
Table
| Variable | SADS Including Proxy (a) | GATS (b) | SADS Excluding Proxy (c) | a − b, Percentage Point (95% CI) [P Valuea] | c − b, Percentage Point (95% CI) [P Valueb] |
|---|---|---|---|---|---|
| Men | |||||
| All | 41.69 | 46.55 | 45.27 | −4.87 (−6.60 to −3.13) [<.001] | −1.29 (−3.02 to 0.45) [.15] |
| Age | |||||
| 15–24 | 31.76 | 42.00 | 42.76 | −10.24 (−13.66 to −6.82) [<.001] | 0.76 (−2.67 to 4.19) [.66] |
| 25–44 | 47.59 | 50.50 | 49.74 | −2.90 (−5.69 to −0.11) [.04] | −0.76 (−3.55 to 2.03) [.59] |
| 45–59 | 45.11 | 48.74 | 46.73 | −3.63 (−7.10 to −0.16) [.04] | −2.01 (−5.48 to 1.46) [.26] |
| ≥60 | 32.61 | 38.30 | 34.43 | −5.68 (−9.05 to −2.31) [.001] | −3.86 (−7.24 to −0.49) [.02] |
| Residence | |||||
| Urban | 34.67 | 39.63 | 37.79 | −4.96 (−7.36 to −2.56) [<.001] | −1.84 (−4.25 to 0.56) [.13] |
| Rural | 45.23 | 50.08 | 49.36 | −4.85 (−7.30 to −2.39) [<.001] | −0.72 (−3.17 to 1.74) [.57] |
| Region | |||||
| Bangkok | 32.06 | 36.51 | 37.45 | −4.45 (−8.18 to −0.72) [.02] | 0.95 (−2.79 to 4.69) [.62] |
| Central | 37.38 | 44.54 | 41.69 | −7.16 (−11.02 to −3.31) [<.001] | −2.86 (−6.71 to 1.00) [.15 |
| North | 37.04 | 39.35 | 40.66 | −2.32 (−5.34 to 0.71) [.13] | 1.31 (−1.75 to 4.37) [.40] |
| Northeast | 46.50 | 49.70 | 50.22 | −3.20 (−6.33 to −0.07) [.045] | 0.52 (−2.61 to 3.65) [.74] |
| South | 50.52 | 59.24 | 53.66 | −8.72 (−13.81 to −3.63) [.001] | −5.58 (−10.66 to −0.49) [.03] |
| Income | |||||
| Lowest third | 39.77 | 47.83 | 45.56 | −8.06 (−11.06 to −5.06) [<.001] | −2.27 (−5.28 to 0.73) [.14] |
| Middle third | 48.94 | 51.54 | 50.72 | −2.59 (−5.10 to −0.08) [.04] | −0.81 (−3.33 to 1.71) [.53] |
| Highest third | 34.91 | 40.03 | 37.30 | −5.12 (−8.07 to −2.18) [.001] | −2.73 (−5.68 to 0.21) [.07] |
| Women | |||||
| All | 2.14 | 2.61 | 2.86 | −0.47 (−0.93 to −0.02) [.04] | 0.25 (−0.22 to 0.72) [.30] |
| Age | |||||
| 15–24 | 0.76 | 0.43 | 1.33 | 0.33 (0.04 to 0.62) [.03] | 0.90 (0.58 to 1.22) [<.001] |
| 25–44 | 1.71 | 2.34 | 2.15 | −0.63 (−1.26 to −0.01) [.05] | −0.19 (−0.84 to 0.46) [.56] |
| 45–59 | 2.95 | 3.71 | 3.48 | −0.76 (−1.47 to −0.05) [.06] | −0.23 (−1.04 to 0.58) [.58] |
| ≥60 | 3.42 | 3.90 | 4.16 | −0.48 (−0.94 to −0.02) [.25] | 0.26 (−0.58 to 1.10) [.54] |
| Residence | |||||
| Urban | 1.75 | 2.98 | 2.30 | −1.22 (−1.88 to −0.57) [<.001] | −0.67 (−1.34 to 0.01) [.048] |
| Rural | 2.35 | 2.41 | 3.16 | −0.06 (−0.52 to 0.39) [.79] | 0.75 (−0.07 to 1.23) [.002] |
| Region | |||||
| Bangkok | 1.57 | 2.80 | 2.25 | −1.23 (−1.99 to −0.48) [.001] | −0.55 (−1.33 to 0.24) [.17] |
| Central | 2.24 | 3.69 | 3.06 | −1.45 (−2.32 to −0.58) [.001] | −0.63 (−1.53 to 0.26) [.17] |
| North | 4.68 | 4.71 | 5.90 | −0.03 (−1.03 to 0.95) [.96] | 1.19 (−0.06 to 2.21) [.02] |
| Northeast | 1.08 | 1.04 | 1.50 | 0.04 (−0.44 to 0.52) [.88] | 0.45 (−0.04 to 0.94) [.07] |
| South | 1.54 | 1.50 | 1.89 | 0.04 (−0.53 to 0.62) [.89] | 0.39 (−0.19 to 0.97) [.19] |
| Income | |||||
| Lowest third | 2.32 | 3.10 | 3.18 | −0.78 (−1.40 to −0.15) [.01] | 0.07 (−0.57 to 0.72) [.82] |
| Middle third | 2.22 | 2.65 | 2.82 | −0.42 (−0.83 to −0.01) [.04] | 0.17 (−0.42 to 0.76) [.58] |
| Highest third | 1.24 | 1.75 | 1.74 | −0.50 (−0.97 to −0.03) [.04] | −0.01 (−0.49 to 0.48) [.98] |
Abbreviation: CI, confidence interval; GATS, Global Adults Tobacco Survey (2); SADS, Cigarette Smoking and Alcohol Drinking Survey (1).
a z Test used to determine whether estimated proportion from a is the same as from b.
b z Test used to determine whether estimated proportion from c is the same as from b.
Appendix. Survey Questions, Sample Design, and Survey Operation of 2011 Smoking and Alcohol Drinking Survey and 2011 Global Adults Tobacco Survey in Thailand
![]()
| Survey Questions | 2011 Smoking and Alcohol Drinking Survey | 2011 Global Adults Tobacco Survey |
|---|---|---|
| Current smoking | Do you currently smoke tobacco on a daily basis, less than daily, or not at all? | Do you currently smoke tobacco on a daily basis, less than daily, or not at all? (daily, less than daily, not at all, don’t know) |
| Questions before current smoking question | Demographic questions | Demographic questions |
| Question after current smoking question | Have you smoked tobacco daily in the past? (yes, no, don’t know, refused) | Have you smoked tobacco daily in the past?(yes, no, don’t know, refused) |
| Sample Design | 2-Stage stratified cluster sampling | 3-Stage stratified cluster sampling |
| Strata | Bangkok and 4 regions by urbanicity | Bangkok and 4 regions by urbanicity |
| Primary sampling units | Enumeration areas defined by the National Statistical Office (NSO) | Enumeration areas defined by NSO |
| Sampling units at stage 2 | Households | Households |
| Eligible persons | Persons aged ≥11 years living in primary residence | Persons aged ≥15 years living in primary residence |
| Sampling units at stage 3 | Not applicable | Randomly selected 1 person from the previously selected household |
| Survey operation | ||
| Field work dates | March–May 2011 | September–November 2011 |
| Interviewer composition | Designated NSO’s employees | Designated NSO’s employees |
| Interviewer training | Field interviewers/supervisors were divided into 15 training sessions. NSO provided trainings. | Field interviewers/supervisors were divided into 2 training sessions. NSO provided trainings. |
| Response rate at household level | 97.2% | 97.7% |
| Response rate at individual level | Not applicable | 98.5% |
| Proxy rate | 42.6% | Proxy was not allowed |
| Weight computation | ||
| Base weight | Inverse of product of selection probability of 2-stage sampling | Inverse of product of selection probability of 3-stage sampling |
| Adjustment for nonresponse | Inverse response rate within primary sampling unit | Inverse response rate within primary sampling unit × adjustment factor derived from weighting class method by region, urbanicity, age, and sex |
| Poststratification adjustment | Weighting class method by region, urbanicity, age, and sex | Weighting class method by region, urbanicity, age, and sex |
| Variance Estimation | Linearization method using SAS | Linearization method using SAS |
The opinions expressed by authors contributing to this journal do not necessarily reflect the opinions of the U.S. Department of Health and Human Services, the Public Health Service, the Centers for Disease Control and Prevention, or the authors’ affiliated institutions.