Human Papillomavirus Vaccination Coverage in Children Ages 9–17 Years: United States, 2022
NCHS Data Brief No. 495, February 2024
PDF Version (539 KB)
Maria A. Villarroel, Ph.D., Adena M. Galinsky, Ph.D., Peng-Jun Lu, M.D., Ph.D., and Cassandra Pingali, M.S., M.P.H.
- Key findings
- The percentage of children who have received one or more HPV vaccine doses increased with age and varied by sex and race and Hispanic origin.
- The percentage of children who have received one or more HPV vaccine doses was lowest among those without health insurance, and it increased with increasing parental education and family income.
- The percentage of children who have received one or more HPV vaccine doses varied by disability status.
- The percentage of children who have received one or more HPV vaccine doses varied by urbanization level.
- Summary
Data from the National Health Interview Survey
- In 2022, 38.6% of children ages 9–17 years had received one or more human papillomavirus (HPV) vaccine doses.
- Children with private health insurance (41.5%) were most likely to have received one or more HPV vaccine doses compared with children with Medicaid coverage (37.0%), other government coverage (30.2%), and those without insurance (20.7%).
- The percentage of children who have received one or more HPV vaccine doses was higher among those with disability.
- Children living in large central metropolitan areas (39.4%), large fringe metropolitan areas (41.1%), and medium and small metropolitan areas (39.4%) were more likely to have received one or more HPV vaccine doses, compared with children living in nonmetropolitan areas (30.0%).
Human papillomavirus (HPV) is the most common sexually transmitted infection in men and women in the United States (1). Vaccination prevents and controls HPV infection and associated outcomes, including genital warts, precancerous lesions, and certain cancers, such as cervical, vaginal, vulvar, anal, penile, and oropharyngeal (2,3). HPV vaccination in the United States has been recommended for girls since 2006 and for boys since 2011 and requires multiple doses (2,3). This vaccine, targeted for children ages 11–12 years, may be started at age 9. This report uses parent-reported data from the 2022 National Health Interview Survey to describe the percentage of children ages 9–17 years who received at least one dose of the HPV vaccine by selected sociodemographic and health characteristics.
Keywords: immunization, health care utilization, cancer prevention, National Health Interview Survey
The percentage of children who have received one or more HPV vaccine doses increased with age and varied by sex and race and Hispanic origin.
- In 2022, 38.6% of children ages 9–17 years had received one or more HPV vaccine doses (Figure 1).
- The percentage of children who have received one or more HPV vaccine doses increased with age: 7.3% among children ages 9–10 years, 30.9% among children ages 11–12 years, 48.8% among children ages 13–14 years, and 56.9% among children ages 15–17 years.
- Girls (42.9%) were more likely than boys (34.6%) to have received one or more HPV vaccine doses.
- Hispanic children (34.4%) were less likely than White non-Hispanic (subsequently, White) children (39.9%) to have received one or more HPV vaccine doses. All other observed differences between Asian non-Hispanic (subsequently, Asian), Black non-Hispanic (subsequently, Black), White, and Hispanic children were not significant.
Figure 1. Percentage of children ages 9–17 years who have received one or more human papillomavirus vaccine doses, by age group, sex, and race and Hispanic origin: United States, 2022
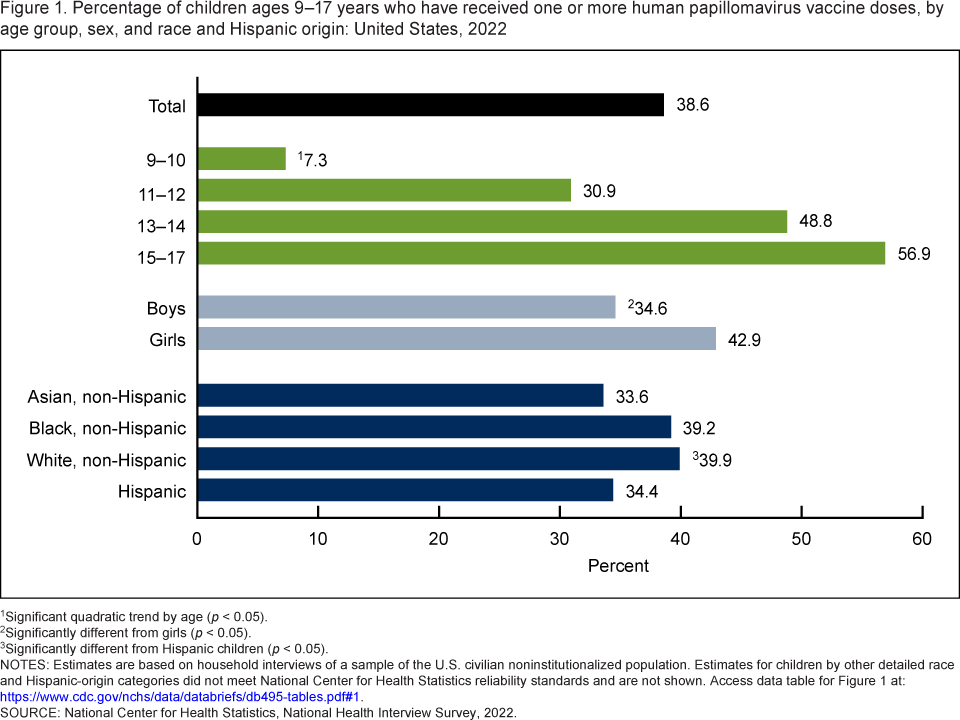
1Significant quadratic trend by age (p < 0.05).
2Significantly different from girls (p < 0.05).
3Significantly different from Hispanic children (p < 0.05).
NOTES: Estimates are based on household interviews of a sample of the U.S. civilian noninstitutionalized population. Estimates for children by other detailed race and Hispanic-origin categories did not meet National Center for Health Statistics reliability standards and are not shown. Access data table for Figure 1.
SOURCE: National Center for Health Statistics, National Health Interview Survey, 2022.
The percentage of children who have received one or more HPV vaccine doses was lowest among those without health insurance, and it increased with increasing parental education and family income.
- Children with private health insurance (41.5%) were more likely to have received one or more HPV vaccine doses compared with children with Medicaid coverage (37.0%), other government coverage (30.2%), and those without insurance (20.7%) (Figure 2). Children with Medicaid coverage were more likely to have received one or more HPV vaccine doses compared with uninsured children. Observed differences between children with other government coverage and children with Medicaid coverage and children without insurance were not significant.
- The percentage of children who have received one or more HPV vaccine doses increased with increasing parental education, from 31.1% of children who lived in households with parents whose highest education was high school or less to 40.6% of children with parents who had an associate’s degree or some college to 42.1% of children with parents whose highest education was a bachelor’s degree or higher.
- The percentage of children who have received one or more HPV vaccine doses increased with increasing family income, from 29.9% among children with a family income of less than 100% of the federal poverty level to 45.7% among children with a family income of 400% or more of the federal poverty level.
Figure 2. Percentage of children ages 9–17 years who have received one or more human papillomavirus vaccine doses, by health insurance coverage of child, education level of parents, and family income as a percentage of the federal poverty level: United States, 2022
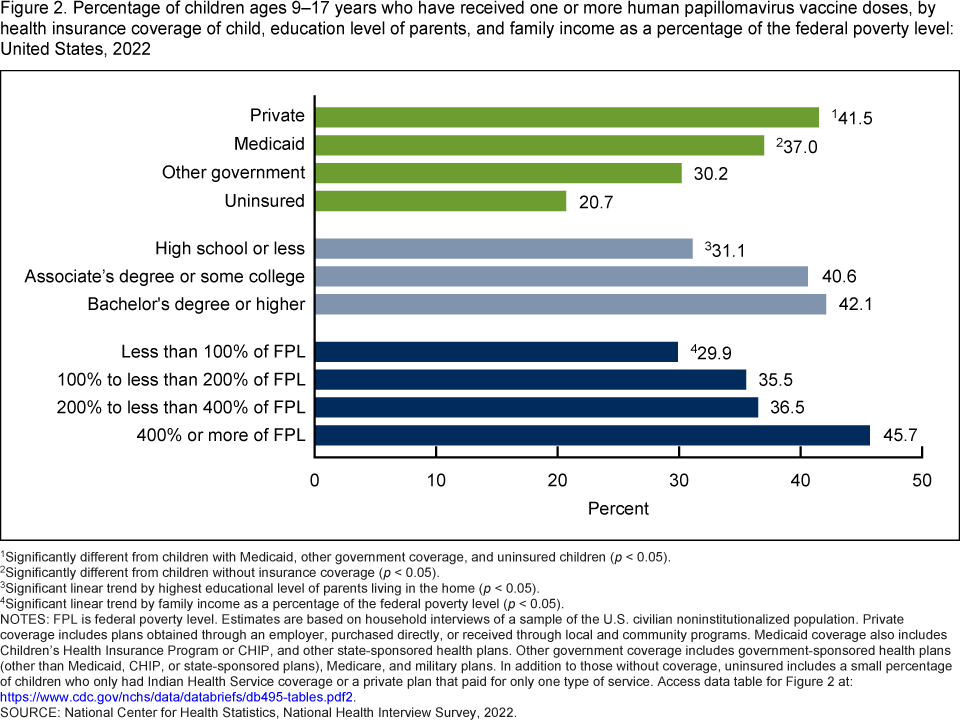
1Significantly different from children with Medicaid, other government coverage, and uninsured children (p < 0.05).
2Significantly different from children without insurance coverage (p < 0.05).
3Significant linear trend by highest educational level of parents living in the home (p < 0.05).
4Significant linear trend by family income as a percentage of the federal poverty level (p < 0.05).
NOTES: FPL is federal poverty level. Estimates are based on household interviews of a sample of the U.S. civilian noninstitutionalized population. Private coverage includes plans obtained through an employer, purchased directly, or received through local and community programs. Medicaid coverage also includes Children’s Health Insurance Program or CHIP, and other state-sponsored health plans. Other government coverage includes government-sponsored health plans (other than Medicaid, CHIP, or state-sponsored plans), Medicare, and military plans. In addition to those without coverage, uninsured includes a small percentage of children who only had Indian Health Service coverage or a private plan that paid for only one type of service. Access data table for Figure 2.
SOURCE: National Center for Health Statistics, National Health Interview Survey, 2022.
The percentage of children who have received one or more HPV vaccine doses varied by disability status.
- Children with disability (44.1%) were more likely to have received one or more HPV vaccine doses than children without disability (37.7%) (Figure 3).
Figure 3. Percentage of children ages 9–17 years who have received one or more human papillomavirus vaccine doses, by disability status: United States, 2022
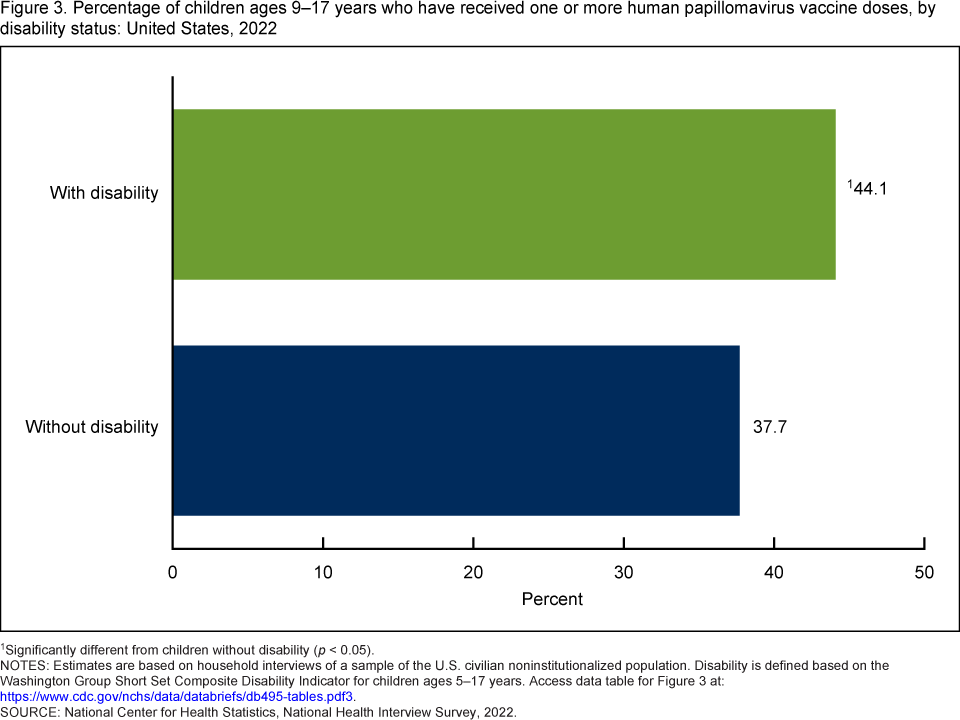
1Significantly different from children without disability (p < 0.05).
NOTES: Estimates are based on household interviews of a sample of the U.S. civilian noninstitutionalized population. Disability is defined based on the Washington Group Short Set Composite Disability Indicator for children ages 5–17 years. Access data table for Figure 3.
SOURCE: National Center for Health Statistics, National Health Interview Survey, 2022.
The percentage of children who have received one or more HPV vaccine doses varied by urbanization level.
- The percentage of children who have received one or more HPV vaccine doses was higher for those living in large central metropolitan areas (39.4%), large fringe metropolitan areas (41.1%), and medium and small metropolitan areas (39.4%) compared with those living in nonmetropolitan areas (30.0%) (Figure 4).
Figure 4. Percentage of children ages 9–17 years who have received one or more human papillomavirus vaccine doses, by urbanization level: United States, 2022
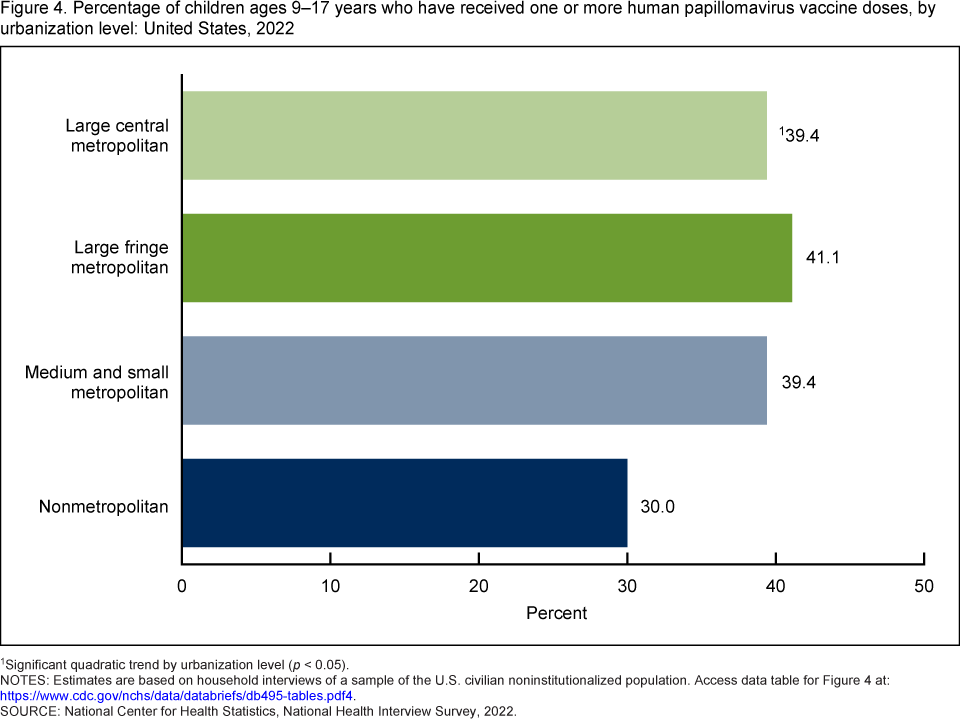
1Significant quadratic trend by urbanization (p < 0.05).
NOTES: Estimates are based on household interviews of a sample of the U.S. civilian noninstitutionalized population. Access data table for Figure 4.
SOURCE: National Center for Health Statistics, National Health Interview Survey, 2022.
Summary
In 2022, 38.6% of children ages 9–17 years had received one or more HPV vaccine doses, and vaccination coverage increased with child’s increasing age, parental education, and family income. HPV vaccination was higher in children covered by private health insurance than those covered by Medicaid, other government programs, and those without insurance. Girls were more likely to have been vaccinated than boys. Children with disability were more likely to have been vaccinated than children without disability. HPV vaccination coverage was lower among Hispanic children compared with White children. Additionally, coverage was lower among children living in nonmetropolitan areas than those living in metropolitan areas.
The Centers for Disease Control and Prevention recommends a two-dose series, with the two doses given 6 to 12 months apart, for children ages 11–12 years, although the vaccination series can start when children are age 9 (4). A three-dose series is recommended for children with a weakened immune system and those starting vaccination at age 15 years or older. Previous studies have assessed the receipt of one or more HPV vaccine doses and up-to-date HPV vaccination among children ages 13–17 years, an age range that is eligible to have completed the HPV vaccine series (5,6). This report examined receipt of at least one dose of the HPV vaccine and disparities in coverage in children ages 9–17 years, an age group that comprises both those actively eligible for the vaccine but not yet overdue for vaccination until age 13, and those eligible to have completed the HPV vaccine series.
Definitions
Disability: Based on the Washington Group Short Set Composite Disability Indicator for children ages 5–17 years indicating presence or absence of disability. Disability is based on the responses “a lot of difficulty” or “cannot do at all” to at least one of the questions asking about the Sample Child’s difficulty seeing, hearing, walking, self-care, communication, learning, remembering, concentrating, accepting change, controlling behavior, and making friends, or the response “daily” to questions asking how often the Sample Child seems very “anxious, nervous, or worried” or “sad or depressed.” Additional information on the Washington Group on Disability Statistics is available from: https://www.washingtongroup-disability.com/.
Family income as a percentage of the federal poverty level: Based on the federal poverty level, which was calculated from the family’s income in the previous calendar year and family size using the U.S. Census Bureau’s poverty thresholds (7). Family income was imputed when missing (8).
Health insurance: Type(s) of coverage at the time of interview. This information was used to create a hierarchy of four mutually exclusive categories: a) private coverage (obtained through an employer, purchased directly, or received through local and community programs); b) Medicaid, including the Children’s Health Insurance Program or CHIP and other state-sponsored health plans; c) other government coverage (other government-sponsored health plan, Medicare, and military plans); and d) uninsured (those without coverage or who only had Indian Health Service coverage or a private plan that paid for only one type of service). Children with more than one type of health insurance were assigned to the first appropriate category in the hierarchy.
Human papillomavirus (HPV) vaccination: Based on an affirmative response from the Sample Child respondent to the question, “HPV is the human papillomavirus. Has [Sample Child’s name] ever received an HPV shot or vaccine?” This question was asked about children ages 9–17 years.
Parental education: Refers to the Sample Child’s parent with the highest education living in the household, regardless of the number of parents in the home.
Race and Hispanic origin: Children categorized as non-Hispanic indicated one race only; respondents had the option to select more than one racial group. Children categorized as Hispanic could be of any race or combination of races. Estimates for non-Hispanic children of races other than Asian, Black, and White are not shown due to the inability to make statistically reliable estimates for these groups, but they are included in total estimates.
Urbanization level: Metropolitan status and size was determined using the 2013 NCHS Urban–Rural Classification Scheme for counties (9). Large metropolitan areas are metropolitan statistical areas of 1 million or more people and are categorized into central and fringe counties. Medium and small metropolitan areas are counties in metropolitan statistical areas of 250,000–999,999 people and less than 250,000 people, respectively. Nonmetropolitan areas are counties in micropolitan statistical areas and noncore counties.
Data source and methods
The National Health Interview Survey is a nationally representative household survey of the U.S. civilian noninstitutionalized population. It is conducted continuously throughout the year by the National Center for Health Statistics. Interviews are typically conducted in respondents’ homes, but follow-ups to complete interviews may be conducted over the telephone. Information about the Sample Child is collected from a parent or adult who is knowledgeable about and responsible for the health care of the Sample Child. Due to the COVID-19 pandemic, data collection procedures were disrupted, and during 2022, 56.1% of Sample Child interviews were conducted at least partially by telephone (10). For more information about the National Health Interview Survey, visit: https://www.cdc.gov/nchs/nhis.htm.
Point estimates and the corresponding variances were calculated using SAS-callable SUDAAN (11) to account for the complex sample design of the National Health Interview Survey. All estimates presented meet the National Center for Health Statistics’ data presentation standards for proportions (12). Differences between percentages were evaluated using two-sided significance tests at the 0.05 level. Linear and quadratic trends by age group, parental education, family income, and urbanization level were evaluated using orthogonal polynomials in logistic regression.
About the authors
Maria A. Villarroel and Adena M. Galinsky are with the National Center for Health Statistics, Division of Health Interview Statistics. Peng-Jun Lu and Cassandra Pingali are with the National Center for Immunization and Respiratory Diseases, Division of Immunization Services.
References
- Kreisel KM, Spicknall IH, Gargano JW, Lewis FMT, Lewis RM, Markowitz LE, et al. Sexually transmitted infections among US women and men: Prevalence and incidence estimates, 2018. Sex Transm Dis 48(4):208–14. 2021
- Centers for Disease Control and Prevention. Quadrivalent human papillomavirus vaccine: Recommendations of the Advisory Committee on Immunization Practices (ACIP). MMWR Recomm Rep 56(RR–2):1–24. 2007.
- Centers for Disease Control and Prevention. Recommendations on the use of quadrivalent human papillomavirus vaccine in males—Advisory Committee on Immunization Practices (ACIP), 2011. MMWR Morb Mortal Wkly Rep 60(50):1705–8. 2011.
- Centers for Disease Control and Prevention. HPV vaccine schedule and dosing.
- Lu PJ, Yankey D, Fredua B, Hung MC, Sterrett N, Markowitz LE, Elam-Evans LD. Human papillomavirus vaccination trends among adolescents: 2015 to 2020. Pediatrics 1:150(1):e2022056597. 2022.
- Pingali C, Yankey D, Elam-Evans LD, Markowitz LE, Valier MR, Fredua B, et al. Vaccination coverage among adolescents aged 13–17 years—National Immunization Survey–Teen, United States, 2022. MMWR Morb Mortal Wkly Rep 72(34):912–9. 2023.
- United States Census Bureau. Poverty thresholds. 2021.
- National Center for Health Statistics. Multiple imputation of family income in 2022 National Health Interview Survey: Methods. 2023.
- Ingram DD, Franco SJ. 2013 NCHS urban–rural classification scheme for counties. National Center for Health Statistics. Vital Health Stat 2(166). 2014.
- National Center for Health Statistics. National Health Interview Survey: 2022 survey description. 2023.
- RTI International. SUDAAN (Release 11.0.3) [computer software]. 2018.
- Parker JD, Talih M, Malec DJ, Beresovsky V, Carroll M, Gonzalez JF Jr, et al. National Center for Health Statistics data presentation standards for proportions. National Center for Health Statistics. Vital Health Stat 2(175). 2017.
Suggested citation
Villarroel MA, Galinsky AM, Lu PJ, Pingali C. Human papillomavirus vaccination coverage in children ages 9–17 years: United States, 2022. NCHS Data Brief, no 495. Hyattsville, MD: National Center for Health Statistics. 2024. DOI: https://dx.doi.org/10.15620/cdc:145593.
Copyright information
All material appearing in this report is in the public domain and may be reproduced or copied without permission; citation as to source, however, is appreciated.
National Center for Health Statistics
Brian C. Moyer, Ph.D., Director
Amy M. Branum, Ph.D., Associate Director for Science
Division of Health Interview Statistics
Stephen J. Blumberg, Ph.D., Director
Anjel Vahratian, Ph.D., M.P.H., Associate Director for Science