Drug Overdose Deaths in the United States, 2002–2022
- Key findings
- The overall rate of drug overdose deaths remained stable between 2021 and 2022.
- The rate of drug overdose deaths increased among middle-aged and older adults from 2021 to 2022.
- Between 2021 and 2022, age-adjusted rates of drug overdose deaths increased for American Indian and Alaska Native non-Hispanic, Black non-Hispanic, Hispanic, and Asian non-Hispanic people.
- Age-adjusted rates of drug overdose deaths involving synthetic opioids other than methadone have increased over the past decade.
- The increases in age-adjusted rates of drug overdose deaths involving cocaine and psychostimulants with abuse potential that began around 2011 continued through 2022.
Data from the National Vital Statistics System
- The age-adjusted rate of drug overdose deaths increased from 8.2 deaths per 100,000 standard population in 2002 to 32.6 in 2022; however, the rate did not significantly change between 2021 and 2022.
- Rates decreased between 2021 and 2022 for people ages 15–34 and increased for those age 35 and older.
- Between 2021 and 2022, rates increased for all race and Hispanic-origin groups, except Native Hawaiian or Other Pacific Islander non-Hispanic and White non-Hispanic people.
- Between 2021 and 2022, the rate for synthetic opioids other than methadone increased 4.1% from 21.8 to 22.7, while rates for heroin, natural and semisynthetic opioids, and methadone declined.
- Between 2021 and 2022, rates for cocaine and psychostimulants with abuse potential increased.
Drug overdoses are one of the leading causes of injury death in adults and have risen over the past several decades in the United States (1–3). Overdoses involving synthetic opioids (fentanyl, for example) and stimulants (cocaine and methamphetamine, for example) have also risen in the past few years (1,4). This report presents rates of drug overdose deaths from the National Vital Statistics System over a 20-year period by demographic group and by the type of drugs involved (specifically, opioids and stimulants), with a focus on changes from 2021 to 2022.
Keywords: opioids, heroin, cocaine, methamphetamine, National Vital Statistics System, Mortality
The overall rate of drug overdose deaths remained stable between 2021 and 2022.
- In 2022, 107,941 drug overdose deaths occurred, resulting in an age-adjusted rate of 32.6 deaths per 100,000 standard population (Figure 1).
- Overall, the age-adjusted rate of drug overdose deaths nearly quadrupled from 8.2 in 2002 to 32.6 in 2022; however, the rate did not significantly change between 2021 (32.4) and 2022 (32.6).
- Between 2021 and 2022, the age-adjusted rate of drug overdose deaths for males increased 1.1% from 45.1 to 45.6, while the rate for females decreased 1.0% from 19.6 to 19.4, although this decrease was not significant.
Figure 1. Age-adjusted rate of drug overdose deaths, by sex: United States, 2002–2022
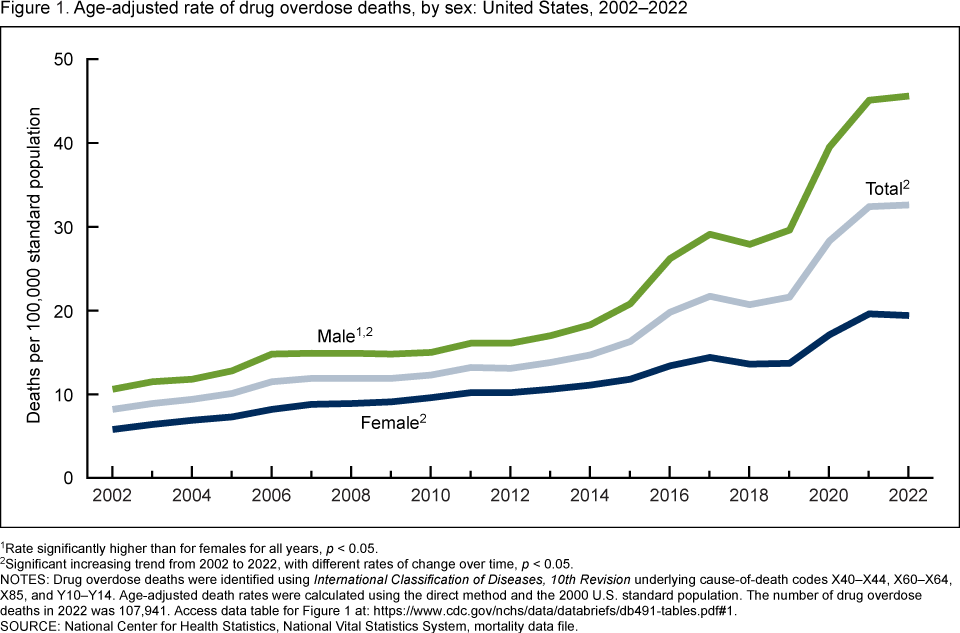
1Rate significantly higher than for females for all years p < 0.05.
2Significant increasing trend from 2002 to 2022, with different rates of change over time, p < 0.05.
NOTES: Drug overdose deaths were identified using International Classification of Diseases, 10th Revision underlying cause-of-death codes X40–X44, X60–X64, X85, and Y10–Y14. Age-adjusted death rates were calculated using the direct method and the 2000 U.S. standard population. The number of drug overdose deaths in 2022 was 107,941. Access data table for Figure 1.
SOURCE: National Center for Health Statistics, National Vital Statistics System, mortality data file.
The rate of drug overdose deaths increased among middle-aged and older adults from 2021 to 2022.
- From 2021 to 2022, the rate of drug overdose deaths decreased among adults ages 15–24 and 25–34, while rates increased among adults age 35 and older (Figure 2).
- In both 2021 and 2022, rates were highest for adults ages 35–44 (62.0 deaths per 100,000 population and 63.1, respectively), and rates were lowest for adults age 65 and older (12.0 and 13.2, respectively).
- Adults age 65 and older experienced the largest percent increase in the rate of drug overdose deaths from 2021 to 2022, at 10.0% (from 12.0 to 13.2).
Figure 2. Rate of drug overdose deaths, by selected age groups 15 and older: United States, 2021 and 2022
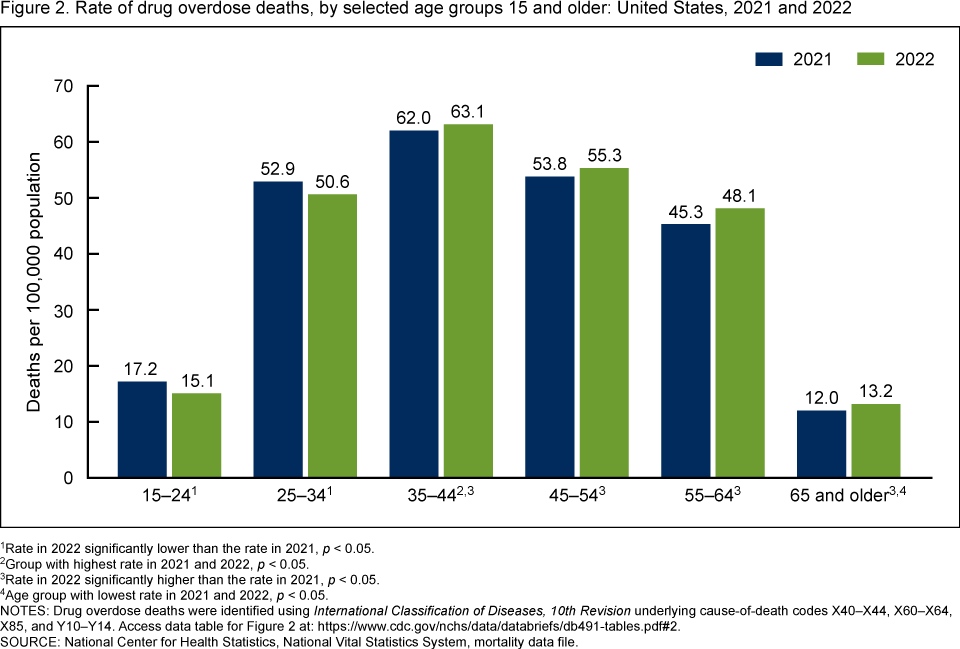
1Rate in 2022 significantly lower than the rate in 2021, p < 0.05.
2Group with highest rate in 2021 and 2022, p < 0.05.
3Rate in 2022 significantly higher than the rate in 2021, p < 0.05.
4Age group with lowest rate in 2021 and 2022, p < 0.05.
NOTES: Drug overdose deaths were identified using International Classification of Diseases, 10th Revision underlying cause-of-death codes X40–X44, X60–X64, X85, and Y10–Y14. Access data table for Figure 2.
SOURCE: National Center for Health Statistics, National Vital Statistics System, mortality data file.
Between 2021 and 2022, age-adjusted rates of drug overdose deaths increased for American Indian and Alaska Native non-Hispanic, Black non-Hispanic, Hispanic, and Asian non-Hispanic people.
- For White non-Hispanic (subsequently, White) and Native Hawaiian or Other Pacific Islander non-Hispanic (subsequently, Native Hawaiian or Other Pacific Islander) people, age-adjusted rates of drug overdose deaths were lower in 2022 than in 2021, although the decrease among Native Hawaiian or Other Pacific Islander people was not significant (Figure 3).
- In both 2021 and 2022, age-adjusted rates were highest for American Indian and Alaska Native non-Hispanic (subsequently, American Indian and Alaska Native) people (56.6 deaths per 100,000 standard population and 65.2, respectively), and lowest for Asian non-Hispanic (subsequently, Asian) people (4.7 and 5.3, respectively).
- American Indian and Alaska Native people experienced the largest percent increase in the age-adjusted rate of drug overdose deaths from 2021 to 2022, with the rate increasing 15.0% from 56.6 to 65.2.
Figure 3. Age-adjusted rate of drug overdose deaths, by race and Hispanic origin: United States, 2021 and 2022
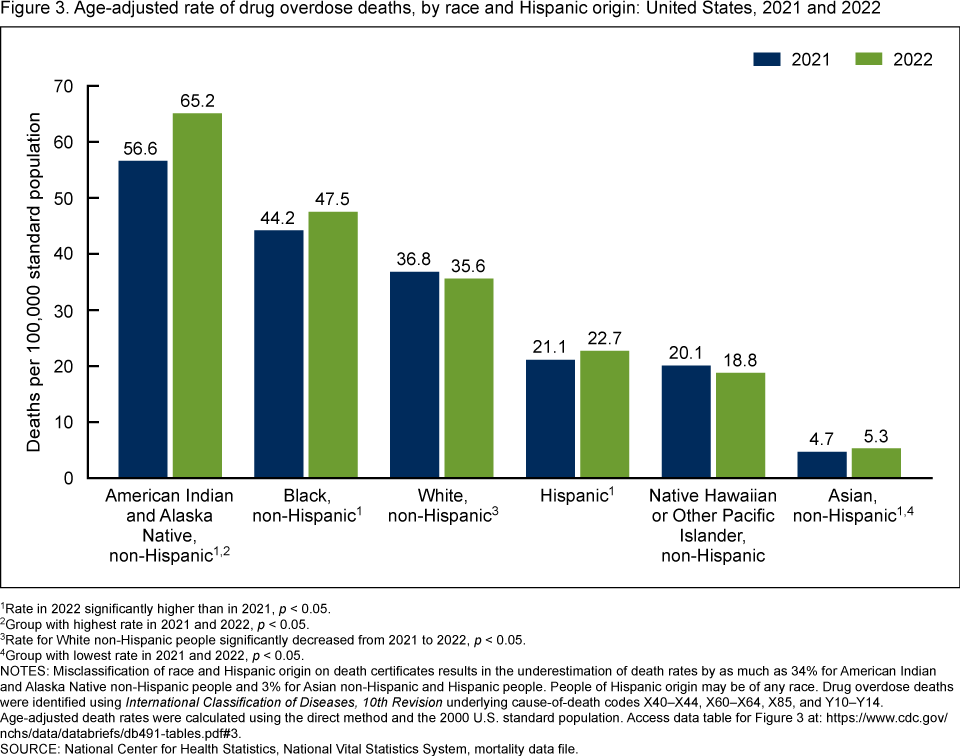
1Rate in 2022 significantly higher than in 2021, p < 0.05
2Group with highest rate in 2021 and 2022, p < 0.05
3Rate for White non-Hispanic people significantly decreased from 2021 to 2022, p < 0.05
4Group with lowest rate in 2021 and 2022, p < 0.05
NOTES: Misclassification of race and Hispanic origin on death certificates results in the underestimation of death rates by as much as 34% for American Indian and Alaska Native non-Hispanic people and 3% for Asian non-Hispanic and Hispanic people. People of Hispanic origin may be of any race. Drug overdose deaths were identified using International Classification of Diseases, 10th Revision underlying cause-of-death codes X40–X44, X60–X64, X85, and Y10–Y14. Age-adjusted death rates were calculated using the direct method and the 2000 U.S. standard population. Access data table for Figure 3.
SOURCE: National Center for Health Statistics, National Vital Statistics System, mortality data file.
Age-adjusted rates of drug overdose deaths involving synthetic opioids other than methadone have increased over the past decade.
- The age-adjusted rate of drug overdose deaths involving synthetic opioids other than methadone, which includes fentanyl, fentanyl analogs, and tramadol, was mostly stable from 2002 (0.4 deaths per 100,000 standard population) to 2013 (1.0) and then increased through 2022 (22.7), with different rates of change over time (Figure 4).
- The age-adjusted rate of drug overdose deaths involving heroin decreased 35.7% from 2.8 in 2021 to 1.8 in 2022.
- The age-adjusted rate of drug overdose deaths involving natural and semisynthetic opioids, which includes drugs such as morphine, oxycodone, and hydrocodone, decreased 12.5% from 4.0 in 2021 to 3.5 in 2022.
- The age-adjusted rate of drug overdose deaths involving methadone decreased slightly from 1.1 in 2021 to 1.0 in 2022.
Figure 4. Age-adjusted rate of drug overdose deaths involving opioids, by type of opioid: United States, 2002–2022
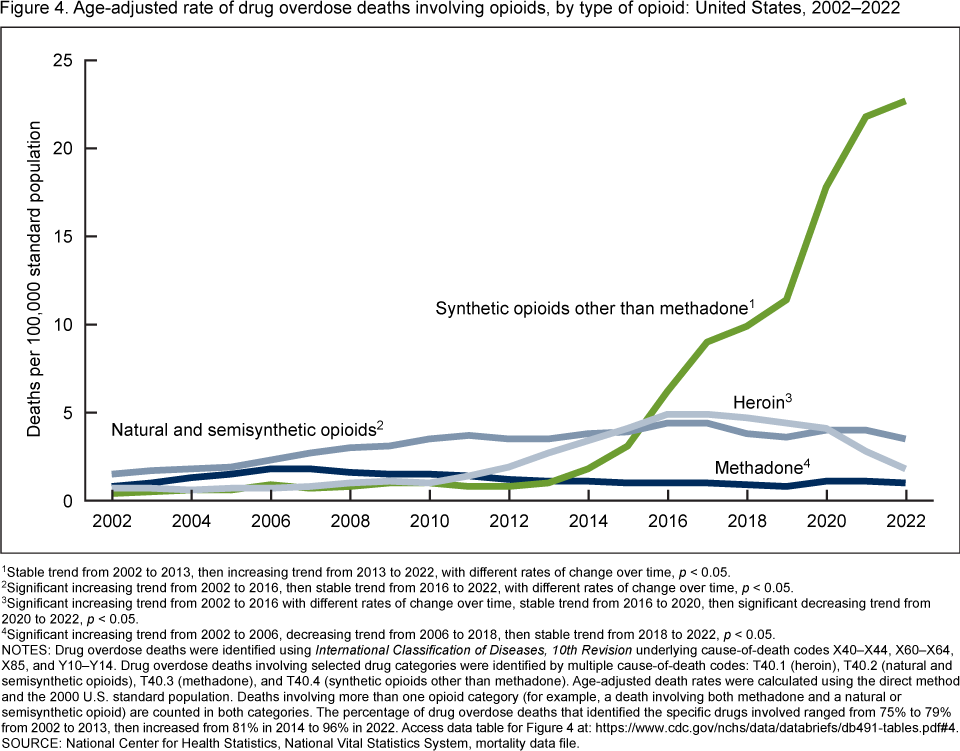
1Stable trend from 2002 to 2013, then increasing trend from 2013 to 2022, with different rates of change over time, p < 0.05.
2Significant increasing trend from 2002 to 2016, then stable trend from 2016 to 2022, with different rates of change over time, p < 0.05.
3Significant increasing trend from 2002 to 2016 with different rates of change over time, stable trend from 2016 to 2020, then significant decreasing trend from 2020 to 2022, p < 0.05.
4Significant increasing trend from 2002 to 2006, decreasing trend from 2006 to 2018, then stable trend from 2018 to 2022, p < 0.05.
NOTES: Drug overdose deaths were identified using International Classification of Diseases, 10th Revision underlying cause-of-death codes X40–X44, X60–X64, X85, and Y10–Y14. Drug overdose deaths involving selected drug categories were identified by multiple cause-of-death codes: T40.1 (heroin), T40.2 (natural and semisynthetic opioids), T40.3 (methadone), and T40.4 (synthetic opioids other than methadone). Age-adjusted death rates were calculated using the direct method and the 2000 U.S. standard population. Deaths involving more than one opioid category (for example, a death involving both methadone and a natural or semisynthetic opioid) are counted in both categories. The percentage of drug overdose deaths that identified the specific drugs involved ranged from 75% to 79% from 2002 to 2013, then increased from 81% in 2014 to 96% in 2022. Access data table for Figure 4.
SOURCE: National Center for Health Statistics, National Vital Statistics System, mortality data file.
The increases in age-adjusted rates of drug overdose deaths involving cocaine and psychostimulants with abuse potential that began around 2011 continued through 2022.
- The age-adjusted rate of drug overdose deaths involving cocaine increased slightly from 1.6 deaths per 100,000 standard population in 2002 to 2.5 in 2006, decreased to 1.3 in 2010, then increased to 8.2 in 2022; the rate in 2022 was 12.3% higher than the rate in 2021 (7.3) (Figure 5).
- The age-adjusted rate of drug overdose deaths involving psychostimulants with abuse potential (subsequently, psychostimulants), which includes methamphetamine, amphetamine, and methylphenidate, was 4.0% higher in 2022 than the rate in 2021 (10.4 compared with 10.0).
- The age-adjusted rate of drug overdose deaths involving psychostimulants increased more than 34 times from 2002 (0.3) to 2022 (10.4), with different rates of change over time.
Figure 5. Age-adjusted rate of drug overdose deaths involving stimulants, by type of stimulant: United States, 2002–2022
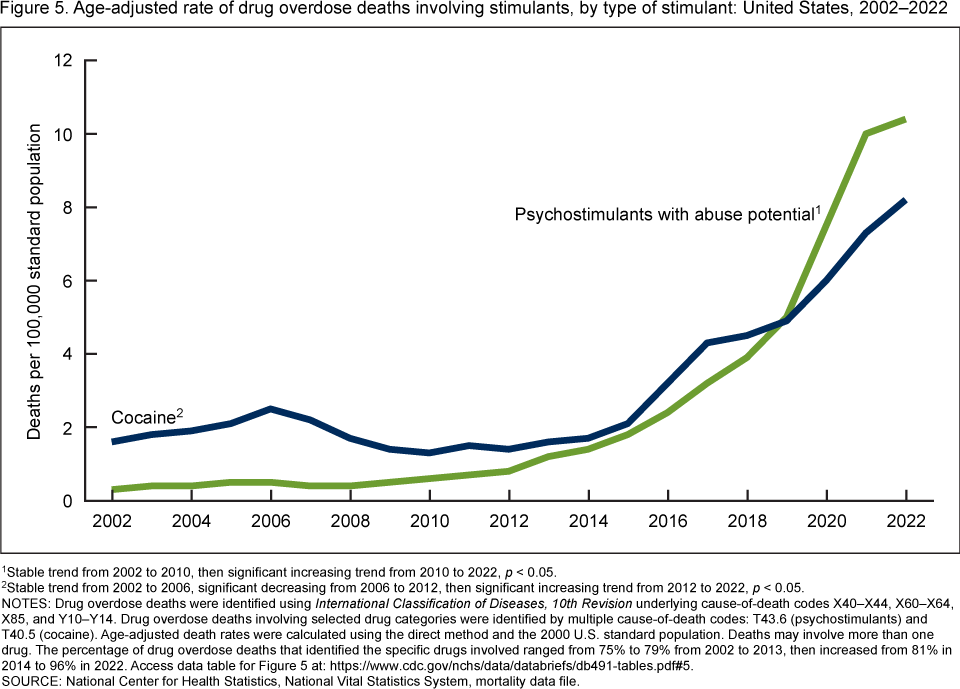
1Stable trend from 2002 to 2010, then significant increasing trend from 2010 to 2022, p < 0.05.
2Stable trend from 2002 to 2006, significant decreasing from 2006 to 2012, then significant increasing trend from 2012 to 2022, p < 0.05.
NOTES: Drug overdose deaths were identified using International Classification of Diseases, 10th Revision underlying cause-of-death codes X40–X44, X60–X64, X85, and Y10–Y14. Drug overdose deaths involving selected drug categories were identified by multiple cause-of-death codes: T43.6 (psychostimulants) and T40.5 (cocaine). Age-adjusted death rates were calculated using the direct method and the 2000 U.S. standard population. Deaths may involve more than one drug. The percentage of drug overdose deaths that identified the specific drugs involved ranged from 75% to 79% from 2002 to 2013, then increased from 81% in 2014 to 96% in 2022. Access data table for Figure 5.
SOURCE: National Center for Health Statistics, National Vital Statistics System, mortality data file.
Summary
The age-adjusted rate of drug overdose deaths did not significantly increase from 2021 (32.4) to 2022 (32.6). In contrast, rates have significantly increased in most previous years. From 2019 to 2020, the drug overdose death rate increased 31.0% from 21.6 to 28.3, which was the largest annual increase over the period 2002–2022.
From 2021 to 2022, the rate for males increased while the rate for females decreased slightly, although the decrease for females was not significant. In both 2021 and 2022, adults ages 35–44 had the highest rate among people age 15 and older, and adults age 65 and older had the lowest. Between 2021 and 2022, rates of drug overdose deaths decreased for people ages 15–34 and increased for adults age 35 and older.
In both 2021 and 2022, rates were highest for American Indian and Alaska Native people and lowest among Asian people. Between 2021 and 2022, rates of drug overdose deaths increased for most race and Hispanic-origin groups. Rates decreased for White and Native Hawaiian or Other Pacific Islander people, although the decrease among Native Hawaiian or Other Pacific Islander people was not significant.
From 2021 to 2022, rates increased for drug overdose deaths involving synthetic opioids other than methadone, psychostimulants, and cocaine. From 2021 to 2022, rates decreased for drug overdose deaths involving heroin, natural and semisynthetic opioids, and methadone.
Definitions
Drug poisoning (overdose) deaths: Includes deaths resulting from unintentional or intentional overdose of a drug, being given the wrong drug, taking a drug in error, or taking a drug inadvertently.
Natural and semisynthetic opioids: Includes drugs such as morphine, codeine, hydrocodone, and oxycodone.
Psychostimulants with abuse potential: Includes drugs such as methamphetamine, amphetamine, and methylphenidate.
Synthetic opioids other than methadone: Includes drugs such as fentanyl, fentanyl analogs, and tramadol.
Data source and methods
Estimates are based on the National Vital Statistics System multiple cause-of-death mortality files (3). Drug poisoning (overdose) deaths were defined as having an International Classification of Diseases, 10th Revision underlying cause-of-death code of X40–X44 (unintentional), X60–X64 (suicide), X85 (homicide), or Y10–Y14 (undetermined intent). Of the drug overdose deaths in 2022, 92.3% were unintentional, 4.5% were suicides, 3.0% were of undetermined intent, and less than 1.0% were homicides. The type of drug(s) involved was indicated by International Classification of Diseases, 10th Revision multiple cause-of-death codes: T40.1 (heroin), T40.2 (natural and semisynthetic opioids), T40.3 (methadone), T40.4 (synthetic opioids other than methadone), T40.5 (cocaine), and T43.6 (psychostimulants with abuse potential).
Age-adjusted death rates were calculated using the direct method and adjusted to the 2000 U.S. standard population (5). Population estimates for 2021 and 2022 were estimated as of July 1, based on the Blended Base produced by the U.S. Census Bureau instead of the April 1, 2020, decennial population count. The Blended Base consists of the blend of Vintage 2020 postcensal population estimates based on the 2010 population census, 2020 Demographic Analysis Estimates, and the 2020 Census PL 94-171 Redistricting File (see https://www2.census.gov/programs-surveys/popest/technical-documentation/methodology/2020-2021/methods-statement-v2021.pdf). Population data are July 1 intercensal census estimates.
Race and Hispanic origin were categorized based on the 1997 Office of Management and Budget standards for federal statistical and administrative reporting (6). All of the race categories are “single race,” meaning that only one race was reported on the death certificate. Data shown for the Hispanic population include people of any race. Death rates for Asian, American Indian and Alaska Native, and Hispanic people are affected by misclassification of race and Hispanic origin on death certificates (7). This misclassification results in underestimation of death rates for these groups by about 3% for Asian and Hispanic people and by about 34% for American Indian and Alaska Native people (8). Misclassification for Native Hawaiian or Other Pacific Islander people has not been evaluated. The extent of misclassification has not been evaluated by cause of death for all race and Hispanic-origin groups. As a result, rates of drug overdose deaths presented in this report are not adjusted for race and Hispanic-origin misclassification on death certificates.
Trends in age-adjusted death rates were evaluated using the Joinpoint Regression Program (Version 4.9.0.0) (9). Joinpoint software fitted weighted least-squares regression models to the rates on the log-transform scale. The permutation tests for model (number of joinpoints) significance were set at an overall alpha level of 0.05 (9,10). Pairwise comparisons of rates (for example, age-adjusted rates for males compared with females and year-to-year comparisons) were conducted using the z test with an alpha level of 0.05 (10).
Several factors related to death investigation and reporting may affect measurement of death rates involving specific drugs. At autopsy, the substances tested for and the circumstances under which the toxicology tests are performed vary by jurisdiction. This variability is more likely to affect substance-specific death rates than the overall drug overdose death rate. The percentage of drug overdose deaths that identified the specific drugs involved varied by year, ranging from 75% to 79% from 2002 to 2013, and increasing from 81% in 2014 to 96% in 2022. Additionally, drug overdose deaths may involve multiple drugs; therefore, a death might be included in more than one category when describing the rate of drug overdose deaths involving specific drugs. For example, a death that involved both fentanyl and cocaine would be included in both the rate of drug overdose deaths involving synthetic opioids other than methadone and the rate of drug overdose deaths involving cocaine.
About the authors
The authors are with the National Center for Health Statistics: Merianne Rose Spencer and Matthew F. Garnett are with the Division of Analysis and Epidemiology, and Arialdi M. Miniño is with the Division of Vital Statistics.
References
- Spencer MR, Miniño AM, Warner M. Drug overdose deaths in the United States, 2001–2021. NCHS Data Brief, no 457. Hyattsville, MD: National Center for Health Statistics. 2022. DOI: https://dx.doi.org/10.15620/cdc:122556.
- National Center for Injury Prevention and Control. WISQARS—Web-based Injury Statistics Query and Reporting System. 2023.
- National Center for Health Statistics. Mortality multiple cause files. 2020.
- Spencer MR, Miniño AM, Garnett MF. Co-involvement of opioids in drug overdose deaths involving cocaine and psychostimulants, 2011–2021. NCHS Data Brief, no 474. Hyattsville, MD: National Center for Health Statistics. 2023. DOI: https://dx.doi.org/10.15620/cdc:129733.
- Kochanek KD, Murphy SL, Xu JQ, Arias E. Deaths: Final data for 2020. National Vital Statistics Reports; vol 72 no 10. Hyattsville, MD: National Center for Health Statistics. 2023. DOI: https://dx.doi.org/10.15620/cdc:131355.
- Office of Management and Budget. Revisions to the standards for the classification of federal data on race and ethnicity. Fed Regist 62(210):58782–90. 1997.
- Arias E, Heron M, Hakes JK.The validity of race and Hispanic-origin reporting on death certificates in the United States: An update. National Center for Health Statistics. Vital Health Stat 2(172). 2016.
- Arias E, Xu JQ, Curtin S, Bastian B, Tejada-Vera B. Mortality profile of the non-Hispanic American Indian or Alaska Native population, 2019. National Vital Statistics Reports; vol 70 no 12. Hyattsville, MD: National Center for Health Statistics. 2021. DOI: https://dx.doi.org/10.15620/cdc:110370.
- National Cancer Institute. Joinpoint Regression Program (Version 4.9.0.0) [computer software]. 2021.
- Ingram DD, Malec DJ, Makuc DM, Kruszon-Moran D, Gindi RM, Albert M, et al. National Center for Health Statistics guidelines for analysis of trends. National Center for Health Statistics. Vital Health Stat 2(179). 2018.
Suggested citation
Spencer MR, Garnett MF, Miniño AM. Drug overdose deaths in the United States, 2002–2022. NCHS Data Brief, no 491. Hyattsville, MD: National Center for Health Statistics. 2024. DOI: https://dx.doi.org/10.15620/cdc:135849
Copyright information
All material appearing in this report is in the public domain and may be reproduced or copied without permission; citation as to source, however, is appreciated.
National Center for Health Statistics
Brian C. Moyer, Ph.D., Director
Amy M. Branum, Ph.D., Associate Director for Science
Division of Analysis and Epidemiology
Irma E. Arispe, Ph.D., Director
Kimberly A. Lochner, Sc.D., Associate Director for Science
Division of Vital Statistics
Paul D. Sutton, Ph.D., Acting Director
Andrés A. Berruti, Ph.D., M.A., Associate Director for Science