Trends in Cesarean Delivery in Puerto Rico, 2018–2022
- Key findings
- Cesarean delivery increased from 2018 to 2022, reaching more than one-half in 2022.
- Cesarean delivery increased for each maternal age group younger than 40 from 2018 to 2022.
- Cesarean delivery increased for most gestational age groups from 2018 to 2022.
- Cesarean delivery increased in three of the six largest municipalities from 2018 to 2022.
- Summary
Data from the National Vital Statistics System
- The cesarean delivery rate in Puerto Rico ranged from 46.3% to 48.4% from 2010 to 2018, then increased each year from 2019 to 2022, rising to 50.5% of all births in 2022.
- From 2018 to 2022, cesarean delivery rates increased for each age group younger than 40, with the largest increase among mothers younger than age 20 (from 37.0% to 42.3%).
- Cesarean delivery rates increased for births delivered late preterm, early term, and full term from 2018 to 2022.
- Cesarean delivery rates increased in three of the six largest municipalities from 2018 to 2022.
Cesarean delivery is major surgery associated with higher costs and adverse outcomes, such as surgical complications, compared with vaginal delivery (1–3). The cesarean delivery rate in Puerto Rico rose from just over 30% in the early to mid-1990s to over 40% by the early 2000s (4,5). During this time, cesarean delivery rates in Puerto Rico were 40%–70% higher than rates in the U.S. mainland and up to 78% higher than rates for Hispanic women in the U.S. mainland (4,5). This report describes trends in Puerto Rico’s cesarean delivery rate from 2010 to 2022 and explores changes by maternal age, gestational age, and municipality from 2018 to 2022.
Keywords: method of delivery, gestational age, municipality of occurrence, National Vital Statistics System
Cesarean delivery increased from 2018 to 2022, reaching more than one-half in 2022.
- Between 2010 and 2018, the cesarean delivery rate in Puerto Rico was relatively stable, ranging from 48.8% (2013) to 46.3% (2016 and 2018) (Figure 1).
- From 2019 to 2022, the cesarean delivery rate increased an average of 2.5% per year, rising 9% from 2018 to 2022 (50.5%).
Figure 1. Cesarean delivery rate: Puerto Rico, 2010–2022
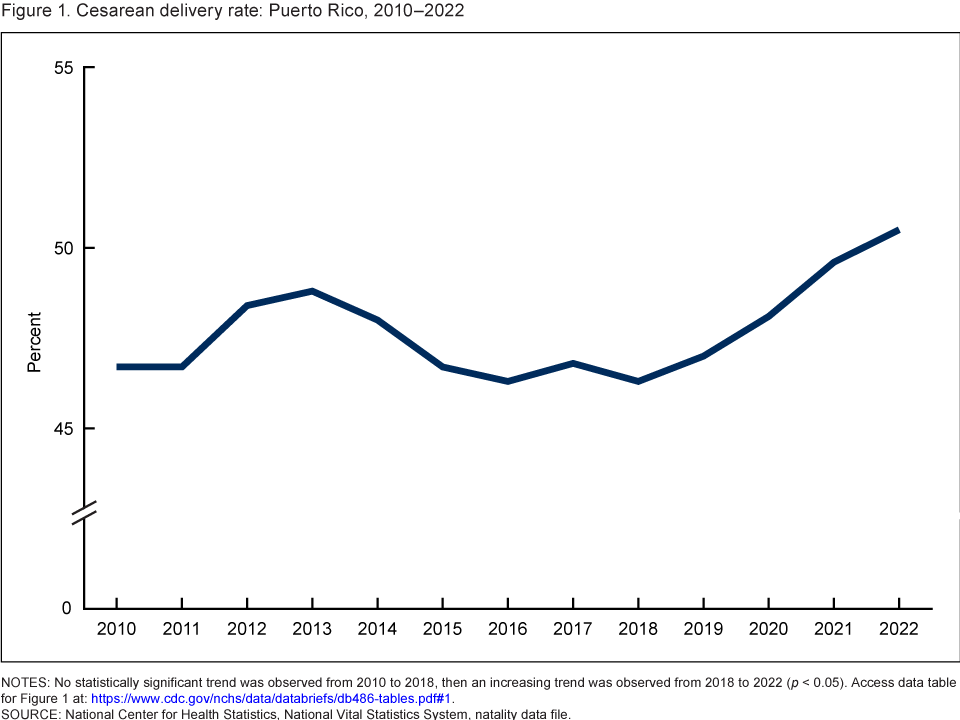
NOTES: No statistically significant trend was observed from 2010 to 2018, then an increasing trend was observed from 2018 to 2022 (p < 0.05). Access data table for Figure 1.
SOURCE: National Center for Health Statistics, National Vital Statistics System, natality data file.
Cesarean delivery increased for each maternal age group younger than 40 from 2018 to 2022.
- Cesarean delivery rates increased between 5% and 14% for maternal age groups younger than age 40 between 2018 and 2022 (Figure 2).
- The largest increases were for mothers younger than age 25, including increases of 14% for mothers younger than age 20 (from 37.0% to 42.3%) and 10% for mothers ages 20–24 (42.2% to 46.3%).
- In 2022, 64.5% of births to mothers age 40 and older were delivered by cesarean compared with 60.6% in 2018; however, this difference was not significant.
Figure 2. Cesarean delivery rate, by maternal age group: Puerto Rico, 2018 and 2022
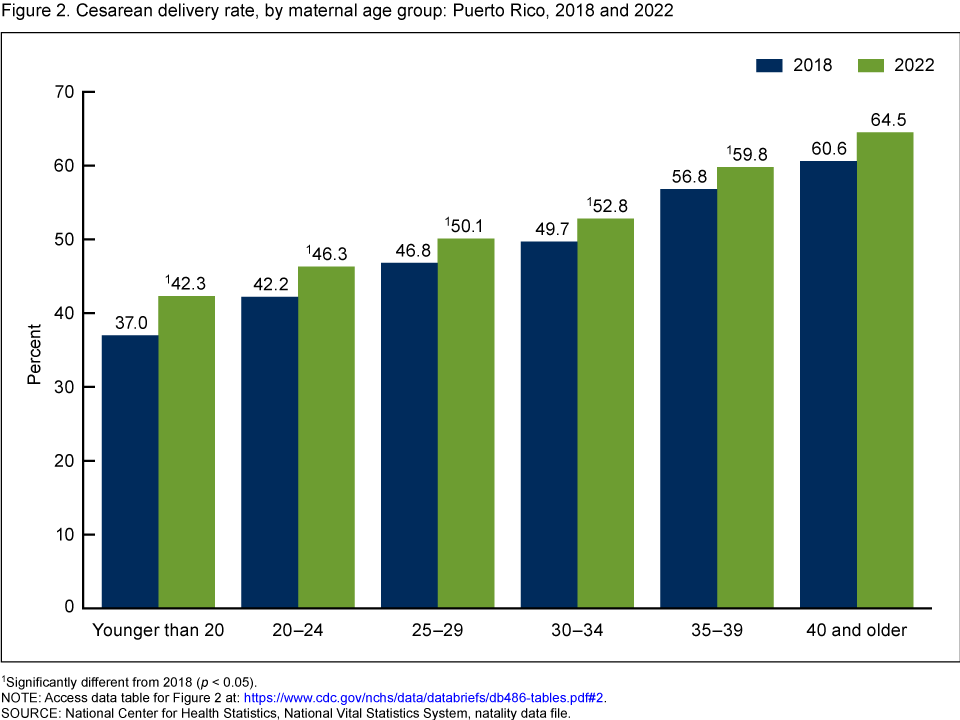
1Significantly different from 2018 (p < 0.05).
NOTE: Access data table for Figure 2.
SOURCE: National Center for Health Statistics, National Vital Statistics System, natality data file.
Cesarean delivery increased for most gestational age groups from 2018 to 2022.
- Between 2018 and 2022, cesarean delivery rates increased between 6% and 14% for late-preterm, early-term, and full-term births (Figure 3).
- The largest increase in the cesarean delivery rate was for early-term births (14%, from 45.9% in 2018 to 52.1% in 2022), followed by late-preterm (9%, from 55.1% to 60.1%) and full-term (6%, from 44.5% to 47.0%) births.
- Increases in cesarean delivery rates for early-preterm births (60.0% to 65.3% from 2018 to 2022) and late- or post-term births (42.5% to 45.9%) were not significant.
Figure 3. Cesarean delivery rate, by gestational age: Puerto Rico, 2018 and 2022
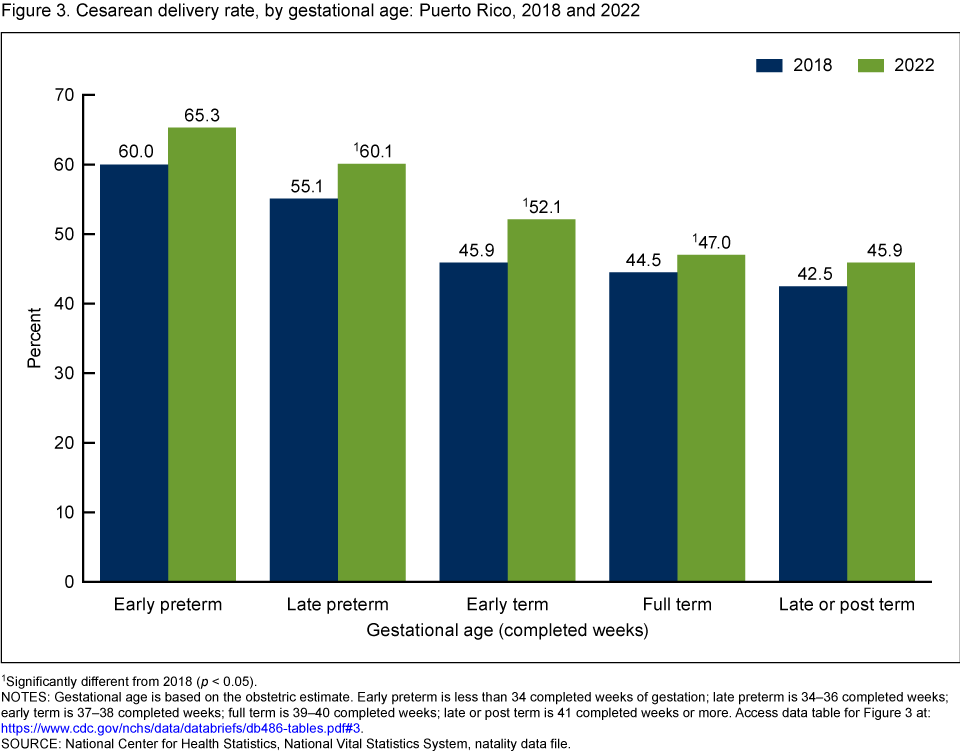
1Significantly different from 2018 (p < 0.05).
NOTES: Gestational age is based on the obstetric estimate. Early preterm is less than 34 completed weeks of gestation; late preterm is 34–36 completed weeks; early term is 37–38 completed weeks; full term is 39–40 completed weeks; late or post term is 41 completed weeks or more. Access data table for Figure 3.
SOURCE: National Center for Health Statistics, National Vital Statistics System, natality data file.
Cesarean delivery increased in three of the six largest municipalities from 2018 to 2022.
- Cesarean delivery rates increased between 12% and 16% in three of the six municipalities with at least 1,000 births from 2018 to 2022 (Figure 4).
- The largest increase in the cesarean delivery rate occurred in Ponce (16%, from 39.7% to 46.1%), followed by San Juan (15%, from 43.0% to 49.4%) and Bayamón (12%, from 57.1% to 63.9%).
- Changes in Manatí (53.2% to 54.5%), Caguas (60.1% to 61.9%), and Mayagüez (46.2% to 45.4%) were not significant.
Figure 4. Cesarean delivery rate, by municipality of occurrence: Puerto Rico, 2018 and 2022
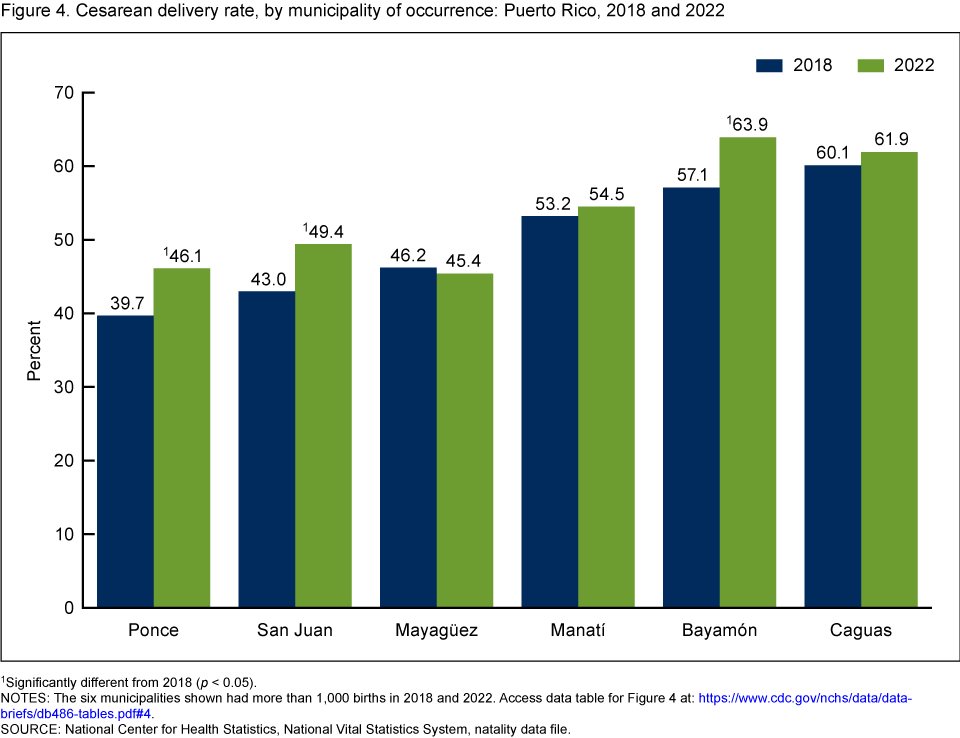
1Significantly different from 2018 (p < 0.05).
NOTES: The six municipalities shown had more than 1,000 births in 2018 and 2022. Access data table for Figure 4.
SOURCE: National Center for Health Statistics, National Vital Statistics System, natality data file
Summary
After remaining relatively stable between 46.3% and 48.8% from 2010 to 2018, the cesarean delivery rate in Puerto Rico increased every year from 2019 to 2022, reaching a high of about 50% of all births in 2022. In comparison, the cesarean delivery rate for the U.S. mainland varied only slightly at around 32% from 2019 to 2022 (6,7).
From 2018 to 2022, rates of cesarean delivery increased for mothers in all age groups younger than age 40 and for late-preterm, early-term, and full-term births. Among the six municipalities with the largest number of births in Puerto Rico, cesarean delivery increased in Ponce, San Juan, and Bayamón by 12%–16%. In 2022, nearly two out of every three births to mothers age 40 and older, early-preterm births, and births occurring in Bayamón and Caguas were delivered by cesarean.
Definitions
Cesarean delivery: Extraction of the infant, placenta, and membranes through an incision in the maternal abdominal and uterine walls.
Cesarean delivery rate: Number of births delivered by cesarean per 100 births.
Early preterm: Births delivered at less than 34 completed weeks of gestation based on the obstetric estimate.
Late preterm: Births delivered at 34 to 36 completed weeks of gestation based on the obstetric estimate.
Early term: Births delivered at 37 to 38 completed weeks of gestation based on the obstetric estimate.
Full term: Births delivered at 39 to 40 completed weeks of gestation based on the obstetric estimate.
Late or post term: Births delivered at 41 completed weeks or more of gestation based on the obstetric estimate.
Municipality: Geographical (administrative) area in the Commonwealth of Puerto Rico made up of towns and cities.
Data source and methods
This report uses data from the National Vital Statistics System natality data file. The file is based on information from birth certificates and includes information for all births to residents of Puerto Rico occurring in Puerto Rico; 19,112 births occurred in 2022 (8). Analysis by municipality was limited to the 6 municipalities (out of 78) that had more than 1,000 births in both 2018 and 2020. Approximately 79% of births occurred in these six municipalities in both years.
Differences between 2018 and 2022 noted in the text are statistically significant at the 0.05 level unless otherwise noted, based on a pairwise comparison that was assessed using a two-tailed z test. Long-term trends were evaluated using the Joinpoint Regression Program (9).
About the authors
Michelle J.K. Osterman is with the National Center for Health Statistics, Division of Vital Statistics. Maria M. Juiz Gallego is with the Puerto Rico Department of Health Demographic Registry, Quality and Vitals Statistics Division.
References
- Yank Q, Wen SW, Oppenheimer L, Chen XK, Black D, Gao J, Walker MC. Association of caesarean delivery for first birth with placenta praevia and placental abruption in second pregnancy. BJOG 114(5):609–13. 2007.
- Kuklina EV, Meikle SF, Jamieson DJ, Whiteman MK, Barfield WD, Hills SD, Posner SF. Severe obstetric morbidity in the United States: 1998–2005. Obstet Gynecol 113(2 Part 1):293–9. 2009.
- Liston FA, Allen VM, O’Connell CM, Jangaard KA. Neonatal outcomes with cesarean delivery at term. Arch Dis Child Fetal Neonatal Ed 93(3):F176–82. 2008.
- Centers for Disease Control and Prevention. Rates of cesarean delivery among Puerto Rican women—Puerto Rico and the U.S. mainland, 1992–2002. MMWR Morb Mortal Wkly Rep 55(3):68–71. 2006.
- National Center for Health Statistics. Birth data files.
- Osterman MJK, Hamilton BE, Martin JA, Driscoll AK, Valenzuela CP. Births: Final data for 2021. National Vital Statistics Reports; vol 72, no 1. Hyattsville, MD: National Center for Health Statistics. 2023. DOI: https://dx.doi.org/10.15620/cdc:122047.
- Martin JA, Hamilton BE, Osterman MJK. Births in the United States, 2022. NCHS Data Brief, no 477. Hyattsville, MD: National Center for Health Statistics. 2023. DOI: https://dx.doi.org/10.15620/cdc:131354.
- National Center for Health Statistics. User guide to the 2020 natality public use file. 2022.
- National Cancer Institute. Joinpoint Regression Program (Version 4.8.0.0.) [computer software]. 2020.
Suggested citation
Osterman MJK, Juiz Gallego MM. Trends in cesarean delivery in Puerto Rico, 2018–2022. NCHS Data Brief, no 486. Hyattsville, MD: National Center for Health Statistics. 2024. DOI: https://dx.doi.org/10.15620/cdc:134515.
Copyright information
All material appearing in this report is in the public domain and may be reproduced or copied without permission; citation as to source, however, is appreciated.
National Center for Health Statistics
Brian C. Moyer, Ph.D., Director
Amy M. Branum, Ph.D., Associate Director for Science
Division of Vital Statistics
Paul D. Sutton, Ph.D., Acting Director
Andrés A. Berruti, Ph.D., M.A., Associate Director for Science