Births in the United States, 2021
NCHS Data Brief No. 442, August 2022
PDF Version (141 KB)
- Key findings
- The number of births and the GFR increased from 2020 to 2021.
- Birth rates from 2020 to 2021 declined for females aged 15–24 and rose for women aged 25–44.
- Vaginal birth after cesarean delivery increased by 2% in the United States in 2021.
- The preterm birth rate rose between 2020 and 2021.
- Summary
Data from the National Vital Statistics System
- The number of births in the United States rose 1% from 2020 to 2021, following a decline of 4% from 2019 to 2020.
- The general fertility rate, which declined 4% from 2019 to 2020, also rose 1%, from 55.7 births per 1,000 females aged 15–44 in 2020 to 56.3 in 2021.
- Following declines in birth rates for most age groups from 2019 to 2020, birth rates declined for age groups 15–19 and 20–24 and rose for age groups 25–29, 30–34, 35–39, and 40–44 between 2020 and 2021.
- The rate of vaginal birth after cesarean delivery increased 2% from 2020 to 2021 to 14.2%.
- The preterm birth rate rose 4% in 2021 to 10.49%, following a decline of 1% from 2019 to 2020.
This report presents selected highlights from 2021 final birth data on key demographic, healthcare use, and infant health indicators. The number of births, general fertility rates (GFRs) (births per 1,000 females aged 15–44), age-specific birth rates (births per 1,000 females in specified age group), vaginal birth after cesarean (VBAC) delivery rates, and preterm (less than 37 weeks of gestation) birth rates are presented. Results for 2019, 2020, and 2021 are shown for all births to provide context for changes in birth patterns noted during 2020, the first year of the COVID-19 pandemic (1,2). VBAC and preterm birth rates are shown for the three largest race and Hispanic-origin groups: non-Hispanic White, non-Hispanic Black, and Hispanic.
Keywords: general fertility rate, vaginal birth following previous cesarean, gestational age, National Vital Statistics System
The number of births and the GFR increased from 2020 to 2021.
- In 2021, 3,664,292 births were registered in the United States, an increase of 1% from 2020 (3,613,647) (Figure 1).
- The increase in births in 2021 followed a 4% decrease in births from 2019 to 2020. The number of births in 2021 was lower than the number in 2019 (3,747,540).
- The GFR for the United States increased 1% in 2021 to 56.3 per 1,000 females aged 15–44 from 55.7 in 2020.
- As with the number of births, the 2021 increase in the GFR followed a 4% decrease in the rate from 2019 to 2020. The 2021 GFR was lower than in 2019 (58.3).
Figure 1. Number of live births and general fertility rates: United States, 2019–2021
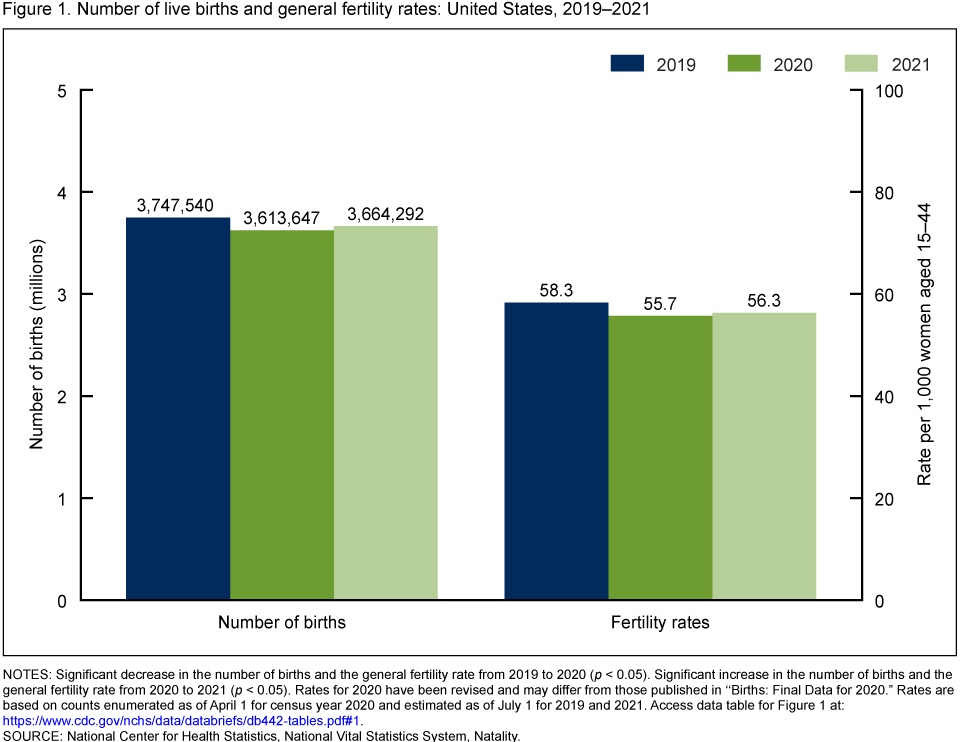
NOTES: Significant decrease in the number of births and the general fertility rate from 2019 to 2020 (p < 0.05). Significant increase in the number of births and the general fertility rate from 2020 to 2021 (p < 0.05). Rates for 2020 have been revised and may differ from those published in ‘‘Births: Final Data for 2020.” Rates are based on counts enumerated as of April 1 for census year 2020 and estimated as of July 1 for 2019 and 2021. Access data table for Figure 1.
SOURCE: National Center for Health Statistics, National Vital Statistics System, Natality.
Birth rates from 2020 to 2021 declined for females aged 15–24 and rose for women aged 25–44.
- The birth rate for teenagers aged 15–19 declined 7% from 2020 to 2021 (15.0 to 13.9 per 1,000 births); this rate declined by 10% from 2019 to 2020 (Figure 2).
- The birth rate for women aged 20–24 declined 3% from 63.3 in 2020 to 61.5 in 2021, following a decline of 5% from 2019 to 2020. The birth rate for women aged 25–29 rose 2% in 2021 to 93.0 from 90.9 in 2020, following a decline of 3% from 2019 to 2020.
- In 2021, birth rates for women aged 30–34 rose 3% to 97.6 from 94.9 in 2020, and the rate for women aged 35–39 rose 5% to 53.7 from 51.3. Rates for women in both age groups declined 3% from 2019 to 2020.
- The birth rate for women aged 40–44 rose 2% in 2021 from 11.8 to 12.0; the rate declined 2% from 2019 to 2020.
Figure 2. Selected age-specific birth rates: United States, 2019–2021
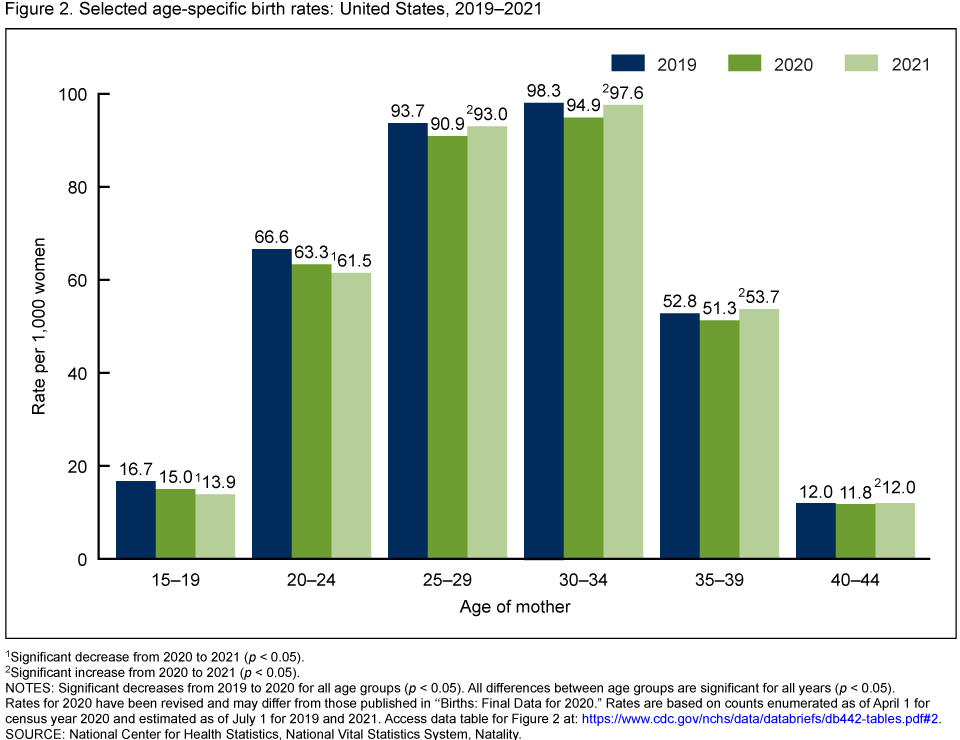
1Significant decrease from 2020 to 2021 (p < 0.05).
2Significant increase from 2020 to 2021 (p < 0.05).
NOTES: Significant decreases from 2019 to 2020 for all age groups (p < 0.05). All differences between age groups are significant for all years (p < 0.05). Rates for 2020 have been revised and may differ from those published in “Births: Final Data for 2020.” Rates are based on counts enumerated as of April 1 for census year 2020 and estimated as of July 1 for 2019 and 2021. Access data table for Figure 2.
SOURCE: National Center for Health Statistics, National Vital Statistics System, Natality.
Vaginal birth after cesarean delivery increased by 2% in the United States in 2021.
- The VBAC rate increased 2% in 2021 to 14.2% of women with a previous cesarean delivery from 13.9% in 2020; this follows a 1% increase from 2019 (13.8%) to 2020 (Figure 3).
- For non-Hispanic White women, the VBAC rate increased 3% in 2021 from 14.0% in 2020 to 14.4% in 2021; the increase from 2019 (13.9%) to 2020 was not significant.
- The VBAC rate for non-Hispanic Black women did not change significantly from 2020 (13.7) to 2021 (13.8), or from 2019 (13.6) to 2020.
- The VBAC rate was stable among Hispanic women from 2020 (13.4%) to 2021 (13.5%), following a 3% increase from 2019 (13.1%) to 2020.
Figure 3. Vaginal births after cesarean delivery, by race and Hispanic origin of mother: United States, 2019–2021

1Significant increase from 2019 to 2020 (p < 0.05).
2Significant increase from 2020 to 2021 (p < 0.05).
NOTES: All differences between race and Hispanic-origin groups are significant for all years (p < 0.05). The vaginal birth after cesarean delivery rate is the number of births to women having a vaginal delivery per 100 births to women with a previous cesarean delivery. Access data table for Figure 3.
SOURCE: National Center for Health Statistics, National Vital Statistics System, Natality.
The preterm birth rate rose between 2020 and 2021.
- The percentage of newborns delivered preterm rose 4% in 2021, from 10.09% in 2020 to 10.49% of all births. This increase follows a 1% decline in preterm births from 2019 to 2020 (10.23% to 10.09%) (Figure 4).
- The preterm rate for non-Hispanic White mothers also rose 4% in 2021 to 9.50% from 9.10% in 2020. The preterm rate declined 2% for this group from 2019 (9.26%) to 2020.
- The rate of preterm births among non-Hispanic Black mothers rose 3% in 2021 to 14.75% from 14.36% in 2020. The rate did not change significantly from 2019 (14.39%) to 2020.
- The preterm rate for births to Hispanic mothers rose 4% in 2021, to 10.23%, and had declined 1% from 2019 (9.97%) to 2020 (9.84%).
Figure 4. Percentage of preterm births, by race and Hispanic origin of mother: United States, 2019–2021
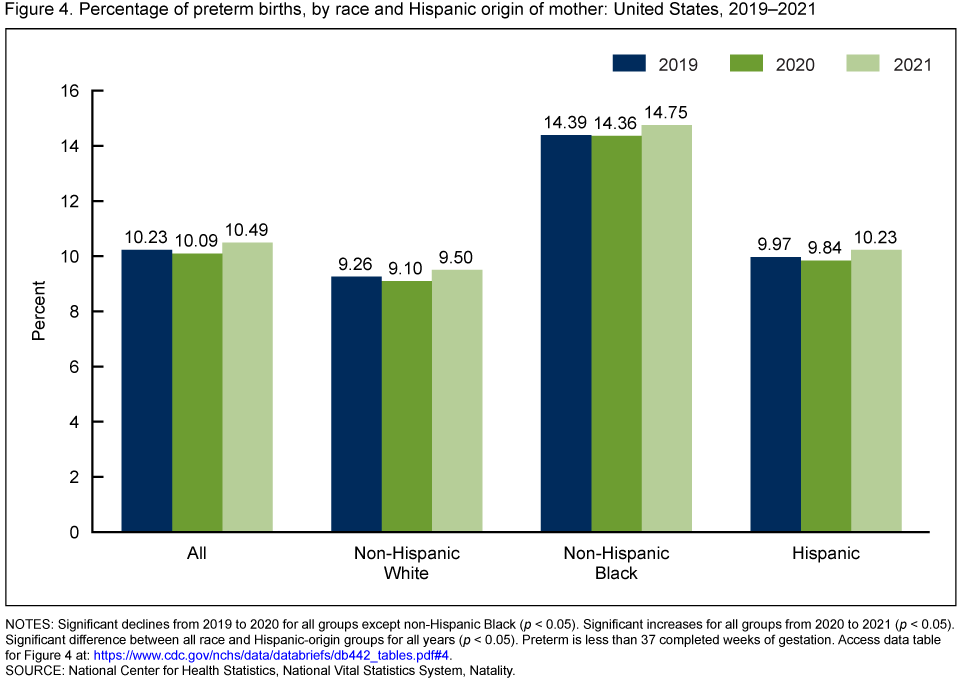
NOTES: Significant declines from 2019 to 2020 for all groups except non-Hispanic Black (p < 0.05). Significant increases for all groups from 2020 to 2021 (p < 0.05). Significant difference between all race and Hispanic-origin groups for all years (p < 0.05). Preterm is less than 37 completed weeks of gestation. Access data table for Figure 4.
SOURCE: National Center for Health Statistics, National Vital Statistics System, Natality.
Summary
United States birth certificate data for 2021 show shifts in some childbearing and perinatal health indicators from the changes observed between 2019 and 2020, the first year of the COVID-19 pandemic. Following declines of 4% from 2019 to 2020, the number of births and the GFR each rose 1% in 2021. From 2014 to 2019, the number of births and the GFR showed average annual declines of 1% and 2%, respectively (2). Age-specific birth rates declined from 2020 to 2021 for females aged 15–24 and rose for women aged 25–44, compared with declines in rates for all females aged 15–44 from 2019 to 2020.
The VBAC rate, which has increased every year since national data became available in 2016 (2), continued to rise in 2021 (up 2%), with most of the increase occurring among non-Hispanic White women. Following a 1% decline from 2019 to 2020, the preterm birth rate rose 4% in 2021 to the highest level reported in at least 14 years (10.49%) (2,3); increases for 2021 were seen for the three largest race and Hispanic-origin groups.
Provisional birth data for the first quarter of 2022 suggest a continuation of the 2020–2021 trends for each of these natality indicators: continued increases in the number of births and the GFR, continued declines in birth rates for females under age 25, and increases in rates for older mothers and in VBAC and preterm birth rates (4,5).
Definitions
General fertility rate (GFR): Number of births per 1,000 females aged 15–44.
Age-specific birth rates: Births per 1,000 females in the specified age group.
Preterm birth rate: Births delivered prior to 37 completed weeks of gestation per 100 births. Gestational age is based on the obstetric estimate of gestation.
Vaginal birth after cesarean (VBAC) delivery rate: Number of births to females having a vaginal delivery per 100 births to females with a previous cesarean delivery.
Data sources and methods
This report uses data from the Natality Data File from the National Vital Statistics System. The vital statistics natality file is based on information from birth certificates and includes information for all births occurring in the United States. This Data Brief accompanies the release of the 2021 natality public use file (6). More detailed analysis of the topics presented in this report plus many others such as births by age of mother; tobacco use during pregnancy; pregnancy risk factors; prenatal care timing and use; receipt of food from the Special Supplemental Nutrition Program for Women, Infants, and Children (WIC); maternal body mass index; and breastfeeding; is possible using the annual natality files (6).
References to increases or decreases in rates or percentages indicate that differences are statistically significant at the 0.05 level based on a two-tailed z test. Computations exclude records for which information is unknown.
Rates for 2020 have been revised and may differ from those published in “Births: Final Data for 2020” (2). The rates for 2020 are based on counts enumerated as of April 1 for census year 2020 (7). Rates for 2019 and 2021 are based on population estimates as of July 1; the population estimate for 2021 is based on the 2020 census as of July 1, 2021 (7).
About the authors
Joyce A. Martin, Brady E. Hamilton, and Michelle J.K. Osterman are with the National Center for Health Statistics, Division of Vital Statistics.
References
-
- Hamilton BE, Osterman MJK, Martin JA. Declines in births by month: United States, 2020. Vital Statistics Rapid Release; no 14. Hyattsville, MD: National Center for Health Statistics. June 2021. DOI: https://dx.doi.org/10.15620/cdc:106116.
- Osterman MJK, Hamilton BE, Martin JA, Driscoll AK, Valenzuela CP. Births: Final data for 2020. National Vital Statistics Reports; vol 70 no 17. Hyattsville, MD: National Center for Health Statistics. 2022. DOI: https://dx.doi.org/10.15620/cdc:112078.
- Martin JA, Osterman MJK, Kirmeyer SE, Gregory ECW. Measuring gestational age in vital statistics data: Transitioning to the obstetric estimate. National Vital Statistics Reports; vol 64 no 5. Hyattsville, MD: National Center for Health Statistics. 2015.
- National Center for Health Statistics. State and national provisional counts.
- National Center for Health Statistics. Quarterly provisional estimates for selected birth indicators, 2020–Quarter 1, 2022.
- National Center for Health Statistics. Vital statistics online data portal. Birth data files.
- U.S. Census Bureau. 2021 population estimates. Annual state resident population estimates for 6 race groups (5 race alone groups and two or more races) by age, sex, and Hispanic origin: April 1, 2010, to July 1, 2021. 2022.
Suggested citation
Martin JA, Hamilton BE, Osterman MJK. Births in the United States, 2021. NCHS Data Brief, no 442. Hyattsville, MD: National Center for Health Statistics. 2022. DOI: https://dx.doi.org/10.15620/cdc:119632.
Copyright information
All material appearing in this report is in the public domain and may be reproduced or copied without permission; citation as to source, however, is appreciated.
National Center for Health Statistics
Brian C. Moyer, Ph.D., Director
Amy M. Branum, Ph.D., Associate Director for Science
Division of Vital Statistics
Steven Schwartz, Ph.D., Director
Andrés A. Berruti, Ph.D., M.A., Associate Director for Science