Osteoporosis or Low Bone Mass in Older Adults: United States, 2017–2018
NCHS Data Brief No. 405, March 2021
PDF Versionpdf icon (447 KB)
- Key findings
- In 2017–2018, low bone mass prevalence was higher among women than men.
- Trends in osteoporosis prevalence among adults aged 50 and over from 2007–2008 through 2017–2018 differed by sex.
- No significant trend was seen in the prevalence of low bone mass among adults aged 50 and over from 2007–2008 through 2017–2018.
- Summary
Data from the National Health and Nutrition Examination Survey, 2017–2018
- In 2017–2018, the age-adjusted prevalence of osteoporosis at either the femur neck or lumbar spine or both among adults aged 50 and over was 12.6% and was higher among women (19.6%) compared with men (4.4%).
- The prevalence of low bone mass, a precursor of osteoporosis, at either the femur neck or lumbar spine or both among adults aged 50 and over was 43.1% and was higher among women (51.5%) compared with men (33.5%).
- Osteoporosis prevalence increased from 2007–2008 through 2017–2018 among women but not men.
- Low bone mass prevalence did not change between 2007–2008 and 2017–2018 for either men or women.
Osteoporosis is the most common bone disease and is characterized by weakening of bone tissue, bone structure, and strength, and may lead to increased risk of fractures (1). Low bone mass increases the risk of developing osteoporosis (2).
In the United States in 2010, an estimated 10.2 million people aged 50 and over had osteoporosis and about 43.3 million more people had low bone mass (3). This report provides prevalence estimates of osteoporosis and low bone mass among adults aged 50 and over in the United States in 2017–2018.
Keywords: dual energy x-ray absorptiometry (DXA), femur, lumbar spine, National Health and Nutrition Examination Survey (NHANES)
In 2017–2018, osteoporosis prevalence was higher among women than men.
The age-adjusted prevalence of osteoporosis at either the femur neck or lumbar spine or both was 12.6% among adults aged 50 and over and was higher among adults aged 65 and over (17.7%) compared with those aged 50–64 (8.4%) (Figure 1). This pattern was similar for women (27.1% among women aged 65 and over compared with 13.1% among women aged 50–64). Among men, the observed difference by age (5.7% for 65 and over compared with 3.3% for 50–64) was not significant. Among all adults and both age groups, osteoporosis prevalence was higher among women than men.
Figure 1. Prevalence of osteoporosis among adults aged 50 and over, by sex and age: United States, 2017–2018
image icon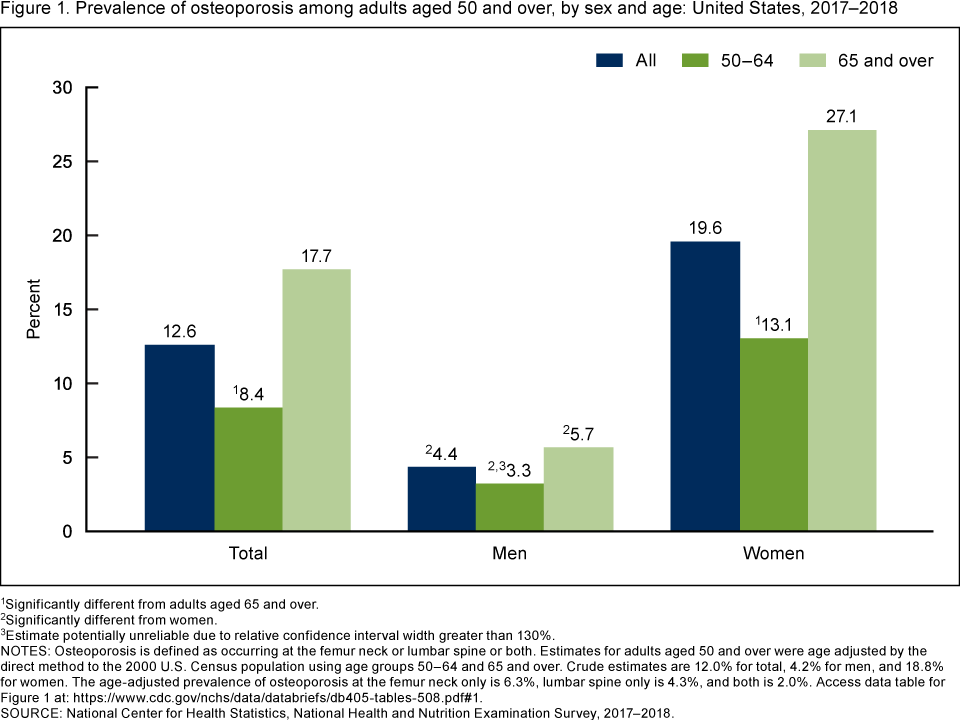
1Significantly different from adults aged 65 and over.
2Significantly different from women.
3Estimate potentially unreliable due to relative confidence interval width greater than 130%.
NOTES: Osteoporosis is defined as occurring at the femur neck or lumbar spine or both. Estimates for adults aged 50 and over were age adjusted by the direct method to the 2000 U.S. Census population using age groups 50–64 and 65 and over. Crude estimates are 12.0% for total, 4.2% for men, and 18.8% for women. The age-adjusted prevalence of osteoporosis at the femur neck only is 6.3%, lumbar spine only is 4.3%, and both is 2.0%. Access data table for Figure 1pdf icon.
SOURCE: National Center for Health Statistics, National Health and Nutrition Examination Survey, 2017–2018.
In 2017–2018, low bone mass prevalence was higher among women than men.
The age-adjusted prevalence of low bone mass at either the femur neck or lumbar spine or both was 43.1% among adults aged 50 and over and was higher among adults aged 65 and over (47.5%) than those aged 50–64 (39.3%) (Figure 2). Low bone mass prevalence was higher among men aged 65 and over (40.7%) than men aged 50–64 (27.5%). No significant difference was seen in low bone mass prevalence among women aged 50–64 (50.3%) and 65 and over (52.9%). Among all adults and both age groups, low bone mass prevalence was higher among women compared with men.
Figure 2. Prevalence of low bone mass among adults aged 50 and over, by sex and age: United States, 2017–2018
image icon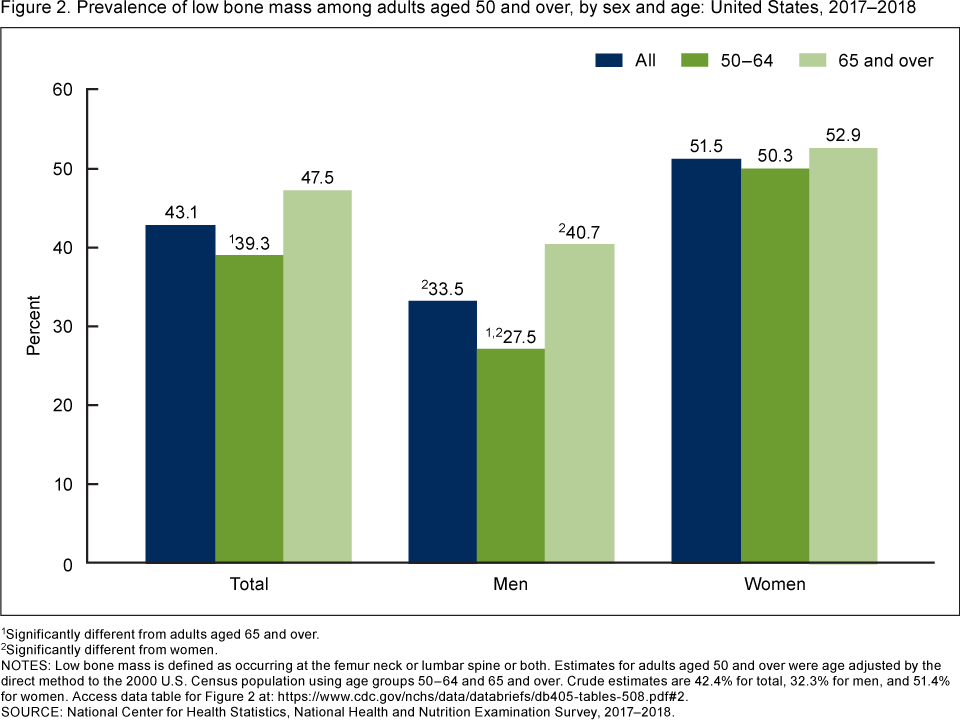
1Significantly different from adults aged 65 and over.
2Significantly different from women.
NOTES: Low bone mass is defined as occurring at the femur neck or lumbar spine or both. Estimates for adults aged 50 and over were age adjusted by the direct method to the 2000 U.S. Census population using age groups 50–64 and 65 and over. Crude estimates are 42.4% for total, 32.3% for men, and 51.4% for women. Access data table for Figure 2pdf icon.
SOURCE: National Center for Health Statistics, National Health and Nutrition Examination Survey, 2017–2018.
Trends in osteoporosis prevalence among adults aged 50 and over from 2007–2008 through 2017–2018 differed by sex.
Overall, the age-adjusted prevalence of osteoporosis among adults aged 50 and over increased from 9.4% in 2007–2008 to 12.6% in 2017–2018 (Figure 3). Osteoporosis prevalence among women increased from 14.0% in 2007–2008 to 19.6% in 2017–2018. However, osteoporosis prevalence in men did not significantly change from 2007–2008 (3.7%) to 2017–2018 (4.4%).
Figure 3. Trends in age-adjusted prevalence of osteoporosis among adults aged 50 and over, by sex: United States, 2007–2008 through 2017–2018
image icon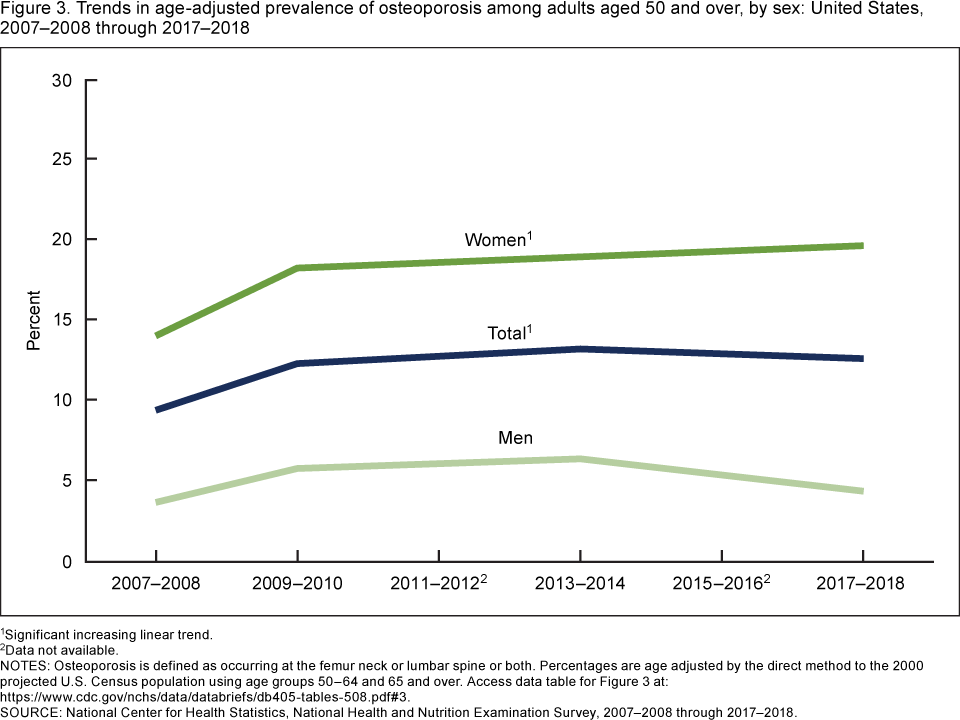
1Significant increasing linear trend.
2Data not available.
NOTES: Osteoporosis is defined as occurring at the femur neck or lumbar spine or both. Percentages are age adjusted by the direct method to the 2000 projected U.S. Census population using age groups 50–64 and 65 and over. Access data table for Figure 3pdf icon.
SOURCE: National Center for Health Statistics, National Health and Nutrition Examination Survey, 2007–2008 through 2017–2018.
No significant trend was seen in the prevalence of low bone mass among adults aged 50 and over from 2007–2008 through 2017–2018.
The age-adjusted prevalence of low bone mass among adults aged 50 and over did not significantly change between 2007–2008 (43.0%) and 2017–2018 (43.1%) overall, or for either men or women (Figure 4).
Figure 4. Trends in age-adjusted prevalence of low bone mass among adults aged 50 and over, by sex: United States, 2007–2008 through 2017–2018
image icon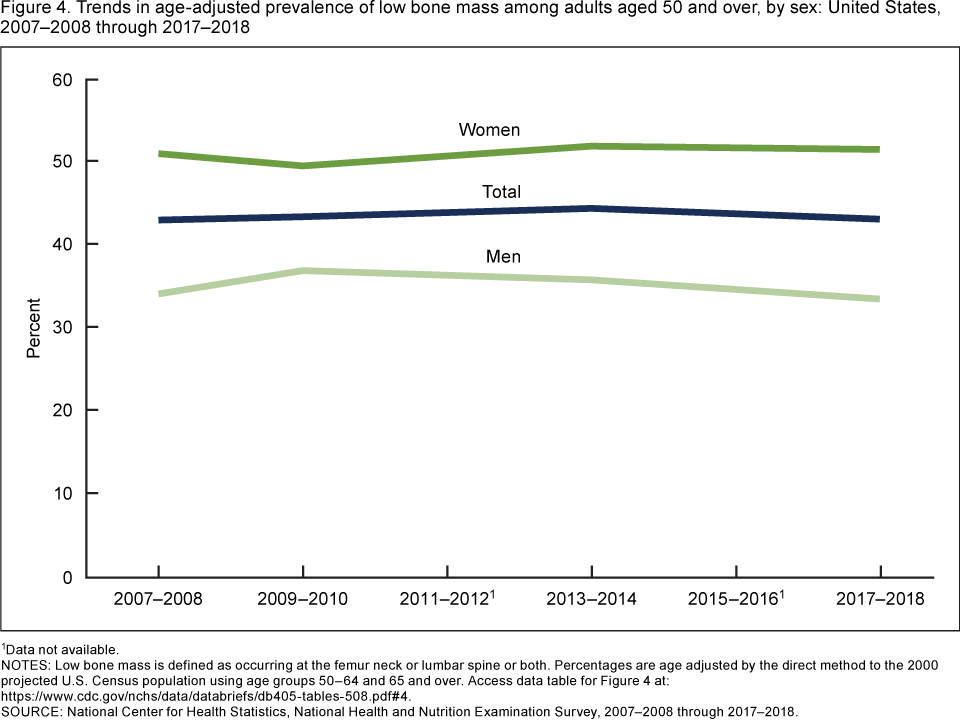
1Data not available.
NOTES: Low bone mass is defined as occurring at the femur neck or lumbar spine or both. Percentages are age adjusted by the direct method to the 2000 projected U.S. Census population using age groups 50–64 and 65 and over. Access data table for Figure 4pdf icon.
SOURCE: National Center for Health Statistics, National Health and Nutrition Examination Survey, 2007–2008 through 2017–2018.
Summary
In 2017–2018, the age-adjusted prevalence of osteoporosis at either the femur neck or lumbar spine or both among adults aged 50 and over was 12.6%, and the prevalence of low bone mass at either skeletal site was 43.1%.
Osteoporosis prevalence was higher in women than men and higher among adults aged 65 and over than adults aged 50–64.
From 2007–2008 through 2017–2018, the age-adjusted prevalence of osteoporosis in women increased from 14.0% to 19.6%, but no significant change was seen among men. No significant change was seen in low bone mass prevalence for men or women from 2007–2008 through 2017–2018.
Monitoring the prevalence of osteoporosis and low bone mass may inform public health programs that focus on reducing or preventing osteoporosis and its consequences. Healthy People 2020 has a goal of 5.3% or less for the prevalence of osteoporosis at the femur neck for adults aged 50 and over. In the United States, the prevalence of osteoporosis among adults aged 50 and over at the femur neck only was 6.3% and has not met the 2020 goal (4).
Definitions
Low bone mass: Defined by a bone mineral density (BMD) value at either the femur neck or lumbar spine or both that is between 1 and 2.5 standard deviations (SDs) below the mean BMD of a young female adult mean value (5,6). The current clinical guidelines recommend that assessment of osteoporosis and low bone mass be based on the degree of low BMD at either the femur neck region of the proximal femur (top of thigh bone where it meets the hip) or the lumbar spine (5–7).
Osteoporosis: Defined by a BMD value at either the femur neck or lumbar spine or both that is 2.5 SDs or more below the BMD of a young female adult mean value (5,6).
For both low bone mass and osteoporosis, the mean BMD and SD for femur neck were based on data for non-Hispanic white women aged 20–29 from the Third National Health and Nutrition Examination Survey (NHANES III) (8). Similarly, the mean BMD and SD for lumbar spine were based on data for non-Hispanic white women aged 30 from the Dual Energy X-ray Absorptiometry Manufacturer Reference Database (8).
Data source and methods
Data from NHANES for the years 2007–2008, 2009–2010, 2013–2014, and 2017–2018 were used for these analyses. Osteoporosis assessment in NHANES was not completed in 2011–2012 and 2015–2016. Data from NHANES 2017–2018 were used to test differences between subgroups and calculate the most recent estimates of osteoporosis and low bone mass.
NHANES is a cross-sectional survey designed to monitor the health and nutritional status of the civilian noninstitutionalized U.S. population (9). The NHANES sample is selected through a complex, multistage probability design. The sample design includes oversampling to obtain reliable estimates of health and nutritional estimates for population subgroups. The survey consists of interviews conducted in participants’ homes and standardized physical examinations conducted in mobile examination centers. Lumbar spine and femur neck BMD were measured by dual energy x-ray absorptiometry on Hologic Discovery Model A Densitometers (Hologic, Inc., Bedford, Massachusetts).
Examination sample weights, which account for the differential probabilities of selection, nonresponse, and noncoverage, were incorporated into the estimation process. All variance estimates accounted for the complex survey design by using Taylor series linearization.
Overall and sex-specific prevalence estimates were age adjusted to the 2000 projected U.S. Census population using age groups 50–64 and 65 and over to compare men and women or time periods that differ with respect to their age distributions. Differences between groups were tested using a univariate t statistic at the p < 0.05 significance level. Tests for linear trends were evaluated using orthogonal polynomials. All differences reported are statistically significant unless otherwise indicated. Data management and statistical analyses were conducted using SAS System for Windows version 9.4 (SAS Institute, Inc., Cary, N.C.), and SUDAAN version 11.0 (RTI International, Research Triangle Park, N.C.) to account for the complex sample design.
About the authors
Neda Sarafrazi and Edwina A. Wambogo are with the National Center for Health Statistics, Division of Health and Nutrition Examination Surveys. John A. Shepherd is a professor at the University of Hawaii Cancer Center.
References
- Kanis JA, Melton 3rd LJ, Christiansen C, Johnston CC, Khaltaev N. The diagnosis of osteoporosis. J Bone Miner Res 9(8):1137–41. 1994.
- Office of the Surgeon General. Bone health and osteoporosis: A report of the Surgeon General. Office of the Surgeon General (US): Rockville, MD. 2004.
- Wright NC, Looker AC, Saag KG, Curtis JR, Delzell ES, Randall S, Dawson-Hughes B. The recent prevalence of osteoporosis and low bone mass in the United States based on bone mineral density at the femoral neck or lumbar spine. J Bone Miner Res 29(11):2520–6. 2014.
- U.S. Department of Health and Human Services, Office of Disease Prevention and Health Promotion. Healthy People 2020 topics and objectives. 2010.
- Leib ES, Lewiecki EM, Binkley N, Hamdy RC, International Society for Clinical Densitometry. Official positions of the International Society for Clinical Densitometry. J Clin Densitom 7(1):1–6. 2004.
- Cosman F, de Beur SJ, LeBoff MS, Lewiecki EM, Tanner B, Randall S, et al. Clinician’s guide to prevention and treatment of osteoporosis. Osteoporos Int 25(10):2359–81. 2014.
- Watts NB, Leslie WD, Foldes AJ, Miller PD. 2013 International Society for Clinical Densitometry position development conference: Task force on normative databases. J Clin Densitom 16(4):472–81. 2013.
- Looker AC, Wahner HW, Dunn WL, Calvo MS, Harris TB, Heyse SP, et al. Updated data on proximal femur bone mineral levels of US adults. Osteoporos Int 8(5):468–89. 1998.
- Johnson CL, Dohrmann SM, Burt VL, Mohadjer LK. National Health and Nutrition Examination Survey: Sample design, 2011–2014. National Center for Health Statistics. Vital Health Stat 2(162). 2014.
Suggested citation
Sarafrazi N, Wambogo EA, Shepherd JA. Osteoporosis or low bone mass in older adults: United States, 2017–2018. NCHS Data Brief, no 405. Hyattsville, MD: National Center for Health Statistics. 2021. DOI: https://dx.doi.org/10.15620/cdc:103477external icon.
Copyright information
All material appearing in this report is in the public domain and may be reproduced or copied without permission; citation as to source, however, is appreciated.
National Center for Health Statistics
Brian C. Moyer, Ph.D., Director
Amy M. Branum, Ph.D., Acting Associate Director for Science
Division of Health and Nutrition Examination Surveys
Ryne Paulose-Ram, M.A., Ph.D., Acting Director
Namanjeet Ahluwalia, Ph.D., D.Sc., Acting Associate Director for Science