Dental Insurance for Persons Under Age 65 Years with Private Health Insurance: United States, 2008
- Key findings
- Among approximately 172 million persons under age 65 years with private health insurance, the majority of persons (73%) had some type of dental coverage. However, approximately 45 million persons had no dental coverage.
- About 8 out of 10 persons under age 65 years with employment-based private health insurance had dental coverage compared with about 3 out of 10 persons with directly purchased insurance.
- Among persons under age 65 years with private health insurance, non-Hispanic black persons were more likely to have dental insurance than non-Hispanic white persons, non-Hispanic Asian persons, or Hispanic persons.
- Among persons under age 65 years with private health insurance, as income level increased, the percentage having dental insurance increased.
- Adults with at least some college education were more likely to have dental insurance than those with less education among those aged 25-64 years with private health insurance.
- Summary
- Definitions
- Data source and methods
- About the authors
- References
- Suggested citation
NCHS Data Brief No. 40, June 2010
PDF Version (1.1 MB)
Barbara Bloom, M.P.A., and Robin A. Cohen, Ph.D.
Key findings
Data from the National Health Interview Survey, 2008
Among approximately 172 million persons under age 65 years with private health insurance:
- The majority of persons (73%) had some type of dental coverage. However, approximately 45 million persons had no dental coverage.
- About 8 out of 10 persons with employment-based private health insurance had dental coverage compared with about 3 out of 10 persons with directly purchased insurance.
- Non-Hispanic black persons were more likely to have dental insurance than non-Hispanic white persons, non-Hispanic Asian persons, or Hispanic persons.
- As income level increased, the percentage having dental insurance increased.
A primary indicator of access to dental care in the United States is dental insurance. Previous studies have shown that persons with private dental insurance have more dental visits in the previous year than persons without private dental insurance (1). There are federal and state assistance programs for dental care but they are limited. The Children’s Health Insurance Program (CHIP) requires states to provide limited dental coverage for enrolled children up to age 19 (2). The Medicaid program requires states to provide limited dental services for most Medicaid-eligible individuals under the age of 21, but there is no assistance to provide dental services to individuals aged 21 and over (3). This report analyzes dental insurance status for persons under age 65 years who have private health insurance because of the limited or nonexistent public coverage for dental care.
Keywords: National Health Interview Survey, single service, comprehensive, dental coverage
Among approximately 172 million persons under age 65 years with private health insurance, the majority of persons (73%) had some type of dental coverage. However, approximately 45 million persons had no dental coverage.
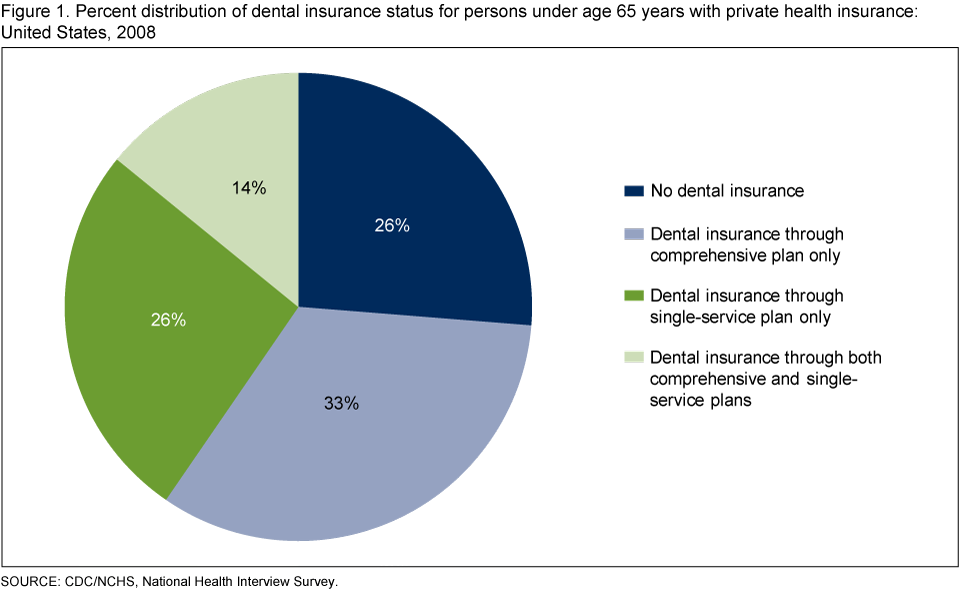
Among persons under age 65 years with private health insurance who had some type of dental insurance, about one out of two persons had dental coverage through a single-service dental plan, either alone or in addition to dental coverage through their comprehensive health insurance plan (Figure 1).
About 8 out of 10 persons under age 65 years with employment-based private health insurance had dental coverage compared with about 3 out of 10 persons with directly purchased insurance.
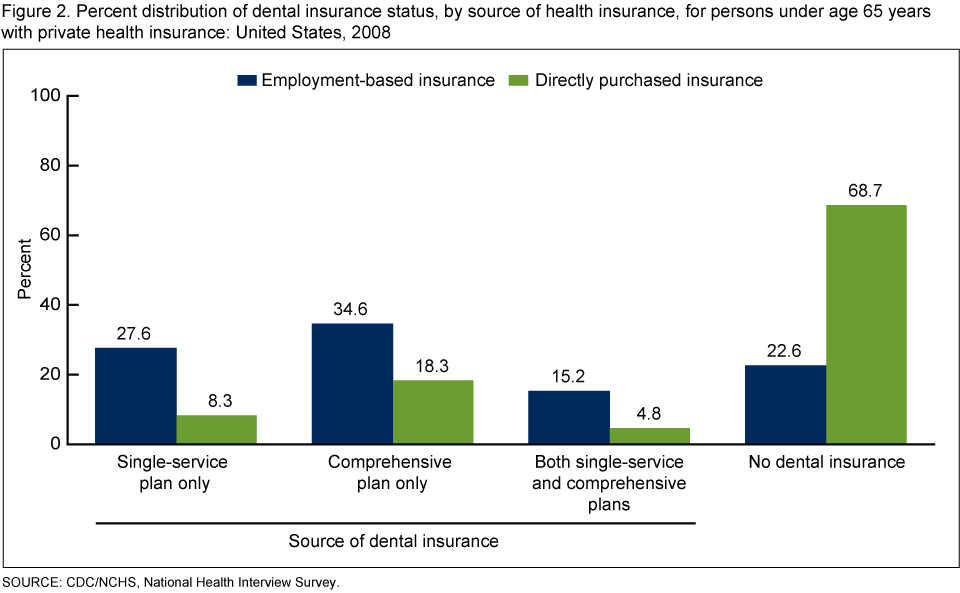
Among persons under age 65 years, persons with employment-based private health insurance were about two to three times as likely as persons with directly purchased insurance to have dental coverage through all types of plans, including a single-service dental plan only, a comprehensive plan only, or both single-service and comprehensive plans combined (Figure 2).
Among persons under age 65 years with private health insurance, non-Hispanic black persons were more likely to have dental insurance than non-Hispanic white persons, non-Hispanic Asian persons, or Hispanic persons.
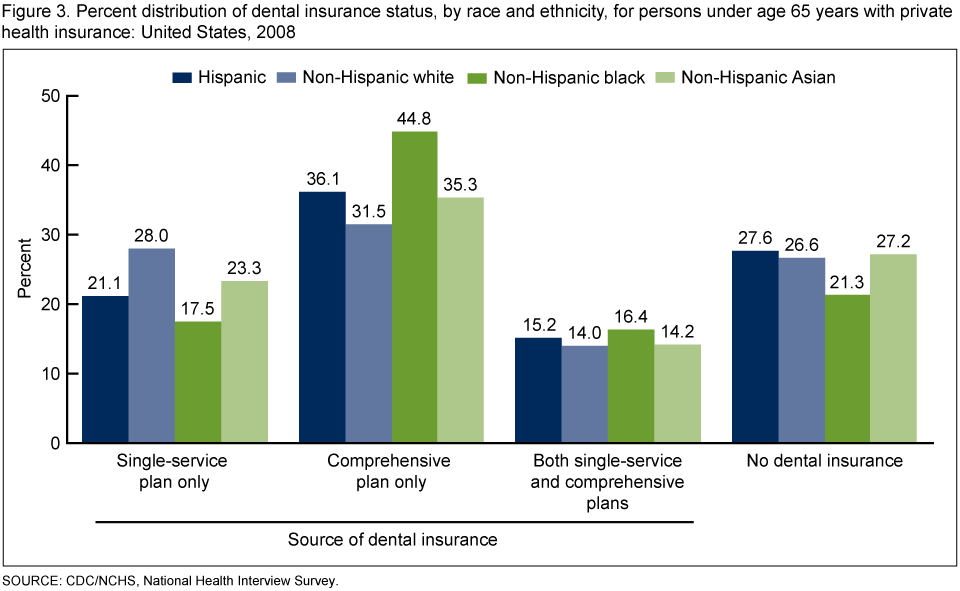
Among persons under age 65 years with private health insurance, non-Hispanic white persons were more likely than persons of other race/ethnicity groups to have dental insurance through a single-service dental plan only (Figure 3).
Non-Hispanic black persons were more likely than persons of other race/ethnicity groups to have dental insurance through a comprehensive health insurance plan only.
Among persons under age 65 years with private health insurance, as income level increased, the percentage having dental insurance increased.
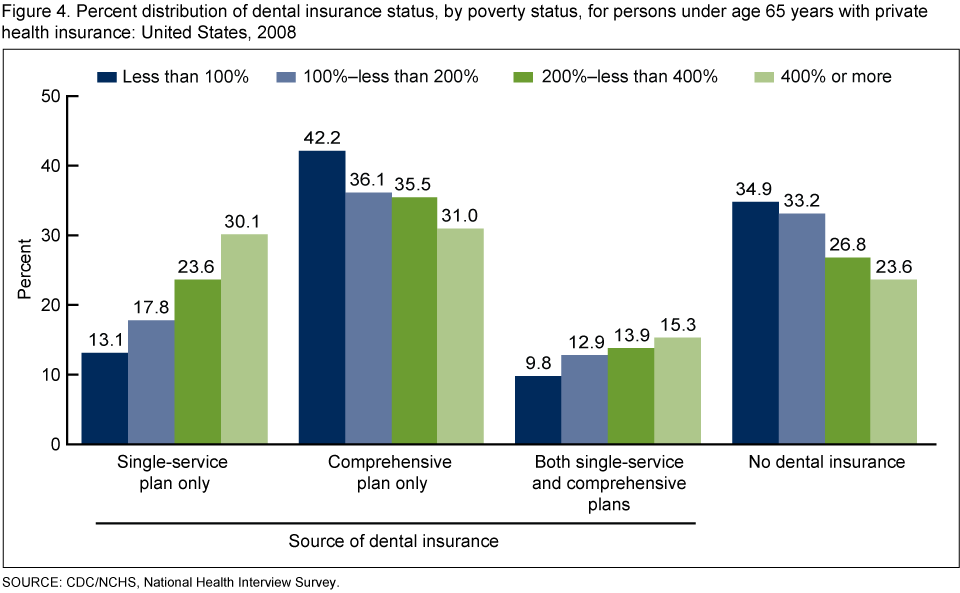
Among persons under age 65 years with private health insurance, poor persons at less than 100% of poverty level were more likely than higher income persons at 400% or more of poverty level to have dental coverage through a comprehensive plan only (Figure 4).
As income increased, the percentage having dental insurance through a single-service dental plan, either alone or in addition to a comprehensive plan, increased.
Adults with at least some college education were more likely to have dental insurance than those with less education among those aged 25-64 years with private health insurance.
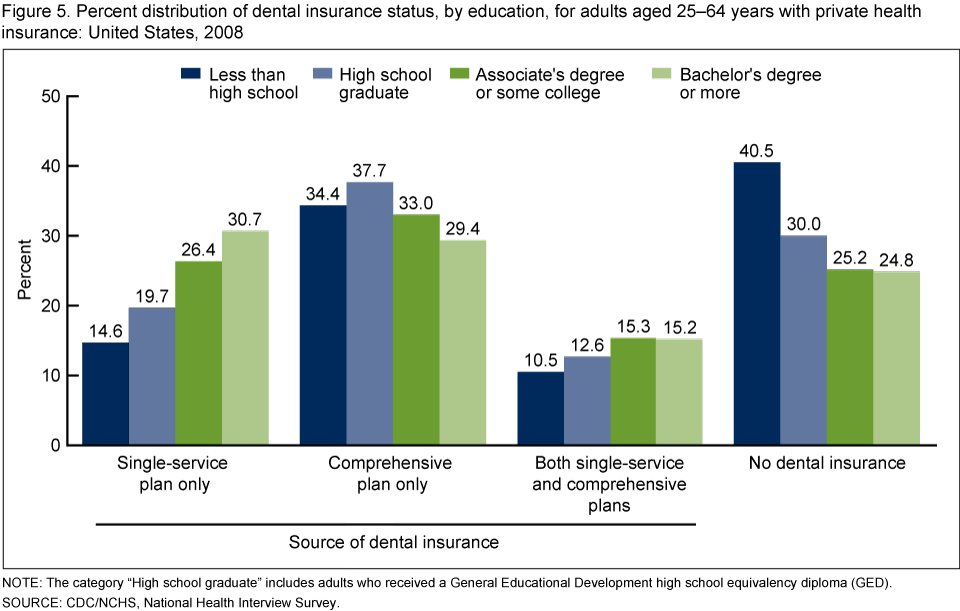
Among adults aged 25-64 years with private health insurance, as education level increased, there was an increase in the percentage of adults with dental insurance through a single-service dental plan only (Figure 5).
College graduates were less likely than adults with less education to have dental insurance through a comprehensive plan only.
Summary
About three out of four persons under age 65 years with private health insurance had some type of dental coverage. Among persons with dental insurance, more than one-half had a single-service dental plan only, or in addition to dental coverage through their comprehensive health insurance plan. Non-Hispanic white persons were more likely to have dental insurance through a single- service dental plan only than non-Hispanic black, non-Hispanic Asian, or Hispanic persons. Poor persons (less than 100% of poverty level) were more likely than higher income persons (400% or more of poverty level) to have dental coverage through a comprehensive plan only.
Approximately 45 million persons under age 65 years with private health insurance did not have dental coverage in 2008. About 7 out of 10 persons who directly purchased their own private health insurance plan had no dental coverage compared with about 2 out of 10 persons with employment-based insurance. About 40% of persons with less than a high school education had no dental insurance of any kind.
Definitions
Comprehensive plan: A health insurance plan or policy that covers a variety of medical services. These plans are designed to cover general medical expenses such as blood work or visits to a doctor’s office and health catastrophes such as heart attacks and cancer.
Comprehensive plan with dental coverage: A private health insurance plan that also has dental coverage based on a positive response to the following question: “Does [Plan name] pay for any of the costs for dental care?”
Directly purchased coverage: Private insurance that was originally obtained through direct purchase or through other means not related to employment.
Employment-based coverage: Private insurance that was originally obtained through a present or former employer, a union, or a professional association.
Poverty status or percentage of poverty level: Is based on family income, family size, and the number of children in the family, and, for families with two or fewer adults, on the age of the adults in the family. The poverty level is based on definitions originally developed by the Social Security Administration. These include a set of income thresholds that vary by family size and composition. Families or individuals with income below their appropriate thresholds are classified as below the poverty level. These thresholds are updated annually by the U.S. Census Bureau to reflect changes in the Consumer Price Index for all urban consumers (4). Estimates by poverty status are based on both reported and imputed family income. Family income information was completely missing for 9.4% of persons, and family income information was only reported in broad categories for an additional 22.0% of persons in 2008. Therefore, family income was imputed for 31.4% of persons in 2008 using the National Health Interview Survey imputed income files (5).
Private insurance: Is indicated when respondents report they were covered by private health insurance through an employer, union, or individual purchase. Private health insurance includes managed care such as health maintenance organizations (HMOs). It does not include military health plans.
Single-service dental plan: A private insurance plan that only pays for dental care.
Data source and methods
Data from the 2008 National Health Interview Survey (NHIS) were used for this analysis. NHIS is conducted continuously throughout the year by interviewers of the U.S. Census Bureau for the Centers for Disease Control and Prevention’s National Center for Health Statistics (NCHS). NHIS collects information about the health and health care of the civilian, noninstitutionalized U.S. population. Interviews are conducted in respondents’ homes, but follow-ups to complete interviews may be conducted over the telephone. Questions about health insurance coverage are asked of family respondents in the family component of the survey. In 2008, information was collected on a total of 65,495 persons under age 65 years on the family core component. For further information about NHIS, including the questionnaire, visit the NCHS website.
NHIS is designed to yield a nationally representative sample, and this analysis uses weights to produce national esti-mates. Data weighting procedures are described in more detail at the NHIS Methods website. (6) Point estimates and estimates of corresponding variances for this analysis were calculated using SUDAAN software (7) to account for the complex sample design of the NHIS. The Taylor series linearization method was chosen for variance estimation. All estimates shown in this report meet the NCHS standard of reliability (relative standard error less than or equal to 30%). Differences between percentages were evaluated using two-sided significance tests at the 0.05 level. Terms such as “higher than” and “less than” indicate statistically significant differences. Terms such as “similar” and “no difference” indicate that the statistics being compared were not significantly different. Lack of comment regarding the difference between any two statistics does not necessarily suggest that the difference was tested and found to be not significant.
About the authors
Barbara Bloom and Robin A. Cohen are with the Centers for Disease Control and Prevention’s National Center for Health Statistics, Division of Health Interview Statistics.
References
- Bloom B, Gift HC, Jack SS. Dental services and oral health: United States, 1989. National Center for Health Statistics. Vital Health Stat 10(183). 1992.
- Centers for Medicaid & Medicare Services. CHIP dental coverage, overview. Downloaded January 27, 2010.
- Centers for Medicaid & Medicare Services. Medicaid dental coverage, overview. Downloaded January 27, 2010.
- DeNavas-Walt C, Proctor BD, Smith J. U.S. Census Bureau. Current population reports, P60-235, Income, poverty, and health insurance coverage in the United States, 2007 [PDF – 2.9 MB]. U.S. Government Printing Office, Washington, DC. 2008.
- Schenker N, Raghunathan TE, Chiu P, Makuc DM, Zhang G, Cohen AJ. Multiple imputation of family income and personal earnings in the National Health Interview Survey: Methods and examples [PDF – 813 KB].
- Botman SL, Moore TF, Moriarity CL, Parsons VL. Design and estimation for the National Health Interview Survey, 1995-2004. National Center for Health Statistics. Vital Health Stat 2(130). 2000.
- Research Triangle Institute. SUDAAN (Release 9.1). Research Triangle Park, NC: Research Triangle Institute. 2004.
Suggested citation
Bloom B, Cohen RA. Dental insurance for persons under age 65 years with private health insurance: United States, 2008. NCHS data brief, no 40. Hyattsville, MD: National Center for Health Statistics. 2010.
Copyright information
All material appearing in this report is in the public domain and may be reproduced or copied without permission; citation as to source, however, is appreciated.
National Center for Health Statistics
Edward J. Sondik, Ph.D., Director
Jennifer H. Madans, Ph.D., Associate Director for Science
Division of Health Interview Statistics
Jane F. Gentleman, Ph.D., Director