Prevalence and Trends in Hepatitis B Virus Infection in the United States, 2015–2018
- Key findings
- Did the prevalence of any past or present HBV infection differ by sex, race and Hispanic origin, or U.S. birth status?
- Did the prevalence of hepatitis B vaccination differ by sex, race and Hispanic origin, or U.S. birth status?
- What was the trend in the prevalence of any past or present HBV infection?
- What was the trend in the prevalence of hepatitis B vaccination?
- Summary
- Definitions
- Data source and methods
- About the authors
- References
- Suggested citation
PDF Version (480 KB) | Visual Abstract
Deanna Kruszon-Moran, M.S., Ryne Paulose-Ram, Ph.D., M.A., Crescent B. Martin, M.P.H., M.A., Laurie K. Barker, M.S.P.H, and Geraldine McQuillan, Ph.D.
Key findings
Data from the National Health and Nutrition Examination Survey
- The prevalence of any past or present hepatitis B virus (HBV) infection was 4.3%, and was higher among men (5.3%) than women (3.4%).
- Past or present HBV infection was highest among non-Hispanic Asian adults (21.1%) compared with non-Hispanic white (2.1%), non-Hispanic black (10.8%), and Hispanic (3.8%) adults, and was greater among adults born outside of the United States than those who were U.S. born.
- The prevalence of hepatitis B vaccination, based on blood test results, was 25.2%, and was highest among non-Hispanic Asian adults compared with non-Hispanic white, non-Hispanic black, and Hispanic adults.
- From 1999 through 2018, the prevalence of past or present infection decreased from 5.7% to 4.3%; evidence of vaccination increased from 12.3% to 25.2%.
Hepatitis B virus (HBV) is a type of viral hepatitis transmitted through sexual contact, contaminated blood, or from an infected mother to her newborn (1). HBV may cause a liver infection that is acute or short-term, but may also cause chronic or long-term infection. Vaccination was targeted to high-risk groups in 1982, and universal vaccination of newborns was recommended beginning in 1991 in the United States (2). This report provides 2015–2018 prevalence estimates of past or present HBV infection and evidence of hepatitis B vaccination, based on blood collected in the National Health and Nutrition Examination Survey (NHANES).
Keywords: HBV, vaccine, NHANES
Did the prevalence of any past or present HBV infection differ by sex, race and Hispanic origin, or U.S. birth status?
During 2015–2018, the prevalence of any past or present HBV infection was 4.3% among adults aged 18 and over (Figure 1).
Prevalence was higher among men (5.3%) compared with women (3.4%).
Prevalence was highest among non-Hispanic Asian adults (21.1%), followed by non-Hispanic black (10.8%), Hispanic (3.8%), and non-Hispanic white (2.1%) adults.
Prevalence was higher among those born outside of the United States (11.9%) compared with those who were U.S. born (2.5%).
Figure 1. Age-adjusted prevalence of past or present hepatitis B virus infection among adults aged 18 and over, by sex, race and Hispanic origin, and U.S. birth status: United States, 2015–2018
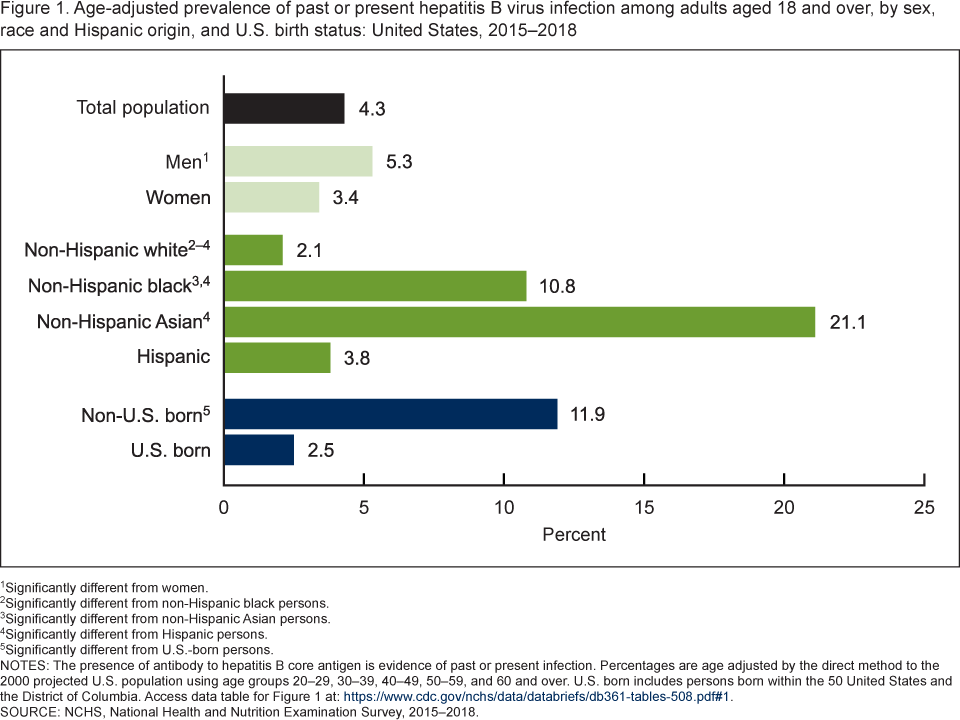
1Significantly different from women.
2Significantly different from non-Hispanic black persons.
3Significantly different from non-Hispanic Asian persons.
4Significantly different from Hispanic persons.
5Significantly different from U.S.-born persons.
NOTES: The presence of antibody to hepatitis B core antigen is evidence of past or present infection. Percentages are age adjusted by the direct method to the 2000 projected U.S. population using age groups 20–29, 30–39, 40–49, 50–59, and 60 and over. U.S. born includes persons born within the 50 United States and the District of Columbia. Access data table for Figure 1.
SOURCE: NCHS, National Health and Nutrition Examination Survey, 2015–2018.
Did the prevalence of hepatitis B vaccination differ by sex, race and Hispanic origin, or U.S. birth status?
During 2015–2018, the prevalence of hepatitis B vaccination, based on blood test results, was 25.2% among adults aged 18 and over (Figure 2).
Prevalence was higher among women (28.1%) compared with men (22.0%).
Prevalence was highest among non-Hispanic Asian adults (31.4%), followed by non-Hispanic white (26.6%), non-Hispanic black (23.2%), and Hispanic (19.9%) adults.
The prevalence of hepatitis B vaccination did not differ significantly by U.S. birth status.
Figure 2. Age-adjusted prevalence of serologic evidence of hepatitis B vaccination among adults aged 18 and over, by sex, race and Hispanic origin, and U.S. birth status: United States, 2015–2018
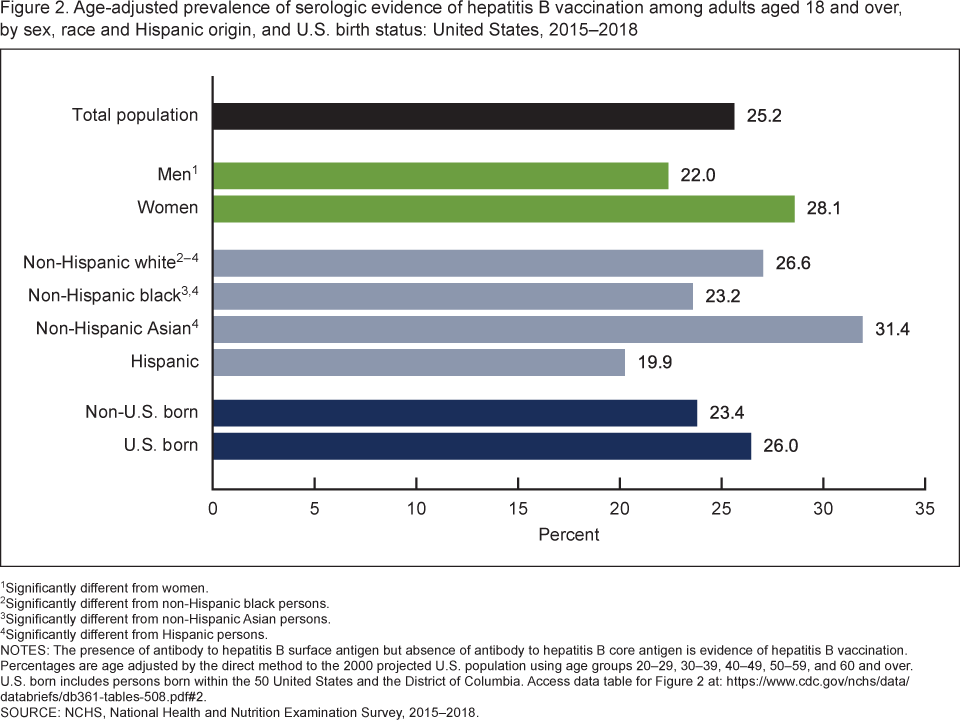
1Significantly different from women.
2Significantly different from non-Hispanic black persons.
3Significantly different from non-Hispanic Asian persons.
4Significantly different from Hispanic persons.
NOTES: The presence of antibody to hepatitis B surface antigen but absence of antibody to hepatitis B core antigen is evidence of hepatitis B vaccination. Percentages are age adjusted by the direct method to the 2000 projected U.S. population using age groups 20–29, 30–39, 40–49, 50–59, and 60 and over. U.S. born includes persons born within the 50 United States and the District of Columbia. Access data table for Figure 2.
SOURCE: NCHS, National Health and Nutrition Examination Survey, 2015–2018.
What was the trend in the prevalence of any past or present HBV infection?
The prevalence of past or present HBV infection decreased over time from 5.7% during 1999–2002 to 4.3% during 2015–2018 (Figure 3).
Figure 3. Trends in the age-adjusted prevalence of past or present hepatitis B virus infection among adults aged 18 and over: United States, 1999–2018
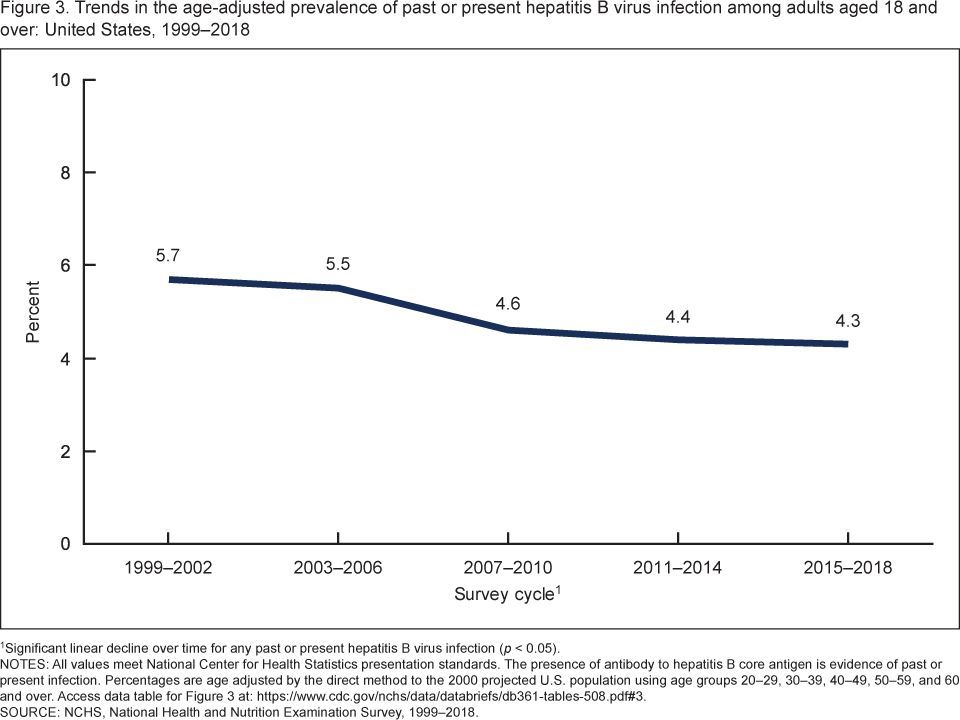
1Significant linear decline over time for any past or present hepatitis B virus infection (p < 0.05).
NOTES: All values meet National Center for Health Statistics presentation standards. The presence of antibody to hepatitis B core antigen is evidence of past or present infection. Percentages are age adjusted by the direct method to the 2000 projected U.S. population using age groups 20–29, 30–39, 40–49, 50–59, and 60 and over. Access data table for Figure 3.
SOURCE: NCHS, National Health and Nutrition Examination Survey, 1999–2018.
What was the trend in the prevalence of hepatitis B vaccination?
The prevalence of hepatitis B vaccination, based on blood test results, increased over time from 12.3% during 1999–2002 to 25.2% during 2015–2018 (Figure 4).
Figure 4. Trends in the age-adjusted prevalence of serologic evidence of hepatitis B vaccination among adults aged 18 and over: United States, 1999–2018
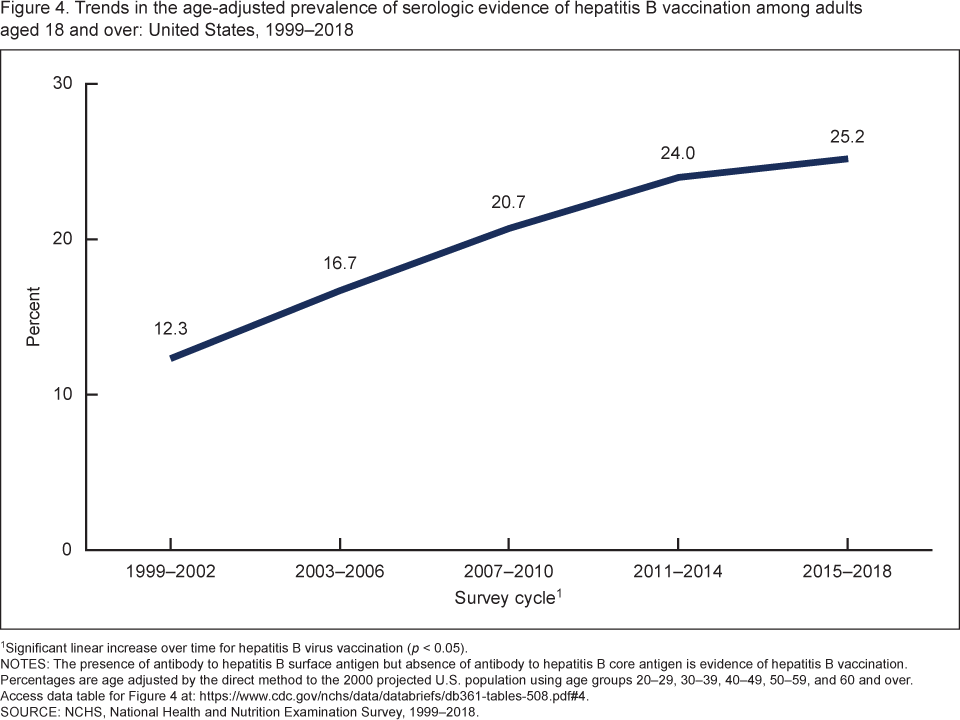
1Significant linear increase over time for hepatitis B virus vaccination (p < 0.05).
NOTES: The presence of antibody to hepatitis B surface antigen but absence of antibody to hepatitis B core antigen is evidence of hepatitis B vaccination. Percentages are age adjusted by the direct method to the 2000 projected U.S. population using age groups 20–29, 30–39, 40–49, 50–59, and 60 and over. Access data table for Figure 4.
SOURCE: National Health and Nutrition Examination Survey, 1999–2018.
Summary
The prevalence of any past or present HBV infection during 2015–2018 was 4.3%. Prevalence was higher among men (5.3%) compared with women (3.4%), and was highest among non-Hispanic Asian adults (21.1%), followed by non-Hispanic black adults (10.8%). Adults who were born outside of the 50 United States and the District of Columbia had a higher prevalence of past or present infection (11.9%) compared with those born in the United States (2.5%). These results are consistent with prior literature on HBV infection by race and ethnicity and birth status (3–5).
The prevalence of hepatitis B vaccination, based on blood test results, was 25.2%. Prevalence was higher among women (28.1%) compared with men (22.0%), and higher among non-Hispanic Asian adults (31.4%) compared with adults from all other race and Hispanic-origin subgroups. Vaccination status did not differ significantly by U.S. birth status.
There was a significant decreasing trend over time in past or present infection from 1999–2002 (5.7%) through 2015–2018 (4.3%). This decrease corresponds to an increasing trend during the same time period in hepatitis B vaccination based on blood test results. Prevalence among adults was 12.3% during 1999–2002 and increased to 25.2% during 2015–2018.
NHANES sample does not include certain groups, such as institutionalized, incarcerated, and homeless persons. There may be a higher prevalence of risk behaviors and need for adult hepatitis B vaccination among some of these populations (e.g., injection-drug users). Therefore, the data in this report may provide conservative estimates of the overall prevalence of infection and vaccination.
Definitions
Prevalence of past or present HBV infection: Presence of antibody to hepatitis B core antigen.
Prevalence of hepatitis B vaccination: Based on blood test results, the presence of antibody to hepatitis B surface antigen (anti-HBs) but absence of antibody to hepatitis B core antigen. There are limitations to this marker for vaccination. Because anti-HBs may wane during the years following vaccination, not all vaccinated persons will have anti-HBs; however, protection may persist because immune memory remains intact (6).
U.S. birth status: Participants who were born in the 50 United States or the District of Columbia were categorized as U.S. born. Those who were born outside of the United States were categorized as non-U.S. born.
Data source and methods
Data from the 1999–2018 NHANES were used for these analyses. NHANES is a cross-sectional survey designed to monitor the health and nutritional status of the civilian, noninstitutionalized U.S. population. The survey consists of interviews conducted in participants’ homes, followed by standardized physical examinations that include collection of blood and other biological specimens for laboratory testing. Hepatitis B estimates are based on the laboratory testing of blood samples that are collected when a participant is examined in the NHANES mobile examination center.
NHANES is based on a complex, multistage design with data released in 2-year cycles. The design includes oversampling and the ability to combine cycles to obtain reliable estimates for population subgroups. Starting with the 2007–2008 survey cycle, all Hispanic persons, and starting with the 2011–2012 survey cycle, non-Hispanic Asian persons, were oversampled to obtain more reliable estimates of health for these racial and ethnic groups. Additional information about NHANES is available from: https://www.cdc.gov/nchs/nhanes.htm.
Prevalence estimates and standard errors were calculated in SAS-callable SUDAAN software release 11.0 (RTI International, Research Triangle Park, N.C.) and Stata15 (StataCorp, College Station, Tex.). The examination sample weights were used to account for differing probabilities of selection, nonresponse, and noncoverage. Taylor series linearization was used to calculate standard errors to account for the complex sampling design. Differences between groups were evaluated using Student’s t statistic at the p < 0.05 significance level. Tests for trends were conducted using an orthogonal polynomial contrast procedure in SUDAAN. All estimates in this report meet National Center for Health Statistics standards of reliability as specified in “National Center for Health Statistics Data Presentation Standards for Proportions” (7). All differences discussed are statistically significant unless otherwise indicated. Calculated estimates were age adjusted by the direct method to the 2000 projected U.S. population using age groups 20–29, 30–39, 40–49, 50–59 and 60 and over. No adjustments were made for multiple comparisons.
About the authors
Deanna Kruszon-Moran, Ryne Paulose-Ram, Crescent B. Martin, and Geraldine McQuillan are with the National Center for Health Statistics, Division of Health and Nutrition Examination Surveys. Laurie Barker is with the National Center for HIV/AIDS, Viral Hepatitis, STD, and TB Prevention, Division of Viral Hepatitis.
References
- National Center for HIV/AIDS, Viral Hepatitis, STD, and TB Prevention. Viral hepatitis: Hepatitis B virus.
- Ly K. Chapter 3: Viral hepatitis. In: Epidemiologic profile 2010: Asians and Native Hawaiians and Other Pacific Islanders. 2012.
- National Center for HIV/AIDS, Viral Hepatitis, STD, and TB Prevention. Viral hepatitis: Populations and settings.
- Perz JF, Armstrong GL, Farrington LA, Hutin YJ, Bell BP. The contributions of hepatitis B virus and hepatitis C virus infections to cirrhosis and primary liver cancer worldwide. J Hepatol 45(4):529–38. 2006.
- Wasley A, Kruszon-Moran D, Kuhnert W, Simard EP, Finelli L, McQuillan G, Bell B. The prevalence of hepatitis B infection in the United States in the era of vaccination. J Infect Dis 202(2):192–201. 2010.
- King H, Xing J, Dean HD, Holtzman D. Trends in prevalence of protective levels of hepatitis B surface antibody among adults aged 18–49 years with risk factors for hepatitis B virus infection—United States, 2003–2014. Clin Infect Dis. 2019. doi: 10.1093/cid/ciz537 [Epub ahead of print].
- Parker JD, Talih M, Malec DJ, Beresovsky V, Carroll M, Gonzalez Jr. JF, et al. National Center for Health Statistics data presentation standards for proportions. National Center for Health Statistics. Vital Health Stat 2(175). 2017.
Suggested citation
Kruszon-Moran D, Paulose-Ram R, Martin CB, Barker L, McQuillan G. Prevalence and trends in hepatitis B virus infection in the United States, 2015–2018. NCHS Data Brief, no 361. Hyattsville, MD: National Center for Health Statistics. 2020.
Copyright information
All material appearing in this report is in the public domain and may be reproduced or copied without permission; citation as to source, however, is appreciated.
National Center for Health Statistics
Jennifer H. Madans, Ph.D., Acting Director
Amy M. Branum, Ph.D., Acting Associate Director for Science
Division of Health and Nutrition Examination Surveys
Ryne Paulose-Ram, M.A., Ph.D., Acting Director
Lara J. Akinbami, M.D., Acting Associate Director for Science