Human Papillomavirus Vaccination Among Adults Aged 18−26, 2013−2018
- Key findings
- The percentage of adults aged 18−26 who ever received one or more doses of HPV vaccine nearly doubled between 2013 and 2018.
- The percentage of adults aged 18−26 who received the recommended number of doses of HPV vaccine increased from 2013 through 2018.
- Overall and for women, non-Hispanic white adults were more likely than Hispanic adults to have ever received one or more doses of HPV vaccine.
- Among adults who have ever received one or more doses of HPV vaccine, age at first HPV dose varied by sex.
- Summary
- Definitions
- Data sources and methods
- About the authors
- References
- Suggested citation
PDF Version (423 KB)
Key findings
Data from the National Health Interview Survey
- Among adults aged 18−26, the percentage who ever received one or more doses of human papillomavirus (HPV) vaccine increased from 22.1% in 2013 to 39.9% in 2018.
- The percentage of adults aged 18−26 who received the recommended number of doses of HPV vaccine increased from 13.8% in 2013 to 21.5% in 2018.
- In 2018, non-Hispanic white adults were more likely than Hispanic adults to have ever received one or more doses of HPV vaccine.
- Among adults aged 18−26 who ever received one or more doses of HPV vaccine, the majority received the first dose between the ages of 13 and 17 years.
Human papillomavirus (HPV) is a sexually transmitted infection common among both men and women (1). HPV vaccination, which requires multiple doses, was first recommended for girls in 2006 and for boys in 2011 (2,3). Vaccination is routinely recommended at 11−12 years and can be started at age 9 (4). For those not vaccinated at 11−12 years, vaccination is recommended for all persons through age 26 years (4). Two HPV vaccine doses, given 6 to 12 months apart, are recommended if the series is started before age 15. Three doses, to be completed within 6 months, are recommended for those who started vaccination at age 15 or over (4,5). This report describes trends in self-reported HPV vaccination initiation and completion by selected demographic characteristics among adults aged 18−26.
Keywords: sexually transmitted infection, HPV, National Health Interview Survey
The percentage of adults aged 18−26 who ever received one or more doses of HPV vaccine nearly doubled between 2013 and 2018.
- Overall, the percentage of adults aged 18−26 who ever received one or more doses of HPV vaccine increased from 22.1% in 2013 to 39.9% in 2018 (Figure 1).
- From 2013 through 2018, the percentage of women who ever received one or more doses of HPV vaccine increased from 36.8% in 2013 to 53.6% in 2018, and the percentage of men more than tripled from 7.7% to 27.0%.
- For all survey years, women were more likely than men to have ever received one or more doses of HPV vaccine.
Figure 1. Percentage of adults aged 18–26 who ever received one or more doses of human papillomavirus vaccine, by year and sex: United States, 2013–2018
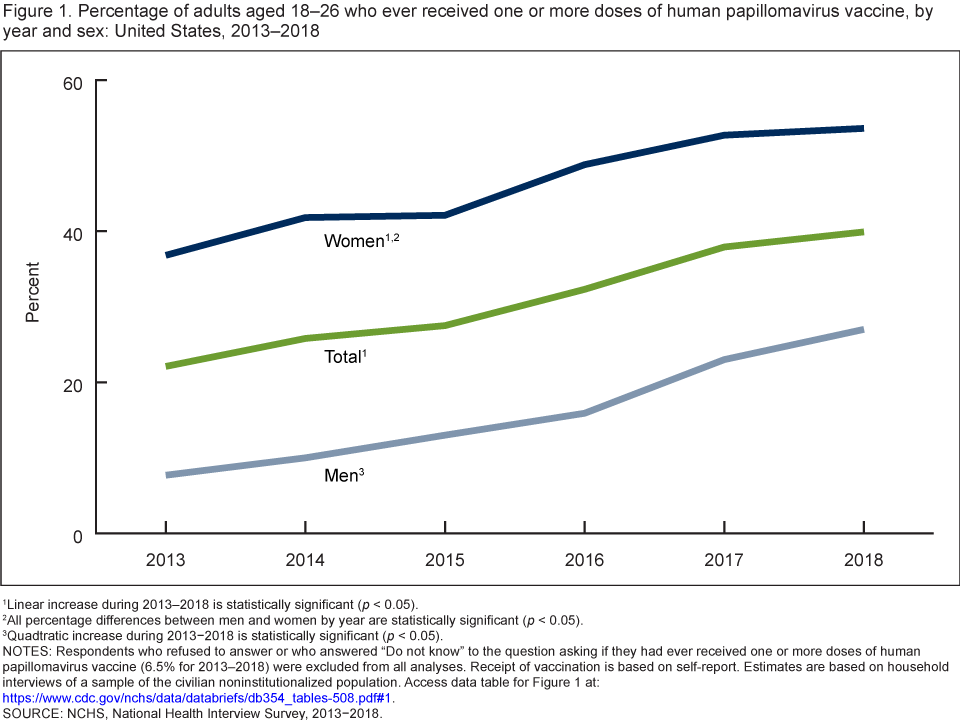
1Linear increase during 2013–2018 is statistically significant (p < 0.05).
2All percentage differences between men and women by year are statistically significant (p < 0.05).
3Quadtratic increase during 2013−2018 is statistically significant (p < 0.05).
NOTES: Respondents who refused to answer or who answered “Do not know” to the question asking if they had ever received one or more doses of human papillomavirus vaccine (6.5% for 2013–2018) were excluded from all analyses. Receipt of vaccination is based on self-report. Estimates are based on household interviews of a sample of the civilian noninstitutionalized population. Access data table for Figure 1.
SOURCE: NCHS, National Health Interview Survey, 2013−2018.
The percentage of adults aged 18−26 who received the recommended number of doses of HPV vaccine increased from 2013 through 2018.
- The percentage of adults aged 18−26 who received the recommended number of doses of HPV vaccine increased from 13.8% in 2013 to 21.5% in 2018 (Figure 2).
- The percentage of women who received the recommended number of doses of HPV vaccine increased from 25.7% in 2013 to 35.3% in 2018, and the percentage of men increased from 2.0% in 2013 to 9.0% in 2018.
- For all survey years, women were more likely than men to have received the recommended number of doses of HPV vaccine.
Figure 2. Percentage of adults aged 18–26 who received the recommended number of doses of human papillomavirus vaccine, by year and sex: United States, 2013–2018
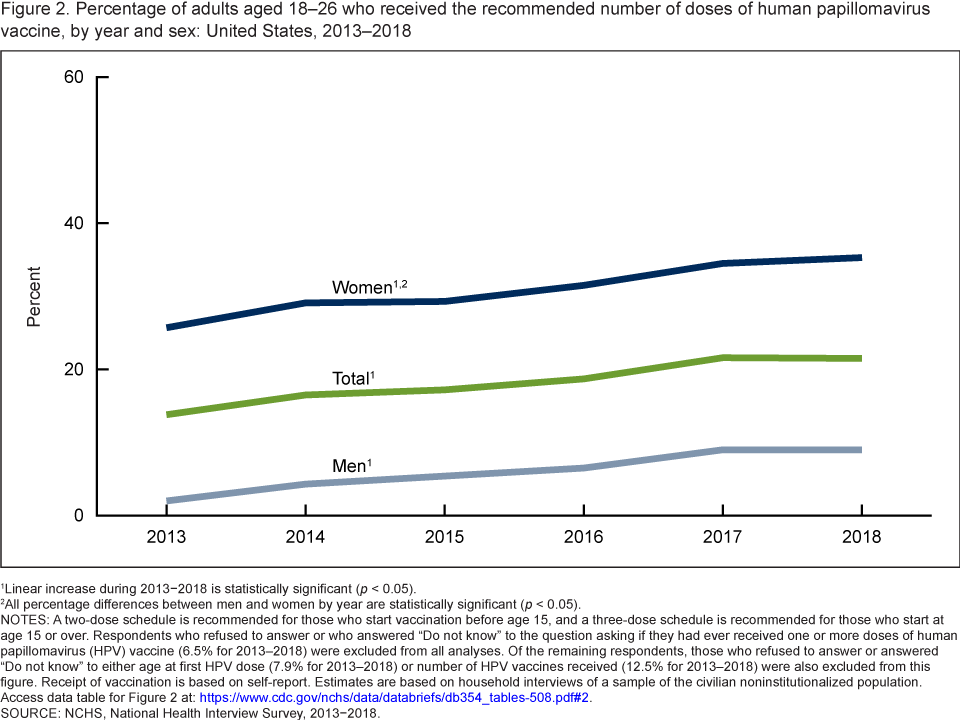
1Linear increase during 2013−2018 is statistically significant (p < 0.05).
2All percentage differences between men and women by year are statistically significant (p < 0.05).
NOTES: A two-dose schedule is recommended for those who start vaccination before age 15, and a three-dose schedule is recommended for those who start at age 15 or over. Respondents who refused to answer or who answered “Do not know” to the question asking if they had ever received one or more doses of human papillomavirus (HPV) vaccine (6.5% for 2013–2018) were excluded from all analyses. Of the remaining respondents, those who refused to answer or answered “Do not know” to either age at first HPV dose (7.9% for 2013–2018) or number of HPV vaccines received (12.5% for 2013–2018) were also excluded from this figure. Receipt of vaccination is based on self-report. Estimates are based on household interviews of a sample of the civilian noninstitutionalized population. Access data table for Figure 2.
SOURCE: NCHS, National Health Interview Survey, 2013−2018.
Overall and for women, non-Hispanic white adults were more likely than Hispanic adults to have ever received one or more doses of HPV vaccine.
- Overall, 42.1% of non-Hispanic white, 36.7% of non-Hispanic black, and 36.1% of Hispanic adults had ever received one or more doses of HPV vaccine in 2018 (Figure 3).
- Non-Hispanic white women (57.9%) were more likely to have ever received one or more doses of HPV vaccine than Hispanic (48.8%) or non-Hispanic black (44.7%) women.
- Among men, the percentage of adults who had ever received one or more doses of HPV vaccine ranged from 24.7% among Hispanic men to 29.4% for non-Hispanic black men but did not significantly differ by race and Hispanic ethnicity.
- For all race and Hispanic ethnicity groups, women were more likely than men to have ever received one or more doses of HPV vaccine.
Figure 3. Percentage of adults aged 18–26 who ever received one or more doses of human papillomavirus vaccine, by sex and race and ethnicity: United States, 2018
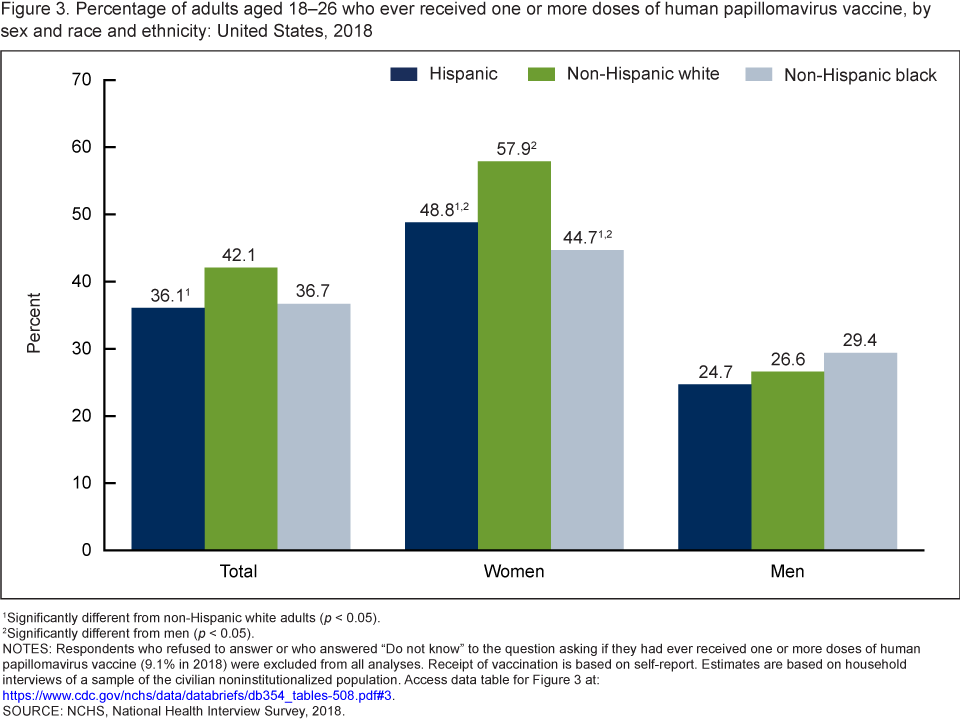
1Significantly different from non-Hispanic white adults (p < 0.05).
2Significantly different from men (p < 0.05).
NOTES: Respondents who refused to answer or who answered “Do not know” to the question asking if they had ever received one or more doses of human papillomavirus vaccine (9.1% in 2018) were excluded from all analyses. Receipt of vaccination is based on self-report. Estimates are based on household interviews of a sample of the civilian noninstitutionalized population. Access data table for Figure 3.
SOURCE: NCHS, National Health Interview Survey, 2018.
Among adults who have ever received one or more doses of HPV vaccine, age at first HPV dose varied by sex.
- In 2018, 18.5% of adults who had ever received one or more doses of HPV vaccine received their first dose of HPV vaccine at age 12 or under, 25.6% at age 13−14, 34.5% at age 15−17, and 21.4% at age 18−26 (Figure 4).
- Among adults who have ever received one or more doses of HPV vaccine, women (21.9%) were more likely than men (11.8%) to have received their first dose of HPV vaccine before age 13.
- Men (27.4%) were more likely than women (18.3%) to have received their first dose of HPV vaccine at age 18−26.
Figure 4. Percent distribution of age at first human papillomavirus vaccine dose among adults aged 18–26 who ever received one or more doses, by sex: United States, 2018
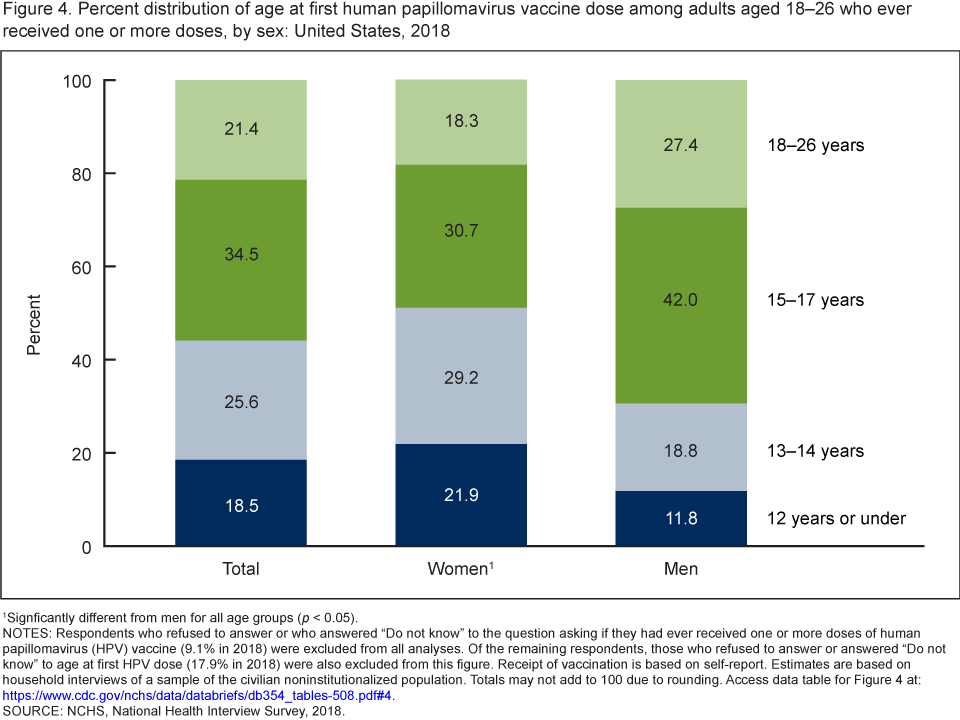
1Signficantly different from men for all age groups (p < 0.05).
NOTES: Respondents who refused to answer or who answered “Do not know” to the question asking if they had ever received one or more doses of human papillomavirus (HPV) vaccine (9.1% in 2018) were excluded from all analyses. Of the remaining respondents, those who refused to answer or answered “Do not know” to age at first HPV dose (17.9% in 2018) were also excluded from this figure. Receipt of vaccination is based on self-report. Estimates are based on household interviews of a sample of the civilian noninstitutionalized population. Access data table for Figure 4.
SOURCE: NCHS, National Health Interview Survey, 2018.
Summary
From 2013 through 2018, the percentage of adults aged 18−26 who reported ever receiving one or more doses of HPV vaccine increased from 22.1% to 39.9%, continuing the previously documented rise in the percentage of young adults receiving HPV vaccination (6−8). Over the same period, the percentage of adults aged 18−26 who received the recommended number of doses of HPV vaccine increased from 13.8% to 21.5%. In 2018, receipt of one or more doses of HPV vaccine was highest among women and non-Hispanic white adults. Among adults who have ever received one or more doses of HPV vaccine, women were more likely than men to have received their first dose of HPV vaccine at or before the recommended age of 12. HPV vaccination recommendations were issued earlier for girls (2006) compared with boys (2011), which may explain differences in age at vaccination by sex (2,3). Monitoring vaccination prevalence may help inform strategies to increase HPV vaccination rates.
Definitions
Age at first HPV vaccination: Based on the survey question, “How old were you when you received your first HPV shot?”
Human papillomavirus (HPV) vaccination: Based on the survey question, “Have you ever received an HPV shot or vaccine?”
Race and Hispanic ethnicity: Based on two separate questions that determine Hispanic or Latino ethnicity and race. Persons of Hispanic or Latino ethnicity may be of any race.
Received recommended number of doses of HPV vaccine: Based on the survey question, “How many HPV shots did you receive?” For persons first vaccinated before age 15, receipt of two doses was considered meeting the recommendation. For persons first vaccinated at age 15 or over, receipt of three doses was considered meeting the recommendation. Time between doses was not able to be evaluated.
Data source and methods
Data from the 2013−2018 National Health Interview Survey (NHIS) were used for this analysis. NHIS is a nationally representative household survey of the civilian noninstitutionalized U.S. population. It is conducted continuously throughout the year by the National Center for Health Statistics (NCHS). Interviews are conducted in respondents’ homes, but follow-ups to complete interviews may be conducted over the telephone. For more information about NHIS, visit https://www.cdc.gov/nchs/nhis.htm.
Information on HPV vaccination was part of the Sample Adult component and was not asked for persons under 18. Estimates are of point prevalence, and intention to vaccinate was not captured in NHIS. Receipt of vaccination was based on self-report and thus is subject to recall bias. Respondents who refused to answer or answered “Do not know” to the question asking if they had ever received one or more doses of HPV vaccine (6.5% for 2013−2018; 9.1% in 2018) were excluded from all analyses. Of the remaining respondents, Figure 2 also excluded respondents who refused to answer or answered do not know to either age at first HPV dose (7.9% for 2013−2018) or number of HPV vaccines received (12.5% for 2013−2018). Figure 4 also excluded respondents who refused to answer or answered do not know to age at first HPV dose (17.9% in 2018).
The NHIS sample design is described in more detail elsewhere (9). Point estimates and the corresponding variances for this analysis were calculated using SUDAAN software (10) to account for the complex sample design of NHIS. Differences between percentages were evaluated using two-sided significance tests at the 0.05 level. Tests for linear trends were evaluated using orthogonal polynomials. All estimates met NCHS presentation standards (11).
About the authors
Peter Boersma and Lindsey I. Black are with the National Center for Health Statistics, Division of Health Interview Statistics.
References
- Centers for Disease Control and Prevention. Genital HPV infection—CDC Fact Sheet.
- Centers for Disease Control and Prevention. Quadrivalent human papillomavirus vaccine: Recommendations of the Advisory Committee on Immunization Practices (ACIP). MMWR Recomm Rep 56(RR–2):1–24. 2007.
- Centers for Disease Control and Prevention. Recommendations on the use of quadrivalent human papillomavirus vaccine in males—Advisory Committee on Immunization Practices (ACIP), 2011. MMWR Morb Mortal Wkly Rep 60(50):1705–8. 2011.
- Meites E, Szilagyi PG, Chesson HW, Unger ER, Romero JR, Markowitz LE. Human papillomavirus vaccination for adults: Updated recommendations of the Advisory Committee on Immunization Practices. MMWR Morb Mortal Wkly Rep 68(32):698–702. 2019.
- Centers for Disease Control and Prevention. Human papillomavirus (HPV): Vaccine schedule and dosing.
- Pazol K, Robbins CL, Black LI, Ahrens KA, Daniels K, Chandra A, et al. Receipt of selected preventive health services for women and men of reproductive age—United States, 2011−2013. MMWR Surveill Summ 66(20):1–31. 2017.
- Schmidt S, Parsons HM. Vaccination interest and trends in human papillomavirus vaccine uptake in young adult women aged 18 to 26 years in the United States: An analysis using the 2008–2012 National Health Interview Survey. Am J Public Health 104(5):946−53. 2014.
- Centers for Disease Control and Prevention. Vaccination coverage among adults in the United States, National Health Interview Survey, 2017. 2019.
- National Center for Health Statistics. Survey description, National Health Interview Survey, 2018. Hyattsville, MD. 2019.
- RTI International. SUDAAN (Release 11.0.0) [computer software]. 2012.
- Parker JD, Talih M, Malec DJ, Beresovsky V, Carroll M, Gonzales JF Jr, et al. National Center for Health Statistics data presentation standards for proportions. National Center for Health Statistics. Vital Health Stat 2(175). 2017.
Suggested citation
Boersma P, Black LI. Human papillomavirus vaccination among adults aged 18−26, 2013−2018. NCHS Data Brief, no 354. Hyattsville, MD: National Center for Health Statistics. 2020.
Copyright information
All material appearing in this report is in the public domain and may be reproduced or copied without permission; citation as to source, however, is appreciated.
National Center for Health Statistics
Jennifer H. Madans, Ph.D., Acting Director
Amy M. Branum, Ph.D., Acting Associate Director for Science
Division of Health Interview Statistics
Stephen J. Blumberg, Ph.D., Director
Anjel Vahratian, Ph.D., M.P.H., Associate Director for Science