Fast Food Consumption Among Adults in the United States, 2013–2016
- Key findings
- What percentage of adults consumed fast food on a given day, and did consumption differ by sex and age for 2013–2016?
- Did the percentage of adults consuming fast food on a given day differ by race and Hispanic origin for 2013–2016?
- Did the percentage of adults consuming fast food on a given day differ by family income level for 2013–2016?
- Among adults who reported consuming fast food, did the percentage vary by meal type for 2013–2016?
- Summary
- Definition
- Data source and methods
- About the authors
- References
- Suggested citation
PDF Version (412 KB)
Cheryl D. Fryar, M.S.P.H., Jeffery P. Hughes, M.P.H., Kirsten A. Herrick, Ph.D., MSc., and Namanjeet Ahluwalia, Ph.D.
Key findings
Data from the National Health and Nutrition Examination Survey
- During 2013–2016, 36.6% of adults consumed fast food on a given day.
- The percentage of adults who consumed fast food decreased with age: 44.9% aged 20–39, 37.7% aged 40–59, and 24.1% aged 60 and over.
- A higher percentage of non-Hispanic black adults consumed fast food than non-Hispanic white, non-Hispanic Asian, and Hispanic adults.
- The percentage of adults who consumed fast food increased with increasing family income.
- Among those who consumed fast food, men were more likely than women to eat fast food at lunch, but women were more likely to report eating fast food as a snack.
Fast food is a part of the American diet and has been associated with high caloric intake (1), and poor diet quality (2). Time, financial resources, price, and availability influence fast food consumption (3). This report presents data on the percentage of adults who consumed fast food on a given day in the United States during 2013–2016.
Keywords: diet, restaurant, pizza, NHANES
What percentage of adults consumed fast food on a given day, and did consumption differ by sex and age for 2013–2016?
In 2013–2016, 36.6% of adults consumed fast food on a given day (Figure 1). The percentage of adults who consumed fast food decreased with age: 44.9% among younger adults aged 20–39, 37.7% among middle-aged adults aged 40–59, and 24.1% among older adults aged 60 and over. This pattern by age was observed for both men and women. Among all adults, a higher percentage of men (37.9%) than women (35.4%) consumed fast foods.
Figure 1. Percentage of adults aged 20 and over who consumed fast food on a given day, by sex and age: United States, 2013–2016
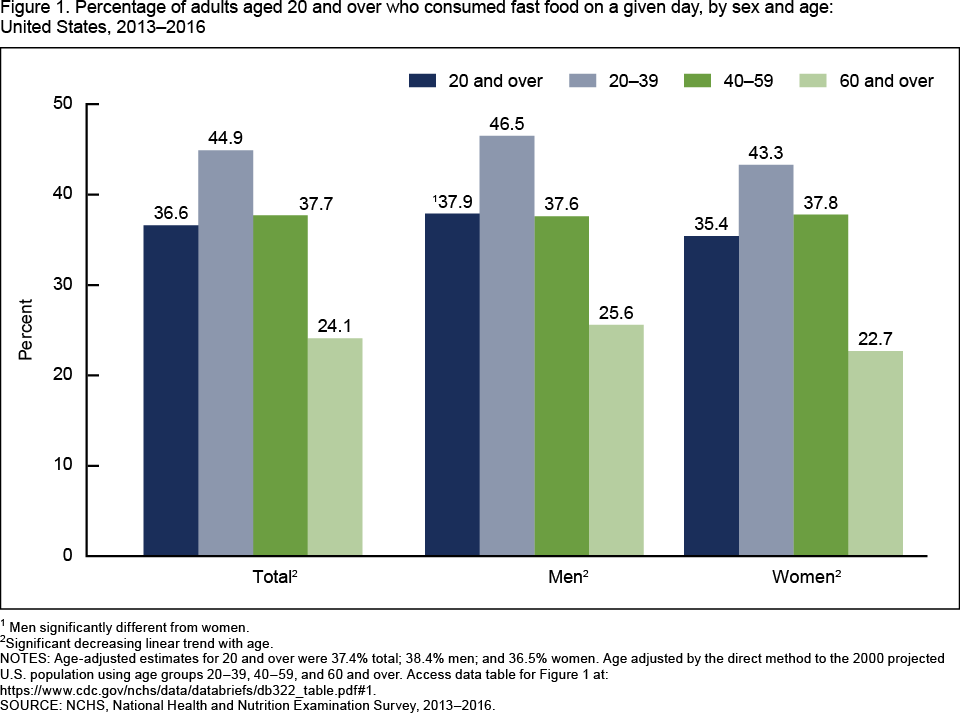
1Men significantly different from women.
2Significant decreasing linear trend with age.
NOTES: Age-adjusted estimates for 20 and over were 37.4% total; 38.4% men; and 36.5% women. Age adjusted by the direct method to the 2000 projected U.S. population using age groups 20–39, 40–59, and 60 and over. Access data table for Figure 1.
SOURCE: NCHS, National Health and Nutrition Examination Survey, 2013–2016.
Did the percentage of adults consuming fast food on a given day differ by race and Hispanic origin for 2013–2016?
Fast food consumption was higher among non-Hispanic black adults (42.4%) compared with non-Hispanic white (37.6%), non-Hispanic Asian (30.6%), and Hispanic (35.5%) adults (Figure 2). A higher percentage of non-Hispanic white adults consumed fast food compared with non-Hispanic Asian adults.
Among men, the percentage who consumed fast food was higher among non-Hispanic black adults (41.8%) compared with non-Hispanic Asian (31.1%) and Hispanic (35.2%) adults. Fast food consumption was also higher among non-Hispanic white men (39.0%) compared with non-Hispanic Asian men.
Among women, the percentage of non-Hispanic black adults who consumed fast food (42.9%) was higher compared with non-Hispanic white (36.3%), Hispanic (35.8%), and non-Hispanic Asian (30.4%) adults.
There were no significant differences between men and women of the same race and Hispanic-origin group in the percentage who consumed fast food.
Figure 2. Age-adjusted percentage of adults aged 20 and over who consumed fast food on a given day, by sex and race and Hispanic origin: United States, 2013–2016
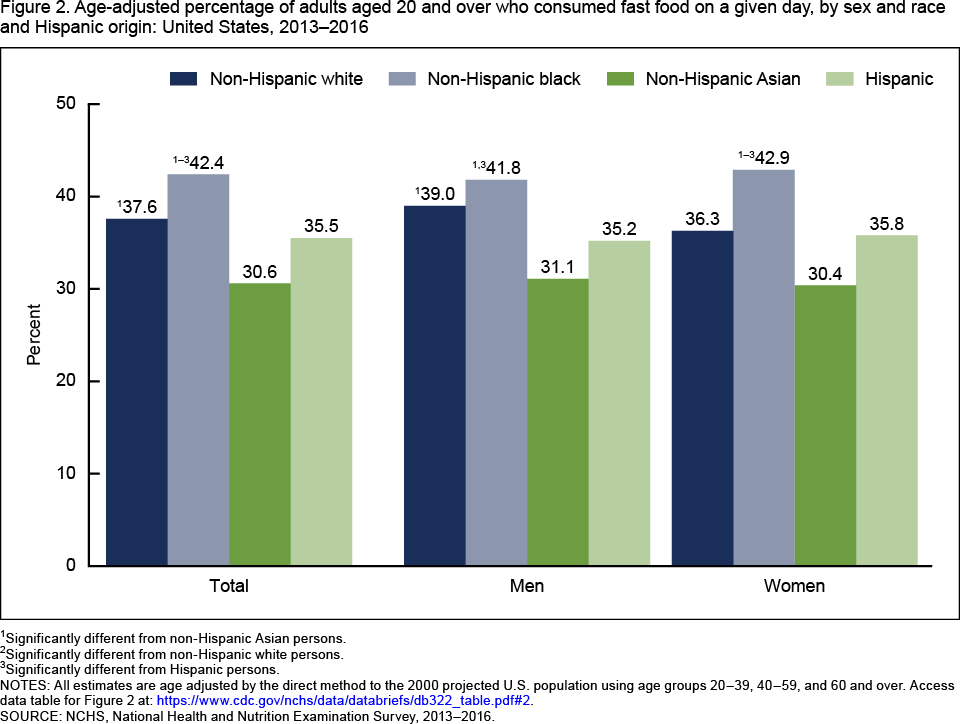
1Significantly different from non-Hispanic Asian persons.
2Significantly different from non-Hispanic white persons.
3Significantly different from Hispanic persons.
NOTES: All estimates are age adjusted by the direct method to the 2000 projected U.S. population using age groups 20–39, 40–59, and 60 and over. Access data table for Figure 2.
SOURCE: NCHS, National Health and Nutrition Examination Survey, 2013–2016.
Did the percentage of adults consuming fast food on a given day differ by family income level for 2013–2016?
The percentage of adults who consumed fast food increased with increasing family income level (Figure 3). Overall, 31.7% of lower-income (less than or equal to 130% of the federal poverty level [FPL]), 36.4% of middle-income (greater than 130% to less than or equal to 350% of FPL), and 42.0% of higher-income (greater than 350% of FPL) adults consumed fast food on a given day. A similar pattern was observed for both men and women.
Within each income level, there was no significant difference in the percentage between men and women who consumed fast food.
Figure 3. Age-adjusted percentage of adults aged 20 and over who consumed fast food on a given day, by sex and family income level: United States, 2013–2016
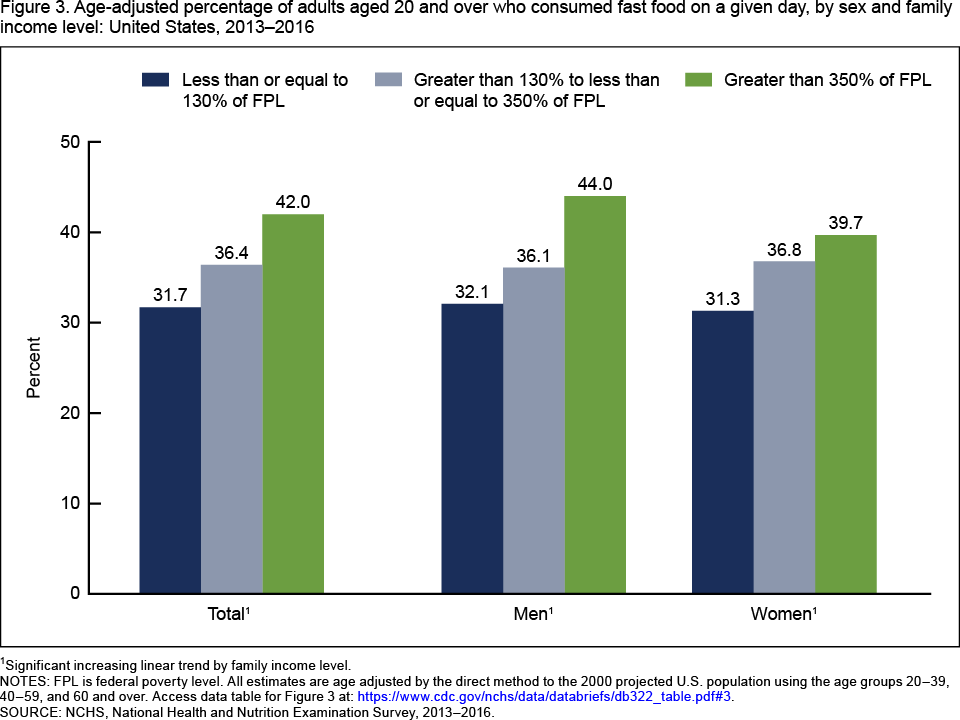
1Significant increasing linear trend by family income level.
NOTES: FPL is federal poverty level. All estimates are age adjusted by the direct method to the 2000 projected U.S. population using the age groups 20–39, 40–59, and 60 and over. Access data table for Figure 3.
SOURCE: NCHS, National Health and Nutrition Examination Survey, 2013–2016.
Among adults who reported consuming fast food, did the percentage vary by meal type for 2013–2016?
Among adults who consumed fast food, the most commonly reported eating occasions were lunch (43.7%) and dinner (42.0%), followed by breakfast (22.7%) and snacks (22.6%) (Figure 4).
A higher percentage of men (48.3%) than women (39.1%) consumed fast food during lunch, while a higher percentage of women (25.7%) than men (19.5%) consumed fast food from snacks.
Figure 4. Percentage of adults aged 20 and over who consumed fast food on a given day, by sex and eating occasion: United States, 2013–2016
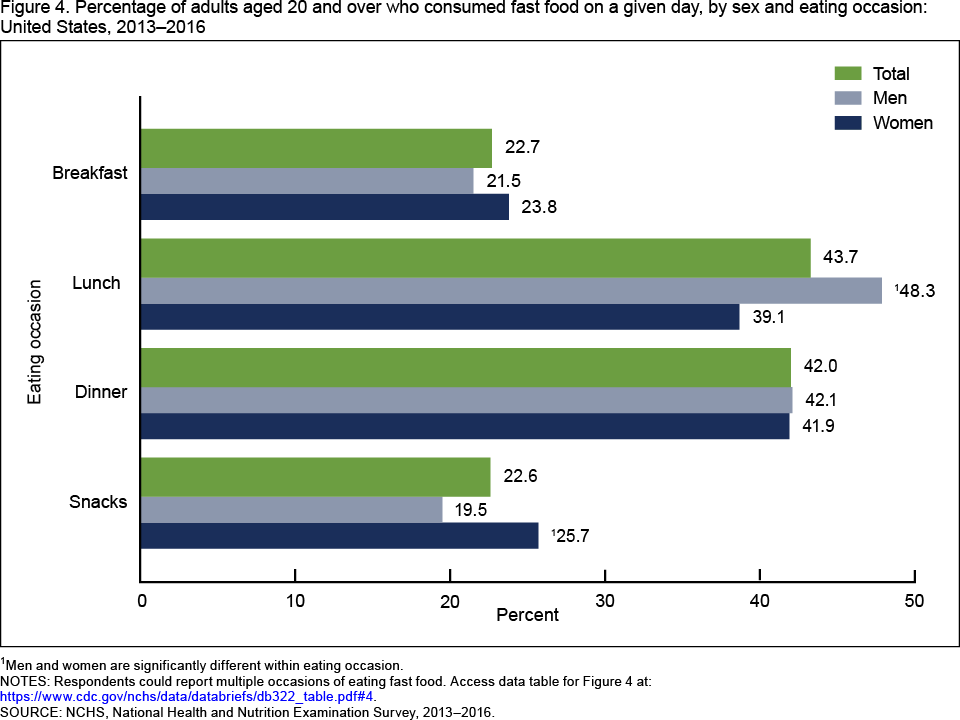
1Men and women are significantly different within eating occasion.
NOTES: Respondents could report multiple occasions of eating fast food. Access data table for Figure 4.
SOURCE: NCHS, National Health and Nutrition Examination Survey, 2013–2016.
Summary
During 2013–2016, approximately 37% of adults consumed fast food on a given day. The overall percentage of adults who consumed fast food decreased with age, increased with income, and was higher among non-Hispanic black persons compared with other race and Hispanic-origin groups. In addition, a higher percentage of non-Hispanic white adults consumed fast food than did non-Hispanic Asian adults. Among men and women who consumed fast food, a higher percentage of men ate it for lunch, while a higher percentage of women ate it as a snack.
Fast food consumption has been associated with increased intake of calories, fat, and sodium (4). A previous report estimated that adults consumed 11.3% of their total daily calories from fast food (1). Consumers can find nutritional information on calories on the menu in most fast food establishments and restaurants (5).
Definition
Fast-food consumption: For each food and beverage item that respondents reported consuming during their 24-hour recall, the participant is also asked about the source where they obtained those items. Food reported as “restaurant fast food/pizza” was considered fast food for these analyses.
Federal poverty level (FPL): Based on the income-to-poverty ratio, a measure of the annual total family income divided by the poverty guidelines, adjusted for family size and inflation.
Eating occasion: Distinct eating or drinking occurrence reported during the 24-hour dietary interview that consists of one or more food or beverage item. The name of the eating occasion was selected from a fixed list provided during the interview. English and Spanish eating occasion names were grouped as follows: Breakfast: breakfast, desayuno, and almuerzo; Lunch: brunch, lunch, and comida; Dinner: dinner, supper, and cena; and Snack: snack, drink, extended consumption (items that were consumed over a long period of time), merienda, entre comidas, botana, bocadillo, tentempie, and bebida.
Data source and methods
Data for this report are from the National Health and Nutrition Examination Survey (NHANES) (6), a cross-sectional survey conducted by the National Center for Health Statistics (NCHS) designed to monitor the health and nutritional status of the civilian noninstitutionalized U.S. population. It consists of home interviews followed by standardized physical examinations in mobile examination centers (MEC). The NHANES sample is selected through a complex, multistage probability design (7). For 2013–2016, non-Hispanic black, non-Hispanic Asian, and Hispanic persons were among the groups oversampled.
Dietary information was obtained via an in-person, 24-hour dietary recall interview with trained interviewers in the MEC. Dietary recall determined intake for the 24-hour period prior to the interview (midnight to midnight) (8). Limitations, such as underreporting, are associated with 24-hour recalls and have been well characterized (8, 9). Day 1 dietary sample weights, which accounted for the differential probabilities of selection, nonresponse, and noncoverage, as well as day of the week of dietary recall and nonresponse to the dietary interview, were incorporated into the estimation process. Taylor series linearization was used to compute variance estimates. Differences between subgroups, as well as linear trends across age and family income level, were evaluated using orthogonal contrasts to calculate a Student’s t statistic. Differences were considered significant at p < 0.05. All reported estimates met NCHS presentation standards (10). Estimates for the adults were age adjusted using the direct method to the 2000 projected U.S. population using the age groups 20–39, 40–59, and 60 and over. Statistical analyses were conducted using SAS-callable SUDAAN version 11.0 (RTI International, Research Triangle Park, N.C.).
About the authors
Cheryl D. Fryar, Jeffery P. Hughes, Kirsten A. Herrick, and Namanjeet Ahluwalia are with the National Center for Health Statistics, Division of Health and Nutrition Examination Surveys.
References
- Fryar CD, Ervin RB. Caloric intake from fast food among adults: United States, 2007–2010. NCHS Data Brief, no 114. Hyattsville, MD: National Center for Health Statistics. 2013.
- Todd J. Changes in consumption of food away from home and intakes of energy and other nutrients among U.S. working-age adults, 2005–2014. Public Health Nutr 20(18):3238–46. 2017.
- Rahkovsky I, Jo Y, Carlson A. Consumers balance time and money in purchasing convenience foods. ERR–251. U.S. Department of Agriculture, Economic Research Service. 2018.
- Wu HW, Sturm R. What’s on the menu? A review of the energy and nutritional content of U.S. chain restaurant menus. Public Health Nutr 16(1):87–96. 2013.
- American Heart Association News. Major restaurants now required to show calories on the menu.
- National Center for Health Statistics. National Health and Nutrition Examination Survey: Questionnaires, datasets, and related documentation.
- Johnson CL, Dohrmann SM, Burt VL, Mohadjer LK. National Health and Nutrition Examination Survey: Sample design, 2011–2014. National Center for Health Statistics [PDF – 2 MB]. Vital Health Stat 2(162). 2014.
- Ahluwalia N, Dwyer J, Terry A, Moshfegh A, Johnson C. Update on NHANES dietary data: Focus on collection, release, analytical considerations, and uses to inform public policy. Adv Nutr 7(1):121–34. 2016.
- Subar AF, Freedman LS, Tooze JA, Kirkpatrick SI, Boushey C, Neuhouser ML, et al. Addressing current criticism regarding the value of self-report dietary data. J Nutr 145(12): 2639–45. 2015.
- Parker JD, Talih M, Malec DJ, Beresovsky V, Carroll M, Gonzales Jr. JF, et al. National Center for Health Statistics Data Presentation Standards for Proportions [PDF – 3 MB]. National Center for Health Statistics. Vital Health Stat 2(175). 2017.
Suggested citation
Fryar CD, Hughes JP, Herrick KA, Ahluwalia, N. Fast food consumption among adults in the United States, 2013–2016. NCHS Data Brief, no 322. Hyattsville, MD: National Center for Health Statistics. 2018.
Copyright information
All material appearing in this report is in the public domain and may be reproduced or copied without permission; citation as to source, however, is appreciated.
National Center for Health Statistics
Charles J. Rothwell, M.S., M.B.A., Director
Jennifer H. Madans, Ph.D., Associate Director for Science
Division of Health and Nutrition Examination Surveys
Kathryn S. Porter, M.D., M.S., Director
Ryne Paulose-Ram, M.A., Ph.D., Associate Director for Science