Caloric Intake From Fast Food Among Adults: United States, 2007–2010
- Key findings
- What percentage of calories consumed by adults comes from fast food?
- Does the percentage of calories consumed from fast food differ by race and ethnicity?
- Does the percentage of calories consumed from fast food differ by income?
- Does the percentage of calories consumed from fast food differ by weight status?
- Summary
- Definitions
- Data source and methods
- About the authors
- References
- Suggested citation
NCHS Data Brief No. 114, February 2013
PDF Version (690 KB)
Cheryl D. Fryar, M.S.P.H., and R. Bethene Ervin, Ph.D., R.D.
Key findings
Data from the National Health and Nutrition Examination Survey
- During 2007–2010, adults consumed, on average, 11.3% of their total daily calories from fast food.
- The consumption of calories from fast food significantly decreased with age.
- Non-Hispanic black adults consumed a higher percentage of calories from fast food compared with non-Hispanic white and Hispanic adults.
- No difference was observed by income status in the percentage of calories consumed from fast food among all adults. Among young adults, however, as income increased, the percentage of calories from fast food decreased.
- The percentage of total daily calories from fast food increased as weight status increased.
As lifestyles become more hectic, fast-food consumption has become a growing part of the American diet (1,2). Fast food is food usually sold at eating establishments for quick availability or takeout (3). More than one-third of U.S. adults are obese (4), and frequent fast-food consumption has been shown to contribute to weight gain (1–6). This report presents the percentage of calories consumed from fast food by adults in the United States, including differences by sociodemographic characteristics and weight status.
Keywords: diet, calorie, National Health and Nutrition Examination Survey
What percentage of calories consumed by adults comes from fast food?
During 2007–2010, adults consumed an average 11.3% of their total daily calories from fast food (Figure 1), a decrease from 12.8% for 2003–2006 (data not shown). The percentage of calories consumed from fast food did not differ significantly between men (11.8%) and women (10.9%). The percentage of calories consumed from fast food decreased with age, with adults aged 60 and over (6.0%) consuming the lowest percentage of their daily calories from fast foods. This decrease with age was found among both men and women.
Figure 1. Percentage of calories from fast food among adults aged 20 and over, by sex and age: United States, 2007–2010
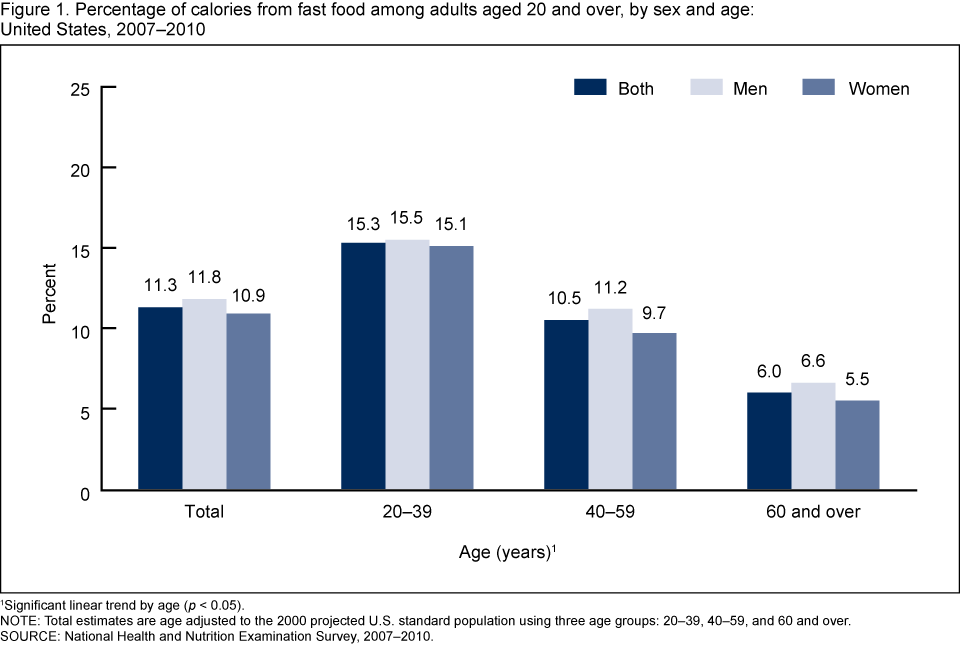
1Significant linear trend by age (p < 0.05).
NOTE: Total estimates are age adjusted to the 2000 projected U.S. standard population using three age groups: 20–39, 40–59, and 60 and over.
SOURCE: National Health and Nutrition Examination Survey, 2007–2010.
Does the percentage of calories consumed from fast food differ by race and ethnicity?
No significant differences were found between non-Hispanic white and Hispanic adults in the percentage of calories consumed from fast food. The lack of difference, in the percentage of calories consumed from fast food, between non-Hispanic white and Hispanic adults was observed among all age groups. However, among adults aged 20 and over, consumption of calories from fast food was higher among non-Hispanic black adults than non-Hispanic white and Hispanic adults (Figure 2). This disparity was found for young adults aged 20–39, where non-Hispanic black adults consumed more than one-fifth of their percentage of calories from fast food. Among middle-aged adults in the 40–59 age group, the pattern was similar, but the difference between non-Hispanic black and Hispanic persons did not reach statistical significance. No race or ethnic differences were found among adults aged 60 and over.
Figure 2. Percentage of calories from fast food among adults aged 20 and over, by age and race and ethnicity: United States, 2007–2010
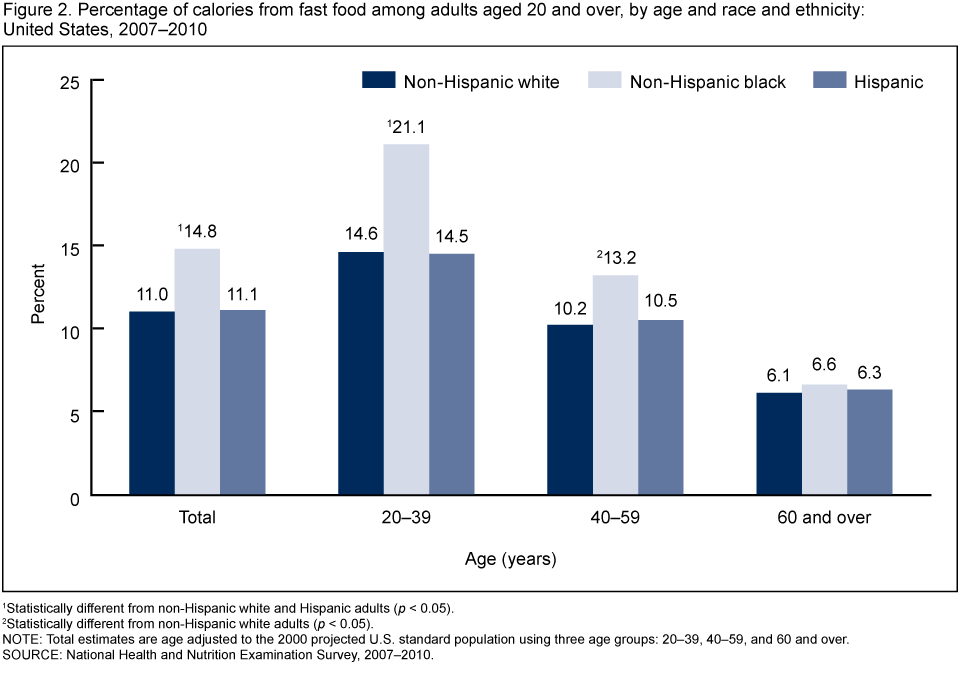
1Statistically different from non-Hispanic white and Hispanic adults (p < 0.05).
2Statistically different from non-Hispanic white adults (p < 0.05).
NOTE: Total estimates are age adjusted to the 2000 projected U.S. standard population using three age groups: 20–39, 40–59, and 60 and over.
SOURCE: National Health and Nutrition Examination Survey, 2007–2010.
Does the percentage of calories consumed from fast food differ by income?
Overall, no difference was observed by income status in the percentage of calories consumed from fast food (Figure 3). However, in the youngest age group, 20–39, the percentage of calories consumed from fast food significantly decreased with increasing income level.
Figure 3. Percentage of calories from fast food among adults aged 20 and over, by age and income: United States, 2007–2010
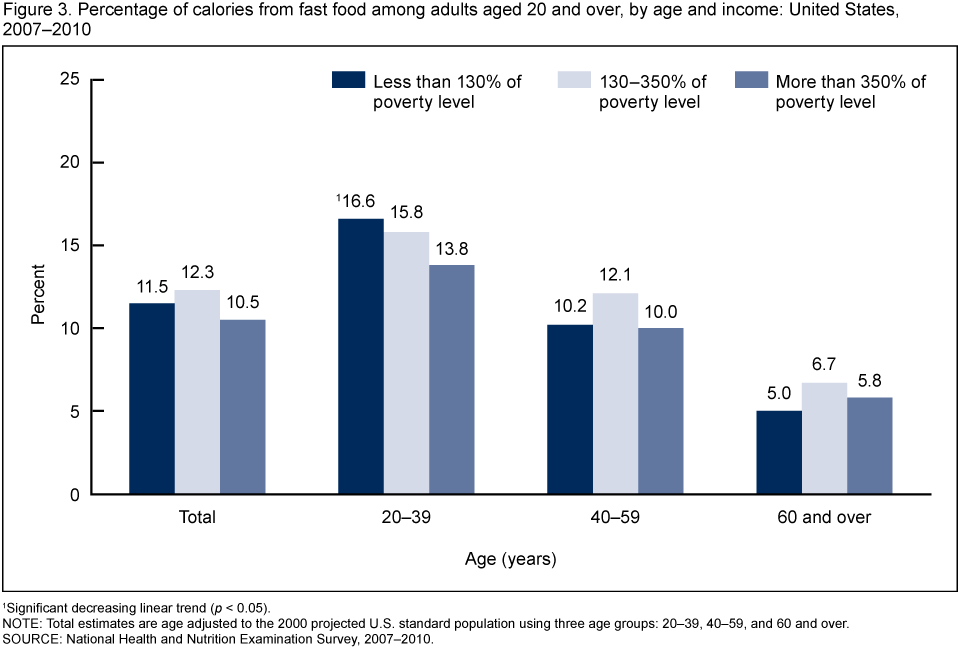
1Significant decreasing linear trend (p < 0.05).
NOTE: Total estimates are age adjusted to the 2000 projected U.S. standard population using three age groups: 20–39, 40–59, and 60 and over.
SOURCE: National Health and Nutrition Examination Survey, 2007–2010.
Does the percentage of calories consumed from fast food differ by weight status?
Among adults, the percentage of calories consumed from fast food varied by weight status (Figure 4). The percentage of total daily calories from fast food increased as weight status increased. For each age group, obese adults consumed the highest percentage of their calories from fast food.
Figure 4. Percentage of calories from fast food among adults aged 20 and over, by age and weight status: United States, 2007–2010
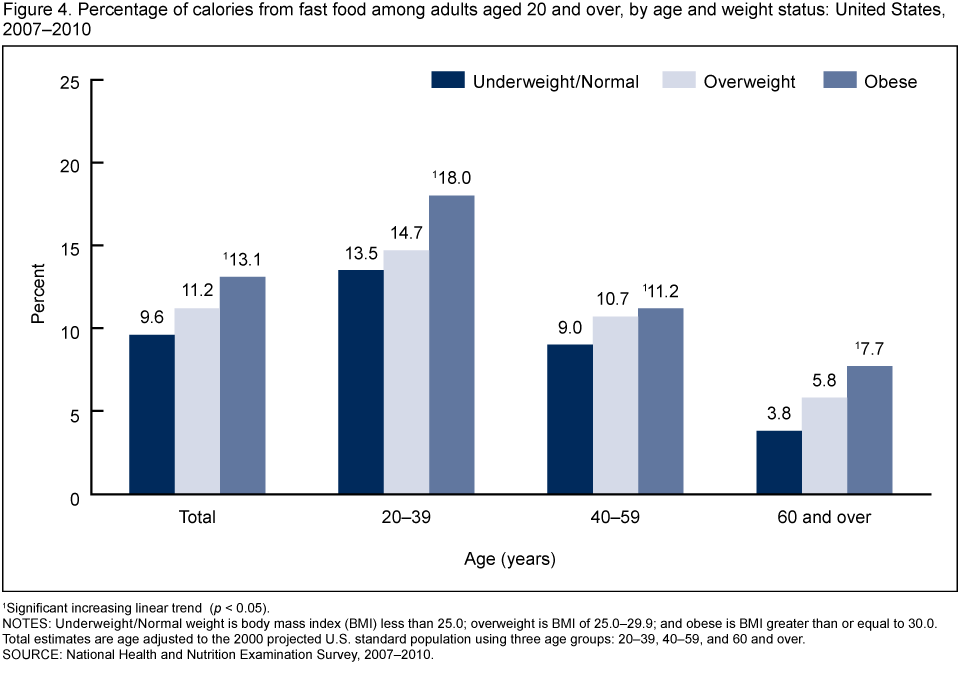
1Significant increasing linear trend (p < 0.05).
NOTES: Underweight/Normal weight is body mass index (BMI) less than 25.0; overweight is BMI of 25.0–29.9; and obese is BMI greater than or equal to 30.0. Total estimates are age adjusted to the 2000 projected U.S. standard population using three age groups: 20–39, 40–59, and 60 and over.
SOURCE: National Health and Nutrition Examination Survey, 2007–2010.
Summary
An earlier report by the U.S. Department of Agriculture found that the percentage of adults eating fast food increased from the early 1990s to the mid-1990s (1). Moreover, previous studies have reported that more frequent fast-food consumption is associated with higher energy and fat intake and lower intake of healthful nutrients (1,2). This report indicates that for 2007–2010, on average, adults consumed just over one-tenth of their percentage of calories from fast food, which represents a decrease from 2003–2006 when approximately 13% of calories were consumed from fast food.
During 2007–2010, the highest percentage of calories from fast food was consumed among adults who were aged 20–39 or non-Hispanic black or obese. Among young non-Hispanic black adults, more than one-fifth of their calories were consumed from fast food.
Definitions
Calories, kilocalories: A calorie is a measure of the energy produced as foods or beverages are burned for energy in the body. The term calorie is usually used when discussing energy from foods and diets, but the calorie being referred to is actually a kilocalorie (7). In this report, the term calorie refers to kilocalorie.
Fast-food consumption: Respondents were asked to identify where they got each food that they reported in the 24-hour dietary recall. The source of food coded as “restaurant fast food/pizza” from the 24-hour dietary recall interview was selected as fast foods for these analyses.
Poverty income ratio: An index representing the ratio of family income to poverty. The U.S. Department of Health and Human Services’ poverty guidelines were used as the poverty measure to calculate this index (8). The cut point for participation in the Supplemental Nutrition Assistance Program is 130% of the poverty level.
Weight status: Body mass index (BMI) is calculated as weight in kilograms divided by height in meters squared (kg/m2). Underweight/Normal weight is BMI less than 25.0; overweight is BMI of 25.0–29.9; and obese is BMI equal to or greater than 30.0.
Data source and methods
Data from the National Health and Nutrition Examination Survey (NHANES) were used for these analyses. NHANES is a cross-sectional survey designed to monitor the health and nutritional status of the civilian noninstitutionalized U.S. population (9). The survey consists of interviews conducted in participants’ homes, standardized physical examinations in mobile examination centers (MECs), and laboratory tests utilizing blood and urine specimens provided by participants during the physical examination. Dietary information for this analysis was obtained via an in-person 24-hour dietary recall interview in the MEC. Dietary recalls cover intake for any given day, specifically the 24-hour period prior to the dietary recall interview (midnight to midnight).
The NHANES sample is selected through a complex, multistage design that includes selection of primary sampling units (counties), household segments within the counties, and, finally, sample persons from selected households. The sample design includes oversampling to obtain reliable estimates of health and nutritional measures for population subgroups. African-American persons, Hispanic persons, persons with low income, and persons aged 60 and over were oversampled during 2007–2010 (10). NHANES public-use data files are released in 2-year cycles. Day 1 dietary sample weights—which account for the differential probabilities of selection, nonresponse, and noncoverage—as well as day of the week of dietary recall and nonresponse to the dietary interview were incorporated into the estimation process (11).
Estimates for the total population were age adjusted to the 2000 projected U.S. standard population using three age groups: 20–39, 40–59, and 60 and over. Differences between groups were evaluated using a t statistic at the p < 0.05 significance level with the appropriate degrees of freedom. To test for linear trends among ordinal groups, the null hypothesis of nonlinear trend was tested using orthogonal polynomials. All differences reported are statistically significant unless otherwise indicated. Statistical analyses were conducted using SAS version 9.2 (SAS Institute, Cary, N.C.) and SUDAAN version 10.0 (RTI International, Research Triangle Park, N.C.).
About the authors
Cheryl D. Fryar and R. Bethene Ervin are with the Centers for Disease Control and Prevention’s National Center for Health Statistics, Division of Health and Nutrition Examination Surveys.
References
- Bowman SA, Vinyard BT. Fast food consumption of U.S. adults: Impact on energy and nutrient intakes and overweight status. J Am Col Nutr 23(2):163–8. 2004.
- Paeratakul S, Ferdinand DP, Champagne CM, Ryan DH, Bray GA. Fast-food consumption among U.S. adults and children: Dietary and nutrient intake profile. J Am Diet Assoc 103(10):1332–8. 2003.
- U.S. Department of Agriculture, U.S. Department of Health and Human Services. Dietary guidelines for Americans, 2010. 7th ed. Washington, DC: U.S. Government Printing Office. 2010.
- Flegal KM, Carroll MD, Kit BK, Ogden CL. Prevalence of obesity and trends in the distribution of body mass index among U.S. adults, 1999–2010. JAMA 307(5):491–7. 2012.
- Anderson B, Rafferty AP, Lyon-Callo S, Fussman C, Imes G. Fast-food consumption and obesity among Michigan adults. Prev Chronic Dis 8(4):A71. 2011. [Accessed March 7, 2012].
- Boone-Heinonen J, Gordon-Larsen P, Kiefe CI, Shikany JM, Lewis CE, Popkin BM. Fast food restaurants and food stores: Longitudinal associations with diet in young to middle-aged adults: The CARDIA study. Arch Intern Med 171(13):1162–70. 2011.
- Energy. In: Food, nutrition, and diet therapy. 7th ed. Krause MV, Mahan LK, editors. Philadelphia, PA: WB Saunders Company. p 9–23. 1984.
- U.S. Department of Health and Human Services, Assistant Secretary for Planning and Evaluation. Poverty guidelines, research, and measurement. Washington, DC. 2011.
- National Center for Health Statistics. National Health and Nutrition Examination Survey: Questionnaires, datasets, and related documentation.
- National Center for Health Statistics. Analytic note regarding 2007–2010 survey design changes and combining data across other survey cycle [PDF – 19 KB]. Hyattsville, MD. 2006. [Accessed July 23, 2012].
- National Center for Health Statistics. The National Health and Nutrition Examination Survey (NHANES) analytic and reporting guidelines. 2005. [Accessed July 23, 2012].
Suggested citation
Fryar CD, Ervin RB. Caloric intake from fast food among adults: United States, 2007-2010. NCHS data brief, no 114. Hyattsville, MD: National Center for Health Statistics. 2013.
Copyright information
All material appearing in this report is in the public domain and may be reproduced or copied without permission; citation as to source, however, is appreciated.
National Center for Health Statistics
Edward J. Sondik, Ph.D., Director
Jennifer H. Madans, Ph.D., Associate Director for Science
Division of Health and Nutrition Examination Surveys
Rosemarie Hirsch, M.D., M.P.H., Acting Director