Seafood Consumption in the United States, 2013–2016
- Key findings
- What percentage of adults consumed seafood at least two times per week during 2013–2016?
- Did the percentage of adults consuming seafood at least two times per week differ by race and Hispanic origin during 2013–2016?
- What percentage of youth consumed seafood at least two times per week during 2013–2016?
- Did the percentage of youth consuming seafood at least two times per week differ by race and Hispanic origin during 2013–2016?
- What were the trends in the percentages of adults and youth consuming seafood at least two times per week between 2005–2006 and 2015–2016?
- Summary
- Definition
- Data source and methods
- About the authors
- References
- Suggested citation
PDF Version (401 KB)
Ana L. Terry, M.S., R.D., Kirsten A. Herrick, Ph.D., M.Sc., Joseph Afful, M.S., and Namanjeet Ahluwalia, Ph.D., D.Sc.
Key findings
Data from the National Health and Nutrition Examination Survey
- In 2013–2016, 20.1% of adults consumed seafood at least two times per week.
- More than 40% of non-Hispanic Asian adults (41.2%) consumed seafood at least two times per week, more than non-Hispanic white (18.7%), non-Hispanic black (22.6%), and Hispanic (14.5%) adults.
- Approximately 6% (5.6%) of youth aged 2–19 years consumed seafood at least two times per week.
- Twenty percent of non-Hispanic Asian youth consumed seafood at least two times per week, more than non-Hispanic white (4.1%), non-Hispanic black (7.5%), and Hispanic (4.8%) youth.
- The percentage of adults and youth who consumed seafood at least two times per week decreased from 2005–2006 through 2015–2016.
The 2015–2020 Dietary Guidelines for Americans (1) recommend consuming two servings of seafood, including fish and shellfish, per week. Consuming approximately 8 ounces of a variety of seafood weekly is associated with reduced cardiac deaths (2). This report describes the percentage of U.S. adults and youth who reported consuming seafood at least two times per week by sex, age, and race and Hispanic origin during 2013–2016. Trends in the percentage of adults and youth who consumed seafood at least twice weekly, from 2005–2006 through 2015–2016, are also presented.
Keywords: NHANES, fish, shellfish
What percentage of adults consumed seafood at least two times per week during 2013–2016?
Twenty percent (20.1%) of adults aged 20 and over consumed seafood at least two times per week (Figure 1).
Seafood consumption did not differ by sex among adults.
The percentage of adults who consumed seafood at least two times per week increased with age: 17.4% among persons aged 20–39, 20.4% among persons aged 40–59, and 23.3% among persons aged 60 and over.
Among men, 16.5% aged 20–39, 20.6% aged 40–59, and 24.3% aged 60 and over consumed seafood at least two times per week. Although not significant, a similar pattern of increasing percentages with age was observed among women.
Figure 1. Percentage of adults aged 20 and over consuming seafood at least two times per week, by age and sex: United States, 2013–2016
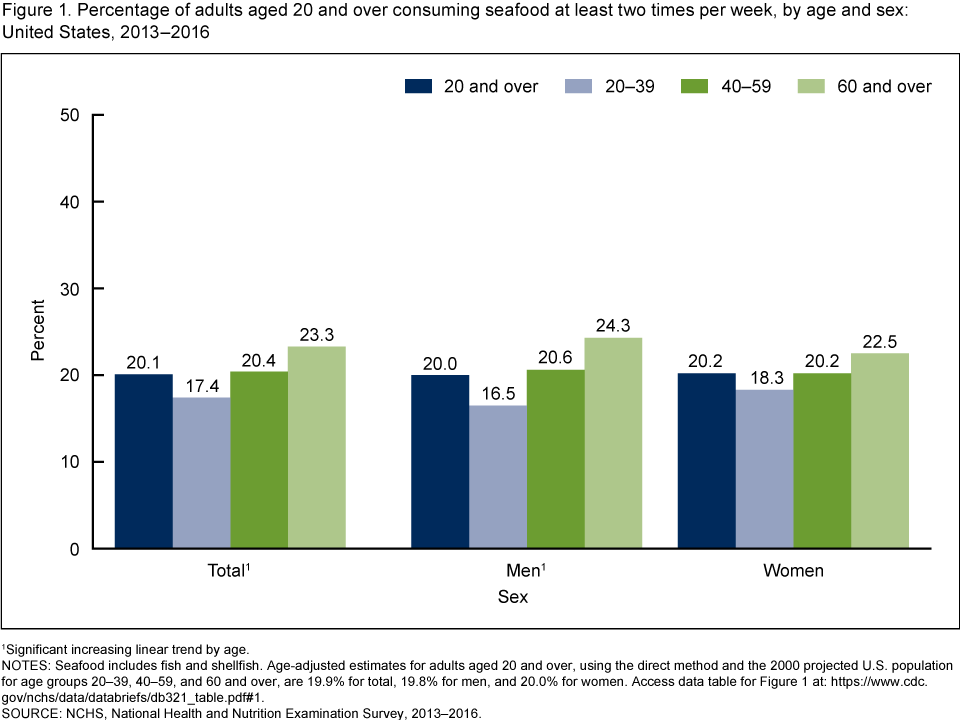
1Significant increasing linear trend by age.
NOTES: Seafood includes fish and shellfish. Age-adjusted estimates for adults aged 20 and over, using the direct method and the 2000 projected U.S. population for age groups 20–39, 40–59, and 60 and over, are 19.9% for total, 19.8% for men, and 20.0% for women. Access data table for Figure 1.
SOURCE: NCHS, National Health and Nutrition Examination Survey, 2013–2016.
Did the percentage of adults consuming seafood at least two times per week differ by race and Hispanic origin during 2013–2016?
More than 40% (41.2%) of non-Hispanic Asian adults consumed seafood at least two times per week, which was higher than non-Hispanic white (18.7%), non-Hispanic black (22.6%), and Hispanic (14.5%) adults (Figure 2). All differences by race and Hispanic origin were significant.
The percentage of men consuming seafood was highest for non-Hispanic Asian men (41.2%), followed by non-Hispanic black (20.8%) and non-Hispanic white (18.9%) men, for whom the percentage is similar, and lowest for Hispanic men (14.7%).
The percentage of women consuming seafood was highest for non-Hispanic Asian women (41.5%), followed by non-Hispanic black (24.0%) and non-Hispanic white (18.6%) women, and lowest for Hispanic women (14.3%).
There were no differences in seafood consumption by sex within the same race and Hispanic-origin groups.
Figure 2. Age-adjusted percentage of adults aged 20 and over consuming seafood at least two times per week, by race and Hispanic origin and sex: United States, 2013–2016
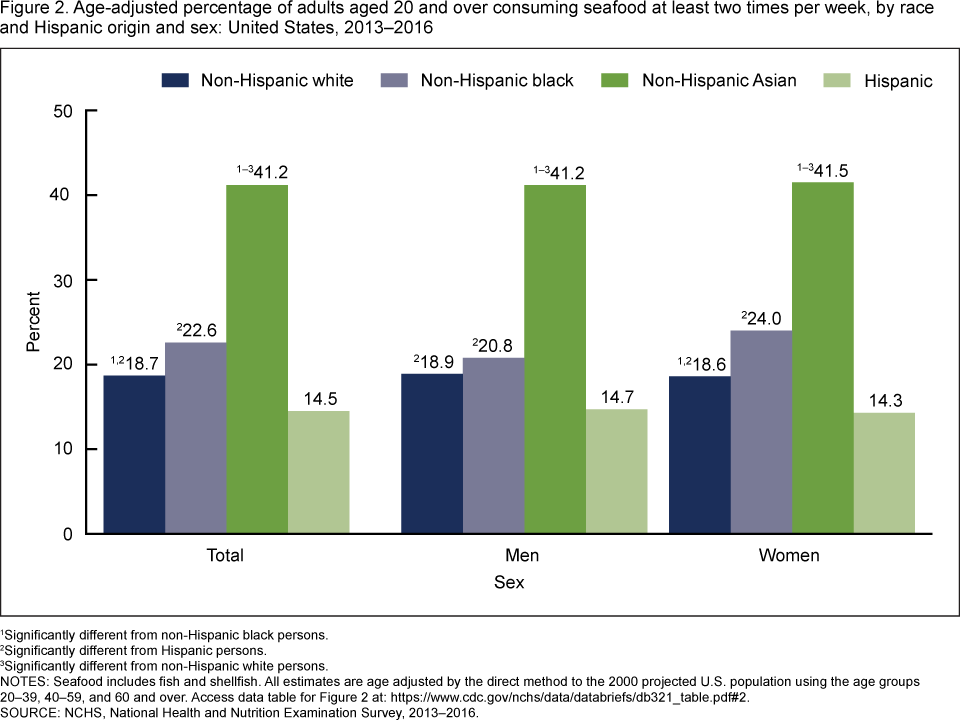
1Significantly different from non-Hispanic black persons.
2Significantly different from Hispanic persons.
3Significantly different from non-Hispanic white persons.
NOTES: Seafood includes fish and shellfish. All estimates are age adjusted by the direct method to the 2000 projected U.S. population using the age groups 20–39, 40–59, and 60 and over. Access data table for Figure 2.
SOURCE: NCHS, National Health and Nutrition Examination Survey, 2013–2016.
What percentage of youth consumed seafood at least two times per week during 2013–2016?
Approximately 6% (5.6%) of youth between 2 and 19 years consumed seafood at least two times per week (Figure 3). There was no difference by age or sex in the percentages who consumed seafood at least two times per week.
Figure 3. Percentage of youth aged 2–19 years consuming seafood at least two times per week, by age and sex: United States, 2013–2016

NOTES: Seafood includes fish and shellfish. Access data table for Figure 3.
SOURCE: NCHS, National Health and Nutrition Examination Survey, 2013–2016.
Did the percentage of youth consuming seafood at least two times per week differ by race and Hispanic origin during 2013–2016?
Approximately 20% (19.6%) of non-Hispanic Asian youth consumed seafood at least two times per week, more than non-Hispanic white (4.1%), non-Hispanic black (7.5%), and Hispanic (4.8%) youth (Figure 4). Seafood consumption was higher among non-Hispanic black youth compared with non-Hispanic white and Hispanic youth.
The percentage of boys consuming seafood was highest for non-Hispanic Asian boys (20.7%), followed by non-Hispanic black (5.6%), Hispanic (5.5%), and non-Hispanic white (4.6%) boys.
The percentage of girls consuming seafood was highest for non-Hispanic Asian girls (18.5%), followed by non-Hispanic black (9.5%), Hispanic (4.2%), and non-Hispanic white (3.5%) girls.
Seafood consumption was higher among non-Hispanic black girls (9.5%) compared with non-Hispanic black boys (5.6%).
Figure 4. Percentage of youth aged 2–19 years consuming seafood at least two times per week, by race and Hispanic origin and sex: United States, 2013–2016
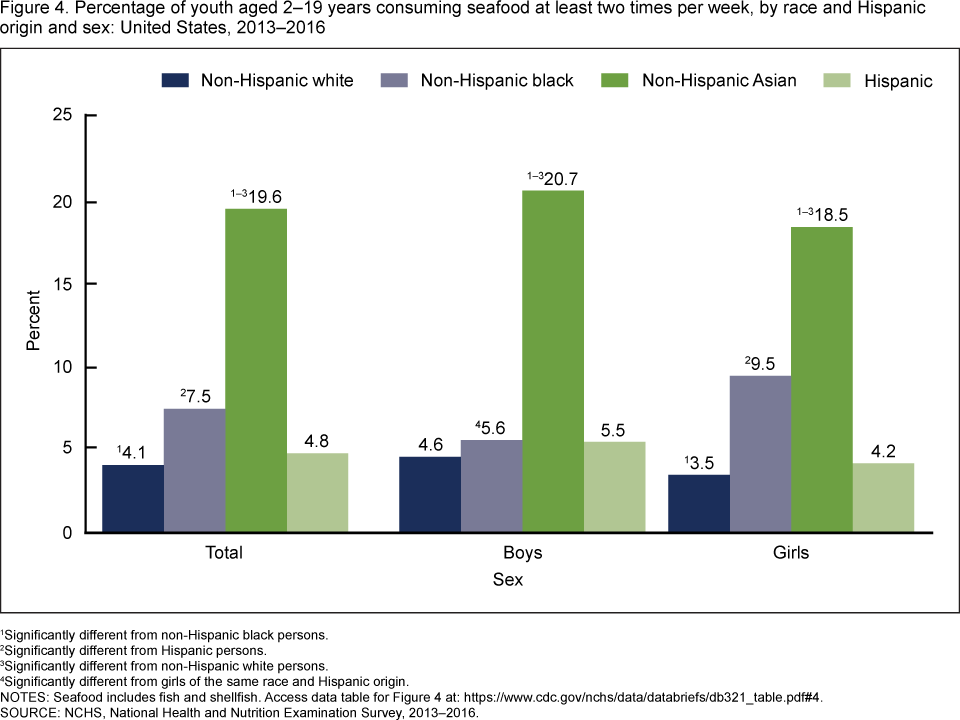
1Significantly different from non-Hispanic black persons.
2Significantly different from Hispanic persons.
3Significantly different from non-Hispanic white persons.
4Significantly different from girls of the same race and Hispanic origin.
NOTES: Seafood includes fish and shellfish. Access data table for Figure 4.
SOURCE: NCHS, National Health and Nutrition Examination Survey, 2013–2016.
What were the trends in the percentages of adults and youth consuming seafood at least two times per week between 2005–2006 and 2015–2016?
From 2005–2006 through 2015–2016, a decreasing trend was observed in the percentages of adults and youth consuming seafood at least two times per week (Figure 5). The percentage of adults who consumed seafood at least two times per week decreased from 26.0% to 19.2%. The percentage of youth who consumed seafood at least two times per week decreased from 8.3% to 5.4%.
Figure 5. Trends in the percentage of adults aged 20 and over (age adjusted) and youth aged 2–19 years consuming seafood at least two times per week: United States, 2005–2006 through 2015–2016
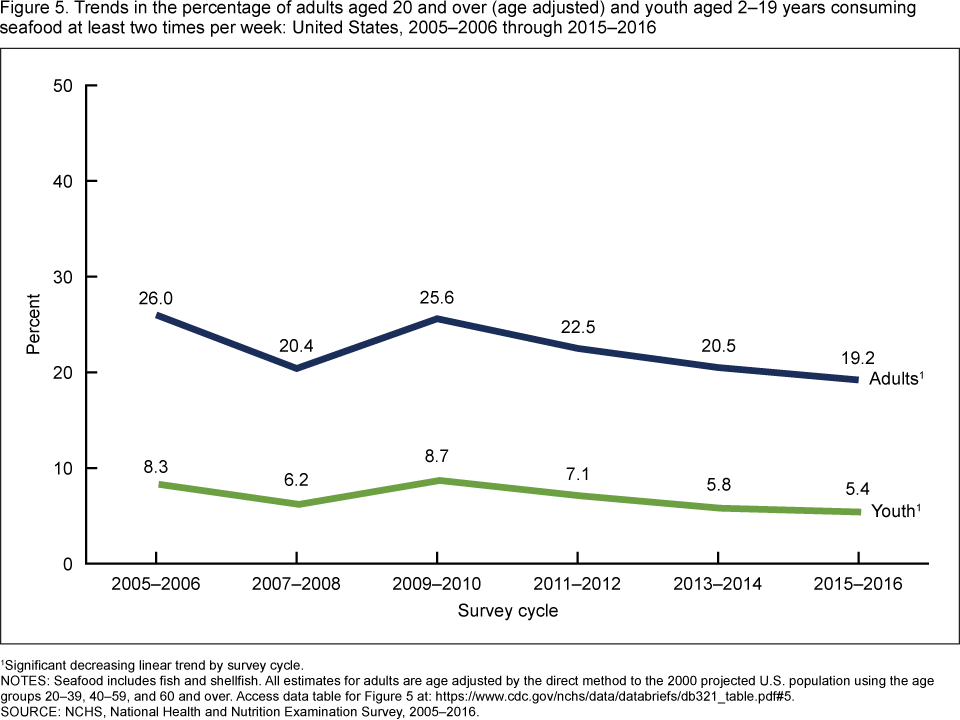
1Significant decreasing linear trend by survey cycle.
NOTES: Seafood includes fish and shellfish. All estimates for adults are age adjusted by the direct method to the 2000 projected U.S. population using the age groups 20–39, 40–59, and 60 and over. Access data table for Figure 5.
SOURCE: NCHS, National Health and Nutrition Examination Survey, 2005–2016.
Summary
Dietary intake of omega-3 fatty acids is important for the maintenance of good health in children and provides cardiovascular benefits for adults (2). Seafood, including fish and shellfish, is a major source of omega-3 fatty acids, and its consumption is recommended by the Dietary Guidelines for Americans (1). During 2013–2016, approximately 20% of adults aged 20 and over and 6% of youth aged 2–19 years consumed seafood at least two times per week. The percentage of adults who consumed seafood at least two times per week increased with age, overall and among men. No differences were noted between men and women. Among youth, no differences were observed by age.
Seafood consumption was highest among non-Hispanic Asian adults and youth. Among non-Hispanic Asian adults, approximately 40% consumed seafood at least two times per week, more than double the amount of other race and Hispanic-origin groups. Among non-Hispanic Asian youth, approximately 20% consumed seafood at least two times per week, about triple the amount of other race and Hispanic-origin groups.
Most youth and adults consumed seafood less than twice per week. Furthermore, trends over time, from 2005–2006 through 2015–2016, show a decrease in the percentage of adults and youth consuming seafood at least two times per week.
Definition
Seafood: The frequency of fish and shellfish consumption over the past 30 days was collected during the dietary interview. Participants were given a list of fish and shellfish and asked, “During the past thirty days, did you eat any types of fish (shellfish) listed on this card? Include any foods that had fish (shellfish) in them, such as sandwiches, soups, or salads.” The fish included breaded fish, tuna, bass, catfish, cod, flatfish, haddock, mackerel, perch, pike, pollock, porgy, salmon, sardines, sea bass, shark, swordfish, trout, walleye, other fish, and other unknown fish. The shellfish included clams, crab, crayfish, lobster, mussels, oysters, scallops, shrimp, other shellfish, and other unknown shellfish (3). To harmonize with the recommendation of 8 ounces or two servings per week, this report identified persons who reported consuming seafood eight or more times per month as consuming seafood at least twice a week.
Data source and methods
The National Health and Nutrition Examination Survey (NHANES) is a cross-sectional survey conducted by the National Center for Health Statistics designed to monitor the health and nutritional status of the civilian noninstitutionalized U.S. population (4). It consists of home interviews followed by standardized physical examinations conducted in mobile examination centers. For this report, data were collected through a nonquantitative food-frequency questionnaire (FFQ) focusing on fish and shellfish consumption during the previous 30 days. The fish FFQ did not collect information on portion sizes consumed; therefore, these data do not allow for a description of the amount of fish or shellfish consumed (3).
The NHANES sample is selected through a complex, multistage, probability design. During 2013–2016, non-Hispanic black, non-Hispanic Asian, and Hispanic persons were oversampled; for more information, visit the NHANES website. Race and Hispanic origin-specific estimates reflect individuals reporting only one race; those reporting more than one race are included in the total but are not reported separately.
Examination sample weights were used to account for differential probabilities of selection, nonresponse, and noncoverage. Taylor series linearization was used to compute variance estimates. Differences between groups were tested using a univariate t statistic. Tests for linear trends by age and over time were evaluated using orthogonal polynomials. The significance level for statistical testing was set at p < 0.05. All differences reported are statistically significant unless otherwise indicated. Data management and statistical analyses were conducted using SAS System for Windows version 9.4 (SAS Institute, Inc., Cary, N.C.) and SUDAAN version 11.0 (RTI International, Research Triangle Park, N.C.).
About the authors
Ana L. Terry, Kirsten A. Herrick, and Namanjeet Ahluwalia are with the National Center for Health Statistics, Division of Health and Nutrition Examination Surveys. Joseph Afful is with Peraton Corporation.
References
- U.S. Department of Health and Human Services, U.S. Department of Agriculture. Dietary Guidelines for Americans: 2015–2020. 8th ed. 2015.
- Rimm EB, Appel LJ, Chiuve SE, Djoussé L, Engler MB, Kris-Etherton PM, et al. Seafood long-chain n-3 polyunsaturated fatty acids and cardiovascular disease: A science advisory from the American Heart Association. Circulation 138(1):e35–47. 2018.
- National Center for Health Statistics. National Health and Nutrition Examination Survey (NHANES) MEC in-person dietary interviewers procedure manual. 2016.
- Johnson CL, Dohrmann SM, Burt VL, Mohadjer LK. National Health and Human Examination Survey: Sample design, 2011–2014. National Center for Health Statistics. Vital Health Stat 2(162). 2014.
Suggested citation
Terry AL, Herrick KA, Afful J, Ahluwalia N. Seafood consumption in the United States, 2013–2016. NCHS Data Brief, no 321. Hyattsville, MD: National Center for Health Statistics. 2018.
Copyright information
All material appearing in this report is in the public domain and may be reproduced or copied without permission; citation as to source, however, is appreciated.
National Center for Health Statistics
Charles J. Rothwell, M.S., M.B.A., Director
Jennifer H. Madans, Ph.D., Associate Director for Science
Division of Health and Nutrition Examination Surveys
Kathryn S. Porter, M.D., M.S., Director
Ryne Paulose-Ram, M.A., Ph.D., Associate Director for Science