Declines in Births to Females Aged 10–14 in the United States, 2000–2016
- Key findings
- Birth rates for females aged 10–14 declined to a record low in 2015 and remained at that level in 2016.
- Birth rates for females aged 10–12, 13, and 14 all declined from 2000 through 2016.
- During 2000–2016, birth rates for females aged 10–14 fell for all race and Hispanic-origin groups.
- The highest birth rates for females aged 10–14 in 2014–2016 were mostly in the southern United States.
- Summary
- Definitions
- Data source and methods
- About the authors
- References
- Suggested citation
NCHS Data Brief No. 308, April 2018
PDF Version (817 KB)
T.J. Mathews, M.S., and Brady E. Hamilton, Ph.D.
Key findings
Data from the National Vital Statistics System
- The birth rate for females aged 10–14 reached a record low for the United States in 2015 and 2016, 0.2 births per 1,000 females, down from 0.9 in 2000.
- The number of births to females aged 10–14 was a record low in 2016, dropping to 2,253 from 8,519 in 2000.
- During 2000–2016, birth rates declined for females aged 10–12, 13, and 14.
- During 2000–2016, birth rates for females aged 10–14 declined for all race and Hispanic-origin groups, with the largest decline occurring among non-Hispanic black females.
- For 2014–2016, the states with the highest birth rates for females aged 10–14 were Delaware, Louisiana, and Mississippi. The District of Columbia also had one of the highest rates.
The birth rate for teen mothers aged 15–19 declined 57% from 2000 through 2016. During this time, the rate for young adolescent mothers aged 10–14 also declined (1–3). Childbearing by very young mothers is a matter of public concern because of the elevated health risks for these mothers and their infants and the socioeconomic consequences (4–6). This report describes recent trends and variations in births to young mothers aged 10–14 by race and Hispanic origin and state (5).
Keywords: young adolescent childbearing, race and Hispanic origin, differences and trends, National Vital Statistics System
Birth rates for females aged 10–14 declined to a record low in 2015 and remained at that level in 2016.
- The birth rate for females aged 10–14 declined 33% from 2000 through 2003 (from 0.9 births per 1,000 females to 0.6); it remained stable from 2003 through 2008; and it declined again 67% from 2008 through 2016 (from 0.6 to 0.2). The rates for 2015 and 2016 reached a record low of 0.2 per 1,000 females (Figure 1).
- The number of births to females aged 10–14 declined from 2000 through 2003 (from 8,519 to 6,661); it remained stable from 2003 through 2007; and it declined again from 2007 through 2016 (from 6,195 to 2,253).
Figure 1. Number of births and birth rates for females aged 10–14: United States, 2000–2016
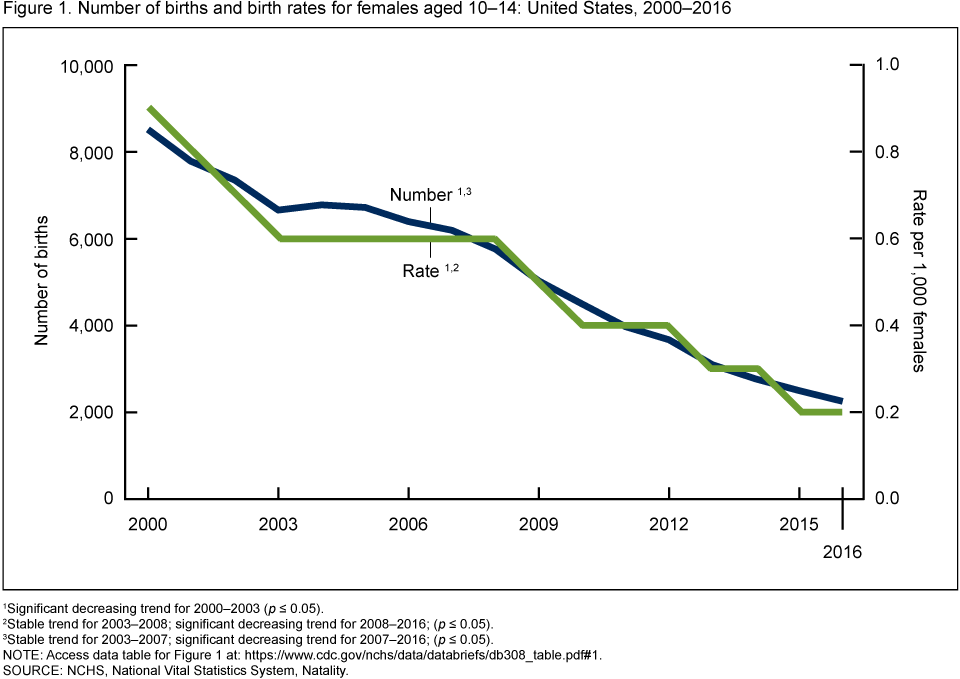
1Significant decreasing trend for 2000–2003 (p ≤ 0.05).
2Stable trend for 2003–2008; significant decreasing trend for 2008–2016; (p ≤ 0.05).
3Stable trend for 2003–2007; significant decreasing trend for 2007–2016; (p ≤ 0.05).
NOTE: Access data table for Figure 1.
SOURCE: NCHS, National Vital Statistics System, Natality.
Birth rates for females aged 10–12, 13, and 14 all declined from 2000 through 2016.
- Declines in birth rates for females aged 10–12, 13, and 14 were observed from 2000 through 2008 and 2008 through 2016, with greater declines occurring from 2008 through 2016 for each age group (Figure 2).
- Among these age groups, the largest decline in the birth rate was for females aged 13, down from 7.08 births per 10,000 in 2000 to 1.80 in 2016.
- During 2000–2016, the rate declined for females aged 10–12 (from 0.40 births per 10,000 to 0.11) and for those aged 14 (from 34.14 to 9.30).
Figure 2. Birth rates for females aged 10–12, 13, and 14: United States, 2000, 2008, and 2016
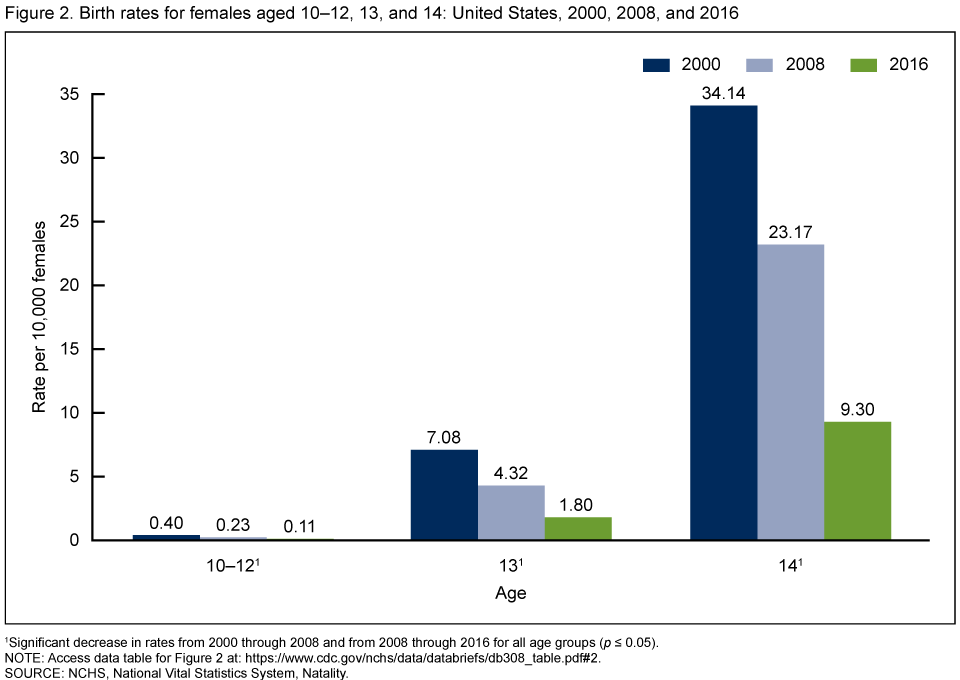
1Significant decrease in rates from 2000 through 2008 and from 2008 through 2016 for all age groups (p ≤ 0.05).
NOTE: Access data table for Figure 2.
SOURCE: NCHS, National Vital Statistics System, Natality.
During 2000–2016, birth rates for females aged 10–14 fell for all race and Hispanic-origin groups.
- The largest decline in the birth rate for females aged 10–14 from 2000 through 2016 was among non-Hispanic black females, down from 2.4 births per 1,000 in 2000 to 0.5 in 2016 (Figure 3).
- During 2000–2016, birth rates for Hispanic and American Indian or Alaska Native females aged 10–14 declined, from 1.7 to 0.4 and from 1.1 to 0.3, respectively.
- Birth rates for both non-Hispanic white and Asian or Pacific Islander (API) females aged 10–14 declined, from 0.3 in 2000 to 0.1 in 2016.
- For each race and ethnicity group, except API, larger declines were observed from 2008 through 2016 than from 2000 through 2008. The observed decline among API females from 2008 through 2016 was not statistically significant.
Figure 3. Birth rates for females aged 10–14, by race and Hispanic origin of mother: United States, 2000, 2008, and 2016
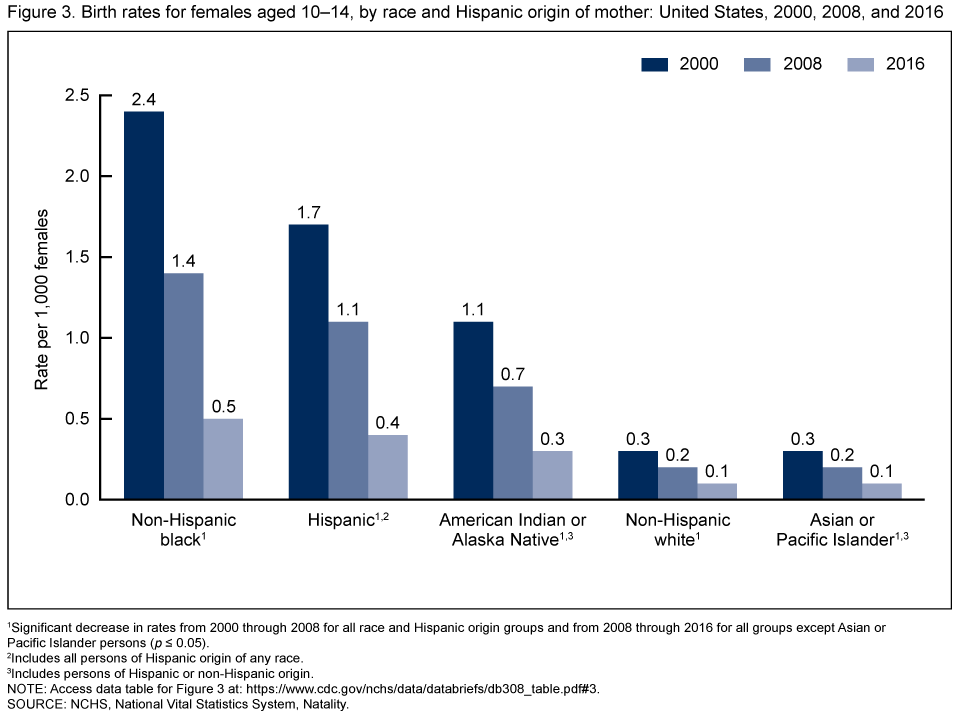
1Significant decrease in rates from 2000 through 2008 for all race and Hispanic origin groups and from 2008 through 2016 for all groups except Asian or Pacific Islander persons (p ≤ 0.05).
2Includes all persons of Hispanic origin of any race.
3Includes persons of Hispanic or non-Hispanic origin.
NOTE: Access data table for Figure 3.
SOURCE: NCHS, National Vital Statistics System, Natality.
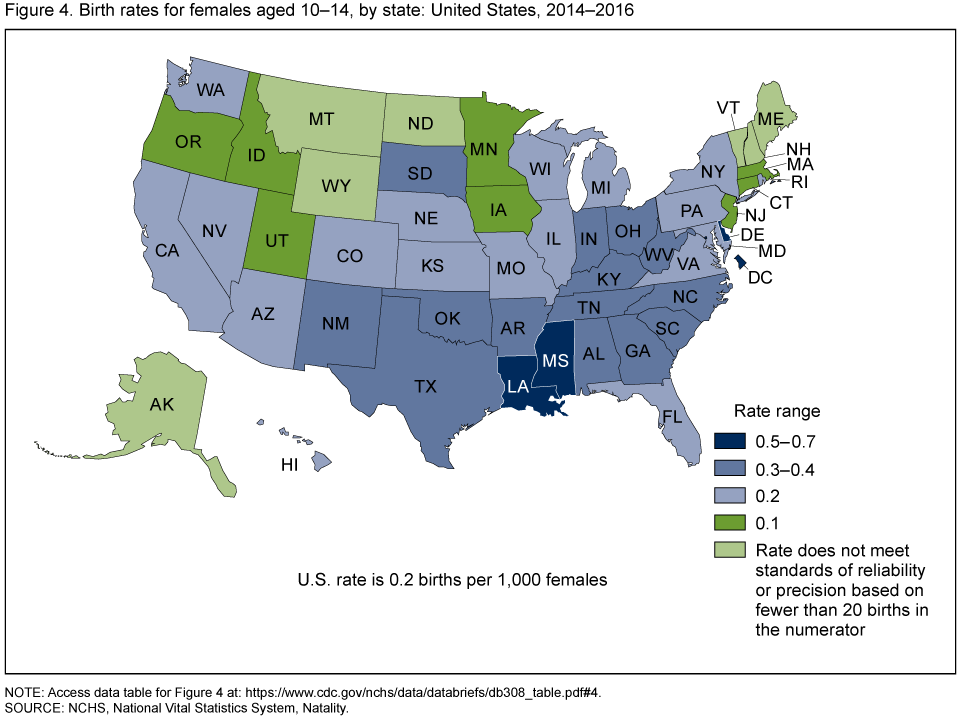
The highest birth rates for females aged 10–14 in 2014–2016 were mostly in the southern United States.
- In 2014–2016, birth rates for females aged 10–14 were highest in Delaware, Louisiana, and Mississippi (from 0.5 to 0.7 births per 1,000). The District of Columbia also had a high rate (0.6) (Figure 4).
- The lowest birth rate (0.1) for females aged 10–14 was reported for eight states: Connecticut, Idaho, Iowa, Massachusetts, Minnesota, New Jersey, Oregon, and Utah.
Figure 4. Birth rates for females aged 10–14, by state: United States, 2014–2016
NOTE: Access data table for Figure 4.
SOURCE: NCHS, National Vital Statistics System, Natality.
Summary
The decline in birth rates for those aged 10–14 was greater from 2008 through 2016 than from 2000 through 2008, and these declines were broad-based. Declines were observed for those aged 10–12, 13, and 14, and for all race and Hispanic-origin groups. Southern states generally had the highest birth rates for those aged 10–14 based on combined data from 2014 through 2016. A number of factors have been cited for the downward trend in teen childbearing in general, including delayed initiation of first sex, decreased sexual activity, and for sexually active teenagers, the use of effective contraception (7–9). The decreasing trend observed among those aged 10–14 is similar to the decreasing trend observed among females aged 15–19 (3,10,11).
In addition to declining trends, differences in birth rates for females aged 10–14 by race and Hispanic origin and among states have narrowed. However, disparities continue to persist in childbearing for these young mothers among race and Hispanic-origin groups and by state. The U.S. birth rate for females aged 10–14 remains one of the highest among industrialized countries (4).
Definitions
Birth rate for females aged 10–14: Number of births to females aged 10–14 per 1,000 females aged 10–14.
Birth rate for females aged 10–12, 13, and 14: Number of births to females aged 10–12, 13, and 14 per 10,000 females aged 10–12, 13, and 14.
Race and Hispanic origin: Race and Hispanic origin are reported separately on birth certificates. Persons of Hispanic origin may be of any race. Persons of non-Hispanic ancestry are further classified by race because there are substantial differences in fertility between Hispanic and non-Hispanic persons. Asian or Pacific Islander and American Indian or Alaska Native persons may be of Hispanic or non-Hispanic origin. Multiple-race data reported from 2008 and 2016 were bridged to single-race categories for trend analyses (3).
Data source and methods
This report is based on data from the Natality Data Files from the National Vital Statistics System. The vital statistics natality files are based on information derived from birth certificates and include information for all births occurring in the United States for the year. The Natality Data File is the primary data set for analyzing birth trends and patterns in the United States. The Natality Data Files are available from: https://www.cdc.gov/nchs/data_access/vitalstatsonline.htm.
For all figures, rates based on fewer than 20 births in the numerator are considered not statistically reliable and thus, are not presented.
Figure 4 combines data from 2014 through 2016 to generate birth rates by state. Even with combined data for 2014–2016, some states did not meet the National Center for Health Statistics vital statistics criteria for presenting rates, that is, less than 20 events in the numerator (3).
References to decreases in the number of births and birth rates indicate that decreases are statistically significant at the 0.05 level. Trends in the number of birth and birth rates for Figure 1 were evaluated using the Joinpoint Regression Program (12).
About the authors
T.J. Mathews and Brady E. Hamilton are with the National Center for Health Statistics, Division of Vital Statistics, Reproductive Statistics Branch.
References
- National Center for Health Statistics. Vital statistics of the United States, 2003, volume I, natality.
- National Center for Health Statistics. Natality public use files, 2000–2016.
- Martin JA, Hamilton BE, Osterman MJK, Driscoll AK, Drake P. Births: Final data for 2016. National Vital Statistics Reports; vol 67 no 1. Hyattsville, MD: National Center for Health Statistics. 2018.
- Sedgh G, Finer LB, Bankole A, Eilers MA, Singh S. Adolescent pregnancy, birth, and abortion rates across countries: Levels and recent trends. J Adolesc Health 56(2):223–30. 2015.
- Menacker F, Martin JA, MacDorman MF, Ventura SJ. Births to 10–14 year-old mothers, 1990–2002: Trends and health outcomes. National Vital Statistics Reports; vol 53 no 7. Hyattsville, Maryland: National Center for Health Statistics. 2004.
- Hoffman SD, Maynard RA. Kids having kids: Economic costs and social consequences of teen pregnancy. Washington, DC: Urban Institute Press. 2008.
- CDC. Winnable battles: Teen pregnancy.
- Department of Health and Human Services. Evidence-based teen pregnancy prevention programs.
- Abma JC, Martinez GM. Sexual activity and contraceptive use among teenagers in the United States, 2011–2015. National Health Statistics Reports; no 104. Hyattsville, MD: National Center for Health Statistics. 2017.
- Hamilton BE, Mathews TJ. Continued declines in teen births in the United States, 2015. NCHS Data Brief, no 259. Hyattsville, MD: National Center for Health Statistics. 2016.
- Ventura SJ, Hamilton BE, Mathews TJ. National and state patterns of teen births in the United States, 1940–2013. National Vital Statistics Reports; vol 63 no 4. Hyattsville, MD: National Center for Health Statistics. 2014.
- National Cancer Institute. Joinpoint Regression Program (Version 4.4.0.0) [computer software]. 2017.
Suggested citation
Mathews TJ, Hamilton BE. Declines in births to females aged 10–14 in the United States, 2000–2016. NCHS Data Brief, no 308. Hyattsville, MD: National Center for Health Statistics. 2018.
Copyright information
All material appearing in this report is in the public domain and may be reproduced or copied without permission; citation as to source, however, is appreciated.
National Center for Health Statistics
Charles J. Rothwell, M.S., M.B.A., Director
Jennifer H. Madans, Ph.D., Associate Director for Science
Division of Vital Statistics
Delton Atkinson, M.P.H., M.P.H., P.M.P., Director
Hanyu Ni, Ph.D., M.P.H., Associate Director for Science