Singleton Low Birthweight Rates, by Race and Hispanic Origin: United States, 2006–2016
- Key findings
- The singleton LBW rate increased in 2015 and 2016, after declining from 2006 to 2014.
- Singleton LBW rates increased for each race and Hispanic-origin group in 2015 and 2016.
- For each race and Hispanic-origin group, increases in LBW from 2014 to 2016 were largely due to increases in MLBW.
- Summary
- Definitions
- Data source and methods
- About the authors
- References
- Suggested citation
NCHS Data Brief No. 306, March 2018
PDF Version (726 KB)
Lindsay S. Womack, Ph.D., Lauren M. Rossen, Ph.D., and Joyce A. Martin, M.P.H.
Key findings
Data from the National Vital Statistics System
- The singleton low birthweight (less than 2,500 grams) rate increased in 2015 (6.34%) and 2016 (6.44%), after declining from 2006 to 2014 (6.49% to 6.24%).
- The recent increase in the singleton low birthweight rate from 2014 to 2016 reflects an increase in the rate of moderately low birthweight
1,500–2,499 grams), as the rate of very low birthweight (less than 1,500 grams) was stable during this period. - The low birthweight and moderately low birthweight rates among singletons rose from 2014 to 2016 for each race and Hispanic-origin group.
- The rate of singleton low birthweight was more than twice as high for non-Hispanic black infants as for non-Hispanic white infants from 2006 to 2016.
Low birthweight (LBW) is among the leading causes of infant death in the United States (1). LBW infants are also more likely to have health problems (2). After reaching its highest level in four decades, the LBW rate among all births declined from 2006 to 2014 (3,4), but the trend reversed in 2015 and 2016 when the LBW rate increased (4), moving further away from the Healthy People 2020 goal of reducing LBW rates to 7.8% of live births (5). This report shows trends in LBW, moderately low birthweight (MLBW), and very low birthweight (VLBW) by race and Hispanic origin from 2006 to 2016 for singleton births only, as rates of multiple births can impact LBW rates (4,6).
Keywords: infant health, National Vital Statistics System
The singleton LBW rate increased in 2015 and 2016, after declining from 2006 to 2014.
- The LBW rate rose 3% from 2014 to 2016 (6.24% to 6.44%), after declining from 2006 to 2014 (6.49% to 6.24%) (Figure 1).
- The rate of MLBW rose from 5.17% in 2014 to 5.36% in 2016, after declining from 2006 to 2014 (5.35% to 5.17%).
- The rate of VLBW was stable from 2013 to 2016 (1.08% in 2013, 1.07% in 2014, and 1.08% in 2015 and 2016).
- The decline in total LBW from 2006 to 2014 reflects the decline in both the MLBW rate and the VLBW rate, whereas the increase in total LBW in 2015 and 2016 was due to the rise only in the MLBW rate.
Figure 1. Singleton low birthweight, moderately low birthweight, and very low birthweight rates: United States, 2006–2016
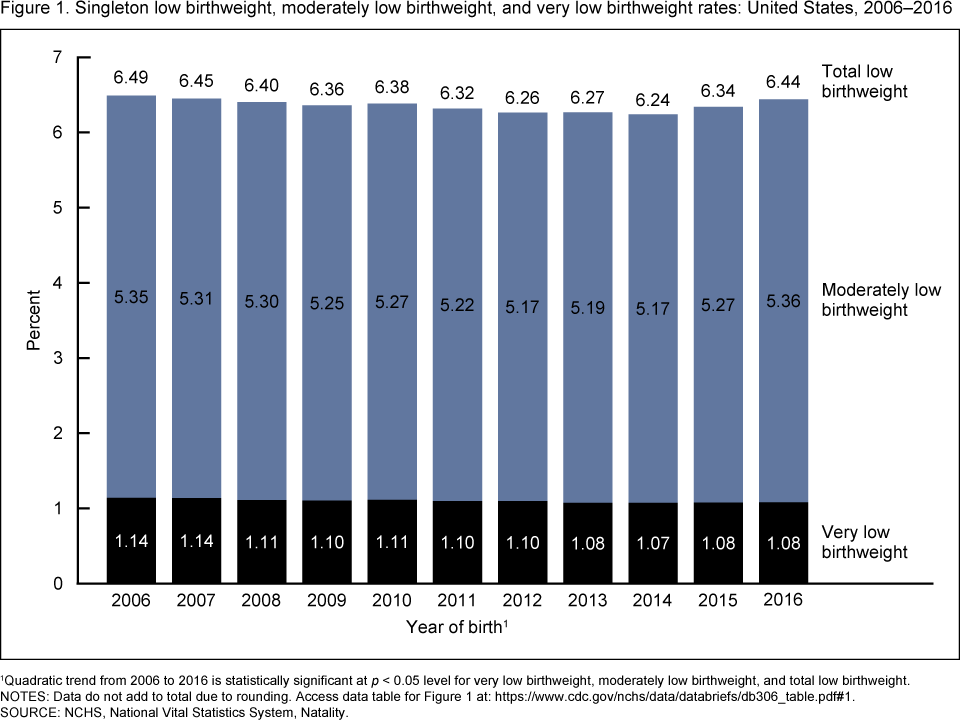
1Quadratic trend from 2006 to 2016 is statistically significant at p < 0.05 level for very low birthweight, moderately low birthweight, and total low birthweight.
NOTES: Data do not add to total due to rounding. Access data table for Figure 1.
SOURCE: NCHS, National Vital Statistics System, Natality.
Singleton LBW rates increased for each race and Hispanic-origin group in 2015 and 2016.
- After declining from 11.85% in 2006 to just under 11.00% in 2013 and 2014, the LBW rate for non-Hispanic black infants increased in 2015 (11.17%) and 2016 (11.36%) (Figure 2).
- The rate of LBW for Hispanic infants was stable from 2006 to 2014 (5.79% in 2014) and then increased to 5.92% in 2015 and 6.04% in 2016.
- After declining from 5.37% in 2006 to a low of 5.10% in 2012, the rate of LBW for non-Hispanic white infants was essentially stable for 2012–2014, and then increased to 5.13% in 2015 and 5.21% in 2016.
- The LBW rate was more than twice as high for non-Hispanic black infants as for non-Hispanic white infants throughout the entire period (11.36% compared with 5.21% in 2016).
Figure 2. Singleton low birthweight rates, by race and Hispanic origin: United States, 2006–2016
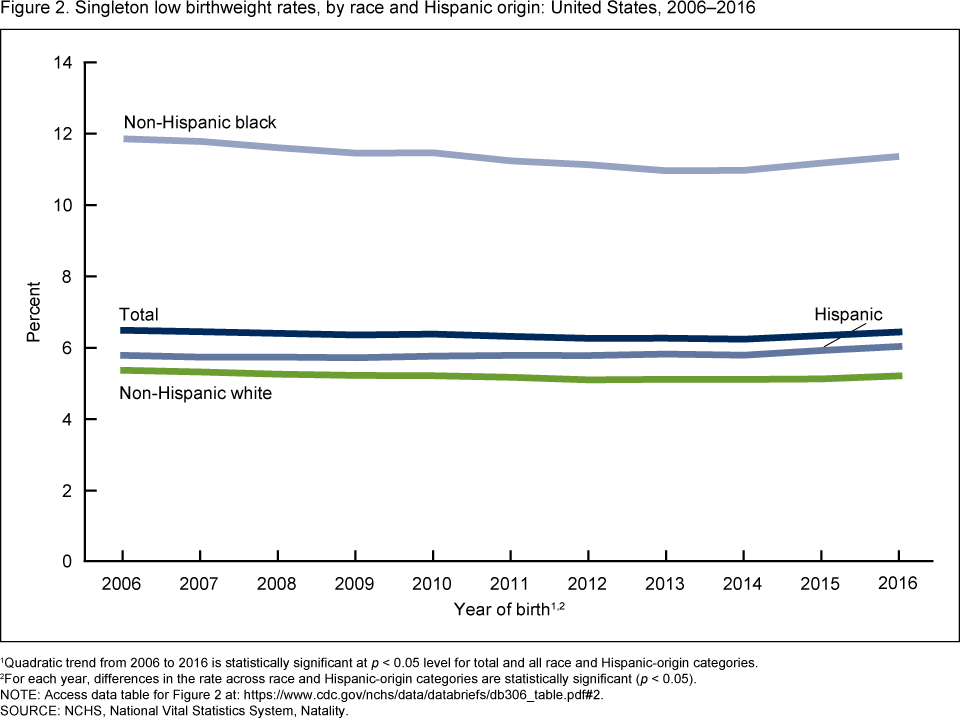
1Quadratic trend from 2006 to 2016 is statistically significant at p < 0.05 level for total and all race and Hispanic-origin categories.
2For each year, differences in the rate across race and Hispanic-origin categories are statistically significant (p < 0.05).
NOTE: Access data table for Figure 2.
SOURCE: NCHS, National Vital Statistics System, Natality.
For each race and Hispanic-origin group, increases in LBW from 2014 to 2016 were largely due to increases in MLBW.
- Among non-Hispanic black infants, the LBW rate increased (from 10.97% in 2014 to 11.36% in 2016), reflecting the increase in the MLBW rate (from 8.62% in 2014 to 8.98% in 2016) (Figure 3); VLBW rates remained stable during the same period.
- Total LBW increased for Hispanic infants from 2014 to 2016 (5.79% to 6.04%), as did the MLBW rate (4.80% in 2014 to 5.03% in 2016); VLBW rates remained stable during the same period.
- Among non-Hispanic white infants, total LBW increased from 5.11% to 5.21% due to an increase in the rate of MLBW from 2014 to 2016 (4.33% to 4.44%). The rate of VLBW was stable.
- Singleton MLBW rates for non-Hispanic black infants were twice as high as the rates for non-Hispanic white infants throughout the study period (8.98% compared with 4.44% in 2016).
- Singleton VLBW rates for non-Hispanic black infants were more than three times as high as the rates for non-Hispanic white infants throughout the entire period (2.39% compared with 0.77% in 2016).
Figure 3. Singleton low birthweight, moderately low birthweight, and very low birthweight rates, by race and Hispanic origin: United States, 2014–2016
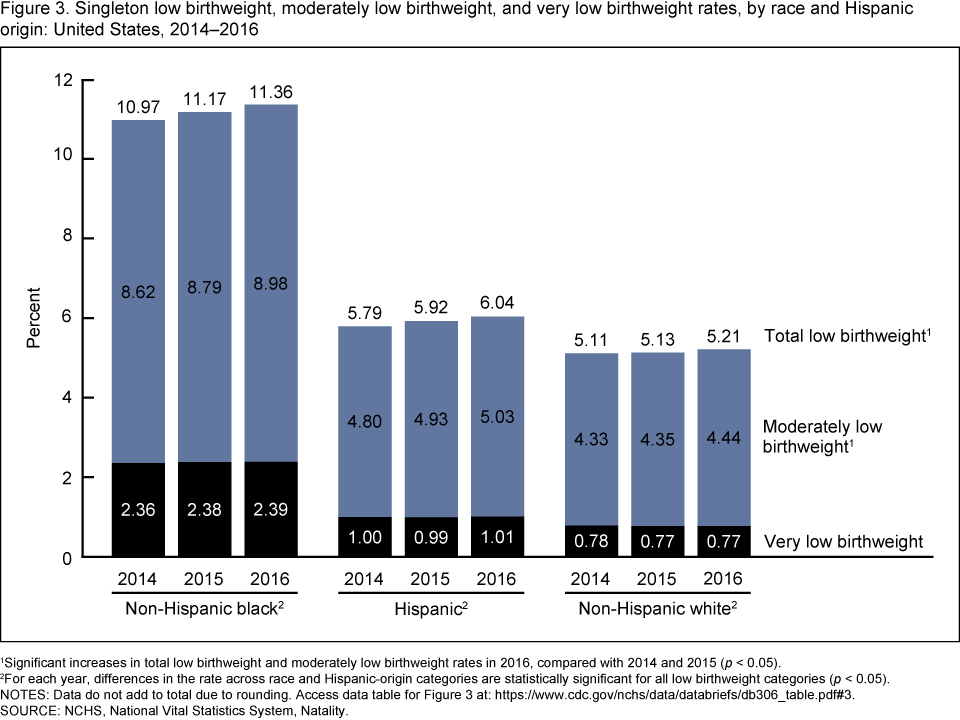
1Significant increases in total low birthweight and moderately low birthweight rates in 2016, compared with 2014 and 2015 (p < 0.05).
2For each year, differences in the rate across race and Hispanic-origin categories are statistically significant for all low birthweight categories (p < 0.05).
NOTES: Data do not add to total due to rounding. Access data table for Figure 3.
SOURCE: NCHS, National Vital Statistics System, Natality.
Summary
After declining from 2006 to 2014, the rate of singleton LBW increased in the United States in 2015 and 2016. The increase in singleton LBW was attributable to increases in MLBW, as VLBW rates were stable. Increases in the rates of singleton overall LBW and MLBW are evident for the three largest racial and ethnic subgroups: non-Hispanic black, Hispanic, and non-Hispanic white. For each race and Hispanic-origin group, the increases in singleton LBW were primarily driven by increases in MLBW births. Restricting this analysis to singleton births revealed similar trends in LBW among singletons compared with trends of LBW among all births (singletons and multiples) from 2006 to 2016 (4).
Definitions
Low birthweight rate: Number of births delivered at less than 2,500 grams per 100 births.
Moderately low birthweight rate: Number of births delivered between 1,500 grams and
2,499 grams per 100 births.
Very low birthweight rate: Number of births delivered at less than 1,500 grams per 100 births.
Race and Hispanic origin: Race and Hispanic origin are reported separately on birth certificates. Persons of Hispanic origin may be of any race. Persons of non-Hispanic ancestry are further classified by race because there are substantial differences in fertility and maternal characteristics between Hispanic and non-Hispanic persons. Multiple-race data reported since 2003 were bridged to single-race categories for comparability among states and for trend analyses.
Data source and methods
This report is based on data from the Natality Data File from the National Vital Statistics System. The vital statistics natality file is based on information derived from birth certificates and includes information for all births occurring in the United States. The vital statistics natality file is the primary data set for analyzing birth trends and patterns in the United States. Natality data sets are available from: https://www.cdc.gov/nchs/data_access/vitalstatsonline.htm.
Computations exclude records for multiple births (3.44%) and records for which information on birthweight is unknown (0.10%). Linear and quadratic trends over time were tested using orthogonal polynomials. All differences reported are statistically significant at the p < 0.05 level using a z test for difference of proportions (4). Data management and statistical analyses were conducted using SAS system for Windows version 9.4 (SAS Institute, Inc., Cary, N.C.).
About the authors
Lindsay S. Womack is with the Centers for Disease Control and Prevention’s Epidemic Intelligence Service, assigned to the National Center for Health Statistics (NCHS) Division of Vital Statistics. Lauren M. Rossen and Joyce A. Martin are with NCHS’ Division of Vital Statistics.
References
- Heron M. Deaths: Leading causes for 2015. National Vital Statistics Reports; vol 66 no 5. Hyattsville, MD: National Center for Health Statistics. 2017.
- March of Dimes. Low birthweight. White Plains, NY.
- Martin JA, Hamilton BE, Sutton PD, Ventura SJ, Menacker F, Kirmeyer S, Mathews TJ. Births: Final data for 2006. National Vital Statistics Reports; No. 57 no 7. Hyattsville, MD: National Center for Health Statistics. 2009.
- Martin JA, Hamilton BE, Osterman MJK, Driscoll AK, Drake P. Births: Final data for 2016. National Vital Statistics Reports; vol 67 no 1. Hyattsville, MD: National Center for Health Statistics. 2018.
- U.S. Department of Health and Human Services. Healthy People 2020. Maternal, infant, and child health.
- Blondel B, Kogan MD, Alexander GR, Dattani N, Kramer MS, Macfarlane A, Wen SW. The impact of the increasing number of multiple births on the rates of preterm birth and low birthweight: An international study. Am J Public Health 92(8):1323–30. 2002.
Suggested citation
Womack LS, Rossen LM, Martin JA. Singleton low birthweight rates, by race and Hispanic origin: United States, 2006–2016. NCHS Data Brief, no 306. Hyattsville, MD: National Center for Health Statistics. 2018.
Copyright information
All material appearing in this report is in the public domain and may be reproduced or copied without permission; citation as to source, however, is appreciated.
National Center for Health Statistics
Charles J. Rothwell, M.S., M.B.A., Director
Jennifer H. Madans, Ph.D., Associate Director for Science
Division of Vital Statistics
Delton Atkinson, M.P.H., M.P.H., P.M.P., Director
Hanyu Ni, Ph.D., M.P.H., Associate Director for Science