Differences Between Rural and Urban Areas in Mortality Rates for the Leading Causes of Infant Death: United States, 2013–2015
- Key findings
- Rural counties had higher infant, neonatal, and postneonatal mortality rates than large urban counties.
- The mortality rate for the five leading causes of infant death varied by urbanization level.
- Rural counties had lower neonatal mortality rates for two of the five leading causes of neonatal death compared with small and medium urban and large urban counties.
- The postneonatal mortality rate was higher in rural counties than in large urban counties for four of the five leading causes of postneonatal death.
- Summary
- Definitions
- Data sources and methods
- About the authors
- References
- Suggested citation
NCHS Data Brief No. 300, February 2018
PDF Version (404 KB)
Danielle M. Ely, Ph.D., and Donna L. Hoyert, Ph.D.
Key findings
Data from the National Vital Statistics System
- Infant, neonatal, and postneonatal mortality rates were higher in rural counties than in large urban counties.
- Infant mortality rates for congenital malformations, sudden infant death syndrome, and unintentional injuries were highest in rural counties and lowest in large urban counties; rural counties had the lowest infant mortality rates for low birthweight and maternal complications.
- The neonatal mortality rate for congenital malformations was highest in rural counties (105.12 per 100,000 live births), followed by small and medium urban counties (94.07) and large urban counties (77.03).
- Postneonatal mortality rates for sudden infant death syndrome, congenital malformations, and unintentional injuries were highest in rural counties and lowest in large urban counties.
The leading causes of infant death vary by age at death but were consistent from 2005 to 2015 (1–6). Previous research shows higher infant mortality rates in rural counties compared with urban counties and differences in cause of death for individuals aged 1 year and over by urbanization level (4,5,7,8). No research, however, has examined if mortality rates from the leading causes of infant death differ by urbanization level. This report describes the mortality rates for the five leading causes of infant, neonatal, and postneonatal death in the United States across rural, small and medium urban, and large urban counties defined by maternal residence, as reported on the birth certificate for combined years 2013–2015.
Keywords: infant mortality, cause of death, National Vital Statistics System
Rural counties had higher infant, neonatal, and postneonatal mortality rates than large urban counties.
- In 2013–2015, the infant mortality rate was highest in rural counties (6.69 infant deaths per 1,000 live births), followed by small and medium urban counties (6.29) and large urban counties (5.49) (Figure 1).
- Neonatal mortality rates were higher in rural counties (4.21 neonatal deaths per 1,000 live births) and small and medium urban counties (4.15) than in large urban counties (3.83); there were no significant differences between rural counties and small and medium urban counties in the neonatal mortality rate.
- Postneonatal mortality rates were highest in rural counties (2.48 postneonatal deaths per 1,000 live births), followed by small and medium urban (2.14) and large urban (1.66) counties.
Figure 1. Total infant, neonatal, and postneonatal mortality rates, by urbanization level:
United States, 2013–2015
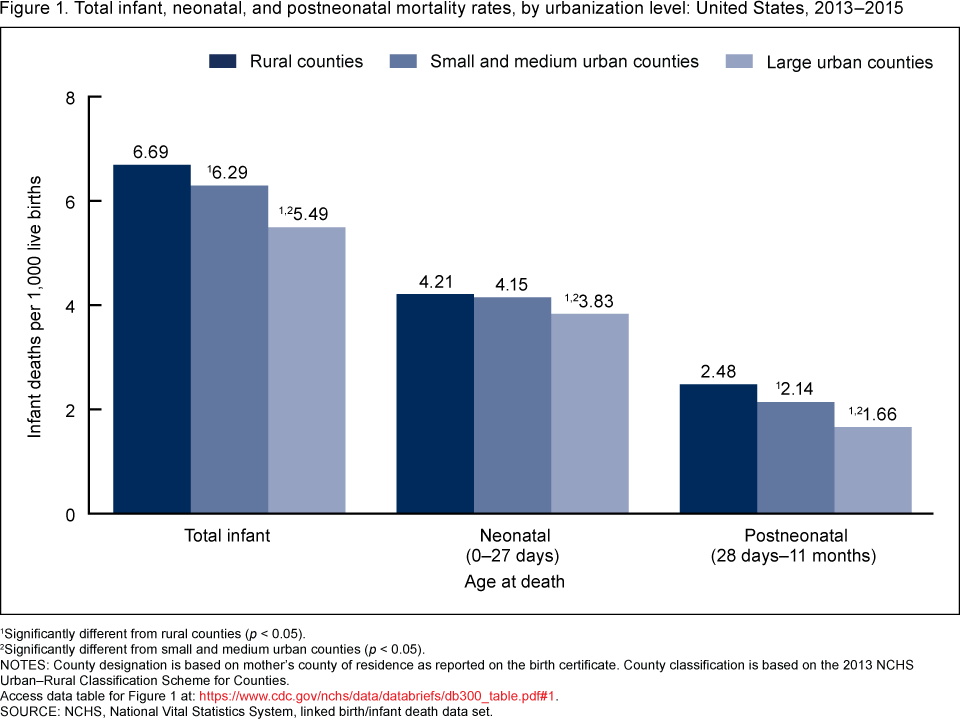
1Significantly different from rural counties (p < 0.05).
2Significantly different from small and medium urban counties (p < 0.05).
NOTES: County designation is based on mother’s county of residence as reported on the birth certificate. County classification is based on the 2013 NCHS Urban–Rural Classification Scheme for Counties. Access data table for Figure 1.
SOURCE: NCHS, National Vital Statistics System, linked birth/infant death data set.
The mortality rate for the five leading causes of infant death varied by urbanization level.
- In 2013–2015, the infant mortality rate for congenital malformations, sudden infant death syndrome, and unintentional injuries was highest in rural counties, lower in small and medium urban counties, and lowest in large urban counties (Figure 2).
- Rural counties had a lower infant mortality rate for low birthweight (95.99 infant deaths per 100,000 live births), compared with small and medium urban counties (105.70) and large urban counties (106.46).
- Rural counties also had a lower infant mortality rate for maternal complications (32.78) compared with small and medium urban counties (41.68) and large urban counties (40.02).
Figure 2. Infant mortality rates for the five leading causes of infant death, by urbanization level: United States, 2013–2015
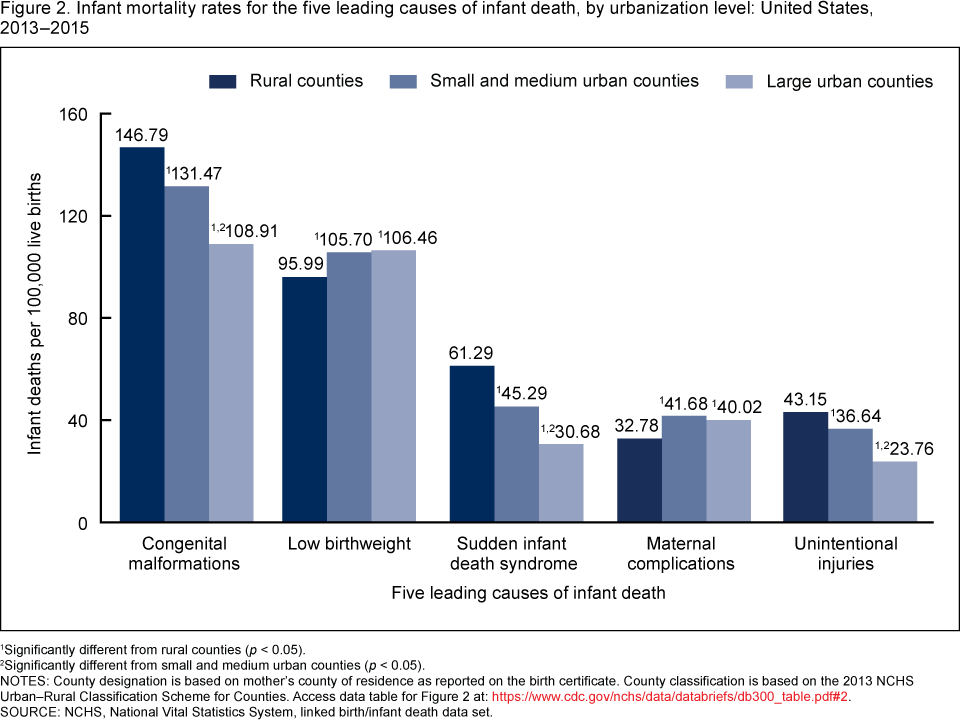
1Significantly different from rural counties (p < 0.05).
2Significantly different from small and medium urban counties (p < 0.05).
NOTES: County designation is based on mother’s county of residence as reported on the birth certificate. County classification is based on the 2013 NCHS Urban–Rural Classification Scheme for Counties. Access data table for Figure 2.
SOURCE: NCHS, National Vital Statistics System, linked birth/infant death data set.
Rural counties had lower neonatal mortality rates for two of the five leading causes of neonatal death compared with small and medium urban and large urban counties.
- In 2013–2015, rural counties had a lower neonatal mortality rate for low birthweight (93.21 neonatal deaths per 100,000 live births) compared with small and medium urban and large urban counties (103.47 and 103.96, respectively) (Figure 3).
- Rural counties also had a lower neonatal mortality rate for maternal complications (32.72) than small and medium urban and large urban counties (41.45 and 39.72, respectively).
- In contrast, the neonatal mortality rate for congenital malformations was highest in rural counties (105.12), followed by small and medium urban (94.07) and large urban (77.03) counties.
- There were no significant differences by urbanization level in neonatal mortality rates for deaths from placenta, cord, and membrane complications or bacterial sepsis of the newborn.
Figure 3. Neonatal mortality rates for the five leading causes of neonatal death, by urbanization level: United States, 2013–2015
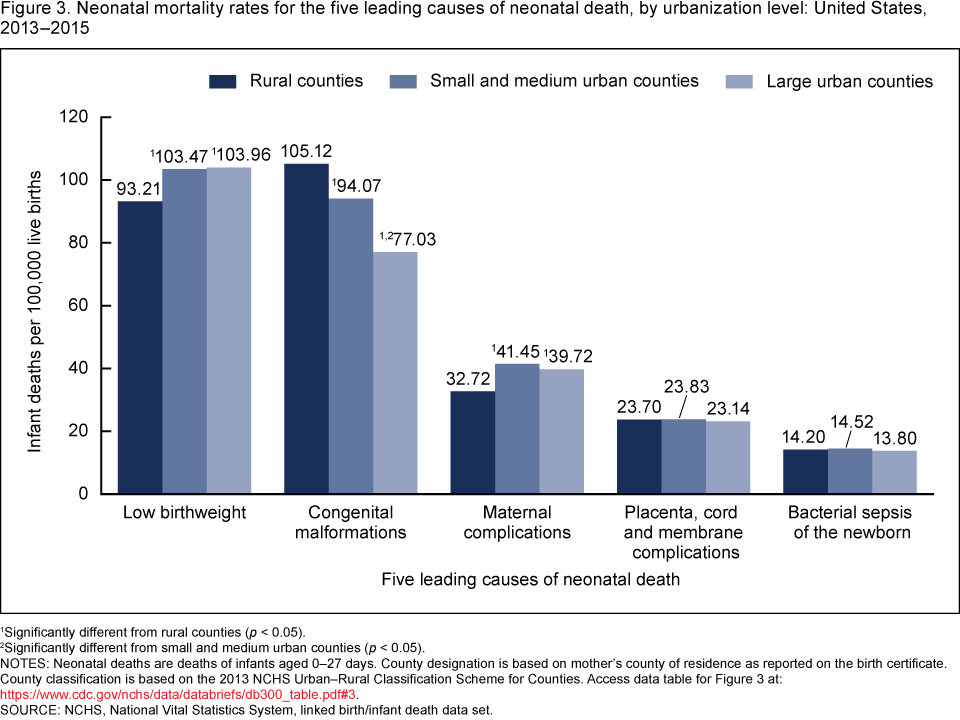
1Significantly different from rural counties (p < 0.05).
2Significantly different from small and medium urban counties (p < 0.05).
NOTES: Neonatal deaths are deaths of infants aged 0–27 days. County designation is based on mother’s county of residence as reported on the birth certificate. County classification is based on the 2013 NCHS Urban–Rural Classification Scheme for Counties. Access data table for Figure 3.
SOURCE: NCHS, National Vital Statistics System, linked birth/infant death data set.
The postneonatal mortality rate was higher in rural counties than in large urban counties for four of the five leading causes of postneonatal death.
- In 2013–2015, the postneonatal mortality rate for sudden infant death syndrome, congenital malformations, and unintentional injuries was highest in rural counties, followed by small and medium urban and large urban counties (Figure 4).
- The postneonatal mortality rate for homicide was higher in rural counties (8.27 infant deaths per 100,000 live births) than in large urban counties (4.98); the postneonatal mortality rate for homicide in small and medium urban counties (7.33) was not significantly different from rural or large urban counties.
- The postneonatal mortality rate for diseases of the circulatory system was higher in small and medium urban counties (10.15) than in large urban counties (7.98); the postneonatal mortality rate for diseases of the circulatory system in rural counties (8.58) was not significantly different from small and medium urban or large urban counties.
Figure 4. Postneonatal mortality rates for the five leading causes of postneonatal death, by urbanization level: United States, 2013–2015
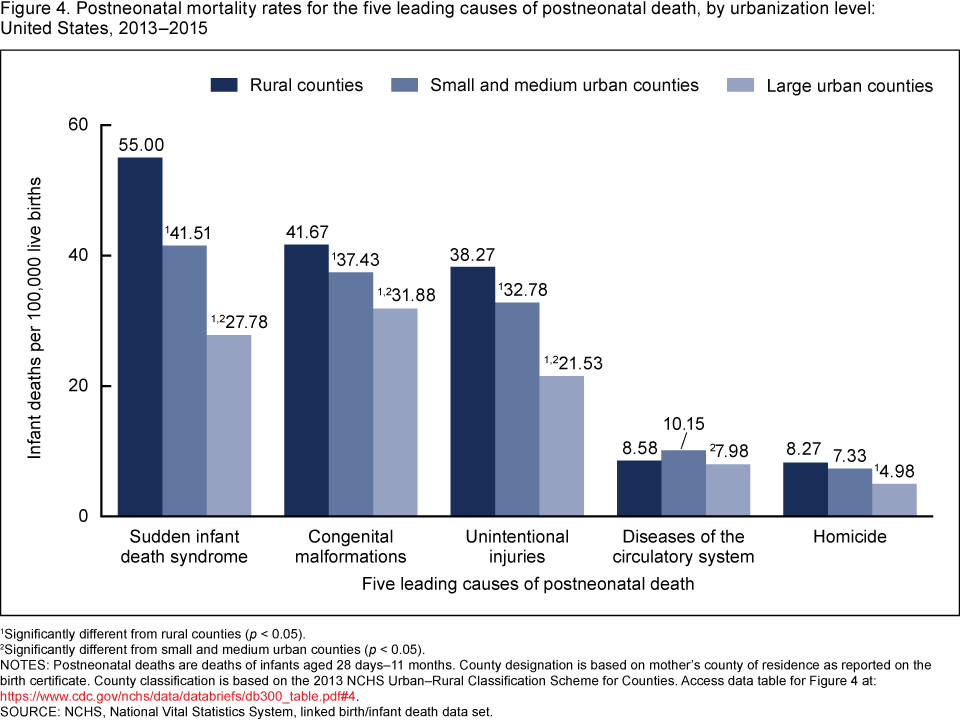
1Significantly different from rural counties (p < 0.05).
2Significantly different from small and medium urban counties (p < 0.05).
NOTES: Postneonatal deaths are deaths of infants aged 28 days–11 months. County designation is based on mother’s county of residence as reported on the birth certificate. County classification is based on the 2013 NCHS Urban–Rural Classification Scheme for Counties. Access data table for Figure 4.
SOURCE: NCHS, National Vital Statistics System, linked birth/infant death data set.
Summary
Previous research indicates the importance of maternal conditions during pregnancy for birth outcomes and later health conditions (9–13). Specifically, evidence shows that poor social conditions (e.g., poverty), maternal health behaviors during pregnancy (e.g., smoking), and disadvantaged community environments (e.g., less access to health care services) impact infant health and infant mortality (9,10,12,13). By using maternal residence provided on the birth certificate to examine infant causes of death by urbanization level, it is possible to capture differences in mortality rates that could be related to differences in conditions during pregnancy.
In 2013–2015, total infant and postneonatal mortality rates were highest in rural counties, followed by small and medium urban counties; the lowest rates were in large urban counties. Rural and small and medium urban counties had higher neonatal mortality rates compared with large urban counties. Of the three urbanization areas, rural counties had the highest neonatal mortality rates for congenital malformations, followed by small and medium urban counties; large urban counties had the lowest. Rural counties had higher postneonatal mortality rates compared with large urban counties for sudden infant death syndrome, congenital malformations, unintentional injuries, and homicide. Postneonatal mortality rates in small and medium urban counties for sudden infant death syndrome, congenital malformations, and unintentional injuries were lower than the rates in rural counties and higher than the rates in large urban counties. Neonatal mortality rates for low birthweight and maternal complications of pregnancy were lower in rural counties than in small and medium urban and large urban counties. These results are consistent with other research showing differences between rural and urban places in cause of death and mortality rates for individuals aged 1 year and over (5,8).
These findings add to general knowledge on infant mortality and expand insight into geographic differences in risk of infant death by specific causes of death.
Definitions
Cause-of-death classification: Medical information—including injury diagnoses and external causes of injury—is entered on death certificates filed in the United States and classified and coded in accordance with the International Statistical Classification of Diseases and Related Health Problems, Tenth Revision (ICD–10) (7). Corresponding abbreviations of infant cause-of-death categories and ICD–10 codes presented in this report are:
- Diseases of the circulatory system (I00–I99)
- Maternal complications: Newborn affected by maternal complications of pregnancy (P01)
- Placenta, cord and membrane complications: Newborn affected by complications of placenta, cord and membranes (P02)
- Low birthweight: Disorders related to short gestation and low birthweight, not elsewhere classified (P07)
- Bacterial sepsis of the newborn (P36)
- Congenital malformations: Congenital malformations, deformations and chromosomal abnormalities (Q00–Q99)
- Sudden infant death syndrome (R95)
- Unintentional injuries: Accidents (unintentional injuries [V01–X59])
- Homicide: Assault (homicide [*U01, X85–Y09])
Infant mortality rate: Number of infant (under age 1 year) deaths per 1,000 live births.
Leading causes of death: Ranked according to the number of deaths assigned to rankable causes (3).
Neonatal deaths: Deaths of infants aged 0–27 days.
Postneonatal deaths: Deaths of infants aged 28 days–11 months.
Urbanization level: County classification as urban or rural is based on the county of maternal residence provided on the birth certificate (8). Counties were classified according to their metropolitan status using the NCHS (National Center for Health Statistics) Urban–Rural Classification Scheme for Counties, by merging the county of maternal residence’s geographic federal information processing standard (FIPS) codes with county-level FIPS codes from the 2013 NCHS Urban–Rural Classification Scheme for Counties data set. Metropolitan counties include large central counties, the fringes of large counties (suburbs), medium counties, and small counties. Nonmetropolitan counties include micropolitan statistical areas and noncore areas, including open countryside, rural towns (populations of less than 2,500), and areas with populations of 2,500–49,999 that are not part of larger labor market areas (metropolitan areas). Due to the variation in urban county sizes, two sizes of urban counties were created—large (large central and the fringes of large cities) and small and medium urban (which includes medium and small cities)—for comparative purposes. In this report, rural counties include micropolitan and noncore counties.
Data sources and methods
This report contains data from the period linked birth/infant death data set, which is part of the National Vital Statistics System (14). The period linked birth/infant death data set includes all infant deaths under age 1 year reported on death certificates and all live births reported from birth certificates (14). The period linked birth/infant death data set is the primary data set for analyzing infant mortality trends and patterns in the United States and is the only source for examining race and Hispanic-origin infant mortality and other factors related to birth (14). Linked birth/infant death data sets are available from: https://www.cdc.gov/nchs/data_access/vitalstatsonline.htm.
The five leading causes of infant, neonatal, and postneonatal death are identified from the 2013–2015 mortality data (1,3). The five leading causes of infant death (congenital malformations, low birthweight, sudden infant death syndrome, maternal complications, and unintentional injuries), neonatal death (low birthweight; congenital malformations; maternal complications; placenta, cord and membrane complications; and bacterial sepsis of the newborn), and postneonatal death (sudden infant death syndrome, congenital malformations, unintentional injuries, diseases of the circulatory system, and homicide) were consistent from 2013 to 2015 (1,3).
Data from the NCHS Urban–Rural Classification Scheme for Counties provide geographic FIPS codes and urban–rural classification scheme information for all counties in the United States. The NCHS county classification scheme data are available from: https://www.cdc.gov/nchs/data_access/urban_rural.htm.
References to rates indicate that differences are statistically significant at the 0.05 level (15).
About the authors
Danielle M. Ely and Donna L. Hoyert are with the National Center for Health Statistics, Division of Vital Statistics.
References
- Heron M. Deaths: Leading causes for 2014. National Vital Statistics Reports; vol 65 no 5. Hyattsville, MD: National Center for Health Statistics. 2016.
- Heron M, Tejada-Vera B. Deaths: Leading causes for 2005. National Vital Statistics Reports; vol 58 no 8. Hyattsville, MD: National Center for Health Statistics. 2009.
- Heron M. Deaths: Leading causes for 2015. National Vital Statistics Reports; vol 66 no 5. Hyattsville, MD: National Center for Health Statistics. 2017.
- Ely DM, Driscoll AK, Mathews TJ. Infant mortality rates in rural and urban areas in the United States, 2014. NCHS Data Brief, no 285. Hyattsville, MD: National Center for Health Statistics. 2017.
- Meit M, Knudson A, Gilbert T, Yu ATC, Tanenbaum E, Ormson E, et al. The 2014 update of the rural-urban chartbook. Rural Health Reform Policy Research Center. 2014.
- CDC. National Center for Health Statistics, linked birth/infant death records 1995–2015, as compiled from data provided by the 57 vital statistics jurisdictions through the Vital Statistics Cooperative Program, on CDC WONDER Online Database.
- WHO. International statistical classification of diseases and related health problems, tenth revision (ICD–10). 2008 ed. Geneva, Switzerland. 2009.
- Ingram DD, Franco SJ. NCHS urban–rural classification scheme for counties. National Center for Health Statistics. Vital Health Stat 2(154). 2012.
- Hayward MD, Gorman BK. The long arm of childhood: The influence of early-life social conditions on men’s mortality. Demography 41(1):87–107. 2004.
- Sparks PJ, McLaughlin DK, Stokes CS. Differential neonatal and postneonatal infant mortality rates across US counties: The role of socioeconomic conditions and rurality. J Rural Health 25(4):332–41. 2009.
- National Institute of Child Health and Human Development. Are there ways to reduce the risk of infant mortality?
- Healthy People 2020. Maternal, infant, and child health.
- Huynh M, Parker JD, Harper S, Pamuk E, Schoendorf KC. Contextual effect of income inequality on birth outcomes. Int J Epidemiol 34(4):888–95. 2005.
- Mathews TJ, MacDorman MF, Thoma ME. Infant mortality statistics from the 2013 period linked birth/infant death data set. National Vital Statistics Reports; vol 64 no 9. Hyattsville, MD: National Center for Health Statistics. 2015.
- Martin JA, Hamilton BE, Osterman MJK, Driscoll AK, Mathews TJ. Births: Final data for 2015. National Vital Statistics Reports; vol 66 no 1. Hyattsville, MD: National Center for Health Statistics. 2017.
Suggested citation
Ely DM, Hoyert DL. Differences between rural and urban areas in mortality rates for the leading causes of infant death: United States, 2013–2015. NCHS Data Brief, no 300. Hyattsville, MD: National Center for Health Statistics. 2018.
Copyright information
All material appearing in this report is in the public domain and may be reproduced or copied without permission; citation as to source, however, is appreciated.
National Center for Health Statistics
Charles J. Rothwell, M.S., M.B.A., Director
Jennifer H. Madans, Ph.D., Associate Director for Science
Division of Vital Statistics
Delton Atkinson, M.P.H., M.P.H., P.M.P., Director
Hanyu Ni, Ph.D., M.P.H., Associate Director for Science