Urban and Rural Variation in Fertility-related Behavior Among U.S. Women, 2011–2015
- Key findings
- On average, women living in rural areas had their first sexual intercourse earlier than women living in urban areas.
- Similar percentages of women in urban and rural areas were currently married, cohabiting, or never married, while a higher percentage of women living in rural areas were formerly married.
- A higher percentage of women in rural areas had at least one birth, two births, and three or more births and had a higher average number of births.
- A higher percentage of women in rural areas used one of the most effective methods of contraception at last sexual intercourse in the past year.
- Summary
- Definitions
- Data sources and methods
- About the authors
- References
- Suggested citation
NCHS Data Brief No. 297, January 2018
PDF Version (450 KB)
Kimberly Daniels, Ph.D., Gladys M. Martinez, Ph.D., and Colleen N. Nugent, Ph.D.
Key findings
Data from the National Survey of Family Growth
- Among women aged 18–44, the average age at first sexual intercourse was younger for women living in rural areas (16.6) compared with women living in urban areas (17.4).
- Similar percentages of women living in urban and rural areas were currently married, cohabiting, or never married. A higher percentage of women living in rural areas were formerly married.
- A higher percentage of women living in rural areas had at least one birth compared with women in urban areas.
- A higher percentage of women living in rural areas used one of the most effective methods of contraception (e.g., contraceptive sterilization or intrauterine device) at last sexual intercourse in the past year compared with women in urban areas.
In 2010, one-fifth of the U.S. population lived in rural areas (1). There is known variation in social, demographic, and health characteristics across urban and rural residence (1–3). Recent National Center for Health Statistics (NCHS) reports show higher teen birth and infant mortality rates in rural counties than in urban counties (4,5). Less is known about urban and rural variation in fertility-related behavior, such as sexual activity and contraceptive use. Using National Survey of Family Growth (NSFG) data from 2011 through 2015 for women aged 18–44, this report describes urban-rural differences in first sexual intercourse, marital and cohabitation status, number of births, and contraceptive use based on residence at the time of interview.
Keywords: metropolitan, births, marriage, cohabitation, National Survey of Family Growth
On average, women living in rural areas had their first sexual intercourse earlier than women living in urban areas.
- Among women aged 18–44, a higher percentage of women living in rural areas (51.2%) had their first sexual intercourse by age 16 compared with women in urban areas (41.7%) (Figure 1).
- By age 18, 79.6% of women living in rural areas had ever had sexual intercourse, which is higher than the percentage for women living in urban areas (68.6%).
- The mean age at first sexual intercourse was younger among women in rural areas (16.6 years) compared with women in urban areas (17.4 years).
Figure 1. Percentage of women who had their first sexual intercourse by age 16 and by age 18 among women aged 18–44, by urban and rural residence: United States, 2011–2015
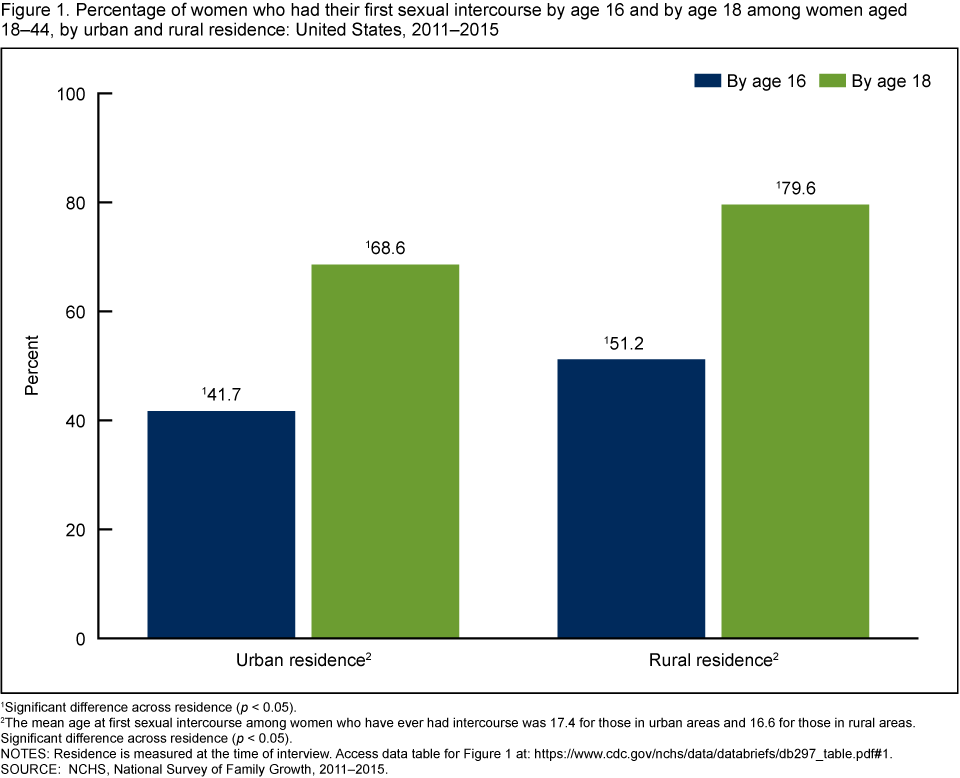
1Significant difference across residence (p < 0.05).
2The mean age at first sexual intercourse among women who have ever had intercourse was 17.4 for those in urban areas and 16.6 for those in rural areas. Significant difference across residence (p < 0.05).
NOTES: Residence is measured at the time of interview. Access data table for Figure 1.
SOURCE: NCHS, National Survey of Family Growth, 2011–2015.
Similar percentages of women in urban and rural areas were currently married, cohabiting, or never married, while a higher percentage of women living in rural areas were formerly married.
- About 40% of women living in both urban and rural areas were currently married to an opposite-sex spouse (Figure 2).
- The percentage of women currently cohabiting with an opposite-sex partner was similar for women in urban (15.7%) and rural (18.6%) areas.
- A higher percentage of women living in rural areas were formerly married but not currently cohabiting (11.6%) compared with women living in urban areas (8.7%).
- Similar percentages of women living in urban and rural areas were never married and not currently cohabiting (33.6% and 29.1%, respectively).
Figure 2. Percent distribution of current marital and cohabitation status among women aged 18–44, by urban and rural residence: United States, 2011–2015
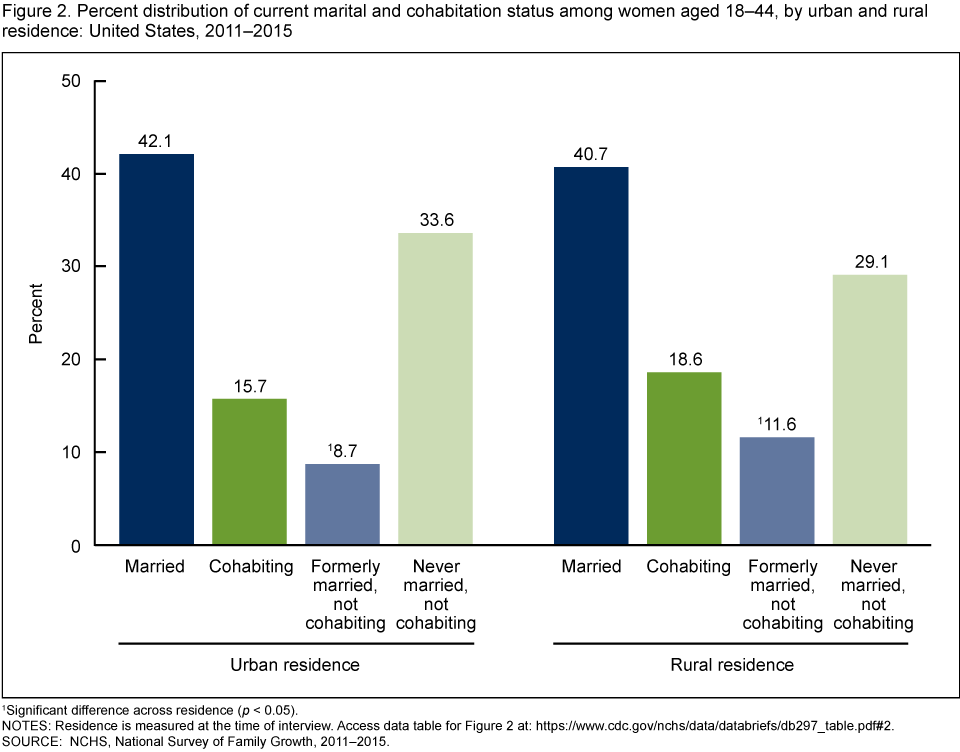
1Significant difference across residence (p < 0.05).
NOTES: Residence is measured at the time of interview. Access data table for Figure 2.
SOURCE: NCHS, National Survey of Family Growth, 2011–2015.
A higher percentage of women in rural areas had at least one birth, two births, and three or more births and had a higher average number of births.
- A higher percentage of women living in urban areas had no births (41.6%) compared with women living in rural areas (30.3%). A higher percentage of women living in rural areas had any births (69.7%) compared with women in urban areas (58.4%) (Figure 3).
- A similar percentage of women in urban areas had one birth (18.4%) compared with women in rural areas (19.2%).
- A higher percentage of women living in rural areas had two births (25.7%) compared with women living in urban areas (20.9%).
- A higher percentage of women living in rural areas had three or more births (24.8%) compared with women living in urban areas (19.0%).
- The average number of births among women aged 18–44 living in rural areas (1.56) was higher than the average for women in urban areas (1.28).
Figure 3. Percent distribution of number of births to women aged 18–44, by urban and rural residence: United States, 2011–2015
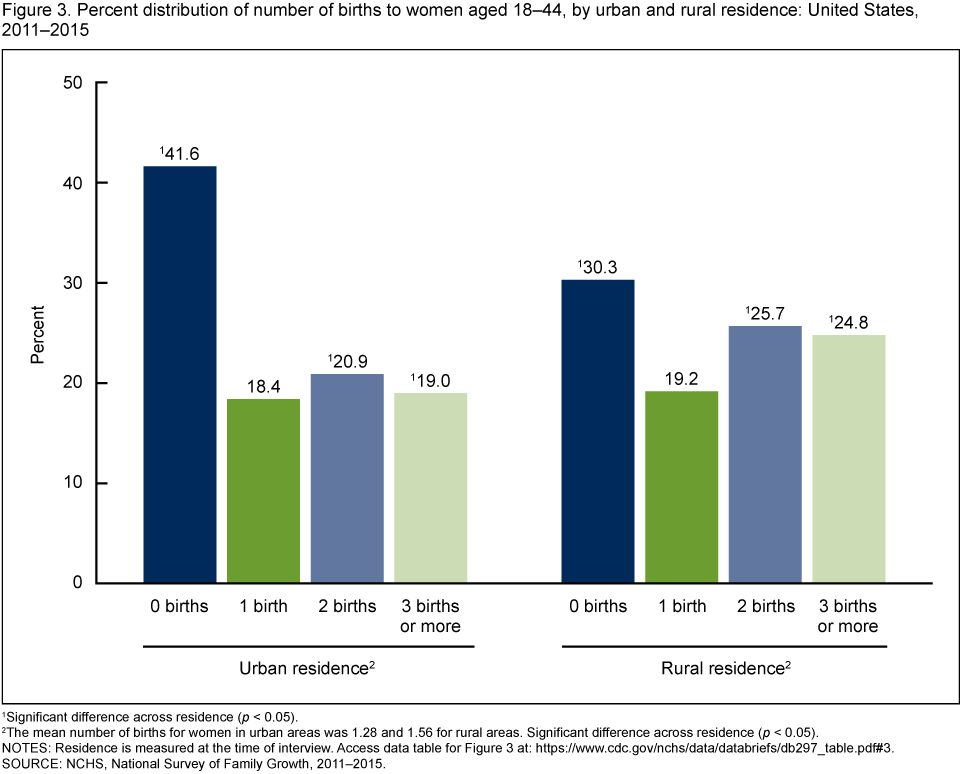
1Significant difference across residence (p < 0.05).
2The mean number of births for women in urban areas was 1.28 and 1.56 for rural areas. Significant difference across residence (p < 0.05).
NOTES: Residence is measured at the time of interview. Access data table for Figure 3.
SOURCE: NCHS, National Survey of Family Growth, 2011–2015.
A higher percentage of women in rural areas used one of the most effective methods of contraception at last sexual intercourse in the past year.
- Among women aged 18–44 who had sexual intercourse in the past year, similar percentages of women in urban and rural areas used no method of contraception at last sexual intercourse in the past year (21.0%) (Figure 4).
- A higher percentage of women in urban areas used a less effective (e.g., condom or withdrawal) (25.4%) or moderately effective (e.g., oral contraceptive pill or injectable) (23.3%) method of contraception compared with women in rural areas (18.6% and 19.6%, respectively).
- A higher percentage of women in rural areas used one of the most effective methods of contraception (e.g., contraceptive sterilization or intrauterine device) (40.8%) compared with women in urban areas (30.4%).
Figure 4. Percent distribution of contraceptive method use at last sexual intercourse in the last 12 months among women aged 18–44, by urban and rural residence: United States, 2011–2015
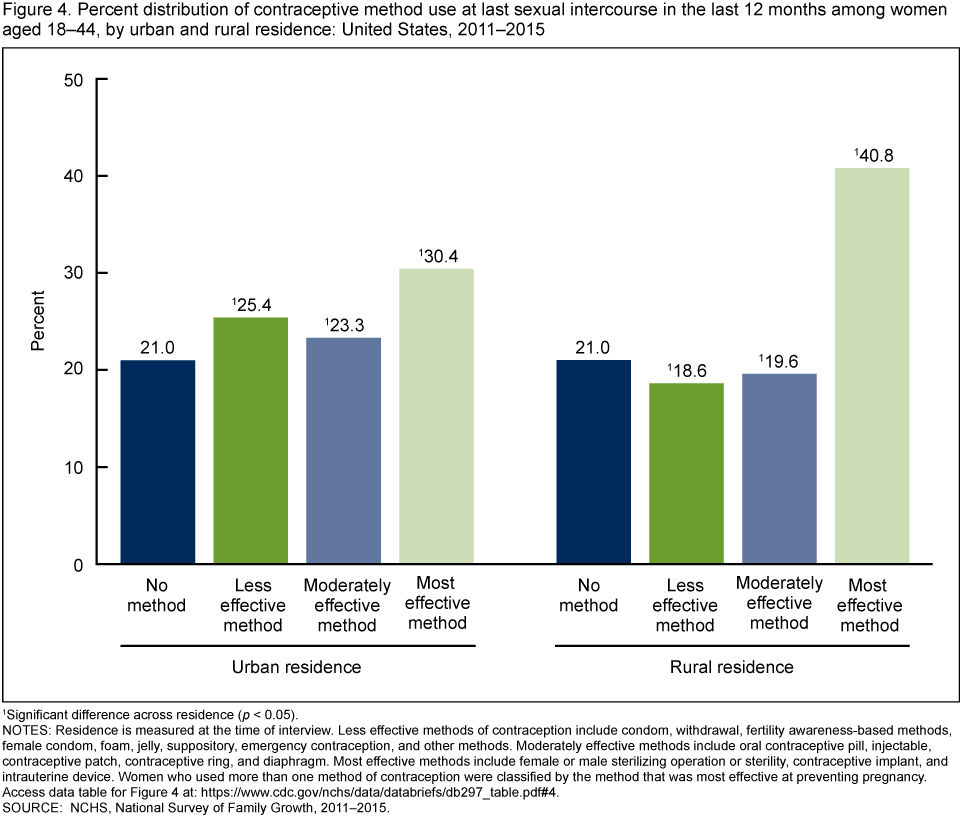
1Significant difference across residence (p < 0.05).
NOTES: Residence is measured at the time of interview. Less effective methods of contraception include condom, withdrawal, fertility awareness-based methods, female condom, foam, jelly, suppository, emergency contraception, and other methods. Moderately effective methods include oral contraceptive pill, injectable, contraceptive patch, contraceptive ring, and diaphragm. Most effective methods include female or male sterilizing operation or sterility, contraceptive implant, and intrauterine device. Women who used more than one method of contraception were classified by the method that was most effective at preventing pregnancy. Access data table for Figure 4.
SOURCE: NCHS, National Survey of Family Growth, 2011–2015.
Summary
This report describes similarities and differences in age at first sexual intercourse, current marital and cohabitation status, number of births, and contraceptive use among women aged 18–44 by urban and rural residence at the time of interview. On average, women living in rural areas had their first sexual intercourse at younger ages than women living in urban areas. Similar percentages of women in urban and rural areas were currently married, cohabiting, or never married. A higher percentage of women living in rural areas were formerly married compared with women in urban areas. Women living in rural areas were more likely than women living in urban areas to have had any births and had a higher average number of births. Among women aged 18–44 who had sexual intercourse in the past year, a higher percentage of women living in rural areas used one of the most effective methods of contraception at their last intercourse compared with women in urban areas.
Definitions
Age at first sexual intercourse: The NSFG recode VRY1STAG indicates the age the respondent first reported having vaginal sexual intercourse with a male partner. This information is presented as the percentage who had sexual intercourse by age 16 and by age 18. Mean ages at first sexual intercourse are also presented for women who have had sexual intercourse.
Contraceptive use: The NSFG recode METH12M1–4 indicates contraceptive method use at last sexual intercourse in the past year. For this report, methods were grouped into the following four categories based on effectiveness at preventing pregnancy: no method, less effective method (i.e., condom, withdrawal, fertility awareness-based methods, female condom, foam, jelly, suppository, emergency contraception, and other methods), moderately effective method (i.e., oral contraceptive pill, injectable, contraceptive patch, contraceptive ring, and diaphragm), and most effective method (i.e., female or male sterilizing operation or sterility, contraceptive implant, and intrauterine device) (6). Women who used more than one method of contraception were classified by the method that was most effective at preventing pregnancy. Women using no method of contraception may not necessarily be at risk of an unintended pregnancy, because they could be pregnant, postpartum, or seeking a pregnancy.
Marital or cohabitation status: The NSFG recode RMARITAL refers to the respondent’s marital or cohabiting status at the time of interview with regard to opposite-sex partners. In this report, marital status is based on the respondent’s current status regardless of their previous marital status (e.g., if a respondent was formerly married and cohabiting at the time of interview, they are classified as cohabiting in this report).
Number of births: The NSFG recode PARITY indicates the total number of live births the woman has had in her lifetime at the time of interview.
Urban-rural residence: The NSFG recode METRO categorized the respondent’s place of residence at the time of interview, which was identified as a principal city of a metropolitan statistical area (MSA), other MSA, and not MSA. Principal city of MSA and other MSA were classified as urban residence, and not MSA was classified as rural residence. The respondent’s address was classified according to 2010 Census population counts using the Office of Management and Budget definitions released in December 2009 (7).
Data sources and methods
This report is based primarily on interview data from 10,096 women aged 18–44 in the combined 2011–2013 and 2013–2015 NSFG public-use data files. Figure 4 is based on data from the 2011–2013 and 2013–2015 files on 8,382 women aged 18–44 who had sexual intercourse in the last year.
NSFG is a nationally representative survey of women and men aged 15–44 in the U.S. household population. It gathers data on fertility, cohabitation, marriage, divorce, infertility, use of contraception, and general and reproductive health. More information is available on the NSFG website.
As noted above, urban-rural residence was measured at the time of interview. Some of the outcomes presented in this report occurred when the woman lived in another geographic location. Limited sensitivity analyses were conducted to better align the timing of the outcome and the measurement of residence, and results suggest similar findings. For example, restricting the analysis of timing of first intercourse to women aged 15–24 so residence was measured closer in time to average first sexual intercourse, also showed younger ages at first intercourse for women living in rural areas compared with women living in urban areas.
The data presented in this report are bivariate associations that may be explained by other factors. For example, age differences between the two groups could explain differences in the outcomes. However, comparisons of the age distributions of urban and rural women in this report suggest that the distributions are similar. In addition, variation in intentions for future childbearing and other factors may explain differences in contraceptive use (8).
Statistics for this report were produced using the SURVEY procedures in SAS software version 9.4. Percentages were compared using two-tailed t tests at the 5% level. No adjustments were made for multiple comparisons. The data presented in this report are bivariate associations that may be explained by other factors included and not included in this report. NCHS data presentation standards for proportions were followed in this report (9).
About the authors
Kimberly Daniels, Gladys M. Martinez, and Colleen N. Nugent are with the National Center for Health Statistics, Division of Vital Statistics, Reproductive Statistics Branch.
References
- U.S. Census Bureau. Measuring America: Our changing landscape. 2016.
- Meit M, Knudson A, Gilbert T, Yu AT, Tanenbaum E, Ormson E. et al. The 2014 update of the rural-urban chartbook. Rural Health Reform Policy Research Center. Bethesda, MD. 2014.
- CDC. Rural health.
- Hamilton BE, Rossen LM, Branum AM. Teen birth rates for urban and rural areas in the United States, 2007–2015. NCHS Data Brief, no 264. Hyattsville, MD: National Center for Health Statistics. 2016.
- Ely DM, Driscoll AK, Mathews TJ. Infant mortality rates in rural and urban areas in the United States, 2014. NCHS Data Brief, no 285. Hyattsville, MD: National Center for Health Statistics. 2017.
- Hatcher RA, Trussell J, Nelson AL, Cates W, Kowal D, Policar MS. Contraceptive technology. 20th revised ed. New York, NY: Ardent Media. 2011.
- Office of Management and Budget. Bulletin No. 10–02: Update of statistical area definitions and guidance on their uses.
- Daniels K, Daugherty J, Jones J, Mosher WD. Current contraceptive use and variation by selected characteristics among women aged 15–44: United States, 2011–2013. National Center for Health Statistics. National Health Statistics Reports; no 86. 2015.
- Parker JD, Talih M, Malec DJ, Beresovsky V, Carroll M, Gonzalez JF, et al. National Center for Health Statistics data presentation standards for proportions. National Center for Health Statistics. Vital Health Stat 2(175). 2017.
Suggested citation
Daniels K, Martinez GM, Nugent CN. Urban and rural variation in fertility-related behavior among U.S. women, 2011–2015. NCHS Data Brief, no 297. Hyattsville, MD: National Center for Health Statistics. 2018.
Copyright information
All material appearing in this report is in the public domain and may be reproduced or copied without permission; citation as to source, however, is appreciated.
National Center for Health Statistics
Charles J. Rothwell, M.S., M.B.A., Director
Jennifer H. Madans, Ph.D., Associate Director for Science
Division of Vital Statistics
Delton Atkinson, M.P.H., M.P.H., P.M.P., Director
Hanyu Ni, Ph.D., M.P.H., Associate Director for Science