State Variations in Infant Mortality by Race and Hispanic Origin of Mother, 2013–2015
- Key findings
- Infant mortality rates varied by state from 2013 through 2015.
- In 2013–2015, the lowest mortality rates for infants of non-Hispanic white women occurred mostly in states in the West and Northeast.
- In 2013–2015, five of the nine highest mortality rates for infants of non-Hispanic black women were in Midwestern states.
- For infants of Hispanic women, the mortality rate in the 50 states and D.C. ranged from 3.94 to 7.28 per 1,000 live births in 2013–2015.
- Summary
- Definition
- Data sources and methods
- About the authors
- References
- Suggested citation
NCHS Data Brief No. 295, January 2018
PDF Version (831 KB)
T.J. Mathews, M.S., Danielle M. Ely, Ph.D., and Anne K. Driscoll, Ph.D.
Key findings
Data from the National Vital Statistics System
- In 2013–2015, the infant mortality rate by state ranged from 4.28 per 1,000 live births in Massachusetts to 9.08 in Mississippi.
- Among the 50 states and the District of Columbia (D.C.), the mortality rate for infants of non-Hispanic white women ranged from 2.52 in D.C. to 7.04 in Arkansas.
- For infants of non-Hispanic black women, the mortality rate ranged from 8.27 in Massachusetts to 14.28 in Wisconsin.
- The mortality rate for infants of Hispanic women ranged from 3.94 in Iowa to 7.28 in Michigan.
Infant mortality has long been a basic measure of public health for countries around the world (1–3). While the overall infant mortality rate in the United States is lower than a decade ago, declining 14% from 6.86 infant deaths per 1,000 live births in 2005, a recent high, to 5.90 in 2015, the rate in 2015 was not statistically different from that in 2014 (5.82) (4–6). The variability in infant mortality rates by state and by race and Hispanic origin continues to receive attention (7,8). This report uses linked birth and infant death data from 2013 through 2015 to describe infant mortality rates in the United States by state, and for race and Hispanic-origin groups by state.
Keywords: infant death, infant health, National Vital Statistics System
Infant mortality rates varied by state from 2013 through 2015.
- Among the 50 states and the District of Columbia (D.C.), Mississippi had the highest infant mortality rate (9.08 per 1,000 live births) and Massachusetts had the lowest rate (4.28), less than one-half of the highest rate (Figure 1).
- States with an infant mortality rate significantly lower than the U.S. rate (5.89) included: California, Colorado, Connecticut, Idaho, Iowa, Massachusetts, Minnesota, Nebraska, Nevada, New Hampshire, New Jersey, New Mexico, New York, Oregon, Utah, Vermont, and Washington.
- There were 21 states with an infant mortality rate significantly higher than the U.S. rate: Alabama, Arkansas, Delaware, Florida, Georgia, Illinois, Indiana, Kentucky, Louisiana, Maine, Maryland, Michigan, Mississippi, Missouri, North Carolina, Ohio, Oklahoma, Pennsylvania, South Carolina, Tennessee, and West Virginia. D.C. also had an infant mortality rate higher than the U.S. rate.
Figure 1. Infant mortality rates, by state: United States, 2013–2015
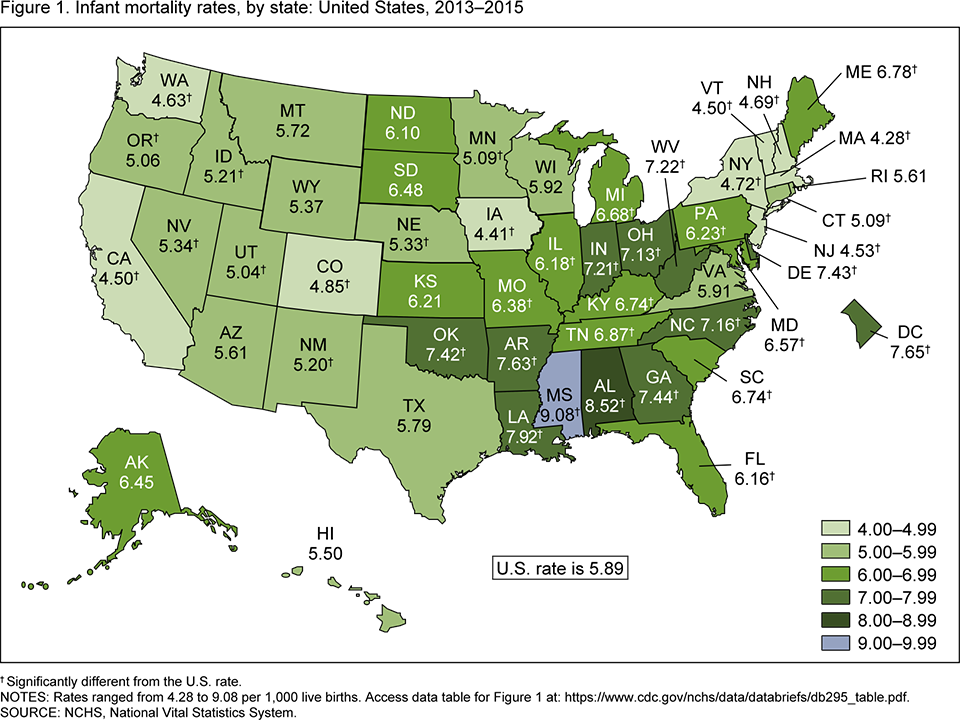
†Significantly different from the U.S. rate.
NOTES: Rates ranged from 4.28 to 9.08 per 1,000 live births. Access data table for Figure 1.
SOURCE: NCHS, National Vital Statistics System.
In 2013–2015, the lowest mortality rates for infants of non-Hispanic white women occurred mostly in states in the West and Northeast.
- The highest mortality rate for infants of non-Hispanic white women among the 50 states and D.C. was 7.04 per 1,000 live births in Arkansas, and the lowest rate, less than one-half of the highest rate, was 2.52 in D.C. (Figure 2).
- Ten states had a mortality rate for infants of non-Hispanic white women that was significantly lower than the national rate (4.95): California, Colorado, Connecticut, Iowa, Maryland, Massachusetts, Minnesota, New Jersey, New York, and Washington. D.C. also had an infant mortality rate lower than the U.S. rate.
- Fourteen states had an infant mortality rate that was significantly higher than the U.S. rate: Alabama, Arkansas, Indiana, Kansas, Kentucky, Louisiana, Maine, Mississippi, Missouri, North Carolina, Ohio, Oklahoma, Tennessee, and West Virginia.
Figure 2. Infant mortality rates for infants of non-Hispanic white women, by state: United States, 2013–2015
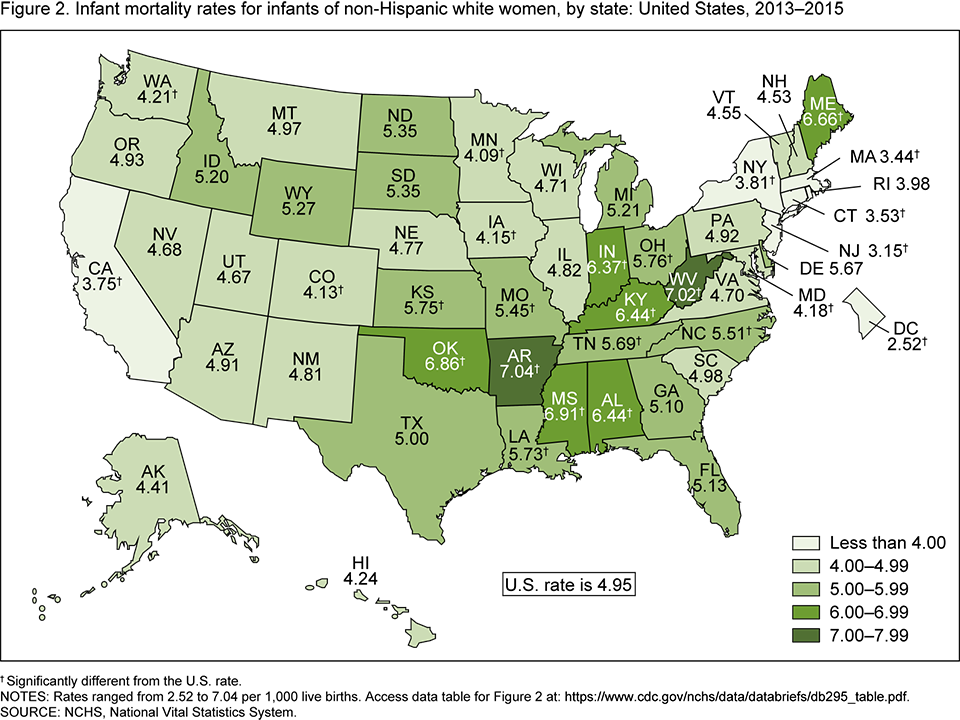
†Significantly different from the U.S. rate.
NOTES: Rates ranged from 2.52 to 7.04 per 1,000 live births. Access data table for Figure 2.
SOURCE: NCHS, National Vital Statistics System.
In 2013–2015, five of the nine highest mortality rates for infants of non-Hispanic black women were in Midwestern states.
- The highest state mortality rate for infants of non-Hispanic black women was 14.28 per 1,000 live births in Wisconsin, 1.7 times as high as the lowest rate of 8.27 in Massachusetts (Figure 3).
- Eight states had infant mortality rates significantly lower than the U.S. rate for infants of non-Hispanic black women (11.10): California, Colorado, Iowa, Massachusetts, New Jersey, New York, Texas, and Washington.
- Seven states had infant mortality rates significantly higher than the U.S. rate: Alabama, Illinois, Indiana, Michigan, North Carolina, Ohio, and Wisconsin.
Figure 3. Infant mortality rates for infants of non-Hispanic black women, by state: United States, 2013–2015
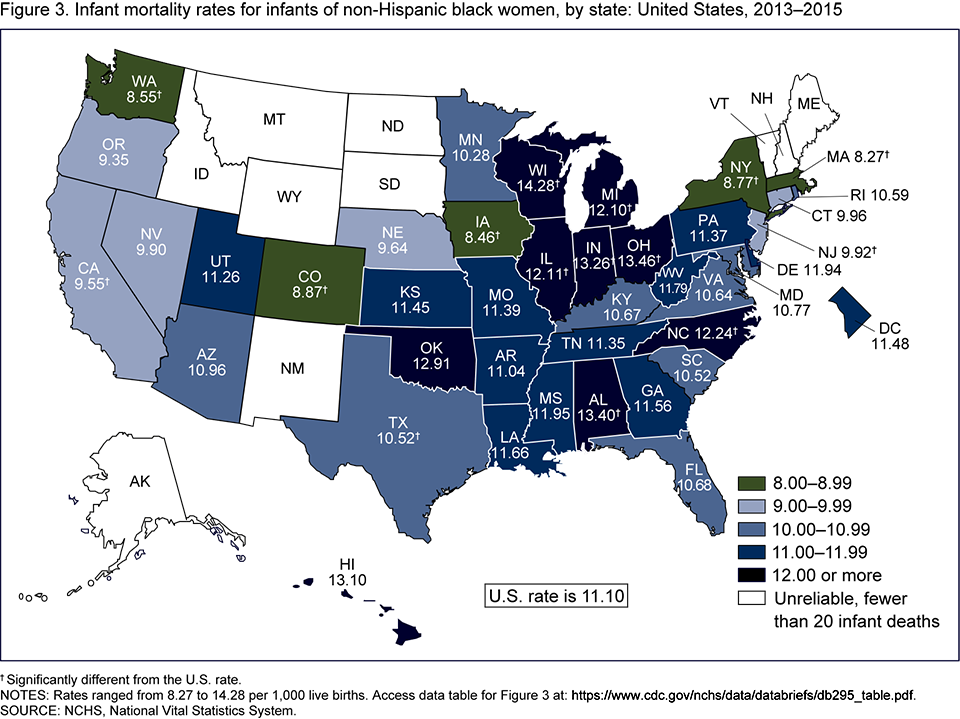
†Significantly different from the U.S. rate.
NOTES: Rates ranged from 8.27 to 14.28 per 1,000 live births. Access data table for Figure 3.
SOURCE: NCHS, National Vital Statistics System.
For infants of Hispanic women, the mortality rate in the 50 states and D.C. ranged from 3.94 to 7.28 per 1,000 live births in 2013–2015.
- The highest mortality rate for infants of Hispanic women was 7.28 in Michigan, 1.8 times as high as the lowest rate of 3.94 in Iowa (Figure 4).
- Four states had infant mortality rates significantly lower than the U.S. rate for infants of Hispanic women (4.99): California, Florida, New Jersey, and New York.
- There were eight states with infant mortality rates significantly higher than the U.S. rate: Alabama, Connecticut, Indiana, Michigan, Ohio, Oklahoma, Pennsylvania, and Texas.
Figure 4. Infant mortality rates for infants of Hispanic women, by state: United States, 2013–2015
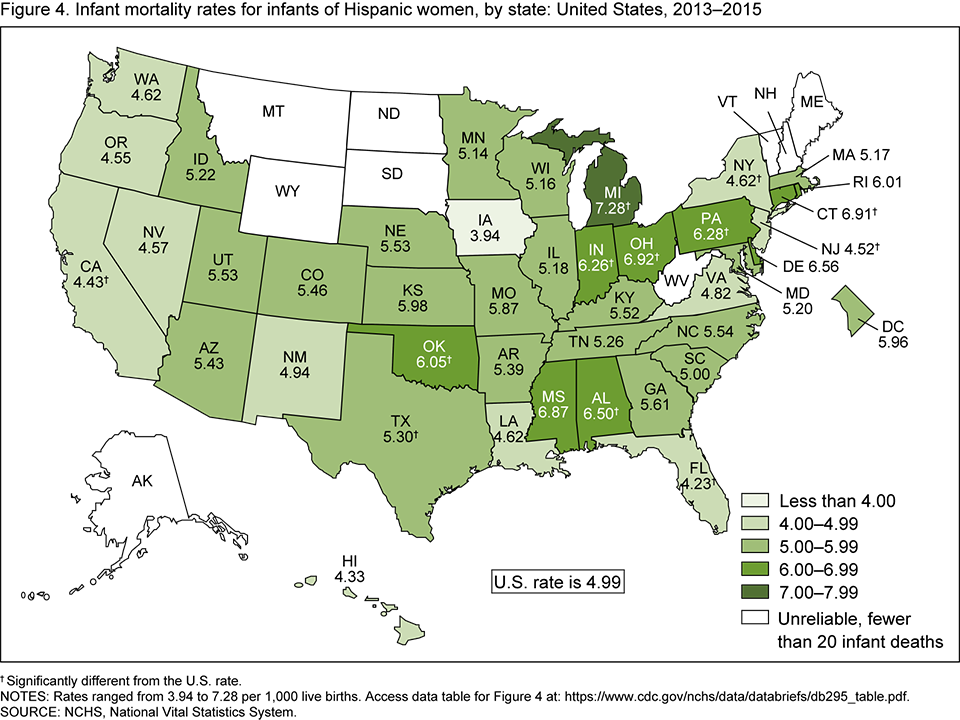
†Significantly different from the U.S. rate.
NOTES: Rates ranged from 3.94 to 7.28 per 1,000 live births. Access data table for Figure 4.
SOURCE: NCHS, National Vital Statistics System.
Summary
In 2013–2015, infant mortality rates in the United States ranged from a low of 4.28 per 1,000 live births in Massachusetts to a high of 9.08 in Mississippi. For infants of non-Hispanic white women, the rates ranged from 2.52 in D.C. to 7.04 in Arkansas, and for infants of Hispanic women, the range was from 3.94 in Iowa to 7.28 in Michigan. For infants of non-Hispanic black women, the lowest mortality rate of 8.27 in Massachusetts was higher than the highest state rates for infants of non-Hispanic white (7.04) and Hispanic (7.28) women. The highest mortality rate for infants of non-Hispanic black women was in Wisconsin (14.28).
Of the three race and Hispanic-origin groups presented in this report, infants of non-Hispanic white women had the widest range in rates by state—the highest was 2.8 times as high as the lowest. Alabama, Indiana, and Ohio had infant mortality rates that were higher than the national rate for each of the three racial and ethnic groups, as well as overall. California, New Jersey, and New York had rates that were lower than the national rate for each group and the overall U.S. rate.
This report provides recent state-level data that can inform efforts to lessen state and race-specific infant mortality rates (5–9).
Definition
Infant mortality rate: The number of infant deaths under age 1 year per 1,000 live births.
Data sources and methods
This report contains data from the period linked birth/infant death data set, which is part of the National Vital Statistics System. The period linked birth/infant death data set includes all infant deaths under age 1 year reported on death certificates and all live births reported from birth certificates. The period linked birth/infant death data set is the primary data set for analyzing infant mortality trends and patterns in the United States, and it is also the primary source for examining race and Hispanic-origin infant mortality and for examining factors related to birth (4,10). Race and Hispanic origin are self-reported by the mother on the birth certificate. For this data analysis, 3 years (2013–2015) of data have been combined to allow for more state-specific rates to be observed. Rates for states with fewer than 20 infant deaths for the 3 years combined are not calculated due to insufficient reliability (10). This impacts 10 states for infants of non-Hispanic black women and 9 states for infants of Hispanic women. Linked birth/infant death data sets are available from: https://www.cdc.gov/nchs/data_access/vitalstatsonline.htm.
References to rates being significantly higher or lower indicate that differences are statistically significant at the 0.05 level (10). For some states, there appear to be observed differences compared with the U.S. rate; however, these differences were not statistically significant and so, are not mentioned in the text.
About the authors
T.J. Mathews, Danielle M. Ely, and Anne K. Driscoll are with the National Center for Health Statistics, Division of Vital Statistics, Reproductive Statistics Branch.
References
- MacDorman MF, Mathews TJ, Mohangoo AD, Zeitlin J. International comparisons of infant mortality and related factors: United States and Europe, 2010. National Vital Statistics Reports; vol 63 no 5. Hyattsville, MD: National Center for Health Statistics. 2014.
- Singh GK, Kogan MD. Persistent socioeconomic disparities in infant, neonatal, and postneonatal mortality rates in the United States, 1969–2001. Pediatrics 119(4):e928–39. 2007.
- Jacob JA. US infant mortality rate declines but still exceeds other developed countries. JAMA 315(5):451–2. 2016.
- Kochanek KD, Murphy SL, Xu JQ, Tejada-Vera B. Deaths: Final data for 2014. National Vital Statistics Reports; vol 65 no 4. Hyattsville, MD: National Center for Health Statistics. 2016.
- Mathews TJ, Driscoll AK. Trends in infant mortality in the United States, 2005–2014. NCHS Data Brief, no 279. Hyattsville, MD: National Center for Health Statistics. 2017.
- Brown Speights JS, Goldfarb SS, Wells BA, Beitsch L, Levine RS, Rust G. State-level progress in reducing the black-white infant mortality gap, United States, 1999–2013. Am J Public Health 107(5):775–82. 2017.
- Rossen LM, Khan D, Schoendorf KC. Mapping geographic variation in infant mortality and related black-white disparities in the US. Epidemiology 27(5):690–6. 2016.
- Cradle Cincinnati. Available from: http://www.cradlecincinnati.org.
- The Washington Post. Group sees gap in black-white infant mortality. January 6, 1984.
- Mathews TJ, MacDorman MF, Thoma ME. Infant mortality statistics from the 2013 period linked birth/infant death data set. National Vital Statistics Reports; vol 64 no 9. Hyattsville, MD: National Center for Health Statistics. 2015.
Suggested citation
Mathews TJ, Ely DM, Driscoll AK. State variations in infant mortality by race and Hispanic origin of mother, 2013–2015. NCHS Data Brief, no 295. Hyattsville, MD: National Center for Health Statistics. 2018.
Copyright information
All material appearing in this report is in the public domain and may be reproduced or copied without permission; citation as to source, however, is appreciated.
National Center for Health Statistics
Charles J. Rothwell, M.S., M.B.A., Director
Jennifer H. Madans, Ph.D., Associate Director for Science
Division of Vital Statistics
Delton Atkinson, M.P.H., M.P.H., P.M.P., Director
Hanyu Ni, Ph.D., M.P.H., Associate Director for Science