Total and High-density Lipoprotein Cholesterol in Adults: United States, 2015–2016
- Key findings
- What was the prevalence of high total cholesterol among adults in 2015–2016?
- Were there differences in the prevalence of high total cholesterol among adults by race and Hispanic origin in 2015–2016?
- What was the prevalence of low HDL cholesterol among adults in 2015–2016?
- Were there differences in the prevalence of low HDL cholesterol among adults by race and Hispanic origin in 2015–2016?
- What were the trends in high total cholesterol and low HDL cholesterol among adults?
- Summary
- Definitions
- Data sources and methods
- About the authors
- References
- Suggested citation
NCHS Data Brief No. 290, October 2017
PDF Version (408 KB)
Margaret D. Carroll, M.S.P.H., Cheryl D. Fryar, M.S.P.H., and Duong T. Nguyen, D.O.
Key findings
Data from the National Health and Nutrition Examination Survey
- In 2015–2016, 12.4% of adults had high total cholesterol.
- High total cholesterol prevalence was higher in men aged 40–59 than in those aged 20–39 and 60 and over. In women, prevalence was higher in those aged 40–59 and 60 and over than in those aged 20–39.
- About 18.0% of adults (28.5% of men and 8.9% of women) had low high-density lipoprotein (HDL) cholesterol.
- In men and women, low HDL cholesterol prevalence was higher in Hispanic adults than in non-Hispanic white, black, and Asian adults. In men, prevalence was higher in non-Hispanic white and Asian adults than in non-Hispanic black adults.
- High total cholesterol prevalence declined from 1999–2000 to 2015–2016. Low HDL cholesterol prevalence declined from 2007–2008 to 2015–2016.
High total cholesterol (≥ 240 mg/dL) and low high-density lipoprotein (HDL) cholesterol (< 40 mg/dL) levels are risk factors for cardiovascular disease, the leading cause of U.S. deaths (1–3). From 2007–2008 to 2013–2014, declining trends were observed in high total and low HDL cholesterol prevalence (4). This report provides 2015–2016 estimates for high total and low HDL cholesterol and trends based on available comparable data through 2015–2016. Analysis is based on measured cholesterol.
Keywords: HDL, National Health and Nutrition Examination Survey
What was the prevalence of high total cholesterol among adults in 2015–2016?
During 2015–2016, 12.4% of adults had high total cholesterol. Overall, prevalence was higher in adults aged 40–59 (17.1%) than in those aged 20–39 (7.9%) and 60 and over (12.5%). It was also higher in adults aged 60 and over than in those aged 20–39.
For men, prevalence of high total cholesterol was higher in those aged 40–59 (16.5%) than in those aged 20–39 (9.1%) and 60 and over (6.9%). For women, prevalence was higher in those aged 40–59 (17.7%) and 60 and over (17.2%) than in those aged 20–39 (6.7%) (Figure 1).
For adults aged 60 and over, there was a lower prevalence of high total cholesterol in men (6.9%) than women (17.2%).
Figure 1. Prevalence of high total cholesterol among adults aged 20 and over: United States, 2015–2016
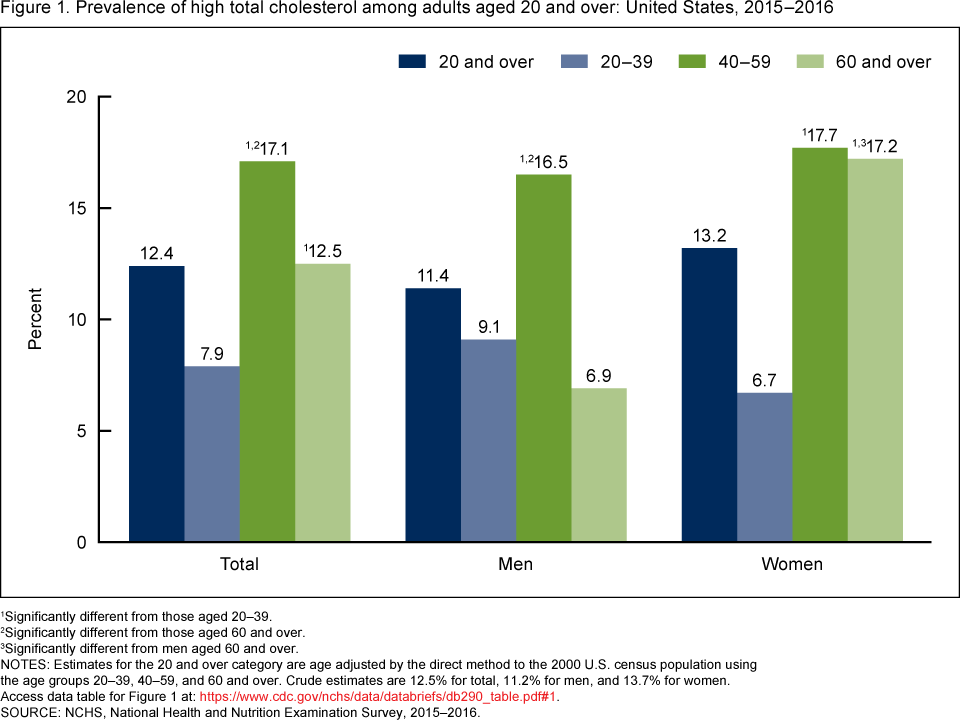
1Significantly different from those aged 20–39.
2Significantly different from those aged 60 and over.
3Significantly different from men aged 60 and over.
NOTES: Estimates for the 20 and over category are age adjusted by the direct method to the 2000 U.S. census population using the age groups 20–39, 40–59, and 60 and over. Crude estimates are 12.5% for total, 11.2% for men, and 13.7% for women. Access data table for Figure 1.
SOURCE: NCHS, National Health and Nutrition Examination Survey, 2015–2016.
Were there differences in the prevalence of high total cholesterol among adults by race and Hispanic origin in 2015–2016?
No statistically significant race and Hispanic-origin differences were observed in the prevalence of high total cholesterol overall or among men. For women, the observed prevalence of high total cholesterol was significantly higher for non-Hispanic white adults (14.8%) compared with Hispanic adults (9.0%). The differences between non-Hispanic white, non-Hispanic black (10.3%), and non-Hispanic Asian (10.3%) women were not statistically significant (Figure 2).
Hispanic men had a significantly higher prevalence of high total cholesterol (13.1%) than Hispanic women (9.0%). The observed difference between non-Hispanic white men (10.9%) and women (14.8%) was not statistically significant.
Figure 2. Age-adjusted prevalence of high total cholesterol among adults aged 20 and over, by sex and race and Hispanic origin: United States, 2015–2016
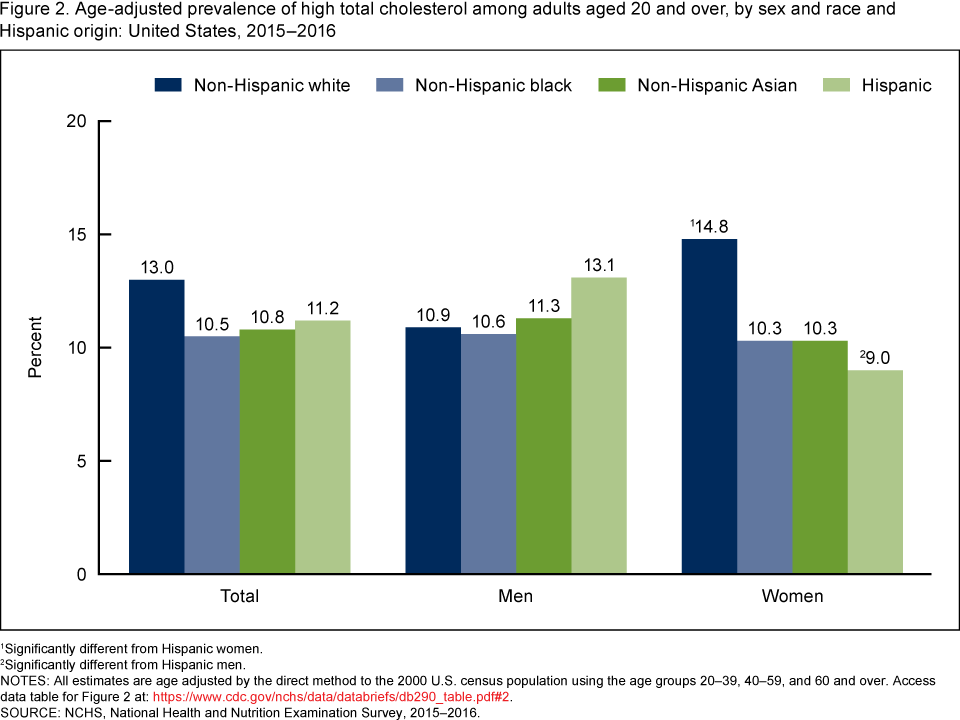
1Significantly different from Hispanic women.
2Significantly different from Hispanic men.
NOTES: All estimates are age adjusted by the direct method to the 2000 U.S. census population using the age groups 20–39, 40–59, and 60 and over. Access data table for Figure 2.
SOURCE: NCHS, National Health and Nutrition Examination Survey, 2015–2016.
What was the prevalence of low HDL cholesterol among adults in 2015–2016?
During 2015–2016, 18.4% of adults had low HDL cholesterol. The prevalence of low HDL cholesterol was higher among those aged 20–39 (19.2%) and 40–59 (20.1%) than among those aged 60 and over (14.5%) (Figure 3).
In men, the prevalence of low HDL cholesterol was higher among those aged 40–59 (31.9%) than among those aged 60 and over (23.3%). In women, the prevalence of low HDL cholesterol declined with age, from 10.1% among those aged 20–39 to 7.1% among those aged 60 and over.
Low HDL cholesterol prevalence was higher among men (28.5%) than women (8.9%) overall as well as within each age group (i.e., 20–39: 28.4% compared with 10.1%, respectively; 40–59: 31.9% compared with 8.7%; and 60 and over: 23.3% compared with 7.1%).
Figure 3. Prevalence of low high-density lipoprotein cholesterol among adults aged 20 and over, by sex and age: United States, 2015–2016
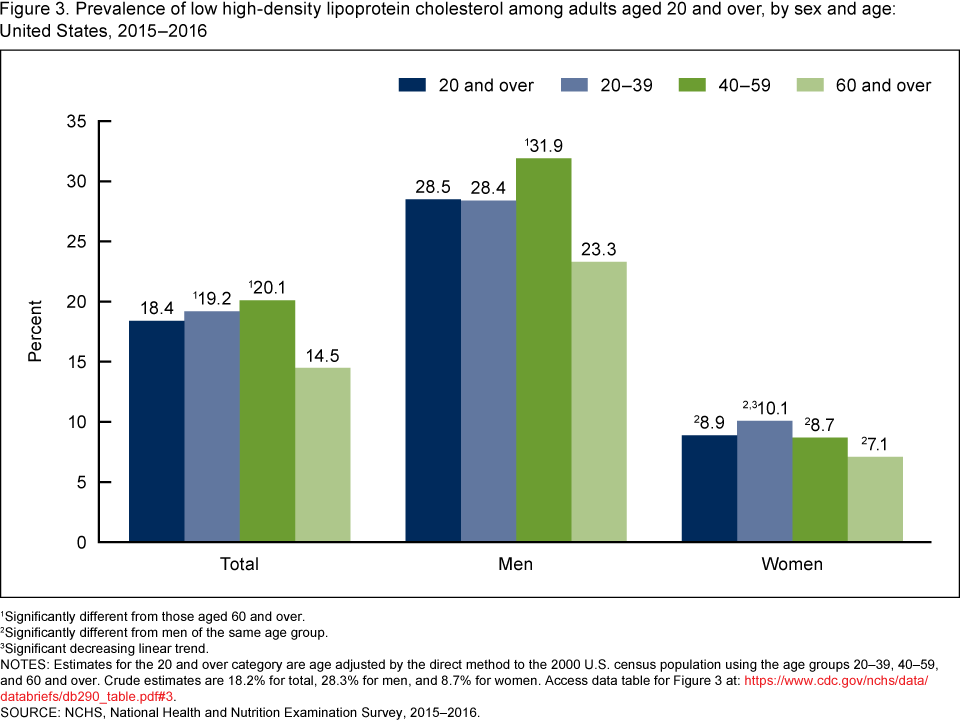
1Significantly different from those aged 60 and over.
2Significantly different from men of the same age group.
3Significant decreasing linear trend.
NOTES: Estimates for the 20 and over category are age adjusted by the direct method to the 2000 U.S. census population using the age groups 20–39, 40–59, and 60 and over. Crude estimates are 18.2% for total, 28.3% for men, and 8.7% for women. Access data table for Figure 3.
SOURCE: NCHS, National Health and Nutrition Examination Survey, 2015–2016.
Were there differences in the prevalence of low HDL cholesterol among adults by race and Hispanic origin in 2015–2016?
Overall, the prevalence of low HDL cholesterol was higher in Hispanic adults (24.7%) than in non-Hispanic black (12.2%), non-Hispanic white (17.6%), and non-Hispanic Asian (16.4%) adults. This pattern was similar for both men and women. Overall and in men, non-Hispanic white and non-Hispanic Asian adults had higher levels of low HDL cholesterol than their non-Hispanic black counterparts (Figure 4).
Across all race and Hispanic-origin groups, women had a lower prevalence of low HDL cholesterol than men (i.e., non-Hispanic white: 28.2% compared with 7.3%, respectively; non-Hispanic black: 17.3% compared with 8.2%; non-Hispanic Asian: 26.4% compared with 7.7%; and Hispanic: 36.2% compared with 13.8%).
Figure 4. Age-adjusted prevalence of low high-density lipoprotein cholesterol among adults aged 20 and over, by sex and race and Hispanic origin: United States, 2015–2016
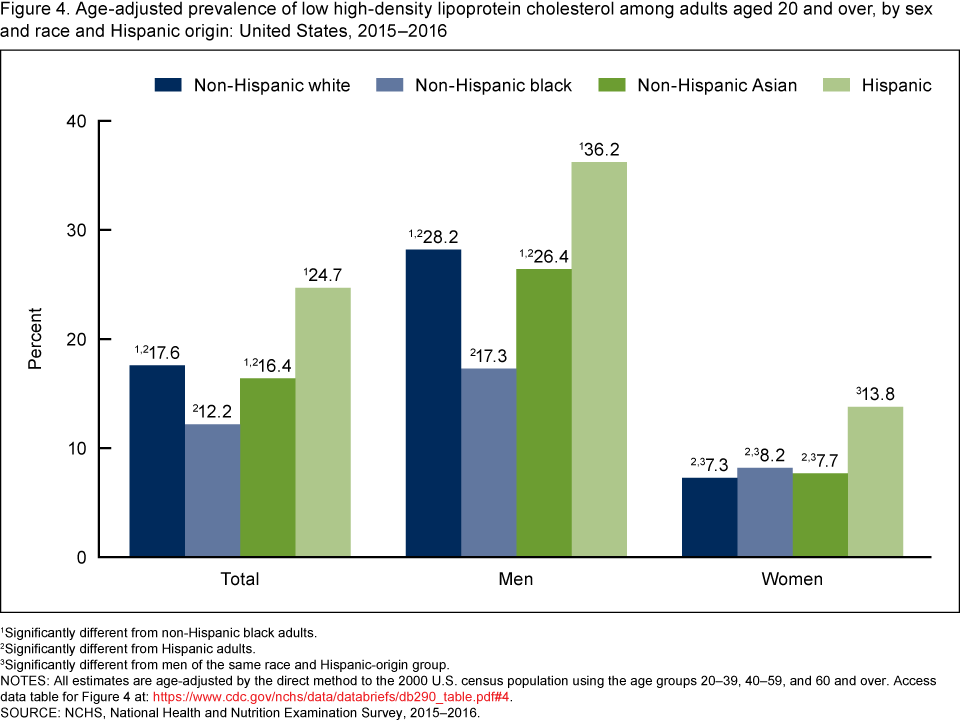
1Significantly different from non-Hispanic black adults.
2Significantly different from Hispanic adults.
3Significantly different from men of the same race and Hispanic-origin group.
NOTES: All estimates are age-adjusted by the direct method to the 2000 U.S. census population using the age groups 20–39, 40–59, and 60 and over. Access data table for Figure 4.
SOURCE: NCHS, National Health and Nutrition Examination Survey, 2015–2016.
What were the trends in high total cholesterol and low HDL cholesterol among adults?
The prevalence of high total cholesterol declined significantly, from 18.3% in 1999–2000 to 12.4% in 2015–2016. The observed change from 2013–2014 to 2015–2016 was not significant (Figure 5).
For low HDL cholesterol, there was a significant decline from 2007–2008 (22.2%) to 2015–2016 (18.4%). The observed change from 2013–2014 to 2015–2016 was not significant.
Figure 5. Trends in age-adjusted high total cholesterol and low high-density lipoprotein cholesterol among adults aged 20 and over: United States, 1999–2000 to 2015–2016
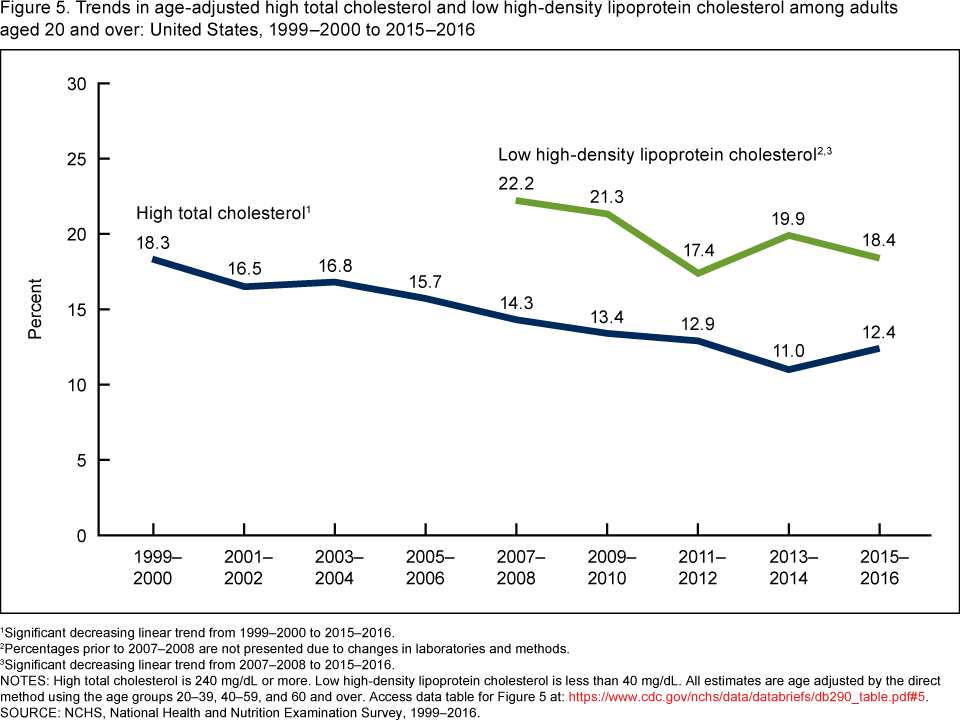
1Significant decreasing linear trend from 1999–2000 to 2015–2016.
2Percentages prior to 2007–2008 are not presented due to changes in laboratories and methods.
3Significant decreasing linear trend from 2007–2008 to 2015–2016.
NOTES: High total cholesterol is 240 mg/dL or more. Low high-density lipoprotein cholesterol is less than 40 mg/dL. All estimates are age adjusted by the direct method using the age groups 20–39, 40–59, and 60 and over. Access data table for Figure 5.
SOURCE: NCHS, National Health and Nutrition Examination Survey, 1999–2016.
Summary
During 2015–2016, 12.4% of adults had high total cholesterol and 18.4% had low HDL cholesterol. There were no significant race and Hispanic-origin differences in high total cholesterol overall or in men, but non-Hispanic white women had a higher prevalence of high total cholesterol than Hispanic women. The prevalence of low HDL cholesterol was lowest in non-Hispanic black adults and highest in Hispanic adults overall and for men, and the percentage with low HDL cholesterol was higher in Hispanic women than in non-Hispanic white, non-Hispanic black, and non-Hispanic Asian women.
Based on the earliest available and comparable data from the National Health and Nutrition Examination Survey (NHANES), declining trends were observed in high total cholesterol from 1999–2000 to 2015–2016 and in low HDL cholesterol from 2007–2008 to 2015–2016. However, the observed change for high total and low HDL cholesterol from 2013–2014 to 2015–2016 was not significant.
Total and HDL cholesterol are used in assessing patient health. When assessed along with systolic blood pressure, diabetes, and smoking, clinicians can assess the risk for atherosclerosis and cardiovascular disease (5,6). In addition, low HDL cholesterol is used to determine metabolic syndrome, a group of risk factors that raises the risk for heart disease. In the context of metabolic syndrome, the cut points for low HDL cholesterol differ for men (< 40 mg/dL) and women (< 50 mg/dL). In this report, 40 mg/dL was used as the cut point for both men and women.
As part of its objectives to improve the health of the U.S. population, Healthy People 2020 has included the goal of reducing the proportion of adults with high total blood cholesterol to less than 13.5% (7). Both men and women aged 20 and over currently meet this goal. However, disparities among some population subgroups still exist.
Definitions
High total cholesterol: Serum total cholesterol greater than or equal to 240 mg/dL.
Low HDL cholesterol: Serum HDL cholesterol less than 40 mg/dL.
Data sources and methods
Data from nine 2-year cycles of NHANES (1999–2000 through 2015–2016) were used for these analyses. Data from NHANES 2015–2016 were used to test differences between subgroups. This 2-year NHANES cycle provides the most recent estimates of high total and low HDL cholesterol. However, the precision of the estimated prevalence of high total and low HDL cholesterol and the ability to detect differences in the prevalence when a difference exists are lower than when these estimates are based on 4 years of data because of the smaller sample sizes. In testing for trends in high total and low HDL cholesterol, the nine 2-year cycles were used.
NHANES is a cross-sectional survey designed to monitor the health and nutritional status of the civilian noninstitutionalized U.S. population using highly stratified, multistage probability designs (8). The survey consists of an interview conducted in participants’ homes and standardized physical examinations conducted in mobile examination centers.
In 2015–2016, non-Hispanic black, non-Hispanic Asian, and Hispanic persons, among other groups were oversampled to obtain reliable estimates for these population subgroups. Specific race and Hispanic-origin estimates reflect persons reporting only one race. Those reporting more than one race are included in the total only and are not shown separately.
Examination sample weights, accounting for the differential selection probabilities and adjusting for nonresponse and noncoverage, were used to estimate the prevalence of high total and low HDL cholesterol. Standard errors of these prevalences were estimated by Taylor series linearization (9), a design-based method.
Prevalence estimates were age adjusted by the direct method to the 2000 projected U.S. Census population using the age groups 20–39, 40–59, and 60 and over (10). Differences between groups were tested using a t statistic at the p < 0.05 significance level. Linear trends were tested using orthogonal contrast matrices. All differences reported are statistically significant unless otherwise indicated. Adjustments were not made for multiple comparisons. Statistical analyses were conducted using the SAS System for Windows version 9.4 (SAS Institute, Inc., Cary, N.C.) and SUDAAN version 11.1 (RTI International, Research Triangle Park, N.C.).
About the authors
Margaret D. Carroll, Cheryl D. Fryar, and Duong T. Nguyen are with the National Center for Health Statistics, Division of Health and Nutrition Examination Surveys.
References
- Wilson PW, D’Agostino RB, Levy D, Belanger AM, Silbershatz H, Kannel WB. Prediction of coronary heart disease using risk factor categories. Circulation 97(18):1837–47. 1998.
- Stamler J, Wentworth D, Neaton JD. Is the relationship between serum cholesterol and risk of premature death from coronary heart disease continuous or graded? Findings in 356,222 primary screenees of the Multiple Risk Factor Intervention Trial (MRFIT). JAMA 256(20):2823–8. 1986.
- Assmann G, Schulte H, von Eckardstein A, Huang Y. High-density lipoprotein cholesterol as a predictor of coronary heart disease risk. The PROCAM experience and pathophysiological implications for reverse cholesterol transport. Atherosclerosis 124 Suppl:S11–20. 1996.
- Carroll MD, Fryar CD, Kit BK. Total and high-density lipoprotein cholesterol in adults: United States, 2011–2014. NCHS data brief, no 226. Hyattsville, MD: National Center for Health Statistics. 2015.
- Goff DC, Lloyd-Jones DM, Bennett G, Coady S, D’Agostino RB, Gibbons R, et al. 2013 ACC/AHA guideline on the assessment of cardiovascular risk: A report of the American College of Cardiology/American Heart Association Task Force on Practice Guidelines. Circulation 129(25 Suppl2):S49–73. 2014.
- Bruckert E, Hansel B. HDL-c is a powerful lipid predictor of cardiovascular diseases. Int J Clin Pract 61(1905–13). 2007.
- U.S. Department of Health and Human Services. Office of Disease Prevention and Health Promotion. Healthy People 2020 topics and objectives: Heart disease and stroke. Washington, D.C.
- National Center for Health Statistics. National Health and Nutrition Examination Survey: Questionnaires, datasets, and related documentation.
- Wolter KM. Chapter 6: Taylor series methods. In: Introduction to variance estimation. 2nd ed. New York, NY: Springer. 2007.
- Klein RJ, Schoenborn CA. Age adjustment using the 2000 projected U.S. population. Healthy People Statistical Notes, no 20. Hyattsville, MD: National Center for Health Statistics. 2001.
Suggested citation
Carroll MD, Fryar CD, Nguyen DT. High total and low high-density lipoprotein cholesterol in adults: United States, 2015–2016. NCHS data brief, no 290. Hyattsville, MD: National Center for Health Statistics. 2017.
Copyright information
All material appearing in this report is in the public domain and may be reproduced or copied without permission; citation as to source, however, is appreciated.
National Center for Health Statistics
Charles J. Rothwell, M.S., M.B.A., Director
Jennifer H. Madans, Ph.D., Associate Director for Science
Division of Health and Nutrition Examination Surveys
Kathryn S. Porter, M.D., M.S., Director
Ryne Paulose-Ram, Ph.D., Associate Director for Science