Vaccination Coverage Among Adults Aged 65 and Over: United States, 2015
- Key findings
- The percentage of adults aged 65 and over who had an influenza vaccine in the past 12 months was highest among those aged 75 and over and not poor.
- The percentage of adults aged 65 and over who ever had a pneumococcal vaccine was highest among those who were aged 75 and over, non-Hispanic white, and not poor.
- The percentage of adults aged 65 and over who had a tetanus vaccine in the past 10 years was highest among men and those who were aged 65-74, non-Hispanic white, and not poor.
- The percentage of adults aged 65 and over who ever had a shingles vaccine was highest among women and those who were under age 85, non-Hispanic white, and not poor.
- Summary
- Definitions
- Data source and methods
- About the authors
- References
- Suggested citation
NCHS Data Brief No. 281, June 2017
PDF Version (575 KB)
Tina Norris, Ph.D., Anjel Vahratian, Ph.D., and Robin A. Cohen, Ph.D.
Key findings
Data from the National Health Interview Survey
- Among adults aged 65 and over, more than two-thirds had an influenza vaccine in the past 12 months (69.0%).
- More than one in two adults aged 65 and over had a tetanus vaccine in the past 10 years (56.9%).
- More than 6 of 10 adults aged 65 and over had ever had a pneumococcal vaccine (63.6%), while a little more than one-third had ever had a shingles vaccine (34.2%).
- Among adults aged 65 and over, vaccination coverage was highest for non-Hispanic white adults compared with non-Hispanic black and Hispanic adults.
- Vaccination coverage was lowest among poor adults aged 65 and over.
Older adults have greater susceptibility to and complications from disease and so, they stand to benefit greatly from vaccinations as a preventive health measure (1,2). This report describes the receipt of an influenza vaccination in the past 12 months, at least one dose of pneumococcal vaccine, a one-time dose of shingles vaccine, and a tetanus booster in the last 10 years among community-dwelling adults aged 65 and over. Data are presented by sex, age group, race and ethnicity, and poverty status.
Keywords: prevention, adult immunization, medical care, National Health Interview Survey
The percentage of adults aged 65 and over who had an influenza vaccine in the past 12 months was highest among those aged 75 and over and not poor.
- Among adults aged 65 and over, 69.0% had received an influenza vaccine in the past 12 months (Figure 1).
- The percentage of men who had received an influenza vaccine in the last 12 months (70.4%) was higher than, but not significantly different from, that of women (67.9%).
- Influenza vaccination coverage increased from 66.9% among adults aged 65-74 to 71.7% among those aged 75-84 and 72.8% among those aged 85 and over.
- Non-Hispanic white adults (71.4%) were more likely than Hispanic (56.8%) and non-Hispanic black (59.6%) adults to have received an influenza vaccine in the past 12 months.
- Among adults aged 65 and over, those who were not poor (71.7%) were most likely to have received an influenza vaccine in the past 12 months, followed by near-poor (63.0%) and poor (61.6%) adults.
Figure 1. Percentage of adults aged 65 and over who had an influenza vaccine in the past 12 months, by selected demographics: United States, 2015
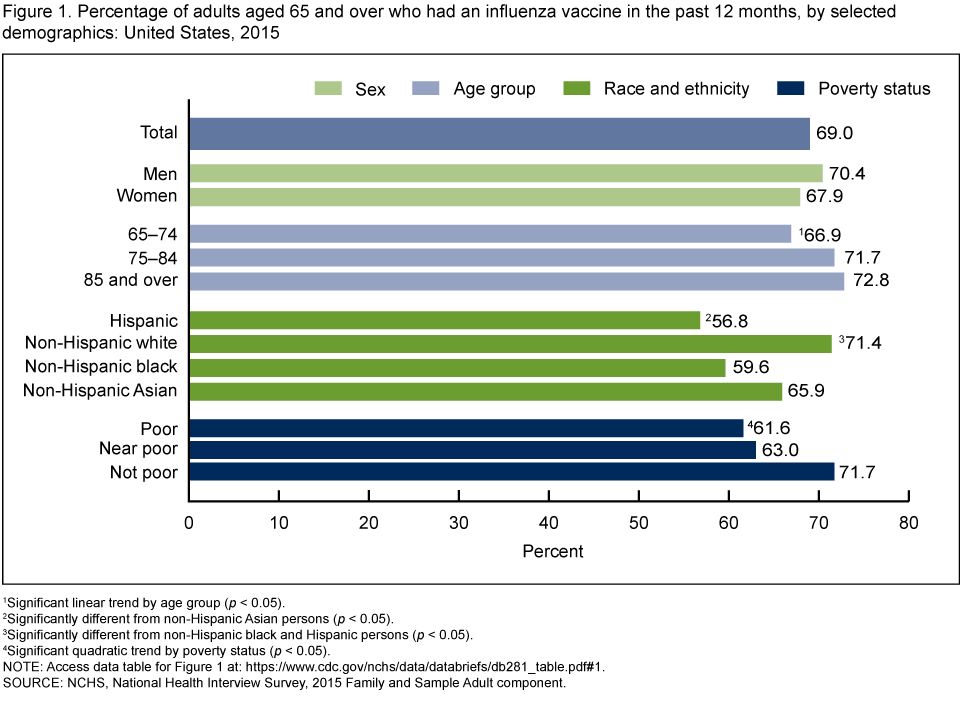
1Significant linear trend by age group (p < 0.05).
2Significantly different from non-Hispanic Asian persons (p < 0.05).
3Significantly different from non-Hispanic black and Hispanic persons (p < 0.05).
4Significant quadratic trend by poverty status (p < 0.05).
NOTE: Access data table for Figure 1.
SOURCE: NCHS, National Health Interview Survey, 2015 Family and Sample Adult component.
The percentage of adults aged 65 and over who ever had a pneumococcal vaccine was highest among those who were aged 75 and over, non-Hispanic white, and not poor.
- Nearly two-thirds of adults aged 65 and over ever had a pneumococcal vaccine (63.6%) (Figure 2).
- The percentage of women aged 65 and over who ever had a pneumococcal vaccine (64.2%) was higher than, but not significantly different from, that of men (62.9%).
- Pneumococcal vaccination increased from 60.2% for those aged 65-74 to 68.6% among those aged 75-84. Among adults aged 85 and over, 68.3% had ever had a pneumococcal vaccine.
- Among adults aged 65 and over, non-Hispanic white adults (68.1%) were more likely than the other racial and ethnic groups to have ever had a pneumococcal vaccine.
- Pneumococcal vaccination coverage increased with higher family income. Among adults aged 65 and over, 48.7% of poor adults ever had a pneumococcal vaccine, compared with 61.7% of near-poor and 66.0% of not-poor adults.
Figure 2. Percentage of adults aged 65 and over who ever had a pneumococcal vaccine, by selected demographics: United States, 2015
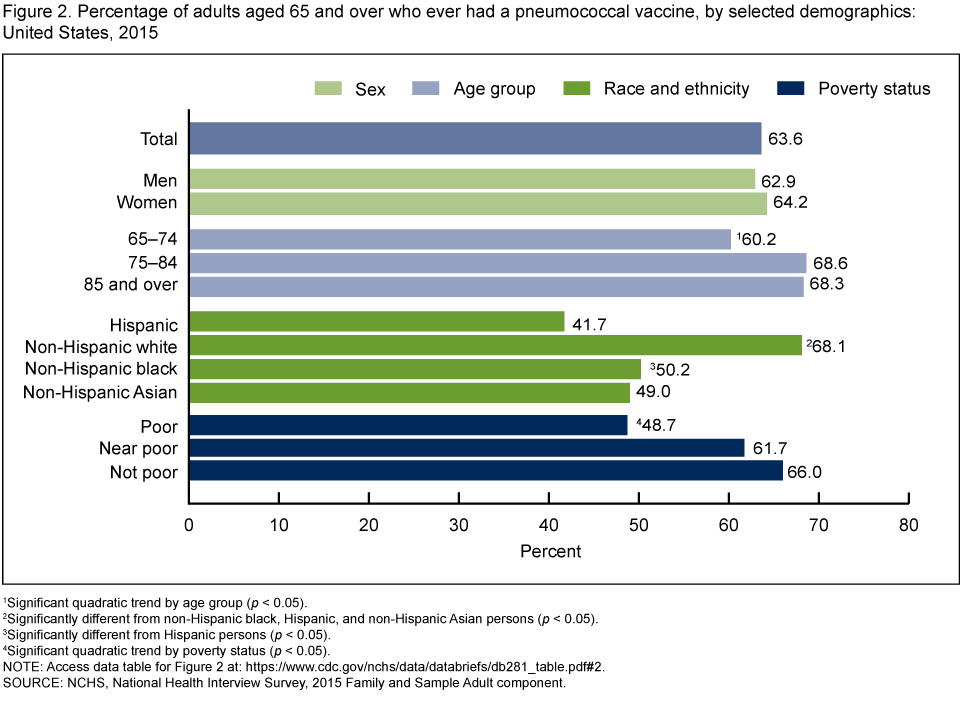
1Significant quadratic trend by age group (p < 0.05).
2Significantly different from non-Hispanic black, Hispanic, and non-Hispanic Asian persons (p < 0.05).
3Significantly different from Hispanic persons (p < 0.05).
4Significant quadratic trend by poverty status (p < 0.05).
NOTE: Access data table for Figure 2.
SOURCE: NCHS, National Health Interview Survey, 2015 Family and Sample Adult component.
The percentage of adults aged 65 and over who had a tetanus vaccine in the past 10 years was highest among men and those who were aged 65-74, non-Hispanic white, and not poor.
- More than one-half of adults aged 65 and over had a tetanus vaccine in the past 10 years (56.9%) (Figure 3).
- Among adults aged 65 and over, men (60.7%) were more likely than women (53.7%) to have had a tetanus vaccine in the past 10 years.
- Tetanus vaccination coverage in the past 10 years decreased with advancing age, from 61.0% among adults aged 65–74 to 47.6% among adults aged 85 and over.
- Among adults aged 65 and over, non-Hispanic white adults (59.4%) were more likely than other racial and ethnic groups to have had a tetanus vaccine in the past 10 years.
- Among adults aged 65 and over, tetanus vaccination coverage in the past 10 years increased with family income, from 41.1% among poor adults to 61.0% among not-poor adults.
Figure 3. Percentage of adults aged 65 and over who had a tetanus vaccine in the past 10 years, by selected demographics: United States, 2015

1Significantly different from women (p < 0.05).
2Significant linear trend by age group (p < 0.05).
3Significantly different from non-Hispanic black, Hispanic, and non-Hispanic Asian persons (p < 0.05).
4Significantly different from Hispanic persons (p < 0.05).
5Significant linear trend by poverty status (p < 0.05).
NOTE: Access data table for Figure 3.
SOURCE: NCHS, National Health Interview Survey, 2015 Family and Sample Adult component.
The percentage of adults aged 65 and over who ever had a shingles vaccine was highest among women and those who were under age 85, non-Hispanic white, and not poor.
- A little more than one-third of adults aged 65 and over have ever had a shingles vaccine (34.2%) (Figure 4).
- Among adults aged 65 and over, women (35.7%) were more likely than men (32.4%) to have had a shingles vaccine.
- Shingles vaccination coverage decreased with advancing age, from 35.9% among adults aged 65-74 to 28.7% among adults aged 85 and over.
- Among adults aged 65 and over, non-Hispanic white adults (38.3%) were more likely than other racial and ethnic groups to have had a shingles vaccine.
- Shingles vaccination coverage increased with family income among adults aged 65 and over, from 14.8% among those who were poor to 39.6% among those who were not poor.
Figure 4. Percentage of adults aged 65 and over who ever had a shingles vaccine, by selected demographics: United States, 2015
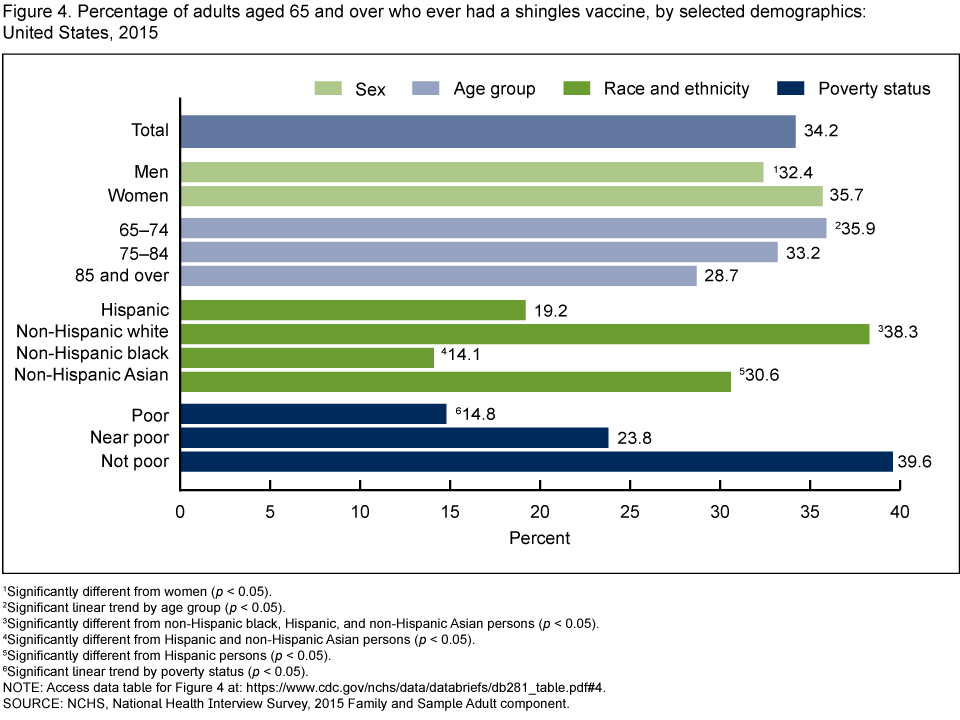
1Significantly different from women (p < 0.05).
2Significant linear trend by age group (p < 0.05).
3Significantly different from non-Hispanic black, Hispanic, and non-Hispanic Asian persons (p < 0.05).
4Significantly different from Hispanic and non-Hispanic Asian persons (p < 0.05).
5Significantly different from Hispanic persons (p < 0.05).
6Significant linear trend by poverty status (p < 0.05).
NOTE: Access data table for Figure 4.
SOURCE: NCHS, National Health Interview Survey, 2015 Family and Sample Adult component.
Summary
In 2015, more than 47 million individuals living in the United States were aged 65 or over (3). Because these older adults are at increased risk of complications from vaccine-preventable infections, the Advisory Committee on Immunization Practices (ACIP) recommends vaccination for influenza, two doses of pneumococcal vaccine, one dose of shingles vaccine, and a tetanus booster every 10 years (4). However, two-thirds of adults aged 65 and over have never had a shingles vaccine, and nearly one-half had not had a tetanus vaccine in the past 10 years. Although the receipt of an influenza vaccine during the past 12 months (69.0%) and at least one dose of pneumococcal vaccine (63.6%) were more common among this age group, gaps in coverage remain.
Vaccination coverage varied by age. Vaccination for influenza in the past 12 months and having had at least one dose for pneumococcal disease at some point in the past were higher among the community-dwelling population aged 85 and over compared with adults aged 65-74. Individuals aged 85 and over, however, were less likely than adults aged 65-84 to have been vaccinated for tetanus in the past 10 years or to have been vaccinated for shingles at any time in the past.
Vaccination also varied by sex. Among adults aged 65 and over, men were more likely than women to have had a tetanus vaccine in the past 10 years. However, men were less likely than women to have had a shingles vaccine at some point in the past.
Previous research has documented racial and ethnic differences in vaccination coverage and attributed such differences to structural, systematic, and social barriers to care (5,6). Findings from the current study support previous research. Vaccination coverage for those aged 65 and over varied by race and ethnicity. Non-Hispanic white adults were more likely than Hispanic and non-Hispanic black adults to have had an influenza vaccine in the past 12 months. Non-Hispanic white adults were more likely than Hispanic, non-Hispanic black, and non-Hispanic Asian adults to have had a tetanus vaccine in the past 10 years or to ever have had a vaccination for pneumococcal disease or shingles. Non-Hispanic black adults were less likely than Hispanic adults to have been vaccinated for tetanus or shingles but were more likely to have received a pneumococcal vaccine.
Vaccination coverage was positively associated with family income. Adults aged 65 and over who were not poor were the most likely to have been vaccinated for influenza, pneumococcal disease, tetanus, and shingles.
Definitions
Influenza vaccine: Based on a positive response to the survey question, “During the past 12 months, have you had a flu shot? A flu shot is usually given in the fall and protects against influenza for the flu season.” Nasal flu vaccine was excluded because it was not recommended for adults aged 65 and over in 2015.
Pneumococcal vaccine: Based on a positive response to the survey question, “Have you ever had a pneumonia shot? This shot is usually given only once or twice in a person’s lifetime and is different from the flu shot. It is also called the pneumococcal vaccine.”
Poverty status: Based on family income and family size using the U.S. Census Bureau’s poverty thresholds for the previous calendar year. “Poor” adults are defined as having incomes below the federal poverty level (FPL). “Near-poor” adults are defined as having family incomes that are 100% to less than 200% of the FPL. “Not-poor” adults are defined as having incomes that are 200% or greater than the FPL. The 2015 National Health Interview Survey (NHIS) imputed income files were used to help create the poverty variable, and this variable is based on reported and imputed family income (7).
Shingles vaccine: Based on a positive response to the survey question, “Have you ever had the zoster or shingles vaccine, also called Zostavax?”
Tetanus vaccine: Based on a positive response to the survey question, “Have you received a tetanus shot in the past 10 years?”
Data source and methods
Data from the 2015 NHIS were used for this analysis. NHIS is a multipurpose health survey conducted continuously throughout the year by interviewers from the U.S. Census Bureau for the National Center for Health Statistics (NCHS). Interviews are conducted in person in respondents’ homes but follow-ups to complete interviews may be conducted over the telephone. Data for this analysis come from the Family Core and Sample Adult components of NHIS. For further information about NHIS, including the questionnaire, visit the NHIS website.
All analyses used national estimates that are representative of the civilian noninstitutionalized (community-dwelling) adult population aged 65 and over living in households across the United States. The sample design and data weighting procedures are described in more detail elsewhere (8). Linear trends and point estimates and their estimated variances were calculated using SUDAAN software (9) to account for the complex sample design of NHIS. All estimates shown in this report meet NCHS standards of reliability (relative standard error less than or equal to 30%). Differences between percentages were evaluated using two-sided significance tests at the 0.05 level. Influenza vaccination estimates included in this report may differ from estimates for specific influenza seasons. Estimates for specific influenza seasons are available from the Centers for Disease Control and Prevention’s website.
Because the survey did not ask about the type or number of doses of pneumococcal vaccine received, pneumococcal vaccination estimates do not reflect the proportion of individuals that were completely vaccinated according to ACIP recommendations.
About the authors
Tina Norris, Anjel Vahratian, and Robin A. Cohen are with the National Center for Health Statistics, Division of Health Interview Statistics.
References
- Williams WW, Lu PJ, O’Halloran A, Kim DK, Grohskopf LA, Pilishvili T, et al. Surveillance of vaccination coverage among adult populations-United States, 2015. MMWR Surveill Summ 66(11):1-28. 2017. Available from: http://dx.doi.org/10.15585/mmwr.ss6611a1.
- Pilkinton MA, Talbot HK. Update on vaccination guidelines for older adults. J Am Geriatr Soc 63(3):584-8. 2015.
- U.S. Census Bureau. Annual estimates of the resident population for selected age groups by sex for the United States, states, counties, and Puerto Rico commonwealth and municipios: April 1, 2010 to July 1, 2015.
- Kim DK, Riley LE, Harriman KH, Hunter P, Bridges CB, Advisory Committee on Immunization Practices. Recommended immunization schedule for adults aged 19 years or older, United States, 2017. Ann Intern Med 166(3):209-19. 2017.
- Larson E. Racial and ethnic disparities in immunizations: Recommendations for clinicians. Fam Med 35(9):655-60. 2003.
- National Foundation for Infectious Diseases. A report on reaching underserved ethnic and minority populations to improve adolescent and adult immunization rates. Bethesda, MD. 2002.
- 7. National Center for Health Statistics. Multiple imputation of family income and personal earnings in the National Health Interview Survey: Methods and examples. 2016. Available from: https://www.cdc.gov/nchs/data/nhis/tecdoc15.pdf.
- Parsons VL, Moriarity C, Jonas K, et al. Design and estimation for the National Health Interview Survey, 2006-2015. National Center for Health Statistics. Vital Health Stat 2(165). 2014.
- RTI International. SUDAAN (Release 11.0.01) [computer software]. 2013.
Suggested citation
Norris T, Vahratian A, Cohen RA. Vaccination coverage among adults aged 65 and over: United States, 2015. NCHS data brief, no 281. Hyattsville, MD: National Center for Health Statistics. 2017.
Copyright information
All material appearing in this report is in the public domain and may be reproduced or copied without permission; citation as to source, however, is appreciated.
National Center for Health Statistics
Charles J. Rothwell, M.S., M.B.A., Director
Jennifer H. Madans, Ph.D., Associate Director for Science
Division of Health Interview Statistics
Marcie L. Cynamon, Director
Stephen J. Blumberg, Ph.D., Associate Director for Science