Barriers to Health Care for Adults With Multiple Chronic Conditions: United States, 2012–2015
- Key findings
- In 2015, the percentage of adults who had seen or talked to a health care professional in the past 12 months increased as the number of diagnosed chronic conditions increased.
- In 2015, the percentage of adults who delayed or did not obtain needed medical care due to cost in the past 12 months increased as the number of diagnosed chronic conditions increased.
- In 2015, the percentage of adults who delayed needed medical care for a non-cost reason in the past 12 months increased as the number of diagnosed chronic conditions increased.
- For 2012–2015, the percentage of adults with two or more chronic conditions who delayed or did not obtain needed medical care for any reason decreased for adults aged 18–64, but the percentage increased for adults aged 65 and over.
- Summary
- Definitions
- Data source and methods
- About the author
- References
- Suggested citation
NCHS Data Brief No. 275, March 2017
PDF Version (770 KB)
Brian W. Ward, Ph.D.
Key findings
Data from the National Health Interview Survey
- In 2015, the percentage of adults aged 18–64 who delayed or did not obtain needed medical care due to cost in the past 12 months was highest among those diagnosed with 2 or more of 10 selected chronic conditions (16.9%), and it was lowest among those with none of the selected conditions (8.5%).
- The percentage of adults who delayed needed medical care for a non-cost reason in the past 12 months increased as the number of conditions increased.
- The percentage of adults who had seen or talked to a health professional in the past 12 months increased as the number of conditions increased.
- For 2012–2015, the percentage of adults aged 18–64 with two or more conditions who delayed or did not obtain needed medical care due to cost decreased, while the percentage who delayed medical care for a non-cost reason increased.
In 2014, 25.7% of adults had been diagnosed with multiple chronic conditions (MCC), or 2 or more of 10 selected chronic conditions, including hypertension, cancer, stroke, coronary heart disease, diabetes, arthritis, hepatitis, current asthma, weak or failing kidneys, and chronic obstructive pulmonary disease (1). As the number of chronic conditions increases, so do the health care costs for those diagnosed with MCC (2). In addition, the costs of managing these conditions further increases with advancing age (3). This report examines health care access and utilization among adults with MCC compared with those with one or no diagnosed chronic conditions.
Keywords: unmet medical needs, National Health Interview Survey
In 2015, the percentage of adults who had seen or talked to a health care professional in the past 12 months increased as the number of diagnosed chronic conditions increased.
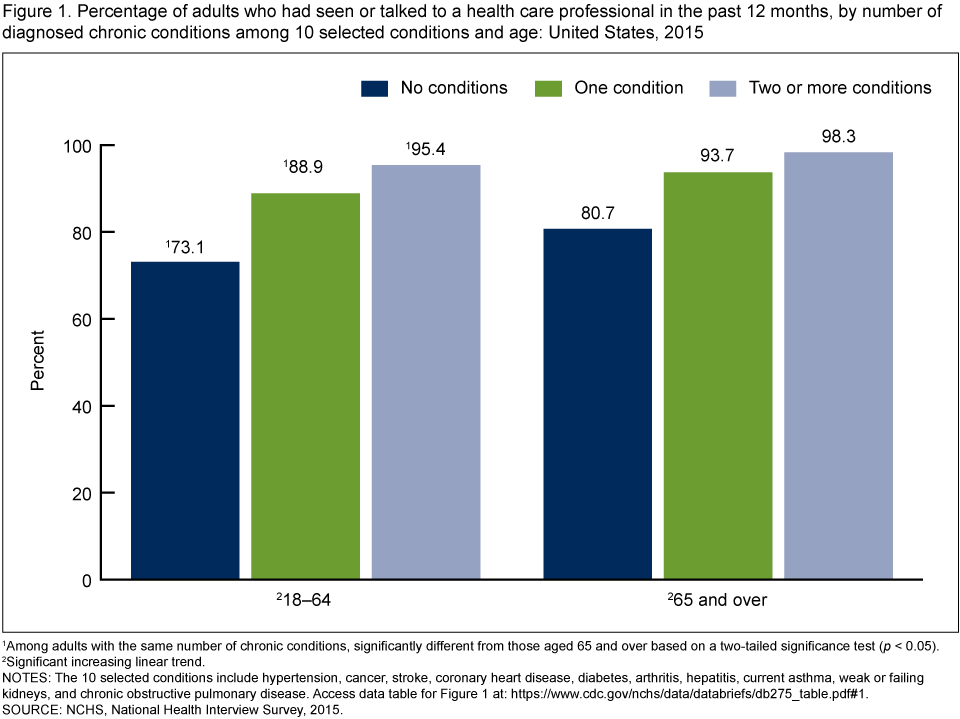
- For adults aged 18–64, 73.1% of those without a chronic condition had seen or talked to a health care professional in the past 12 months. This percentage increased to 95.4% among those with two or more chronic conditions (Figure 1).
- The percentage of adults aged 65 and over who had seen or talked to a health care professional in the past 12 months was lowest among those without a chronic condition (80.7%) and highest among those with two or more chronic conditions (98.3%).
- Among adults with the same number of diagnosed chronic conditions, those aged 18–64 were less likely than adults aged 65 and over to have seen or talked to a health care professional in the past 12 months.
Figure 1. Percentage of adults who had seen or talked to a health care professional in the past 12 months, by number of diagnosed chronic conditions among 10 selected conditions and age: United States, 2015
1Among adults with the same number of chronic conditions, significantly different from those aged 65 and over based on a two-tailed significance test (p < 0.05).
2Significant increasing linear trend.
NOTES: The 10 selected conditions include hypertension, cancer, stroke, coronary heart disease, diabetes, arthritis, hepatitis, current asthma, weak or failing kidneys, and chronic obstructive pulmonary disease. Access data table for Figure 1.
SOURCE: NCHS, National Health Interview Survey, 2015.
In 2015, the percentage of adults who delayed or did not obtain needed medical care due to cost in the past 12 months increased as the number of diagnosed chronic conditions increased.
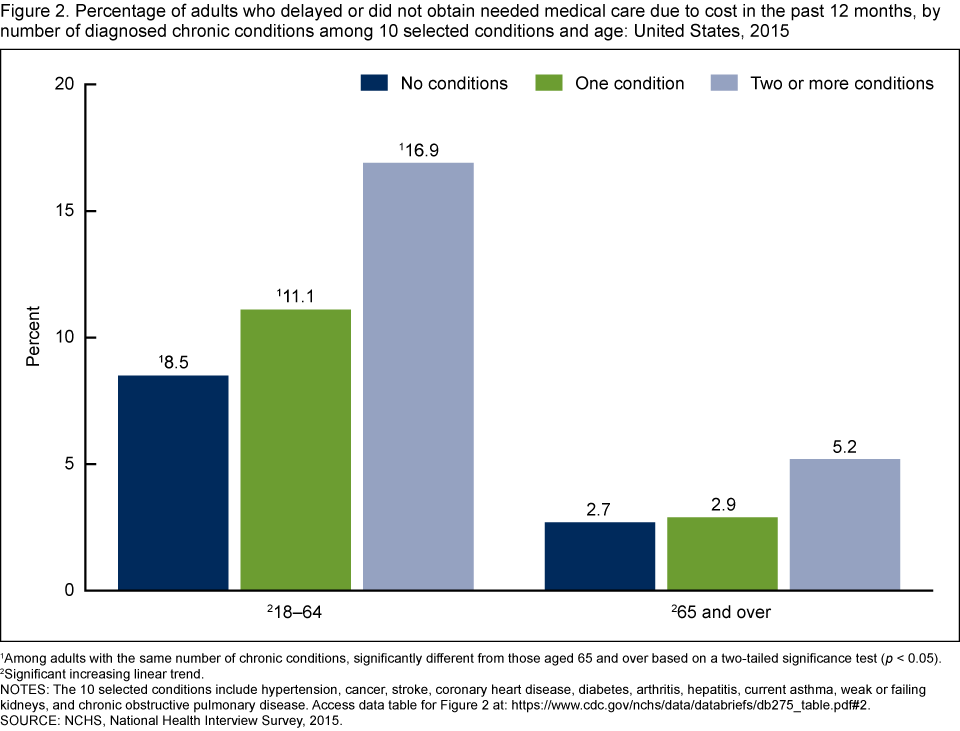
- The percentage of adults aged 18–64 who delayed or did not obtain needed medical care due to cost in the past 12 months was lowest among those without a chronic condition (8.5%) and highest among those with two or more chronic conditions (16.9%) (Figure 2).
- Among adults aged 65 and over, those with two or more chronic conditions were more likely to have delayed or not obtained needed medical care due to cost in the past 12 months (5.2%) compared with adults without a chronic condition (2.7%) and those with one chronic condition (2.9%).
- Among adults with the same number of diagnosed chronic conditions, the percentage of adults who delayed or did not obtain needed medical care due to cost in the past 12 months was higher among those aged 18–64 compared with those aged 65 and over.
Figure 2. Percentage of adults who delayed or did not obtain needed medical care due to cost in the past 12 months, by number of diagnosed chronic conditions among 10 selected conditions and age: United States, 2015
1Among adults with the same number of chronic conditions, significantly different from those aged 65 and over based on a two-tailed significance test (p < 0.05).
2Significant increasing linear trend.
NOTES: The 10 selected conditions include hypertension, cancer, stroke, coronary heart disease, diabetes, arthritis, hepatitis, current asthma, weak or failing kidneys, and chronic obstructive pulmonary disease. Access data table for Figure 2.
SOURCE: NCHS, National Health Interview Survey, 2015.
In 2015, the percentage of adults who delayed needed medical care for a non-cost reason in the past 12 months increased as the number of diagnosed chronic conditions increased.
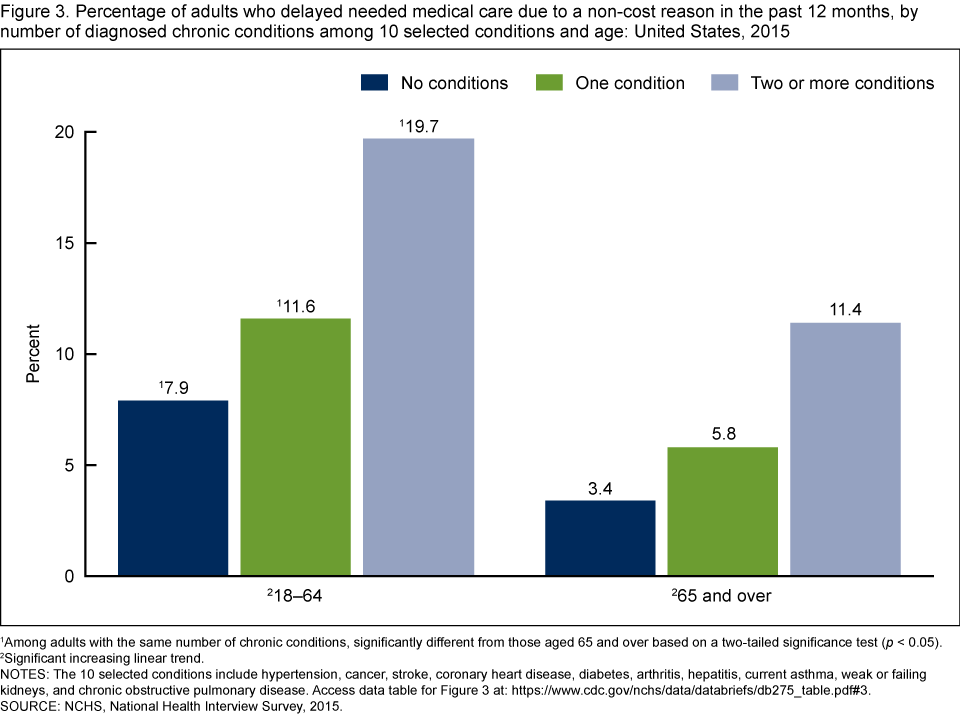
- For adults aged 18–64, 7.9% of those without a chronic condition delayed needed medical care due to a non-cost reason in the past 12 months compared with 19.7% of those with two or more chronic conditions (Figure 3).
- The percentage of adults aged 65 and over who delayed needed medical care due to a non-cost reason in the past 12 months was lowest among those without a chronic condition (3.4%) and highest among those with two or more chronic conditions (11.4%).
- Among adults with the same number of diagnosed chronic conditions, those aged 18–64 were more likely than those aged 65 and over to have delayed needed medical care for a non-cost reason in the past 12 months.
Figure 3. Percentage of adults who delayed needed medical care due to a non-cost reason in the past 12 months, by number of diagnosed chronic conditions among 10 selected conditions and age: United States, 2015
1Among adults with the same number of chronic conditions, significantly different from those aged 65 and over based on a two-tailed significance test (p < 0.05).
2Significant increasing linear trend.
NOTES: The 10 selected conditions include hypertension, cancer, stroke, coronary heart disease, diabetes, arthritis, hepatitis, current asthma, weak or failing kidneys, and chronic obstructive pulmonary disease. Access data table for Figure 3.
SOURCE: NCHS, National Health Interview Survey, 2015.
For 2012–2015, the percentage of adults with two or more chronic conditions who delayed or did not obtain needed medical care for any reason decreased for adults aged 18–64, but the percentage increased for adults aged 65 and over.
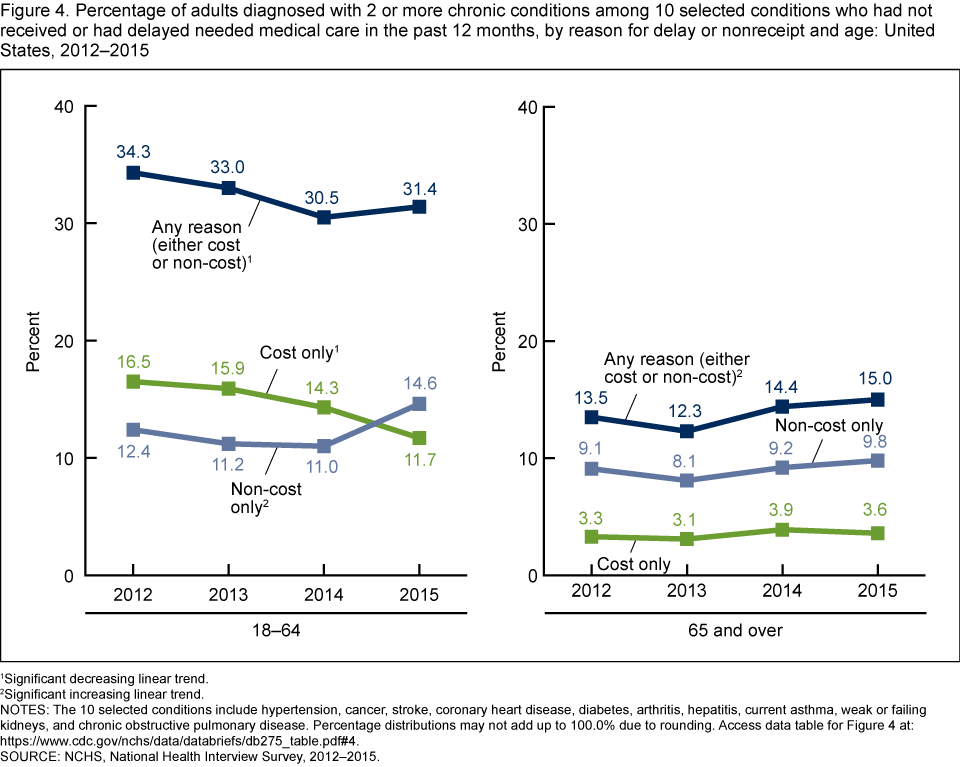
- There was a decreasing trend in the percentage of adults aged 18–64 with two or more chronic conditions who delayed or did not obtain needed medical care for any reason in the past 12 months, from 34.3% in 2012 to 31.4% in 2015 (Figure 4).
- There was an increasing trend in the percentage of adults aged 65 and over with two or more chronic conditions who delayed or did not obtain needed medical care for any reason in the past 12 months, from 13.5% in 2012 to 15.0% in 2015.
- The percentage of adults aged 18–64 with two or more chronic conditions who delayed or did not obtain needed medical care due only to cost in the past 12 months decreased, from 16.5% in 2012 to 11.7% in 2015.
- There was an increasing trend in the percentage of adults aged 18–64 with two or more chronic conditions who delayed needed medical care due only to a non-cost reason in the past 12 months, from 12.4% in 2012 to 14.6% in 2015.
- Among adults aged 65 and over with two or more chronic conditions, there was no significant change in the percentage who delayed or did not obtain needed medical care in the past 12 months due only to cost or only for a non-cost reason.
Figure 4. Percentage of adults diagnosed with 2 or more chronic conditions among 10 selected conditions who had not received or had delayed needed medical care in the past 12 months, by reason for delay or nonreceipt and age: United States, 2012–2015
1Significant decreasing linear trend.
2Significant increasing linear trend.
NOTES: The 10 selected conditions include hypertension, cancer, stroke, coronary heart disease, diabetes, arthritis, hepatitis, current asthma, weak or failing kidneys, and chronic obstructive pulmonary disease. Percentage distributions may not add up to 100.0% due to rounding. Access data table for Figure 4.
SOURCE: NCHS, National Health Interview Survey, 2012–2015.
Summary
This report compares national estimates of health care access and utilization among adults diagnosed with 2 or more of 10 selected chronic conditions and adults diagnosed with 1 or none of the selected conditions. In 2015, adults with two or more conditions were more likely to use health care services in the past 12 months compared with those with one chronic condition or those without a chronic condition. However, adults with two or more conditions were more likely to delay or not obtain needed medical care due to cost and non-cost related reasons compared with those with less than two conditions.
Regardless of the number of diagnosed chronic conditions, adults aged 18–64 were less likely to use health services in the past 12 months compared with those aged 65 and over, and they were more likely to delay or not obtain needed medical care due to cost and non-cost related reasons. For 2012–2015, no significant changes were found in the prevalence of delay or non-receipt of care due only to cost or only for a non-cost reason among adults aged 65 and over with two or more chronic conditions. However, there was an increase in the percentage of adults aged 65 and over who delayed or did not obtain care for any reason. For adults aged 18–64 with two or more chronic conditions, there was a decrease in the percentage who delayed or did not receive needed medical care in the past 12 months due only to cost during this same time period. By 2015, a higher percentage of adults delayed care for a non-cost reason (14.6%) compared with a cost reason (11.7%).
In summary, adults with two or more chronic conditions may be more likely than those with one or no chronic conditions to use health care services, but they also experience more barriers to health care. For 2012–2015, the reasons for these barriers have changed for adults aged 18–64 with two or more chronic conditions.
Definitions
Delayed needed medical care due to a non-cost reason: Adults were asked, “Have you delayed getting care for any of the following reasons in the past 12 months?” Reasons provided included being unable to get through on the telephone, being unable to get an appointment soon enough, having to wait too long to see the doctor after arriving, not having the clinic or doctor’s office open when the adult was able to get there, or not having transportation. An affirmative answer to any one of these questions indicated that needed medical care was delayed due to a non-cost reason.
Delayed or did not obtain needed medical care due to cost in the past 12 months: Respondents were asked, “During the past 12 months, has medical care been delayed for [the adult] because of worry about the cost?” and “During the past 12 months, was there a time when [the adult] needed medical care, but did not get it because the adult could not afford it?” An affirmative response to either one of these questions indicated that needed medical care was delayed or not obtained.
Multiple chronic conditions: Having been diagnosed with 2 or more of 10 selected chronic conditions. The conditions selected were based on previous research (1,4). These 10 conditions included whether an adult had ever been diagnosed by a doctor or other health care professional with hypertension, cancer, stroke, coronary heart disease, diabetes, arthritis (including rheumatoid arthritis, gout, lupus, and fibromyalgia), and hepatitis. Also included was a current diagnosis of asthma, a diagnosis of weak or failing kidneys in the past 12 months, and a diagnosis of chronic obstructive pulmonary disease (COPD) (indicated by having ever been diagnosed with COPD or emphysema or having been diagnosed with chronic bronchitis in the past 12 months). Of note, 2012 was the first year a survey question asking adults if they had ever been diagnosed with COPD was included on the National Health Interview Survey (NHIS) (5).
Seen or talked to a health care professional in the past 12 months: Adults were asked, “About how long has it been since you last saw or talked to a doctor or other health care professional about your own health? Include doctors seen while a patient in a hospital.” Responses of “6 months or less” and “more than 6 months, but not more than 1 year ago” were combined.
Data source and methods
Data from 139,451 adults who responded to the 2012–2015 NHIS were used for this analysis, including 33,672 respondents from the 2015 survey. NHIS is a multipurpose health survey conducted continuously throughout the year by the National Center for Health Statistics (NCHS). Interviews are conducted in person in respondents’ homes, but follow-ups to complete interviews may be conducted over the telephone. Questions about delaying and not receiving needed medical care due to cost are from the survey’s Family Core component, while all remaining questions used in this analysis are from the Sample Adult component. The Family Core component collects information on all family members, and the Sample Adult component collects additional data from one randomly selected adult (“sample adult”). The final Sample Adult response rates for the 2012–2015 NHIS ranged from 61.2% in 2012 to 55.2% in 2015. For further information about NHIS, including the questionnaire, visit the NHIS website.
All analyses used weights to produce national estimates. Data weighting procedures are described elsewhere (6). Point estimates and their estimated variances were calculated using SUDAAN software (7) and the Taylor series linearization method to account for the complex design of NHIS. Two-sided significance tests at the 0.05 level were used to compare estimates. Logistic regression was used to assess linear trends. All estimates shown in this report meet the NCHS standard of reliability (relative standard error less than or equal to 30%).
About the author
Brian W. Ward is with the National Center for Health Statistics, Division of Health Interview Statistics.
References
- Ward BW, Black LI. State and regional prevalence of diagnosed multiple chronic conditions among adults aged ≥18 years—United States, 2014. MMWR Morb Mortal Wkly Rep 65(29):735–8. 2016.
- Lehnert T, Heider D, Leicht H, Heinrich S, Corrieri S, Luppa M, et al. Review: Health care utilization and costs of elderly persons with multiple chronic conditions. Med Care Res Rev 68(4):387–420. 2011.
- Paez KA, Zhao L, Hwang W. Rising out-of-pocket spending for chronic conditions: A ten-year trend. Health Aff (Millwood) 28(1):15–25. 2009.
- Goodman RA, Posner SF, Huang ES, Parekh AK, Koh HK. Defining and measuring chronic conditions: Imperatives for research, policy, program, and practice. Prev Chronic Dis 10:120239. 2013.
- Ward BW, Nugent CN, Blumberg SJ, Vahratian A. Measuring the prevalence of diagnosed chronic obstructive pulmonary disease in the United States using data from the 2012–2014 National Health Interview Survey. Public Health Rep 132(2). 2017.
- Parsons VL, Moriarity C, Jonas K. Design and estimation for the National Health Interview Survey, 2006–2015. National Center for Health Statistics. Vital Health Stat 2(165). 2014.
- RTI International. SUDAAN (Release 11.0.0) [computer software]. 2012.
Suggested citation
Ward BW. Barriers to health care for adults with multiple chronic conditions: United States, 2012–2015. NCHS data brief, no 275. Hyattsville, MD: National Center for Health Statistics. 2017.
Copyright information
All material appearing in this report is in the public domain and may be reproduced or copied without permission; citation as to source, however, is appreciated.
National Center for Health Statistics
Charles J. Rothwell, M.S., M.B.A., Director
Jennifer H. Madans, Ph.D., Associate Director for Science
Division of Health Interview Statistics
Marcie L. Cynamon, Director
Stephen J. Blumberg, Ph.D., Associate Director for Science