Drug Overdose Deaths in the United States, 1999–2015
- Key findings
- In 2015, the age-adjusted rate of drug overdose deaths in the United States was more than 2.5 times the rate in 1999.
- Adults aged 45–54 had the highest rate of drug overdose deaths in 2015.
- In 2015, the age-adjusted rate of drug overdose deaths among non-Hispanic white persons was nearly 3.5 times the rate in 1999.
- In 2015, 21 states had age-adjusted drug overdose rates that were statistically higher than the national rate.
- In 2015, the percentage of drug overdose deaths involving heroin was triple the percentage in 2010.
- Summary
- Definitions
- Data source and methods
- About the authors
- References
- Suggested citation
NCHS Data Brief No. 273, February 2017
PDF Version (521 KB)
Holly Hedegaard, M.D., Margaret Warner, Ph.D., and Arialdi M. Miniño, M.P.H.
On February 28, 2017, the last bullet under the Key findings section on page 1 was revised to correct a typographical error. The year in the latter part of the sentence was changed from 1999 to 2010 as follows: In 2015, the percentage of drug overdose deaths involving heroin (25%) was triple the percentage in 2010 (8%).
Key findings
Data from the National Vital Statistics System, Mortality
- The age-adjusted rate of drug overdose deaths in the United States in 2015 (16.3 per 100,000) was more than 2.5 times the rate in 1999 (6.1).
- Drug overdose death rates increased for all age groups, with the greatest percentage increase among adults aged 55–64 (from 4.2 per 100,000 in 1999 to 21.8 in 2015). In 2015, adults aged 45–54 had the highest rate (30.0).
- In 2015, the age-adjusted rate of drug overdose deaths among non-Hispanic white persons (21.1 per 100,000) was nearly 3.5 times the rate in 1999 (6.2).
- The four states with the highest age-adjusted drug overdose death rates in 2015 were West Virginia (41.5), New Hampshire (34.3), Kentucky (29.9), and Ohio (29.9).
- In 2015, the percentage of drug overdose deaths involving heroin (25%) was triple the percentage in 2010 (8%).
Deaths from drug overdose have been identified as a significant public health burden in the United States in recent years (1–4). This report uses data from the National Vital Statistics System (NVSS) to highlight recent trends in drug overdose deaths, describing demographic and geographic patterns as well as the types of drugs involved.
Keywords: poisoning, opioids, heroin, National Vital Statistics System Mortality File
In 2015, the age-adjusted rate of drug overdose deaths in the United States was more than 2.5 times the rate in 1999.
- The age-adjusted rate of drug overdose deaths increased from 6.1 per 100,000 standard population in 1999 to 16.3 in 2015, an overall average increase of 5.5% per year (Figure 1). The rate increased on average by 10% per year from 1999 to 2006, by 3% per year from 2006 to 2013, and by 9% per year from 2013 to 2015.
- For males, the rate increased from 8.2 per 100,000 in 1999 to 20.8 in 2015, an overall average increase of 5% per year. The rate increased on average by 9% per year from 1999 to 2006, by 2% per year from 2006 to 2013, and by 12% per year from 2013 to 2015.
- For females, the rate increased from 3.9 per 100,000 in 1999 to 11.8 in 2015, an overall average increase of 6% per year. The rate increased on average by 11% per year from 1999 to 2006 and by 4% per year from 2006 to 2015.
Figure 1. Age-adjusted drug overdose death rates, by sex: United States, 1999–2015
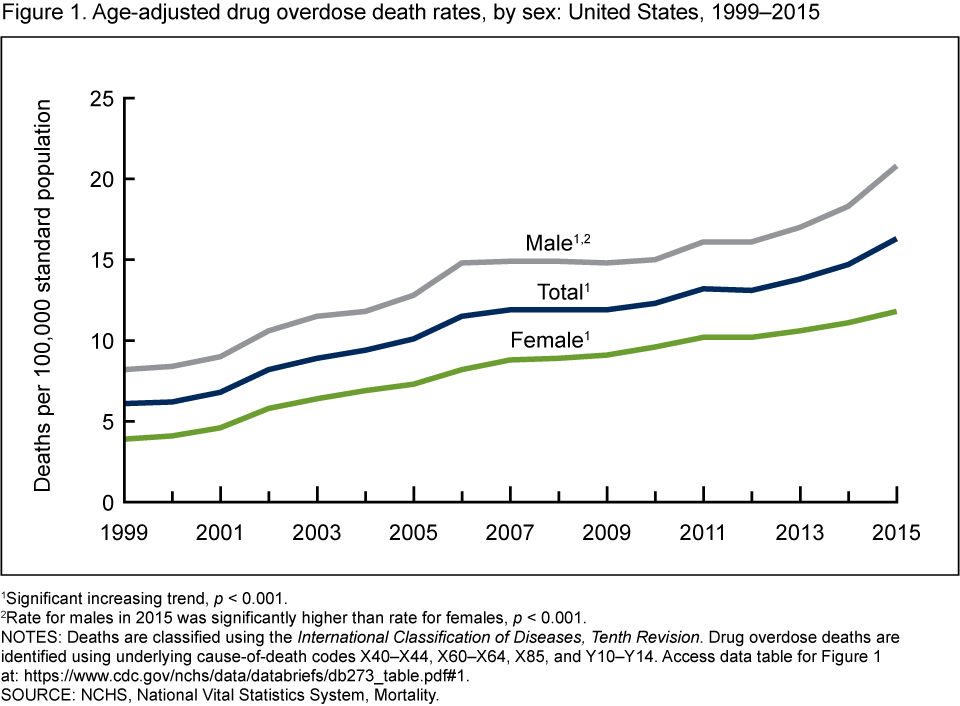
1Significant increasing trend, p < 0.001.
2Rate for males in 2015 was significantly higher than rate for females, p < 0.001.
NOTES: Deaths are classified using the International Classification of Diseases, Tenth Revision. Drug overdose deaths are identified using underlying cause-of-death codes X40–X44, X60–X64, X85, and Y10–Y14. Access data table for Figure 1.
SOURCE: NCHS, National Vital Statistics System, Mortality.
Adults aged 45–54 had the highest rate of drug overdose deaths in 2015.
- The rates of drug overdose deaths increased from 1999 to 2015 for all age groups (Figure 2).
- The greatest percentage increase occurred in the drug overdose death rate for adults aged 55–64, from 4.2 per 100,000 in 1999 to 21.8 in 2015, an average increase of 10.5% per year.
- In 2015, adults aged 45–54 had the highest death rate from drug overdose at 30 deaths per 100,000.
- In 2015, rates for adults aged 25–34, 35–44, 45–54, and 55–64 were more than twice the rate for younger adults aged 15–24, and more than 3.5 times the rate for adults aged 65 and over.
Figure 2. Drug overdose death rates, by age group: United States, 1999–2015
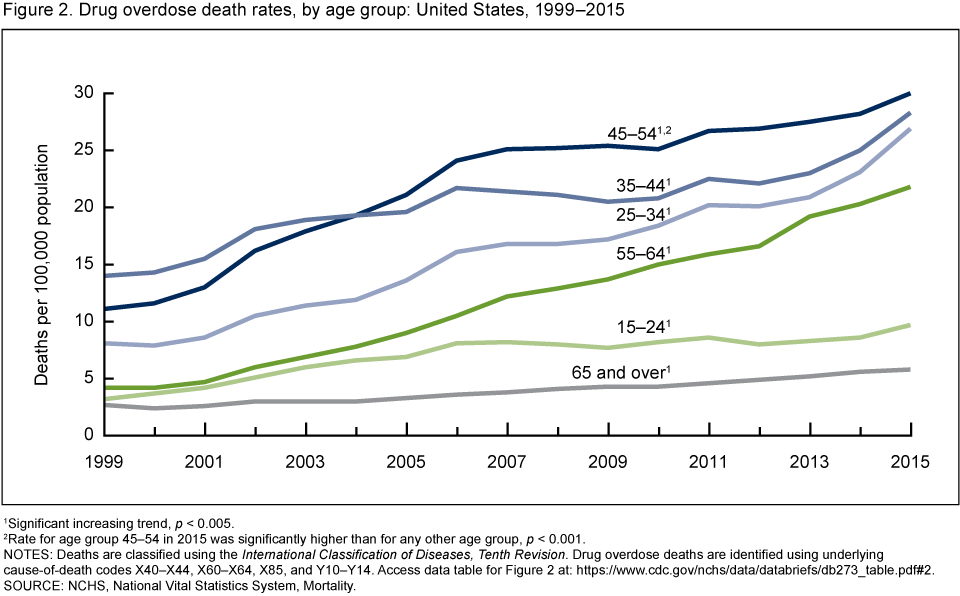
1Significant increasing trend, p < 0.005.
2Rate for age group 45–54 in 2015 was significantly higher than for any other age group, p < 0.001.
NOTES: Deaths are classified using the International Classification of Diseases, Tenth Revision. Drug overdose deaths are identified using underlying cause-of-death codes X40–X44, X60–X64, X85, and Y10–Y14. Access data table for Figure 2.
SOURCE: NCHS, National Vital Statistics System, Mortality.
In 2015, the age-adjusted rate of drug overdose deaths among non-Hispanic white persons was nearly 3.5 times the rate in 1999.
- In 2015, non-Hispanic white persons had a higher age-adjusted rate of drug overdose deaths (21.1 per 100,000) than non-Hispanic black (12.2) and Hispanic (7.7) persons (p < 0.001) (Figure 3).
- From 1999 to 2015, the age-adjusted rate of drug overdose deaths among non-Hispanic white persons increased from 6.2 to 21.1 per 100,000, an average increase of 7% per year.
- Rates also increased for non-Hispanic black persons from 7.5 in 1999 to 12.2 in 2015, an average increase of 2% per year.
- Rates for Hispanic persons increased from 5.4 in 1999 to 7.7 in 2015, an average increase of 2% per year.
Figure 3. Age-adjusted drug overdose death rates, by race and ethnicity: United States, 1999–2015
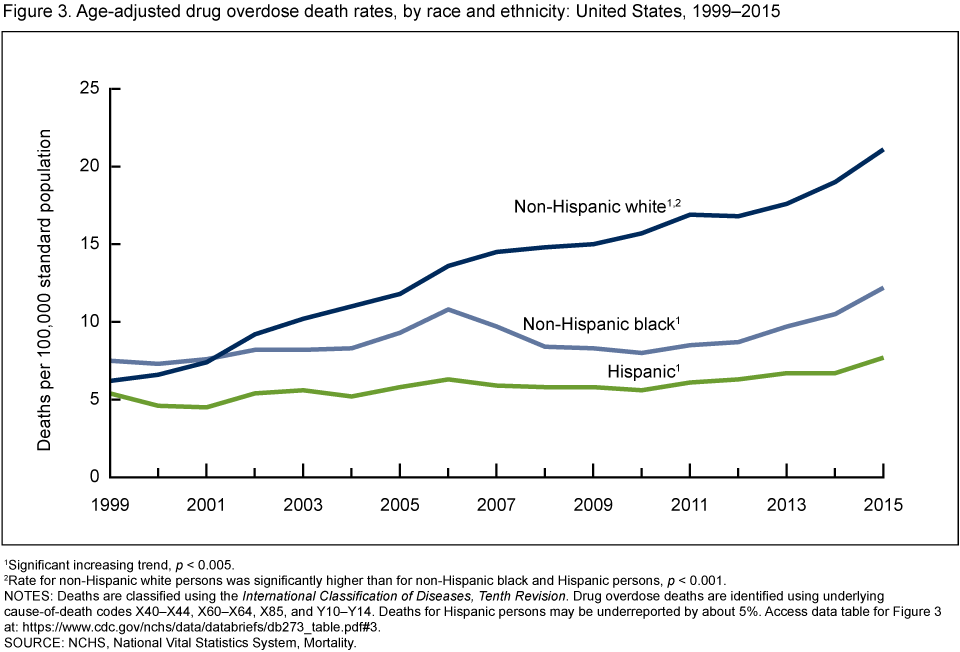
1Significant increasing trend, p < 0.005.
2Rate for non-Hispanic white persons was significantly higher than for non-Hispanic black and Hispanic persons, p < 0.001.
NOTES: Deaths are classified using the International Classification of Diseases, Tenth Revision. Drug overdose deaths are identified using underlying cause-of-death codes X40–X44, X60–X64, X85, and Y10–Y14. Deaths for Hispanic persons may be underreported by about 5%. Access data table for Figure 3.
SOURCE: NCHS, National Vital Statistics System, Mortality.
In 2015, 21 states had age-adjusted drug overdose rates that were statistically higher than the national rate.
- In 2015, the four states with the highest age-adjusted drug overdose death rates were West Virginia (41.5 per 100,000), New Hampshire (34.3), Kentucky (29.9), and Ohio (29.9) (Figure 4).
- Other states with rates that were statistically higher than the national rate of 16.3 per 100,000 included Rhode Island (28.2), Pennsylvania (26.3), Massachusetts (25.7), New Mexico (25.3), Utah (23.4), Tennessee (22.2), Connecticut (22.1), Delaware (22.0), Maine (21.2), Maryland (20.9), Michigan (20.4), Nevada (20.4), Indiana (19.5), Louisiana (19.0), Arizona (19.0), Oklahoma (19.0), and Missouri (17.9).
- States with rates that were statistically lower than the national rate included Washington (14.7 per 100,000), Idaho (14.2), Illinois (14.1), Arkansas (13.8), Montana (13.8), New York (13.6), Georgia (12.7), Virginia (12.4), Mississippi (12.3), Oregon (12.0), Kansas (11.8), California (11.3), Hawaii (11.3), Minnesota (10.6), Iowa (10.3), Texas (9.4), North Dakota (8.6), South Dakota (8.4), and Nebraska (6.9).
Figure 4. Age-adjusted drug overdose death rates, by state: United States, 2015
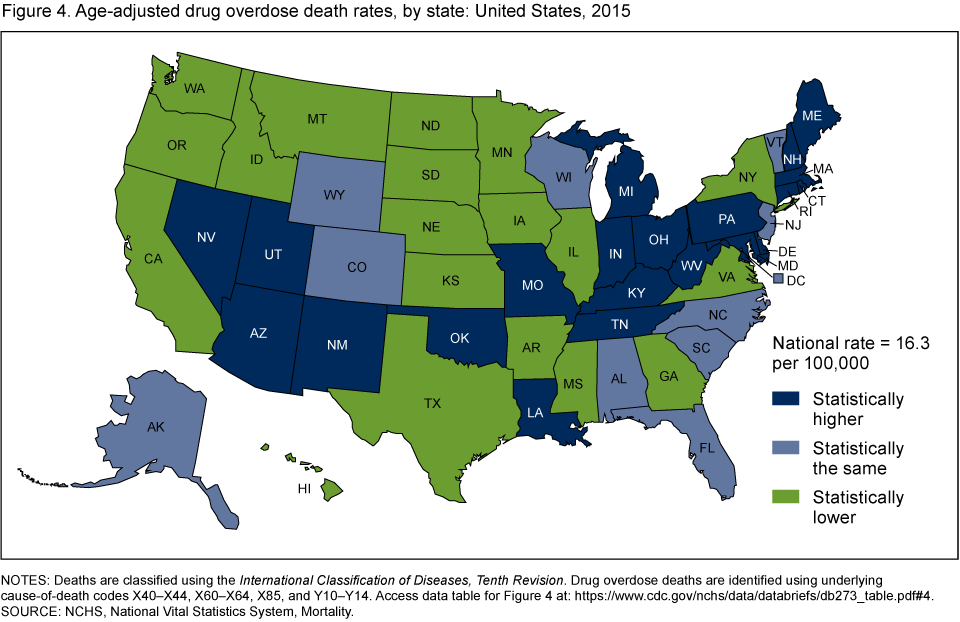
NOTES: Deaths are classified using the International Classification of Diseases, Tenth Revision. Drug overdose deaths are identified using underlying cause-of-death codes X40–X44, X60–X64, X85, and Y10–Y14. Access data table for Figure 4.
SOURCE: NCHS, National Vital Statistics System, Mortality.
In 2015, the percentage of drug overdose deaths involving heroin was triple the percentage in 2010.
- Deaths from drug overdose involving heroin tripled from 8% in 2010 to 25% in 2015 (Figure 5).
- For drug overdose deaths involving natural and semisynthetic opioid analgesics, which include drugs such as oxycodone and hydrocodone, the percentage decreased from 29% in 2010 to 24% in 2015.
- The percentage of drug overdose deaths involving methadone also decreased, from 12% in 2010 to 6% in 2015.
- For drug overdose deaths involving synthetic opioids other than methadone, which include drugs such as fentanyl and tramadol, the percentage increased from 8% in 2010 to 18% in 2015.
- The percentage of drug overdose deaths involving cocaine increased from 11% in 2010 to 13% in 2015.
- Drug overdose deaths involving psychostimulants with abuse potential, which include drugs such as methamphetamine, increased from 5% in 2010 to 11% in 2015.
Figure 5. Percentage of drug overdose deaths involving selected drug categories: United States, 2010, 2014, and 2015
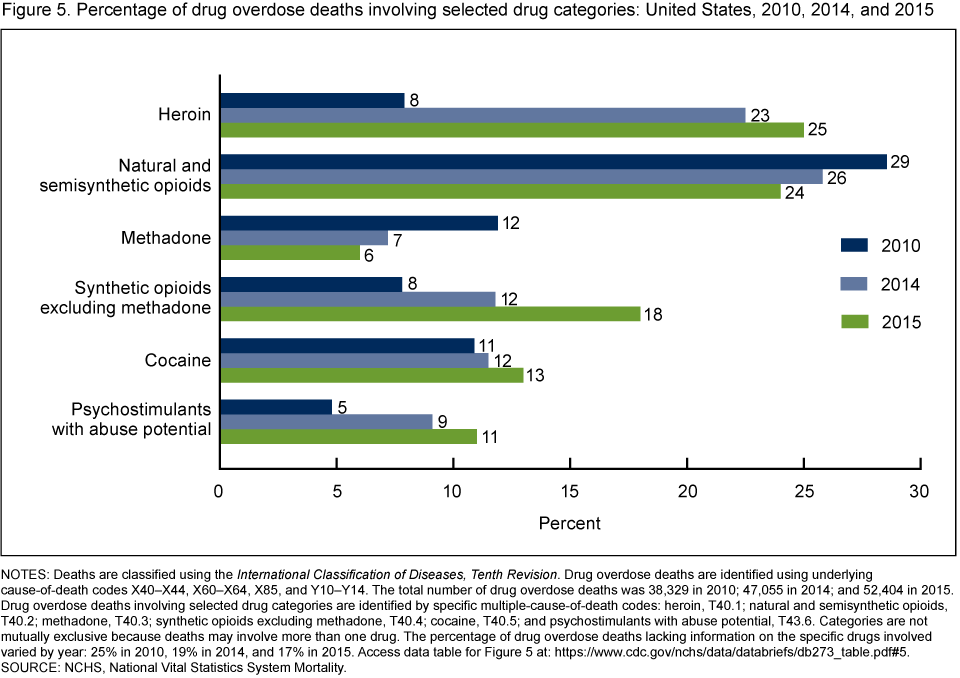
NOTES: Deaths are classified using the International Classification of Diseases, Tenth Revision. Drug overdose deaths are identified using underlying cause-of-death codes X40–X44, X60–X64, X85, and Y10–Y14. The total number of drug overdose deaths was 38,329 in 2010; 47,055 in 2014; and 52,404 in 2015. Drug overdose deaths involving selected drug categories are identified by specific multiple-cause-of-death codes: heroin, T40.1; natural and semisynthetic opioids, T40.2; methadone, T40.3; synthetic opioids excluding methadone, T40.4; cocaine, T40.5; and psychostimulants with abuse potential, T43.6. Categories are not mutually exclusive because deaths may involve more than one drug. The percentage of drug overdose deaths lacking information on the specific drugs involved varied by year: 25% in 2010, 19% in 2014, and 17% in 2015. Access data table for Figure 5.
SOURCE: NCHS, National Vital Statistics System Mortality.
Summary
This report updates statistics on deaths from drug overdoses in the United States and includes information on trends since 1999 as well as key statistics for 2015.
Rates of drug overdose deaths continued to increase. In 2015, the age-adjusted rate of drug overdose deaths (16.3 per 100,000) was more than 2.5 times the rate in 1999 (6.1). Increases were seen for both males (from 8.2 in 1999 to 20.8 in 2015) and females (from 3.9 in 1999 to 11.8 in 2015).
Rates increased for all age groups, with the largest percentage increase seen for adults aged 55–64. This age group had a fivefold increase in the rates of drug overdose deaths, from 4.2 per 100,000 in 1999 to 21.8 in 2015. Since 2005, rates have been highest for adults aged 45–54.
Although rates increased 63% for non-Hispanic black persons (from 7.5 per 100,000 in 1999 to 12.2 in 2015) and 43% for Hispanic persons (from 5.4 in 1999 to 7.7 in 2015), non-Hispanic white persons experienced the greatest increase between 1999 and 2015. The age-adjusted rate of drug overdose deaths among non-Hispanic white persons increased 240% from 6.2 per 100,000 in 1999 to 21.1 in 2015.
The pattern of drugs involved in drug overdose deaths also has changed in recent years. In 2010, 29% of drug overdose deaths involved natural and semisynthetic opioids and 12% involved methadone. In 2015, the percentage of drug overdose deaths involving these drugs decreased to 24% and 6%, respectively. In contrast, drug overdose deaths involving heroin increased from 8% in 2010 to 25% in 2015. Increases also were seen in drug overdose deaths involving synthetic opioids other than methadone, from 8% in 2010 to 18% in 2015.
Definitions
Drug poisoning (overdose) deaths: Include deaths resulting from unintentional or intentional overdose of a drug, being given the wrong drug, taking a drug in error, or taking a drug inadvertently.
Natural and semisynthetic opioid analgesics: Include such drugs as morphine, codeine, hydrocodone, and oxycodone.
Synthetic opioids, excluding methadone: Include such drugs as fentanyl, fentanyl analogs, and tramadol.
Psychostimulants with abuse potential: Include such drugs as methamphetamine, amphetamine, methylphenidate (Ritaline), caffeine, and 3,4-methylenedioxy-methamphetamine (MDMA, Ecstasy).
Data source and methods
Estimates are based on the NVSS multiple-cause-of-death mortality files (5). Drug poisoning (overdose) deaths were defined as having an International Classification of Diseases, Tenth Revision (ICD–10) underlying-cause-of-death code of X40–X44 (unintentional), X60–X64 (suicide), X85 (homicide), or Y10–Y14 (undetermined intent). Of the drug overdose deaths in 2015, 84% were unintentional, 10% were suicides, 6% were of undetermined intent, and less than 1% were homicides. The type of drug(s) involved are indicated by ICD–10 multiple-cause-of-death codes: heroin (T40.1); natural and semisynthetic opioids (T40.2); methadone (T40.3); synthetic opioids excluding methadone (T40.4); cocaine (T40.5); and psychostimulants with abuse potential (T43.6).
Age-adjusted death rates were calculated using the direct method and adjusted to the 2000 standard population (6). Data for Hispanic origin should be interpreted with caution (7). Differences between national and state estimates were evaluated using two-sided significance tests at the 0.01 level, with the national rate treated as a fixed parameter. Trends in death rates were evaluated using the Joinpoint Regression Program (8). For simplicity of presentation, the “no joinpoints” option was selected for the trends specific to age group and race and ethnicity. Unless otherwise stated, all comparisons are statistically significant at the 0.05 level of significance.
Several factors related to death investigation and reporting may affect measurement of death rates involving specific drugs. At autopsy, the substances tested for and the circumstances under which the toxicology tests are performed vary by jurisdiction. This variability is more likely to affect substance-specific death rates than the overall drug overdose death rate. In 2015, 17% of drug overdose deaths did not include information on the specific type of drug(s) involved.
Additionally, drug overdose deaths may involve multiple drugs; therefore, a single death might be included in more than one category when describing the percentage of drug overdose deaths involving specific drugs. For example, a death that involved both heroin and fentanyl would be included in both the percentage of drug overdose deaths involving heroin and the percentage of drug overdose deaths involving synthetic opioids excluding methadone.
About the authors
Holly Hedegaard is with the National Center for Health Statistics (NCHS), Office of Analysis and Epidemiology. Margaret Warner and Arialdi M. Miniño are with the NCHS Division of Vital Statistics.
References
- Warner M, Chen LH, Makuc DM, et al. Drug poisoning deaths in the United States, 1980–2008. NCHS data brief, no 81. Hyattsville, MD: National Center for Health Statistics. 2011.
- Chen LH, Hedegaard H, Warner M. Drug-poisoning deaths involving opioid analgesics: United States, 1999–2011. NCHS data brief, no 166. Hyattsville, MD: National Center for Health Statistics. 2014.
- Hedegaard H, Chen LH, Warner M. Drug-poisoning deaths involving heroin: United States, 2000–2013. NCHS data brief, no 190. Hyattsville, MD: National Center for Health Statistics. 2015.
- Rudd RA, Seth P, David F, Scholl L. Increases in drug and opioid-involved overdose deaths—United States, 2010–2015. MMWR Morb Mortal Wkly Rep 65:1445–52. 2016.
- National Center for Health Statistics. Public-use data files: Mortality multiple cause files. 2015.
- Murphy SL, Xu JQ, Kochanek KD. Deaths: Final data for 2010. National vital statistics reports; vol 61 no 4. Hyattsville, MD: National Center for Health Statistics. 2013.
- Arias E, Heron M, Hakes JK. The validity of race and Hispanic-origin reporting on death certificates in the United States: An update. Vital Health Stat 2(172). Hyattsville, MD: National Center for Health Statistics. 2016.
- National Cancer Institute. Joinpoint Regression Program (Version 3.4.3) [computer software]. 2010.
Suggested citation
Hedegaard H, Warner M, Miniño AM. Drug overdose deaths in the United States, 1999–2015. NCHS data brief, no 273. Hyattsville, MD: National Center for Health Statistics. 2017.
Copyright information
All material appearing in this report is in the public domain and may be reproduced or copied without permission; citation as to source, however, is appreciated.
National Center for Health Statistics
Charles J. Rothwell, M.S., M.B.A., Director
Jennifer H. Madans, Ph.D., Associate Director for Science
Office of Analysis and Epidemiology
Irma E. Arispe, Ph.D., Director
Makram Talih, Ph.D., Associate Director for Science